Embed Size (px)
Citation preview

Dr. Shamshad Akhtar, United Nations Under-Secretary-General
&
ESCAP Executive Secretary
Asia-Pacific: Sustainable Development Financing
Outreach
1
Asia-Pacific:
Landscape & State of Sustainable
Financing

• Development financing requirements
• Scope for domestic resource mobilization
• Institutional investments: leveraging through PPP
• Financial inclusion for all
• Climate finance
• External resources: ODA and private flows
• Forging Partnerships
• Conclusions
2
Outline: Asia-Pacific

Infrastructure
investment needs per
year:
$800 - $900 billion
• Energy
• Transport
• Telecommunications
• Water & Sanitation
3
<4% (red)
4–7% (dark blue)
7-10% (green)
>10% (purple)
Energy sector and climate
change mitigation investment
needs per year:
$500-$800 billion
• Adaptation of new
technology
• Renewable energy
Asia-Pacific: Development Financing Needs
Economic & Social
investment needs per year:
$500 - $800 billion
• Payment for safety nets
• Old age pension
• Income security to all
persons with disabilities
• Universal access to health
and education
• Modern energy access for
all

4
Asia-Pacific:
Key estimates of annual financing requirements

5
0.1
0.9
1
1.2
1.3
1.7
1.7
3.6
4.7
5.4
7.9
819.2
0 5 10 15 20 25
Papua New Guinea
Lao PDR
Cambodia
Indonesia
Pakistan
Fiji
India
Thailand
Viet Nam
China
Republic of Korea
Kyrgyzstan
Japan
Percentage of GDP
Social protection expenditures (% of GDP):
Case of Selected Asia-Pacific economies

• Enhancing tax-to-GDP ratios
• Rationalize and reorient public expenditures Increase non-tax revenues
• Rationalize subsidies – energy in particular
6
Energy subsidies
$51 billion
(South-East Asia, 2012)
Tax Potential 16-developing economies could raise
�$306 billion
Reorientation of Expenditures
~$500 billion (Defence, 2012)
Scope for domestic resource mobilization

Tax-to-GDP Ratios Tax Potential
7
0 10 20 30 40
Myanmar Pakistan
Bangladesh Iran, Islamic Rep.
Cambodia Bhutan
Indonesia Azerbaijan Sri Lanka Singapore Malaysia Maldives
India Armenia
China Turkey Thailand
Uzbekistan Republic of Korea
Russian Federation Mongolia Georgia
Fiji Papua New Guinea
Kazakhstan
AustraliaJapan
New Zealand
Percentage of GDP 0 2 4 6 8 10
Thailand
Nepal
Malaysia
Philippines
Pakistan
China
Azerbaijan
Cambodia
Indonesia
Maldives
Afghanistan
Bhutan
Singapore
Iran, Islamic Rep.
Bangladesh
Percentage of GDP
8
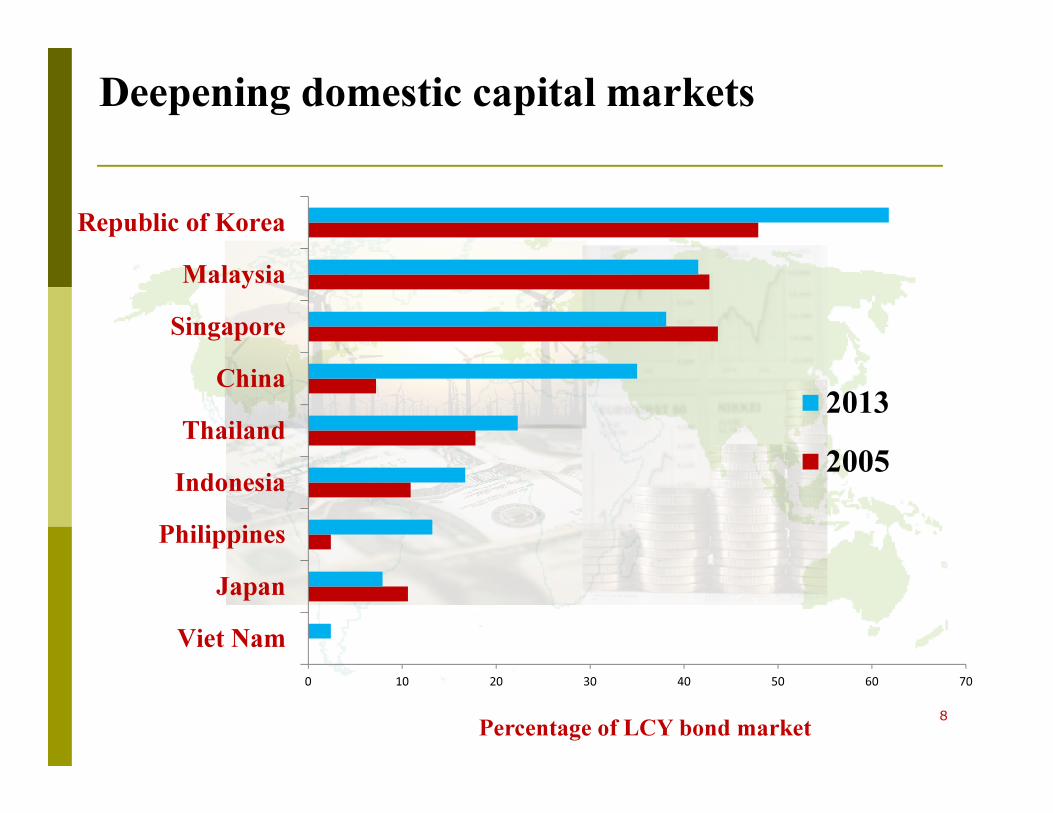
0 10 20 30 40 50 60 70
Viet Nam
Japan
Philippines
Indonesia
Thailand
China
Singapore
Malaysia
Republic of Korea
Percentage of LCY bond market
2013
2005
Deepening domestic capital markets
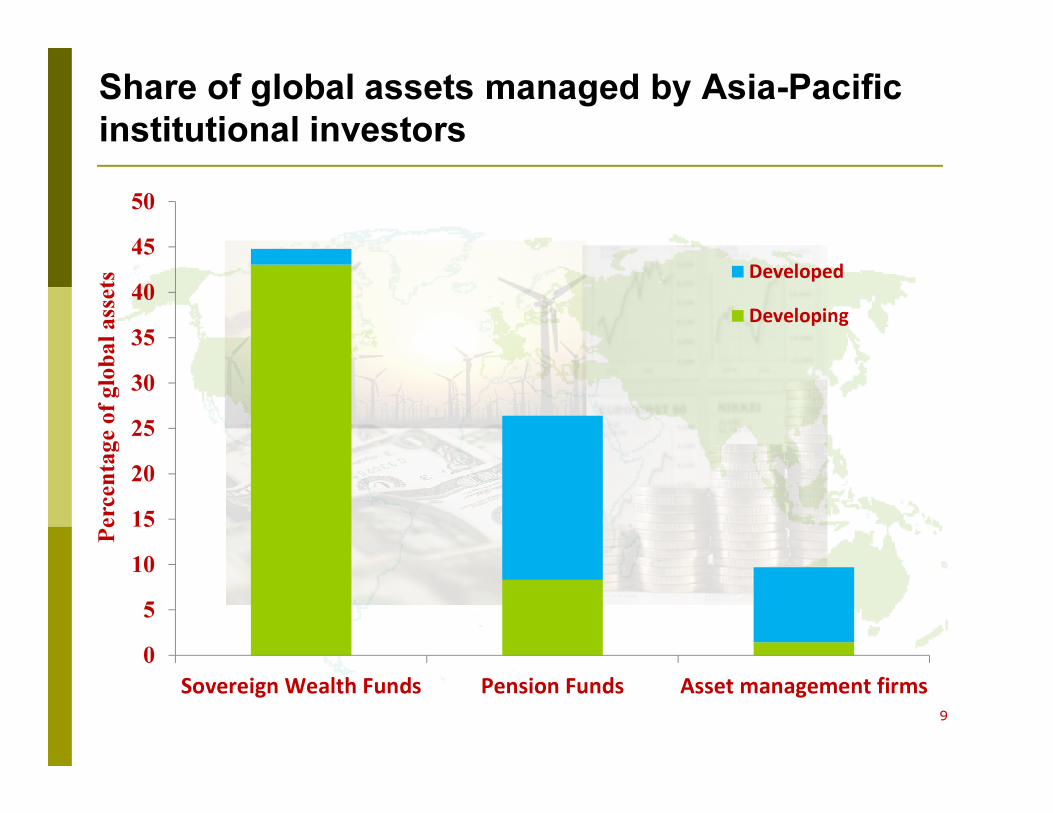
Share of global assets managed by Asia-Pacific
institutional investors
9
0
5
10
15
20
25
30
35
40
45
50
Sovereign Wealth Funds Pension Funds Asset management firms
Perc
en
tage o
f glo
bal
ass
ets
Developed
Developing

Leveraging private sector capacities:
Trends in Transport
100
10
20
30
40
50
60
70
80
90
100
0
5
10
15
20
25
30
2001 2003 2005 2007 2009 2011
Nu
mb
er o
f P
roje
cts
Bil
lio
ns
U.S
. d
oll
ars
Airports
Seaports
Railroads
Road
Number of
Projects

11
0
10
20
30
40
50
60
70
80
90
100
Pe
rce
nt
of
po
pu
lati
on
(a
ge
15
+)
Account at a formal financial institutionAccount at a formal financial institutionAccount at a formal financial institutionAccount at a formal financial institution
Loans from a financial institution in the past yearLoans from a financial institution in the past yearLoans from a financial institution in the past yearLoans from a financial institution in the past year
Inclusive finance for all
12
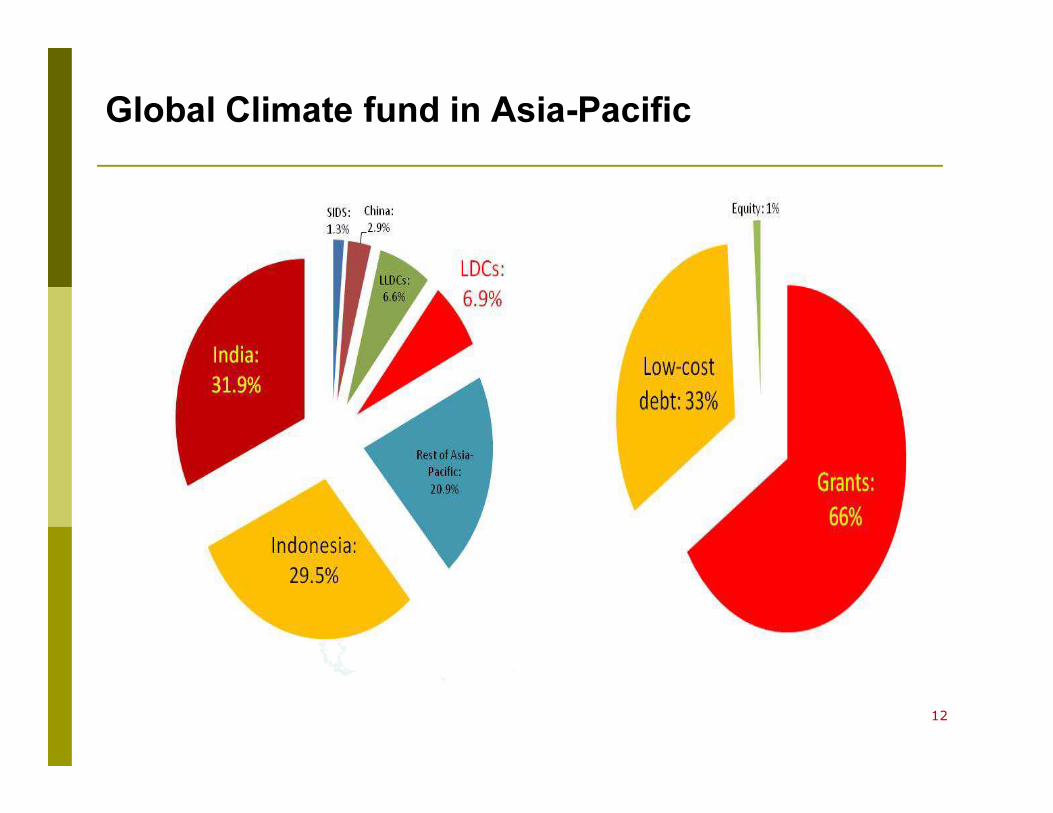
Global Climate fund in Asia-Pacific

13
30
506
260
0
100
200
300
400
500
600
Official development
assistance
Foreign direct investment
inflows
Remittances
Bil
lio
ns
of
U.S
. d
oll
ars
External sources: ODA, FDI and Remittances, 2012

14
Asia-Pacific: ODA Distribution
LDCs: 21%
LLDCs:
1%
SIDS:
8%
Rest of
Asia-
Pacific:
71%
1990
LDCs: 44%
LLDCs:
9%
SIDS:
5%
Rest of
Asia-
Pacific:
42%
2012

Asia-Pacific: FDI Inflows, 1990-2012
15

Asia-Pacific: Remittances Inflows, 1990-2013
16

Forging 21st century partnerships
Create new opportunities for South-South and triangular development cooperation
17
Year
Focus
area
2,841.4$US
million
China
2,533.3
Turkey
1,597
India
789
Republic of
Korea
465
Russian
Federation
16.9
Thailand
-AP focus
-Infrastructure
-Technical
assistance
-Middle East &
Africa
-Infrastructure
-Humanitarian aid
-AP focus
-Technical
cooperation
-MDGs
-AP focus
-60% training
-Soft loans
-Central
South Asia
-Multi-Bilateral
-Debt relief
-AP focus
-90% bilateral
-Infrastructure
2012+ 2012+ 2011*2012**2011*2012+
8.2
Indonesia
-AP focus
-Development
& Governance
issues
2011*
Conclusions
• Region has large financing requirements, but there is also scope for identifying and tapping the regional resource potential. The estimates of regional financing requirements vary depending on the source used
• Financing requirements to strengthen
• Social development are up to $800 billion per year,
• Infrastructure up to $900 billion per year, and
• Investments to modernize the region’s energy sector, including adaptation of new technologies and renewable forms of energy, could cost as much as $800 billion per year
18

Conclusions
• These annual estimates represent, however, less than 8% of the assets of the region’s mass affluent and high-net-worth individuals in 2012.
• Region’s foreign exchange reserves amounted to $7.3 trillion in 2012, and its gross national savings were $8.4 trillion, equivalent to 51% to the world gross national savings in 2012.
• Asia-Pacific region has enough savings to finance its sustainable development. The real challenge, however, is how to mobilize these savings.
19
Conclusions
• Going forward, the region should work collectively to ensure that it nurtures strong and stable financial systems.
• To achieve this, policymakers and regulators need to work with the private sector to develop more diversified and balanced financial sectors—which are key to reinforcing financial stability and sustainability,
• To extending finance to meet the people’s needs and the region’s development.
20

This calls for
• Raising tax-to-GDP ratios;
• Reorienting public spending by, inter alia, curbing regressive subsidies;
• Moving from bank-dominated to well-diversified and competitive financial systems;
• Strengthening legal, regulatory and supervisory systems that promote financial inclusion;
• Advocating and positioning PPPs, leveraged through well-designed incentive frameworks; and
• Furthering the development of regional capital markets, which have the greatest potential for raising the required resources for financing sustainable development.
• To extending finance to meet the people’s needs and the region’s development.
21

Final remarks
• Recent trends show a rapid growth of local currency bond markets in the region’s major developing countries, with the amount outstanding more than trebling in eight years, to $7.4 trillion by September 2013.
• A critical issue which remains to be addressed is how to enhance country capacities to set up and improve the functioning of capital markets institutions and regulatory frameworks, particularly in smaller and least developed countries and in the small island developing States.
22

23
Thank you
www.unescap.org
Tel: +66 2 288-1940 , Fax: +66 2 288-1051