Embed Size (px)
Citation preview

Asia Pacific Pay TV Forecasts
Table of Contents
Published in March 2017, this 194-page PDF and excel report combines two of last year’s reports: Digital TV Asia Pacific Forecasts and the Asia Pacific Pay TV Operator Forecasts in one convenient place. The report comes in five parts:
Executive summary and regional forecasts, with handy comparison tables to reveal the best growth prospects;
Major pay TV operators, including market share for each;
Regional forecasts summary from 2010 to 2022 by platform, by household penetration, by pay TV subscribers and by pay TV revenues;
Country profiles for 23 territories;
Detailed country forecasts for 22 countries, including 75 pay TV operators and 98 platforms.
For more information, please click here or contact [email protected]

Forecasts for the following 25 countries and 65 platforms:
Country Forecasts No of ops Platform forecasts
Australia * 1 Foxtel
Bangladesh * 1 RealVU
Brunei
Cambodia * 3 CDN; One TV; Supernet
China * 4 China Radio & TV; China Telecom; BesTV; China Unicom
Hong Kong * 2 i-cable; Now TV
India * 11 Hathway; Siti; In Digital; DEN; Dish TV; Tata Sky; Videocon; Airtel; Sun Direct; Reliance; MTNL
Indonesia * 10 Linknet; Transvision; Indovision; Top TV; Okevision; Orange TV; Big TV; K Vision; Telkom; NexMedia
Japan * 3 SkyPerfecTV; J:Com; NTT
Laos *
Malaysia * 2 Astro; TM
Mongolia * 2 Univision; DDish
Myanmar * 2 SkyNet; 4TV/MRTV (Forever)
Nepal * 1 Dish Media
New Zealand * 2 Sky; Vodafone
Pakistan * 1 PTCL
Philippines * 2 Sky Cable/Sky Direct; Cignal
Singapore * 2 StarHub; SingTel TV
S Korea * 9 CJ Hellovision; T Broad; D’Live; CMB; Hyundai HCN; KT Olleh; Skylife; B TV; LG U+
Sri Lanka * 2 Dialog; Peo
Taiwan * 4 Taiwan Broadband; TWM; CNS; CHT
Thailand * 2 Truevisions; TOT
Vietnam * 9 SCTV; VTVCab; HTV-CMS; VNPT; Viettel; FPT; K+; AVG satellite; AVG DTT

SAMPLE: Indonesia pay TV briefing
After years of sluggish growth, Indonesian multichannel TV is finally taking off. Digital TV penetration was 33% (13.29 million) in end-2016, with 100% (47.27 million) expected by 2022. DTT will account for 32 million of the 2022 total, up from 4 million at end-2016.
Pay TV penetration reached only 18.0% (7.25 million) of TV households by end-2016. This proportion will climb slowly to 26.7% (12.62 million) by 2022. The number of pay satellite TV homes will rise from 4.43 million in 2016 to 5.96 million in 2022. However, the number of paying IPTV homes will overtake pay satellite subs in 2017.
Main assumptions behind the forecasts Pay TV penetration will remain low.
Too many pay TV operators are chasing too few subscribers.
There are many satellite TV operators in Indonesia. Not all of them will survive, with several already folding.
The flurry of satellite TV activity now will be replaced by a flurry of IPTV activity.
Substantial investment in broadband networks will result in more bundle offers.
Intense competition is forcing down ARPUs.
Freeviewsat began operations in January 2017.
Analog terrestrial switch-off is scheduled for 2018, but we do not expect it to happen until 2022.
Above average GDP growth is forecast; lower than the last edition.
Population growth forecasts are also above the regional average.
Source: Digital TV Research
Pay TV revenues will surge from $783 million in 2016 to $1,313 million in 2022. Satellite TV will dominate; amassing $665 in 2022. However, IPTV will triple to $395 million between 2016 and 2022.
Despite its huge potential, Indonesian pay TV will remain underdeveloped during the forecast period. Pay TV penetration is low, partly due to the multitude of FTA terrestrial channels on offer and partly due to the low disposable income for most homes.
Piracy remains a major problem, with 2-3 million homes receiving illegal signals from as many as 2,500 operators (charging as little as a tenth of the average fee from the legitimate operators). MNC claimed 4 million homes receiving pirate signals by end-2014.
MNC Skyvision (also known as MSky and trading as Indovision, Okevision and Top TV) had 2.43 million satellite TV subs by end-2015; down by 3.8% year-on-year. We forecast a total of 3.48 million subscribers by 2022.

MNC Skyvision subscriber growth (000) ARPU IDR Total Indovision Top TV Okevision
2010 143,845 804 631 173 0
2011 125,430 1,163 752 335 76
2012 123,203 1,720 933 583 204
2013 114,259 2,300 1,175 774 351
2014 101,247 2,529 1,289 838 402
2015 102,946 2,433 1,139 881 412
Source: MNC Skyvision
MNC Skyvision raised IDR2.15 billion ($160 million) via an IPO in July 2012, which involved the sale of 20% of its equity. Global Mediacom controls 79.52% of Sky Vision Network (the holding company for its pay TV, digital and broadband assets) and also owns several major FTA broadcasters such as RCTI, MNC and Global TV. MNC Kabel Mediakom is a fledgling FTTH network.
Transvision (formerly called TelkomVision and formerly trading as Yes TV) had about 879,000 satellite TV (mainly pre-paid) and cable TV subscribers at end-2014. We estimate just over 1 million subscribers across all platforms by end-2016, rising to 1.48 million by 2022.
In June 2013, CT Corp, owned by billionaire Chairul Tanjung and through its Transmedia subsidiary, acquired an 80% stake in TelkomVision from Telkom.
The Diamond pack costs IDR399,000/month ($29.79) for 111 channels, with the 73-channel Gold pack at IDR199,000 ($14.86) and 106-channel Platinum for IDR299,000/month ($22.33).
In October 2011, Mega Media (controlled by the Sinar Mas Group) launched the Orange TV satellite platform, with up to 75 channels (IDR150,000-238,000/month). Using Irdeto conditional access, Orange offers both prepaid and postpaid subscriptions. The company targets middle to lower income subscribers. Orange launched an OTT mobile service in late 2013. We forecast 476,000 subscribers by 2022.
IMTV started its satellite TV operation, BigTV, in September 2013 – aiming to attract the growing middle class with 69-104 channels (including 36 HD) for INR120,000-500,000/month ($8.96-37.33). IMTV, Indonesia Media Televisi, is a subsidiary of the Lippo Group, which also owns First Media. We expect 268,000 subscribers by 2022.
There are 20 licensed satellite TV operators. Aora Satellite TV and Skynindo
are among the smaller satellite platforms. Launched in December 2010, Aora
Satellite TV went bust in late 2015, followed by Viva Plus. Owned by Kompas
Gramedia Group, K-Vision launched a prepaid platform in March 2014.
Premium channels beIN Sports hold the European Champions League soccer rights from 2015/16 to 2017/18 as well as action from Europe’s top domestic leagues from England, France, Italy and Spain. beIN Sports is carried by Orange, Nexvision, Indovision, K-Vision, Usee and Transvision.
Philippines-based ABS and Sarana Media Vision launched a 50-channel FTA satellite TV platform called FreeViewSat in early 2017. SMV holds a satellite TV license.
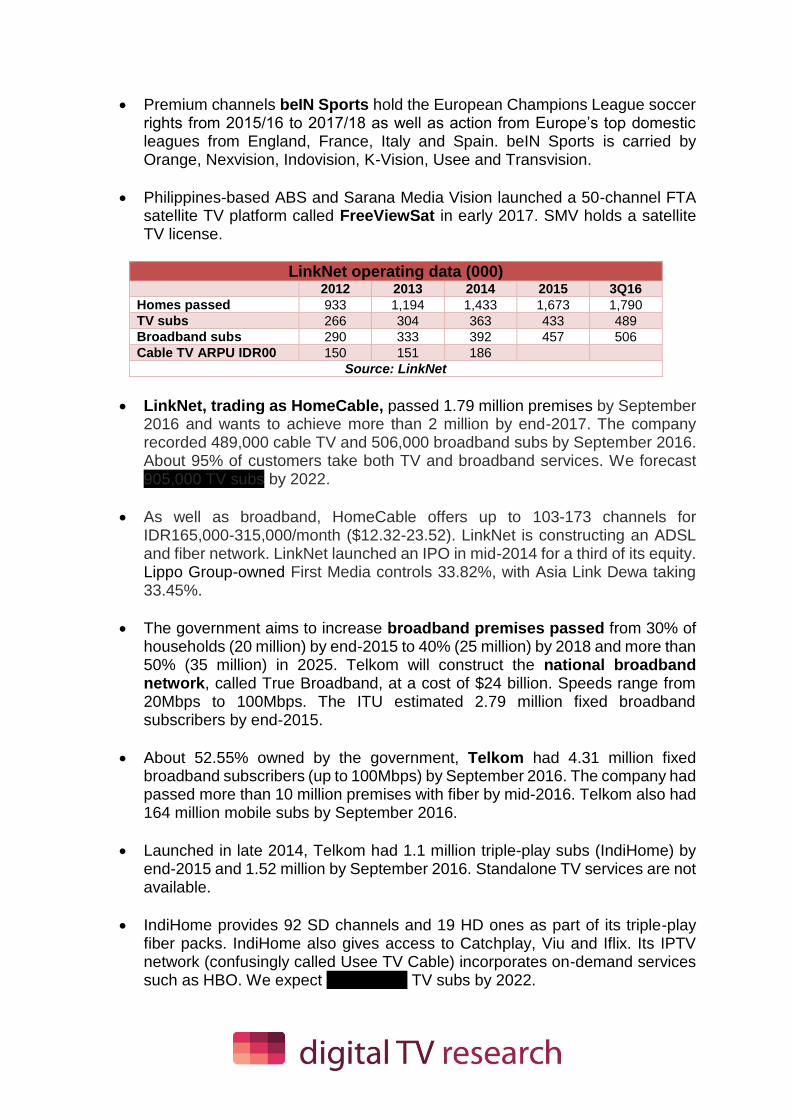
LinkNet operating data (000) 2012 2013 2014 2015 3Q16
Homes passed 933 1,194 1,433 1,673 1,790
TV subs 266 304 363 433 489
Broadband subs 290 333 392 457 506
Cable TV ARPU IDR00 150 151 186
Source: LinkNet
LinkNet, trading as HomeCable, passed 1.79 million premises by September 2016 and wants to achieve more than 2 million by end-2017. The company recorded 489,000 cable TV and 506,000 broadband subs by September 2016. About 95% of customers take both TV and broadband services. We forecast 905,000 TV subs by 2022.
As well as broadband, HomeCable offers up to 103-173 channels for IDR165,000-315,000/month ($12.32-23.52). LinkNet is constructing an ADSL and fiber network. LinkNet launched an IPO in mid-2014 for a third of its equity. Lippo Group-owned First Media controls 33.82%, with Asia Link Dewa taking 33.45%.
The government aims to increase broadband premises passed from 30% of households (20 million) by end-2015 to 40% (25 million) by 2018 and more than 50% (35 million) in 2025. Telkom will construct the national broadband network, called True Broadband, at a cost of $24 billion. Speeds range from 20Mbps to 100Mbps. The ITU estimated 2.79 million fixed broadband subscribers by end-2015.
About 52.55% owned by the government, Telkom had 4.31 million fixed broadband subscribers (up to 100Mbps) by September 2016. The company had passed more than 10 million premises with fiber by mid-2016. Telkom also had 164 million mobile subs by September 2016.
Launched in late 2014, Telkom had 1.1 million triple-play subs (IndiHome) by end-2015 and 1.52 million by September 2016. Standalone TV services are not available.
IndiHome provides 92 SD channels and 19 HD ones as part of its triple-play fiber packs. IndiHome also gives access to Catchplay, Viu and Iflix. Its IPTV network (confusingly called Usee TV Cable) incorporates on-demand services such as HBO. We expect 3.58 million TV subs by 2022.

National analog terrestrial switch-off is scheduled for early 2018, although only DVB-T trials have taken place so far and we do not believe that this target will be met – in fact we do not believe that this will happen until 2022. The Ministry of Communications and Information announced the adoption of the DVB-T2 standard in February 2012. The government has allocated IDR300 billion for 1 million settop boxes, which will be distributed to poorer households.
Sister company of MNC Skyvision, Media Nusantara Citra is constructing a DTT network. Running the MNCTV, RCTI, iNewsTV and Global TV terrestrial FTA channels, MNC also operates 23 pay TV channels. Viva Group, owner of the tvOne and ANTV channels, also holds a DTT multiplex license (covering Java).
Launched in November 2011, Nexmedia, a division of the Emtek Group which also runs FTA channels SCTV and IVM/Indosiar, began as a pay DTT operator (DVB-T2) in the Greater Jakarta area, with expansion soon after to east Java. Nexmedia (also known as Mediatama Anugrah Citra) had 124,000 subscribers by end-2014, up from 80,000 at end-2013 and 43,000 a year earlier. We forecast 520,000 subs by 2022.
The basic NexFamily package costs IDR99,000/month ($7.39) for 26 channels, with the 18-channel NexSports at the same price. NexSports and NexFamily together cost IDR170,000/month ($12.69) for 32 channels. Nexmedia also carries beIN Sports.
The International Monetary Fund forecasts that Indonesia’s Gross Domestic Product will grow above the regional average for the next five years. GDP per capita was $3,636 in 2016. Indonesia’s population was 259 million in 2016.
Joko Widodo was elected as president in July 2014 in a closely fought election. Widodo, known as Jokowi, is not part of the dynasty that has ruled Indonesia since independence. Appealing to ordinary Indonesians, he aims to deal with the widespread corruption.
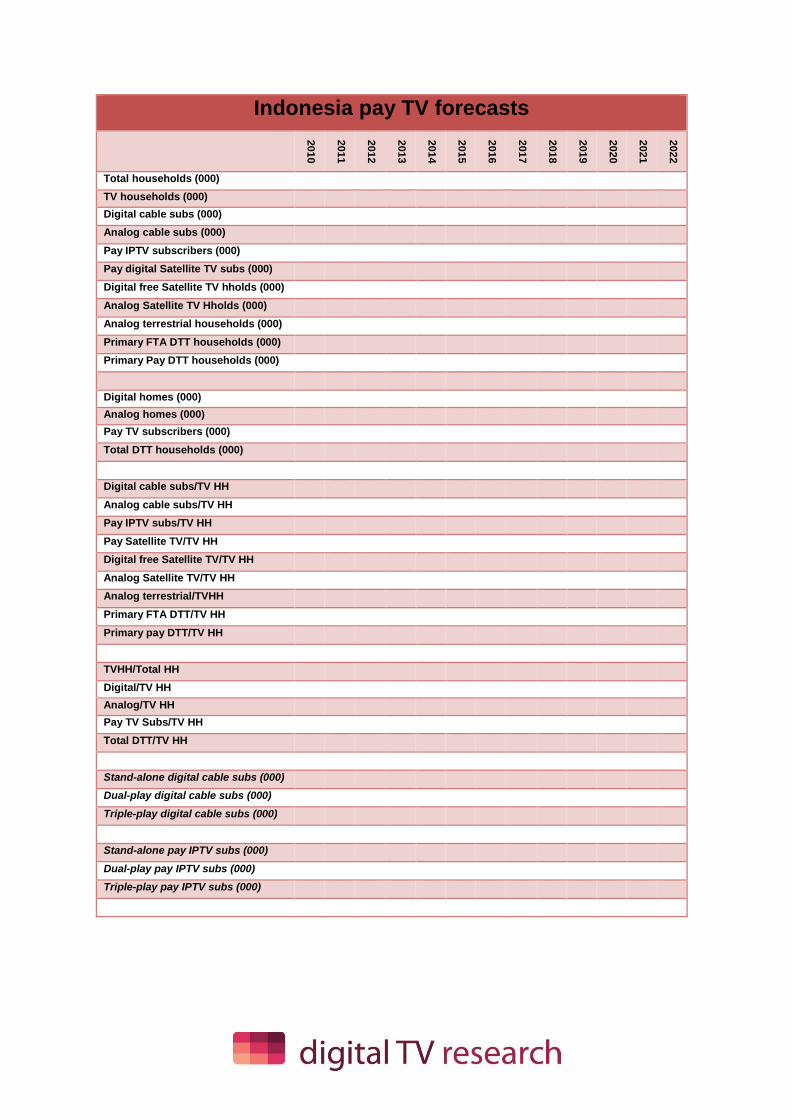
Indonesia pay TV forecasts
2010
2011
2012
2013
2014
2015
2016
2017
2018
2019
2020
2021
2022
Total households (000)
TV households (000)
Digital cable subs (000)
Analog cable subs (000)
Pay IPTV subscribers (000)
Pay digital Satellite TV subs (000)
Digital free Satellite TV hholds (000)
Analog Satellite TV Hholds (000)
Analog terrestrial households (000)
Primary FTA DTT households (000)
Primary Pay DTT households (000)
Digital homes (000)
Analog homes (000)
Pay TV subscribers (000)
Total DTT households (000)
Digital cable subs/TV HH
Analog cable subs/TV HH
Pay IPTV subs/TV HH
Pay Satellite TV/TV HH
Digital free Satellite TV/TV HH
Analog Satellite TV/TV HH
Analog terrestrial/TVHH
Primary FTA DTT/TV HH
Primary pay DTT/TV HH
TVHH/Total HH
Digital/TV HH
Analog/TV HH
Pay TV Subs/TV HH
Total DTT/TV HH
Stand-alone digital cable subs (000)
Dual-play digital cable subs (000)
Triple-play digital cable subs (000)
Stand-alone pay IPTV subs (000)
Dual-play pay IPTV subs (000)
Triple-play pay IPTV subs (000)

Indonesia pay TV forecasts
2010
2011
2012
2013
2014
2015
2016
2017
2018
2019
2020
2021
2022
Revenues (US$ million)
Stand-alone digital cable revs
Dual-play digital cable TV revenues
Triple-play digital cable TV revs
Digital cable TV subs revenues
Digital cable TV on-demand revs
Digital cable TV revenues
Analog cable TV subs revs
Cable TV revenues
Stand-alone IPTV revenues
Dual-play IPTV revenues
Triple-play IPTV revenues
IPTV subscription revenues
IPTV on-demand revenues
IPTV revenues
Satellite TV subscription revenues
Satellite TV on-demand revenues
Satellite TV revenues
DTT subscription revs
DTT on-demand revenues
DTT revenues
Subscription revenues
On-demand revenues
Total revenues
Average Revenue Per User (ARPU - US$)
Stand-alone digital cable subs
Dual-play digital cable TV subs
Triple-play digital cable TV subs
Average digital cable (subs & VOD)
Analog cable TV subs
Stand-alone IPTV subs
Dual-play IPTV subs
Triple-play IPTV subs
Average IPTV (subs and VOD)
Pay Satellite TV (subs)
Pay Satellite TV (subs and PPV)
Pay DTT (subs)
Pay DTT (subs and PPV)
Average monthly ARPU
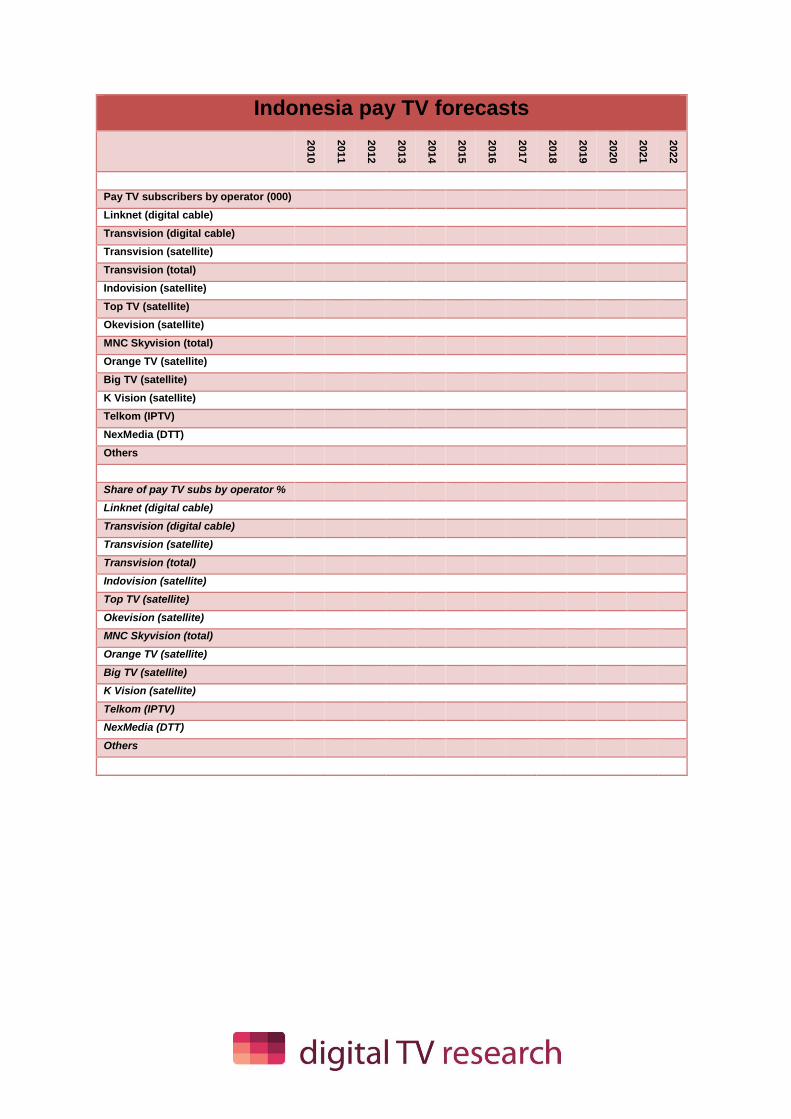
Indonesia pay TV forecasts
2010
2011
2012
2013
2014
2015
2016
2017
2018
2019
2020
2021
2022
Pay TV subscribers by operator (000)
Linknet (digital cable)
Transvision (digital cable)
Transvision (satellite)
Transvision (total)
Indovision (satellite)
Top TV (satellite)
Okevision (satellite)
MNC Skyvision (total)
Orange TV (satellite)
Big TV (satellite)
K Vision (satellite)
Telkom (IPTV)
NexMedia (DTT)
Others
Share of pay TV subs by operator %
Linknet (digital cable)
Transvision (digital cable)
Transvision (satellite)
Transvision (total)
Indovision (satellite)
Top TV (satellite)
Okevision (satellite)
MNC Skyvision (total)
Orange TV (satellite)
Big TV (satellite)
K Vision (satellite)
Telkom (IPTV)
NexMedia (DTT)
Others
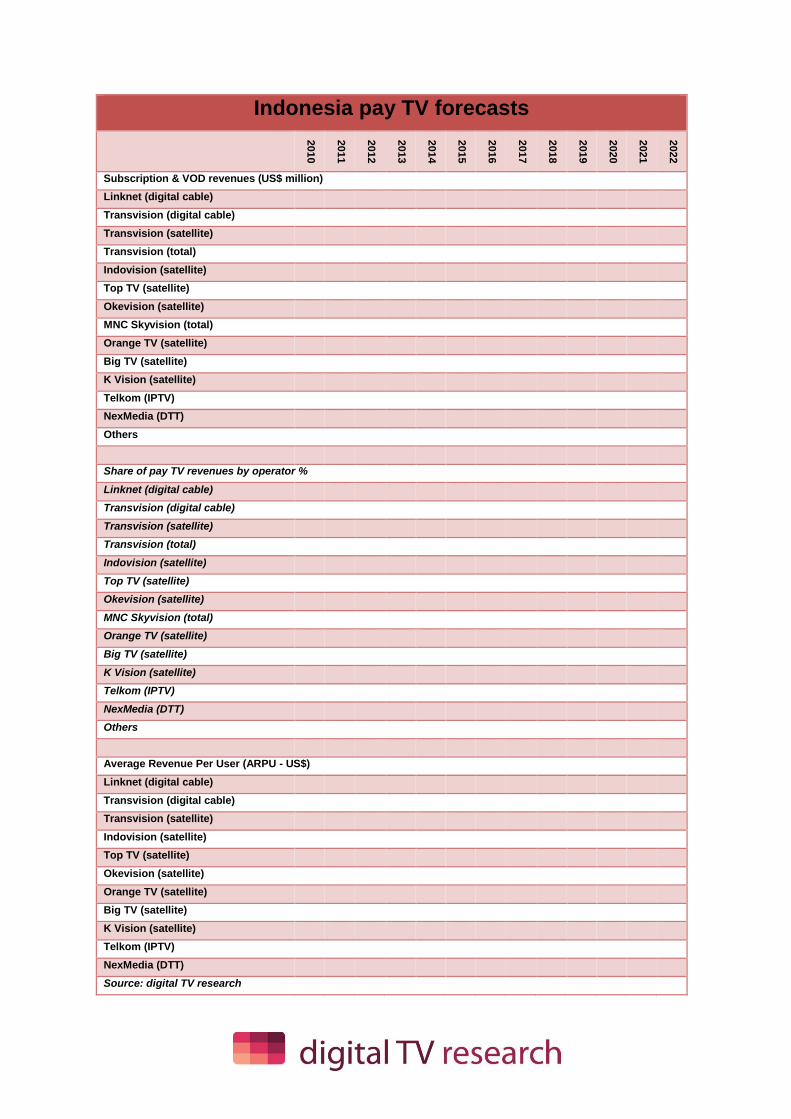
Indonesia pay TV forecasts
2010
2011
2012
2013
2014
2015
2016
2017
2018
2019
2020
2021
2022
Subscription & VOD revenues (US$ million)
Linknet (digital cable)
Transvision (digital cable)
Transvision (satellite)
Transvision (total)
Indovision (satellite)
Top TV (satellite)
Okevision (satellite)
MNC Skyvision (total)
Orange TV (satellite)
Big TV (satellite)
K Vision (satellite)
Telkom (IPTV)
NexMedia (DTT)
Others
Share of pay TV revenues by operator %
Linknet (digital cable)
Transvision (digital cable)
Transvision (satellite)
Transvision (total)
Indovision (satellite)
Top TV (satellite)
Okevision (satellite)
MNC Skyvision (total)
Orange TV (satellite)
Big TV (satellite)
K Vision (satellite)
Telkom (IPTV)
NexMedia (DTT)
Others
Average Revenue Per User (ARPU - US$)
Linknet (digital cable)
Transvision (digital cable)
Transvision (satellite)
Indovision (satellite)
Top TV (satellite)
Okevision (satellite)
Orange TV (satellite)
Big TV (satellite)
K Vision (satellite)
Telkom (IPTV)
NexMedia (DTT)
Source: digital TV research
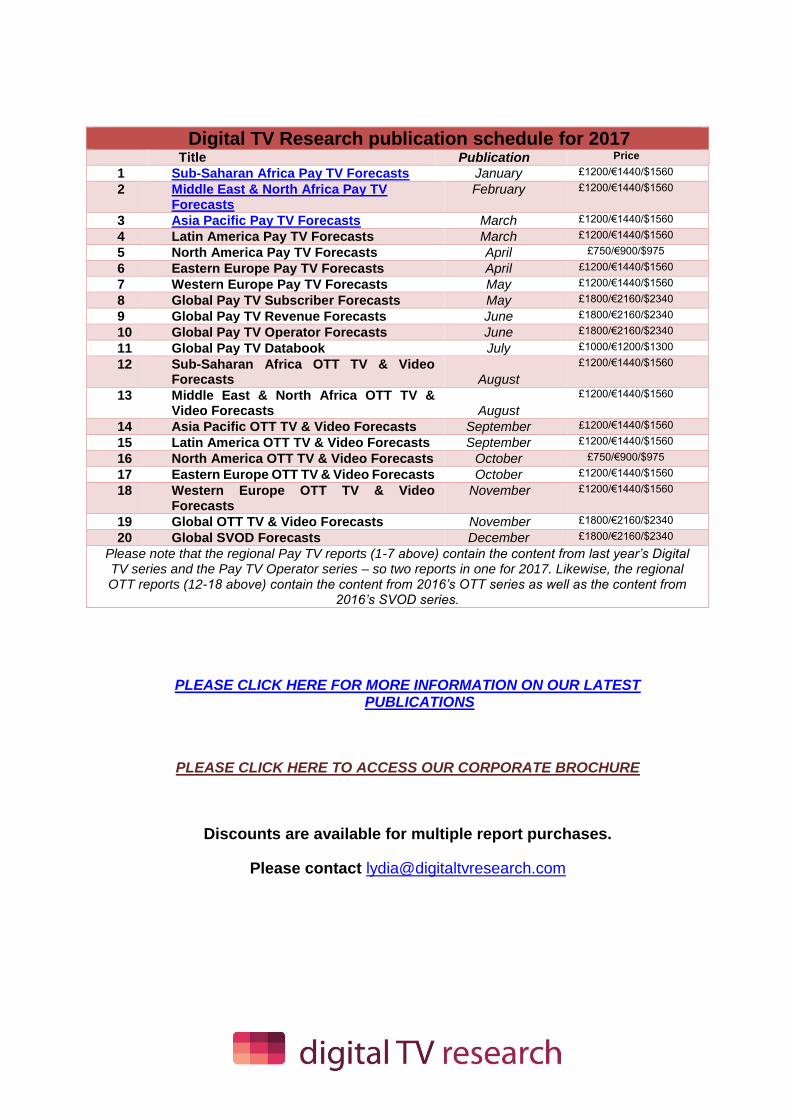
Digital TV Research publication schedule for 2017 Title Publication Price
1 Sub-Saharan Africa Pay TV Forecasts January £1200/€1440/$1560
2 Middle East & North Africa Pay TV Forecasts
February £1200/€1440/$1560
3 Asia Pacific Pay TV Forecasts March £1200/€1440/$1560
4 Latin America Pay TV Forecasts March £1200/€1440/$1560
5 North America Pay TV Forecasts April £750/€900/$975
6 Eastern Europe Pay TV Forecasts April £1200/€1440/$1560
7 Western Europe Pay TV Forecasts May £1200/€1440/$1560
8 Global Pay TV Subscriber Forecasts May £1800/€2160/$2340
9 Global Pay TV Revenue Forecasts June £1800/€2160/$2340
10 Global Pay TV Operator Forecasts June £1800/€2160/$2340
11 Global Pay TV Databook July £1000/€1200/$1300
12 Sub-Saharan Africa OTT TV & Video Forecasts August
£1200/€1440/$1560
13 Middle East & North Africa OTT TV & Video Forecasts August
£1200/€1440/$1560
14 Asia Pacific OTT TV & Video Forecasts September £1200/€1440/$1560
15 Latin America OTT TV & Video Forecasts September £1200/€1440/$1560
16 North America OTT TV & Video Forecasts October £750/€900/$975
17 Eastern Europe OTT TV & Video Forecasts October £1200/€1440/$1560
18 Western Europe OTT TV & Video Forecasts
November £1200/€1440/$1560
19 Global OTT TV & Video Forecasts November £1800/€2160/$2340
20 Global SVOD Forecasts December £1800/€2160/$2340
Please note that the regional Pay TV reports (1-7 above) contain the content from last year’s Digital TV series and the Pay TV Operator series – so two reports in one for 2017. Likewise, the regional OTT reports (12-18 above) contain the content from 2016’s OTT series as well as the content from
2016’s SVOD series.
PLEASE CLICK HERE FOR MORE INFORMATION ON OUR LATEST PUBLICATIONS
PLEASE CLICK HERE TO ACCESS OUR CORPORATE BROCHURE
Discounts are available for multiple report purchases.
Please contact [email protected]
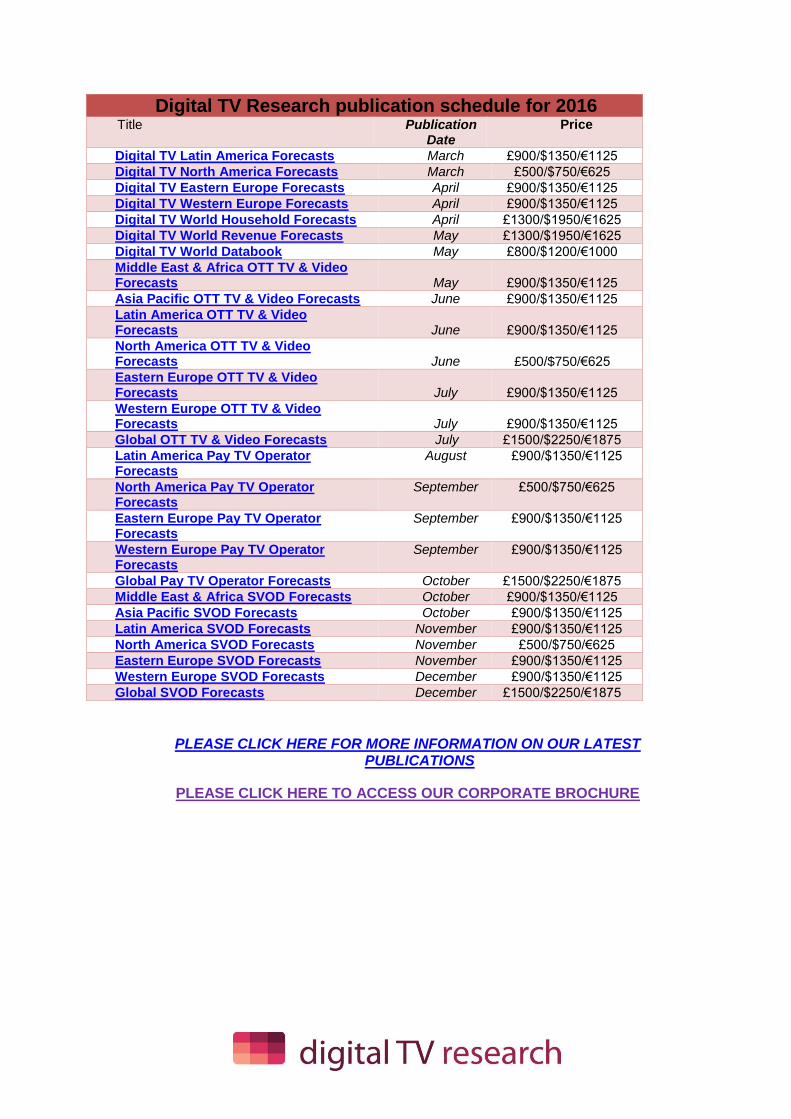
Digital TV Research publication schedule for 2016 Title Publication
Date Price
Digital TV Latin America Forecasts March £900/$1350/€1125
Digital TV North America Forecasts March £500/$750/€625
Digital TV Eastern Europe Forecasts April £900/$1350/€1125
Digital TV Western Europe Forecasts April £900/$1350/€1125
Digital TV World Household Forecasts April £1300/$1950/€1625 Digital TV World Revenue Forecasts May £1300/$1950/€1625 Digital TV World Databook May £800/$1200/€1000
Middle East & Africa OTT TV & Video Forecasts May £900/$1350/€1125 Asia Pacific OTT TV & Video Forecasts June £900/$1350/€1125 Latin America OTT TV & Video Forecasts June £900/$1350/€1125 North America OTT TV & Video Forecasts June £500/$750/€625 Eastern Europe OTT TV & Video Forecasts July £900/$1350/€1125 Western Europe OTT TV & Video Forecasts July £900/$1350/€1125 Global OTT TV & Video Forecasts July £1500/$2250/€1875 Latin America Pay TV Operator Forecasts
August £900/$1350/€1125
North America Pay TV Operator Forecasts
September £500/$750/€625
Eastern Europe Pay TV Operator Forecasts
September £900/$1350/€1125
Western Europe Pay TV Operator Forecasts
September £900/$1350/€1125
Global Pay TV Operator Forecasts October £1500/$2250/€1875
Middle East & Africa SVOD Forecasts October £900/$1350/€1125
Asia Pacific SVOD Forecasts October £900/$1350/€1125 Latin America SVOD Forecasts November £900/$1350/€1125 North America SVOD Forecasts November £500/$750/€625
Eastern Europe SVOD Forecasts November £900/$1350/€1125 Western Europe SVOD Forecasts December £900/$1350/€1125 Global SVOD Forecasts December £1500/$2250/€1875
PLEASE CLICK HERE FOR MORE INFORMATION ON OUR LATEST PUBLICATIONS
PLEASE CLICK HERE TO ACCESS OUR CORPORATE BROCHURE


