Embed Size (px)
Citation preview

ASI Global Absolute Return Strategies FundAnnual Long ReportFor the year ended 31 March 2021

02 ASI Global Absolute Return Strategies Fund
Report of the Manager 03Statement of Manager’s Responsibilities 05Manager’s Statement 05Statement of the Trustee’s Responsibilities in Respect of the Scheme and Report of the Trustee 06Independent Auditor’s Report 07Investment Report 10Comparative Tables 14Portfolio Statement 23Statement of Total Return 55Statement of Change in Net Assets Attributable to Unitholders 55Balance Sheet 56Notes to the Financial Statements 57Securities Financing Transactions Disclosure (unaudited) 76Remuneration (unaudited) 77Further Information 80
Contents

03ASI Global Absolute Return Strategies Fund
Report of the Manager
ASI Global Absolute Return Strategies Fund (the “fund”) is an authorised unit trust scheme under the Financial Services and Markets Act 2000. The effective date of the authorisation order made by the Financial Services Authority (the “FCA”) was 29 November 2007.
The fund was established by Trust Deed entered into on 26 and 28 November 2007 and is an authorised unit trust scheme which falls into the category of UCITS scheme. Its FCA Product Reference Number (“PRN”) is 473870.
AppointmentsManagerAberdeen Standard Fund Managers Limited
Registered office Correspondence addressBow Bells House PO Box 122331 Bread Street ChelmsfordLondon EssexEC4M 9HH CM99 2EE
Investment AdviserStandard Life Investments Limited
Registered office1 George StreetEdinburghEH2 2LL
TrusteeCitibank Europe plc
Registered office Correspondence address1 North Wall Quay UK Branch Office Dublin Citigroup CentreIreland Canada Square Canary Wharf London E14 5LB
RegistrarSS&C Financial Services Europe Limited SS&C House St Nicholas Lane Essex SS15 5FS
Independent auditorKPMG LLP St Vincent Plaza 319 St Vincent Street Glasgow G2 5AS

04 ASI Global Absolute Return Strategies Fund
Significant EventInvestors will be aware of the COVID-19 outbreak and that the outlook for many capital markets has been volatile since March 2021, the year-end of ASI Global Absolute Return Strategies Fund. Whilst the impact of COVID-19 was reflected in fund operations and global markets at year end, the continued efforts to mitigate the pandemic through global lockdowns and government interventions have resulted in prolonged market uncertainty. As a result, the NAV of the fund has fluctuated since the year-end. The subsequent events note within the fund financial statements provides a quantification of this fluctuation in NAV.
The Management Company has delegated various tasks to Aberdeen Standard Investments Investor Protection Committee (IPC). The IPC is responsible for ensuring the fair treatment of investors. The IPC undertakes daily reviews of the following:
• Market liquidity across each asset class and fund
• Asset class bid-offer spread monitoring
• Review of fund level dilution rate appropriateness
• Review of daily subscriptions/redemptions to anticipate any potential concerns to meet redemption proceeds
• Any requirement to gate or defer redemptions
• Any requirement to suspend a fund(s)
• Any fair value price adjustments at a fund level
The Management Company has also evaluated, and will continue to evaluate, the operational resilience of all service providers. As at 26 July 2021, ASI Global Absolute Return Strategies Fund has not been suspended and based on the Manager’s assessment of the factors noted above, has adequate financial resources to continue in operation.
Developments and Prospectus updates since 1 April 2020• On 31 March 2020 the Transfer Agent of the fund changed it’s name from DST Financial Services Europe Limited to SS&C Financial
Services Europe Limited and updated it’s mailing address as a result of this. There was no impact to the fund as a result of this change;
• On 3 February 2021 the prospectus was updated in relation to the wording and contact details of the complaints information, to recognise the UK leaving the European Union, additional wording within the Derivative Risks section to provide further clarity and a refresh of the taxation sections of the prospectus;
• The list of funds managed by the ACD was updated, where appropriate;
• On 31 May 2021, Gary Marshall resigned as a director of Aberdeen Standard Fund Managers Limited;
• On 31 May 2021, Alison Donaldson resigned as a director of Aberdeen Standard Fund Managers Limited;
• On 31 May 2021, Robert McKillop was appointed as a director of Aberdeen Standard Fund Managers Limited;
• On 31 May 2021, Claire Marshall was appointed as a director of Aberdeen Standard Fund Managers Limited;
• Performance and dilution figures were refreshed, where appropriate;
• The list of sub-custodians was refreshed, where appropriate;
• The list of eligible markets was refreshed, where appropriate.
Assessment of valueIn 2017 the Financial Conduct Authority (FCA) published the final Asset Management Market Study. This introduced (among other reforms) new governance rules with the aim of enhancing duty of care and ensuring the industry acts in investors’ best interests. The rules were outlined in the FCA policy statement PS18/8 and came into effect from 30 September 2019. As a result, Aberdeen Standard Fund Managers Limited is required to perform a detailed assessment on whether our funds are “providing value to investors”. The resulting findings will be published within 4 months of the fund year end date and can be found on the ‘Fund Centre’ pages of our website.

05ASI Global Absolute Return Strategies Fund
Manager’s Statement
In accordance with the requirements of the COLL sourcebook as issued and amended by the Financial Conduct Authority, we hereby certify the report on behalf of Aberdeen Standard Fund Managers Limited, the Manager.
Aron MitchellAberdeen Standard Fund Managers Limited26 July 2021
Claire MarshallAberdeen Standard Fund Managers Limited26 July 2021
Statement of Manager’s Responsibilities
The Collective Investment Schemes sourcebook published by the FCA, (“the COLL Rules”) require the Manager to prepare financial statements for each annual accounting period which give a true and fair view of the financial position of the fund and of the net revenue and net capital gains or losses on the property of the fund for the period.
In preparing the financial statements the Manager is responsible for:
• selecting suitable accounting policies and then applying them consistently;
• making judgements and estimates that are reasonable and prudent;
• following UK accounting standards, including FRS 102 The Financial Reporting Standard applicable in the UK and Republic of Ireland;
• complying with the disclosure requirements of the Statement of Recommended Practice for UK Authorised Funds issued by the Investment Association in May 2014;
• keeping proper accounting records which enable it to demonstrate that the financial statements as prepared comply with the above requirements;
• assessing the fund’s ability to continue as a going concern, disclosing, as applicable, matters related to going concern;
• using the going concern basis of accounting unless they either intend to liquidate the fund or to cease operations, or have no realistic alternative but to do so;
• such internal control as they determine is necessary to enable the preparation of financial statements that are free from material misstatement, whether due to fraud or error; and
• taking reasonable steps for the prevention and detection of fraud and irregularities.
The Manager is responsible for the management of the fund in accordance with its Trust Deed, the Prospectus and the COLL Rules.

06 ASI Global Absolute Return Strategies Fund
Statement of the Trustee’s Responsibilities in Respect of theScheme and Report of the Trustee to the Unitholders of ASI Global Absolute Return Strategies FundThe Trustee is responsible for the safekeeping of all property of the fund which is entrusted to it and ensuring proper registration of tangible moveable property, and for the collection of income arising from all such scheme property.
It is the duty of the Trustee to take reasonable care to ensure that the fund is managed and operates in accordance with the Financial Conduct Authority’s Collective Investment Schemes Sourcebook (“the Sourcebook”), the Financial Services and Markets Act 2000, as amended, and the Trust Deed and the Prospectus of the fund, concerning: the pricing of and dealing in fund Units; the application of income of the scheme; and the fund investment portfolio and borrowing activities.
Having carried out procedures and enquiries considered duly necessary to discharge our responsibilities as Trustee of the scheme, based on information and explanations provided to us, we believe that, in all material respects, the Manager:
(i) has carried out the issue, sale, redemption and cancellation, and calculation of the price of the scheme’s units and the application of the scheme’s income in accordance with the Sourcebook, the Trust Deed and Prospectus;
(ii) has, observed the investment and borrowing powers and restrictions applicable to the scheme; and
(iii) has, otherwise, ensured the proper operation of the fund.
Citibank Europe plcUK Branch, London.26 July 2021

07ASI Global Absolute Return Strategies Fund
Independent Auditor’s Report to the Unitholders of ASI Global Absolute Return Strategies Fund (‘the fund’)
OpinionWe have audited the financial statements of the fund for the year ended 31 March 2021 which comprise the Statement of Total Return, the Statement of Change in Net Assets Attributable to Unitholders, the Balance Sheet, the Related Notes and Distribution Tables for the fund and the accounting policies set out on pages 57 to 59.
In our opinion the financial statements:
• give a true and fair view, in accordance with UK accounting standards, including FRS 102 The Financial Reporting Standard applicable in the UK and Republic of Ireland, of the financial position of the fund as at 31 March 2021 and of the net revenue and the net capital gains on the property of the fund for the year then ended; and
• have been properly prepared in accordance with the fund Deed, the Statement of Recommended Practice relating to Authorised Funds, and the COLL Rules.
Basis for opinionWe conducted our audit in accordance with International Standards on Auditing (UK) (“ISAs (UK)”) and applicable law. Our responsibilities are described below. We have fulfilled our ethical responsibilities under, and are independent of the fund in accordance with, UK ethical requirements including the FRC Ethical Standard.
We have received all the information and explanations which we consider necessary for the purposes of our audit and we believe that the audit evidence we have obtained is a sufficient and appropriate basis for our opinion.
Going concernThe Manager has prepared the financial statements on the going concern basis as they do not intend to liquidate the fund or to cease their operations, and as they have concluded that the fund’s financial position means that this is realistic. They have also concluded that there are no material uncertainties that could have cast significant doubt over their ability to continue as a going concern for at least a year from the date of approval of the financial statements (“the going concern period”).
In our evaluation of the Manager’s conclusions, we considered the inherent risks to the fund’s business model and analysed how those risks might affect the fund’s financial resources or ability to continue operations over the going concern period. Our conclusions based on this work:
• we consider that the Manager’s use of the going concern basis of accounting in the preparation of the financial statements is appropriate;
• we have not identified, and concur with the Manager’s assessment that there is not, a material uncertainty related to events or conditions that, individually or collectively, may cast significant doubt on the fund’s ability to continue as a going concern for the going concern period. However, as we cannot predict all future events or conditions and as subsequent events may result in outcomes that are inconsistent with judgements that were reasonable at the time they were made, the above conclusions are not a guarantee that the fund will continue in operation.
Fraud and breaches of laws and regulations – ability to detectIdentifying and responding to risks of material misstatement due to fraudTo identify risks of material misstatement due to fraud (“fraud risks”) we assessed events or conditions that could indicate an incentive or pressure to commit fraud or provide an opportunity to commit fraud. Our risk assessment procedures included:
• Enquiring of directors as to the fund’s high-level policies and procedures to prevent and detect fraud, as well as whether they have knowledge of any actual, suspected or alleged fraud;
• Assessing the segregation of duties in place between the Manager, the Trustee, the Administrator and the investment adviser;
• Reading board minutes.
As required by auditing standards, we perform procedures to address the risk of management override of controls, in particular the risk that management may be in a position to make inappropriate accounting entries. On this audit we do not believe there is a fraud risk related to revenue recognition because the revenue is principally non-judgemental and based on publicly available information, with limited opportunity for manipulation. We did not identify any additional fraud risks.

08 ASI Global Absolute Return Strategies Fund
We evaluated the design and implementation of the controls over journal entries and other adjustments and made inquiries of the Administrator about inappropriate or unusual activity relating to the processing of journal entries and other adjustments. We substantively tested all material post-closing entries and, based on ASI Global Absolute Return Strategies Fund the results of our risk assessment procedures and understanding of the process, including the segregation of duties between the Manager and the Administrator, no further high-risk journal entries or other adjustments were identified.
Identifying and responding to risks of material misstatement due to non-compliance with laws and regulations We identified areas of laws and regulations that could reasonably be expected to have a material effect on the financial statements from our general commercial and sector experience and through discussion with the Manager and the Administrator (as required by auditing standards) and discussed with the Directors the policies and procedures regarding compliance with laws and regulations.
The potential effect of these laws and regulations on the financial statements varies considerably.
Firstly, the fund is subject to laws and regulations that directly affect the financial statements including financial reporting legislation (including related authorised fund legislation maintained by the Financial Conduct Authority) and taxation legislation and we assessed the extent of compliance with these laws and regulations as part of our procedures on the related financial statement items.
Secondly, the fund is subject to many other laws and regulations where the consequences of non-compliance could have a material effect on amounts or disclosures in the financial statements, for instance through the imposition of fines or litigation. We identified the following areas as those most likely to have such an effect: money laundering, data protection and bribery and corruption legislation recognising the fund’s activities. Auditing standards limit the required audit procedures to identify non-compliance with these laws and regulations to enquiry of the Directors and the Administrator and inspection of regulatory and legal correspondence, if any. Therefore if a breach of operational regulations is not disclosed to us or evident from relevant correspondence, an audit will not detect that breach.
Context of the ability of the audit to detect fraud or breaches of law or regulationOwing to the inherent limitations of an audit, there is an unavoidable risk that we may not have detected some material misstatements in the financial statements, even though we have properly planned and performed our audit in accordance with auditing standards. For example, the further removed non-compliance with laws and regulations is from the events and transactions reflected in the financial statements, the less likely the inherently limited procedures required by auditing standards would identify it.
In addition, as with any audit, there remained a higher risk of non-detection of fraud, as these may involve collusion, forgery, intentional omissions, misrepresentations, or the override of internal controls. Our audit procedures are designed to detect material misstatement. We are not responsible for preventing non-compliance or fraud and cannot be expected to detect non-compliance with all laws and regulations.
Other informationThe Manager (Aberdeen Standard Fund Managers Limited) is responsible for the other information presented in the Annual Report together with the financial statements. Our opinion on the financial statements does not cover the other information and, accordingly, we do not express an audit opinion or, except as explicitly stated below, any form of assurance conclusion thereon.
Our responsibility is to read the other information and, in doing so, consider whether, based on our financial statements audit work, the information therein is materially misstated or inconsistent with the financial statements or our audit knowledge. Based solely on that work:
• we have not identified material misstatements in the other information; and
• in our opinion the information given in the Manager’s Report for the financial year is consistent with the financial statements.
Matters on which we are required to report by exceptionWe have nothing to report in respect of the following matters where under the COLL Rules we are required to report to you if, in our opinion:
• proper accounting records for the fund have not been kept; or
• the financial statements are not in agreement with the accounting records.
Manager’s responsibilitiesAs explained more fully in their statement set out on page 5, the Manager is responsible for: the preparation of financial statements that give a true and fair view; such internal control as they determine is necessary to enable the preparation of financial statements that are free from material misstatement, whether due to fraud or error; assessing the fund’s ability to continue as a going concern, disclosing, as applicable, matters related to going concern; and using the going concern basis of accounting unless they either intend to liquidate the fund or to cease operations, or have no realistic alternative but to do so.

09ASI Global Absolute Return Strategies Fund
Auditor’s responsibilitiesOur objectives are to obtain reasonable assurance about whether the financial statements as a whole are free from material misstatement, whether due to fraud or error, and to issue our opinion in an auditor’s report. Reasonable assurance is a high level of assurance, but does not guarantee that an audit conducted in accordance with ISAs (UK) will always detect a material misstatement when it exists. Misstatements can arise from fraud or error and are considered material if, individually or in aggregate, they could reasonably be expected to influence the economic decisions of users taken on the basis of the financial statements.
A fuller description of our responsibilities is provided on the FRC’s website at www.frc.org.uk/auditorsresponsibilities.
The purpose of our audit work and to whom we owe our responsibilitiesThis report is made solely to the fund’s unitholders, as a body, in accordance with Rule 4.5.12 of the Collective Investment Schemes sourcebook (‘the COLL Rules’) issued by the Financial Conduct Authority under section 247 of the Financial Services and Markets Act 2000. Our audit work has been undertaken so that we might state to the fund’s unitholders those matters we are required to state to them in an auditor’s report and for no other purpose. To the fullest extent permitted by law, we do not accept or assume responsibility to anyone other than the fund and the fund’s unitholders as a body, for our audit work, for this report, or for the opinions we have formed.
Grant Archerfor and on behalf of KPMG LLP, Statutory AuditorChartered AccountantsSt Vincent Plaza319 St Vincent StreetGlasgowG2 5AS26 July 2021

10 ASI Global Absolute Return Strategies Fund
Investment Report
Investment ObjectiveTo generate a positive absolute return over the medium to long term (3 to 5 years or more) irrespective of market conditions, whilst reducing the risk of losses. Invested capital is however at risk and there is no guarantee that the objective will be attained over any time period.
Performance target: To exceed the return of 6 month GBP LIBOR plus 5% per annum, evaluated over rolling three year periods (before charges). The performance target is the level of performance that the management team hopes to achieve for the fund.
There is however no certainty or promise that they will achieve the performance target.
6-month GBP LIBOR has been chosen as a proxy for the return on cash deposits.
Investment PolicyPortfolio Securities• The fund invests in a broad range of assets from across the
global investment universe, directly and via derivatives.
• Assets include equities (company shares), bonds, currencies, commercial property and commodities.
• The fund may also invest in other funds (including those managed by Aberdeen Standard Investments), money-market instruments and cash.
Management Process• The management team use their discretion (active management)
to make flexible allocations to multiple types of assets depending on market conditions, the price of different assets or their value relative to each other based on their analysis of future economic and business conditions.
• The team seeks to generate growth in a wide variety of ways (e.g. if market prices rise or fall). It also means they can build the portfolio to be as resilient as possible to shocks that cause markets generally to fall sharply.
• As a result of extensive diversification and during extreme equity market falls, the fund’s value may be expected to fall between approximately one third and one half of the fall in global equity markets.
Derivatives and Techniques• The fund will make extensive use of derivatives to reduce
risk, reduce cost and/or generate extra income or growth consistent with the risk profile of the fund (often referred to as “Efficient Portfolio Management”).
• Derivatives can be used to generate growth, consistent with the fund’s risk profile, if market prices are expected to rise (long positions) or fall (short positions).
• Leverage in the fund arises as a result of the use of derivatives.
• Examples of investment strategies implemented through derivatives are:
– An assessment of the expected level of a given stock market index;
– An assessment of one currency relative to another;
– An assessment of the direction of interest rates.
Performance Review For the year ended 31 March 2021, the value of ASI Global Absolute Return Strategies Fund – Platform 1 Accumulation Units increased by 7.74% compared to an increase of 0.20% in the benchmark, 6 month LIBOR.Source: Morningstar, Basis: total return, published NAV to NAV, net of expenses, gross income reinvested, GBP.
Please remember that past performance is not a guide to future returns. The price of shares and the income from them may fall as well as rise. Investors may not get back the amount originally invested.
Market ReviewInvestor sentiment remained generally buoyant through the period, as governments and central banks continued to provide generous support to help individuals and businesses weather the Covid crisis. Towards the end of 2020, news of effective vaccines and the rollout of inoculation programmes further fuelled optimism. In this environment, our exposures to equities in the US, Korea, Japan and China delivered healthy positive returns. So, too, did our thematic equity strategies, including global industrial automation, global cyclical value, global future mobility and global sustainable staples. Our European equity infrastructure position benefited from news of a large European spending programme, targeting renewable energy. Meanwhile, the improving outlook for real estate markets lifted our global REITs (real estate investment trusts) strategy. However, our short US equity positions in small-cap and technology stocks lost ground, along with the US equity volatility strategy.
Central bank actions were particularly supportive of corporate bonds, boosting our exposures to European and US investment-grade and, most notably, high-yield corporate bonds. Our position in contingent convertible bonds (also called contingent capital bonds or ‘CoCos’) also gained.
In currency markets, our preference for the Korean won over the Australian dollar lost ground, as the Australian dollar benefited from rising commodity prices and improving global growth prospects. Our Japanese yen versus euro position also delivered a negative return. As a more defensive currency, the yen was shunned by investors.

11ASI Global Absolute Return Strategies Fund
Our interest rate positions were mixed. For example, US rates moved in favour of our US yield-curve steepener position, while rates in Canada moved against our position there. Elsewhere, our short UK inflation strategy dragged on performance after UK inflation figures exceeded expectations. Nevertheless, we continue to expect UK prices to fall later this year in the face of pressures from the Covid crisis and Brexit.
Portfolio ActivityAt the start of the period, we increased our equity exposure on news of central bank and government support plans. Specifically, we increased the US large-cap equity position, reduced the short US small-cap equity position, closed our Japanese and emerging markets (EM) equity exposures and increased the Korean equity allocation. Additionally, we closed the US equity volatility and short US equity technology positions and removed the hedge on our European equity positions. To complement these changes, we reduced our defensive Japanese yen versus US dollar currency pair and added Swiss franc versus euro and yen versus euro strategies reflecting our concerns around political risk and economic prospects in Europe.
We greatly increased exposure to developed market corporate bonds, after central banks broadened the scope of their bond-buying programmes. Given our concerns about the outlook for EM economies, we closed the Mexican and Indonesian government bond positions and reduced the EM income strategy. We added an EM currency relative-value strategy, seeking to exploit the perceived vulnerability of certain EM currencies. We closed the US dollar versus Thai baht position as the baht was no longer our favoured expression of the weakening EM theme.
We switched interest rate exposure from Sweden to Australia where, in our view, there is greater potential for rate cuts. We reduced the US yield curve steepener allocation, taking profits. Also, we converted the US versus German interest rates strategy into an outright US rates position, which offered better upside potential while retaining defensive qualities. We later added a global equity gold miners strategy, comprising selected stocks with earnings linked to gold prices. We added global equity video games and 5G strategies where we see substantial growth potential beyond the immediate boost of the ‘stay at home’ environment. We also added a position in UK equity mid-cap stocks.
Following news of European stimulus packages, we increased our high-yield corporate bond exposure and removed the hedge from the European equity infrastructure strategy. Also, we reduced the yen versus euro position and closed the Swiss franc versus euro position.
By June, positive market drivers had started to fade and market valuations looked less appealing. This prompted us to reduce risk levels by decreasing US and Korean equity market exposures. We also added a new European yield curve steepener strategy seeking to benefit from long-term economic recovery, from central bank activity and from anticipated changes to Dutch pensions regulations. To complement these changes, we reduced our US and Australian interest rate exposures. We closed the short US small-cap equity strategy and added further to high-yield corporate bonds. We took profits on our European investment-grade corporate bond and Korean equity strategies.
In July, we increased the risk (and therefore return potential) of the portfolio as confidence grew in the approval of the European recovery plan. We closed the yen versus euro position and increased our European yield-curve steepener strategy. We added a new thematic strategy, global equity industrial automation.
We initiated a US high-yield versus EM corporate bond strategy. The two markets have similar drivers but the valuation gap was extreme. We opened a currency position seeking to exploit movements across developed market currencies. To complement these changes, we initiated a US versus UK interest rate position, aimed at providing protection during periods of low risk appetite. We closed our South African bonds position, taking profits.
In August, the uncertainty over a further US government support package and rising Covid-19 cases prompted us to reduce risk. We did so by reducing our high-yield corporate bond and global equity gold miners positions. For protection, we closed our US investment-grade corporate bond strategy and re-opened the position preferring the yen over the euro. We added a position in Chinese bonds, where the market is anticipating rate increases but we are not. We reduced our REIT exposure and increased our thematically driven equity exposures. We added a global equity future mobility strategy that invests in companies involved in the electrification of transportation. We initiated a position in US homebuilders.
In September, we took further steps to reduce risk. We decreased the US equity, European equity income, global REIT and long US inflation strategies, and closed our US homebuilding position. We reduced our US versus EM corporate bond position and hedged some of our high-yield corporate bond exposure. For further protection, we increased exposure to Australian interest rates. We increased our developed market currency position and trimmed our EM currency relative-value strategy, taking profits. We pared back UK exposure given renewed uncertainty around Brexit. We also reduced our short UK inflation position, hedged our UK mid-cap equity strategy and took profits from our US versus UK interest-rate position.
During the final three months of 2020, we increased portfolio risk significantly, on the back of vaccine announcements, central banks’ ongoing accommodative stance, the election Joe Biden as US president and a last-minute Brexit deal. We increased exposure to equity markets, shifting away from growth towards more cyclical exposure. We closed positions in global equity gold miners, video games and 5G. We added US consumer discretionary, global equity cyclical value and Brazilian equity positions. We also increased exposure to Chinese equities, global equity future mobility and global equity sustainable staples. In bond markets, we increased exposure to EM debt, high-yield corporate bonds, CoCos and our US yield-curve steepener strategy. We added to our interest rate exposure in Canada, taking advantage of attractive pricing.

12 ASI Global Absolute Return Strategies Fund
During the first quarter of 2021, we adjusted the portfolio to encompass the more bearish outlook for interest rates. We closed our Australian and Canadian interest rates strategies, and our European and US yield-curve steepener strategies. We added short positions in US interest rates and US real yields. We replaced exposure to US inflation with European inflation. At the same time, we reduced equity exposure. We closed UK equity mid-cap, Brazilian, Japanese and Chinese equity exposures, as well as the European equity infrastructure, global equity future mobility and US equity consumer discretionary baskets. We added global equity growth recovery, global equity metals, global equity video games, US equity energy versus utilities and US equity regional banks versus S&P 500 Index strategies. We reduced exposure to EM income. We added South African government bonds and closed the yen versus US dollar and Mexican peso versus US dollar pairs.
Portfolio Outlook and StrategyThe portfolio is risk-facing. US government policy as well as developed market central banks’ ongoing accommodative stance remain supportive. While we expect inflation to move higher in many economies over the coming quarter or two, we do not expect sustained inflation. Covid-19 vaccine rollouts are stoking investor appetite for riskier assets with a significant tilt towards cyclical exposure. Forecast upgrades to economic growth and corporate earnings are also supportive.
We retain defensive positions, as some uncertainty remains around geopolitical tensions and Covid-19 variants. National lockdowns pose renewed economic challenges in some parts of the globe. We continue to dynamically manage our overall risk profile to generate uncorrelated returns. We believe the exciting opportunities that we have implemented in the fund and our careful attention to portfolio construction should ensure we have the right balance to protect the fund in the event of market drawdowns.
Absolute Return Team April 2021

13ASI Global Absolute Return Strategies Fund
Risk and reward profileThe Risk and Reward Indicator table demonstrates where the fund ranks in terms of its potential risk and reward. The higher the rank the greater the potential reward but the greater the risk of losing money. It is based on past data, may change over time and may not be a reliable indication of the future risk profile of the fund. The shaded area in the table below shows the fund’s ranking on the Risk and Reward Indicator.
Typically lower rewards, lower risk Typically higher rewards, higher risk
1 2 3 4 5 6 7
Risk and reward indicator table as at 31 March 2021.
The fund is rated as 3 because of the extent to which the following risk factors apply:
• The fund invests in securities which are subject to the risk that the issuer may default on interest or capital payments.
• The use of derivatives carries the risk of reduced liquidity, substantial loss and increased volatility in adverse market conditions, such as a failure amongst market participants. The use of derivatives may result in the fund being leveraged (where market exposure and thus the potential for loss by the fund exceeds the amount it has invested) and in these market conditions the effect of leverage will be to magnify losses.
• The fund invests in emerging market equities and/or bonds. Investing in emerging markets involves a greater risk of loss than investing in more developed markets due to, among other factors, greater political, tax, economic, foreign exchange, liquidity and regulatory risks.
• The fund invests in equity and equity related securities. These are sensitive to variations in the stock markets which can be volatile and change substantially in short periods of time.
• The fund invests in high yielding bonds which carry a greater risk of default than those with lower yields.
• The fund price can go up or down daily for a variety of reasons including changes in interest rates, inflation expectations or the perceived credit quality of individual countries or securities.
All investment involves risk. This fund offers no guarantee against loss or that the fund’s objective will be attained.
The price of assets and the income from them may go down as well as up and cannot be guaranteed; an investor may receive back less than their original investment.
Inflation reduces the buying power of your investment and income.
The value of assets held in the fund may rise and fall as a result of exchange rate fluctuations.
The fund could lose money if an entity (counterparty) with which it does business becomes unwilling or unable to honour its obligations to the fund.
In extreme market conditions some securities may become hard to value or sell at a desired price. This could affect the fund’s ability to meet redemptions in a timely manner.
The fund could lose money as the result of a failure or delay in operational processes and systems including but not limited to third party providers failing or going into administration.

14 ASI Global Absolute Return Strategies Fund
Comparative Tables
Retail accumulation2021
pence per unit2020
pence per unit2019
pence per unit
Change in net assets per unit
Opening net asset value per unit 74.10 73.63 74.52
Return before operating charges* 6.62 1.46 0.07
Operating charges (1.04) (0.99) (0.96)
Return after operating charges* 5.58 0.47 (0.89)
Distributions (0.48) (1.13) (1.39)
Retained distributions on accumulation units 0.48 1.13 1.39
Closing net asset value per unit 79.68 74.10 73.63
* after direct transaction costs of: 0.05 0.04 0.03
Performance
Return after charges 7.53% 0.64% (1.19%)
Other information
Closing net asset value (£’000) 567,758 660,909 1,682,086
Closing number of units 712,534,993 891,888,610 2,284,555,977
Operating charges 1.33% 1.32% 1.32%
Direct transaction costs 0.07% 0.05% 0.04%
Prices
Highest unit price 81.94 79.06 74.56
Lowest unit price 73.69 72.72 70.32
The closing net asset value (£’000) divided by the closing number of units may not calculate to the closing net asset value per unit (p) due to rounding differences. The published closing net asset value per unit (p) is based on unrounded values and represents the actual price.The return after charges figures are based on the accounting NAV, as the financial statements are produced at a valuation point that is different from the published daily NAV.Operating charges are expenses associated with the maintenance and administration of the fund on a day to day basis that are actually borne by the unit class.Highest and Lowest prices are based on official published daily NAVs.

15ASI Global Absolute Return Strategies Fund
Institutional accumulation2021
pence per unit2020
pence per unit2019
pence per unit
Change in net assets per unit
Opening net asset value per unit 82.47 81.64 82.32
Return before operating charges* 7.29 1.53 -
Operating charges (0.75) (0.70) (0.68)
Return after operating charges* 6.54 0.83 (0.68)
Distributions (0.86) (1.57) (1.84)
Retained distributions on accumulation units 0.86 1.57 1.84
Closing net asset value per unit 89.01 82.47 81.64
* after direct transaction costs of: 0.06 0.04 0.03
Performance
Return after charges 7.93% 1.02% (0.83%)
Other information
Closing net asset value (£’000) 491,203 763,178 1,677,051
Closing number of units 551,867,228 925,434,214 2,054,253,754
Operating charges 0.86% 0.85% 0.85%
Direct transaction costs 0.07% 0.05% 0.04%
Prices
Highest unit price 91.47 87.95 82.37
Lowest unit price 82.02 80.90 77.89
The closing net asset value (£’000) divided by the closing number of units may not calculate to the closing net asset value per unit (p) due to rounding differences. The published closing net asset value per unit (p) is based on unrounded values and represents the actual price.The return after charges figures are based on the accounting NAV, as the financial statements are produced at a valuation point that is different from the published daily NAV.Operating charges are expenses associated with the maintenance and administration of the fund on a day to day basis that are actually borne by the unit class.Highest and Lowest prices are based on official published daily NAVs.
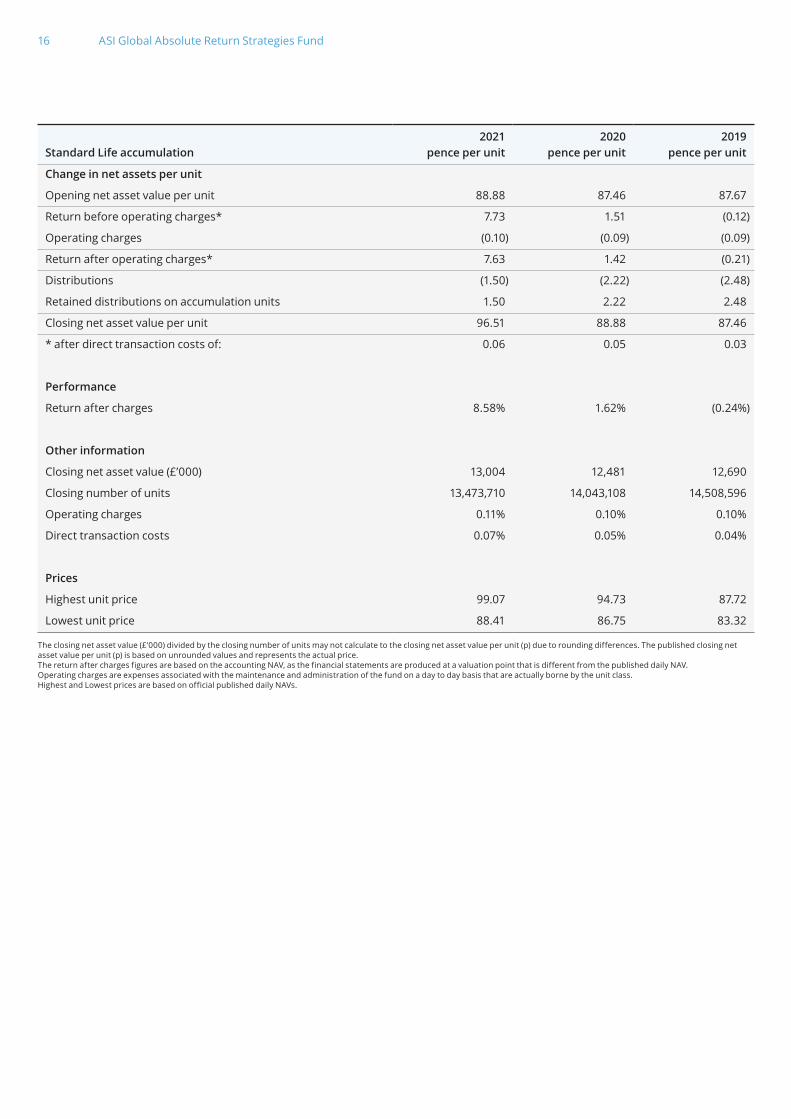
16 ASI Global Absolute Return Strategies Fund
Standard Life accumulation2021
pence per unit2020
pence per unit2019
pence per unit
Change in net assets per unit
Opening net asset value per unit 88.88 87.46 87.67
Return before operating charges* 7.73 1.51 (0.12)
Operating charges (0.10) (0.09) (0.09)
Return after operating charges* 7.63 1.42 (0.21)
Distributions (1.50) (2.22) (2.48)
Retained distributions on accumulation units 1.50 2.22 2.48
Closing net asset value per unit 96.51 88.88 87.46
* after direct transaction costs of: 0.06 0.05 0.03
Performance
Return after charges 8.58% 1.62% (0.24%)
Other information
Closing net asset value (£’000) 13,004 12,481 12,690
Closing number of units 13,473,710 14,043,108 14,508,596
Operating charges 0.11% 0.10% 0.10%
Direct transaction costs 0.07% 0.05% 0.04%
Prices
Highest unit price 99.07 94.73 87.72
Lowest unit price 88.41 86.75 83.32
The closing net asset value (£’000) divided by the closing number of units may not calculate to the closing net asset value per unit (p) due to rounding differences. The published closing net asset value per unit (p) is based on unrounded values and represents the actual price.The return after charges figures are based on the accounting NAV, as the financial statements are produced at a valuation point that is different from the published daily NAV.Operating charges are expenses associated with the maintenance and administration of the fund on a day to day basis that are actually borne by the unit class.Highest and Lowest prices are based on official published daily NAVs.

17ASI Global Absolute Return Strategies Fund
Institutional regulated accumulationA
2020pence per unit
2019pence per unit
Change in net assets per unit
Opening net asset value per unit 83.28 84.01
Return before operating charges* 1.15 (0.28)
Operating charges (0.47) (0.45)
Return after operating charges* 0.68 (0.73)
Distributions - -
Retained distributions on accumulation units - -
Redemption value as at 27 March 2020 (83.96) -
Closing net asset value per unit - 83.28
* after direct transaction costs of: 0.05 0.03
Performance
Return after charges 0.82% (0.87%)
Other information
Closing net asset value (£’000) - -B
Closing number of units - 122
Operating charges 0.55% 0.55%
Direct transaction costs 0.05% 0.04%
Prices
Highest unit price 89.82 84.05
Lowest unit price 82.53 79.52
The closing net asset value (£’000) divided by the closing number of units may not calculate to the closing net asset value per unit (p) due to rounding differences. The published closing net asset value per unit (p) is based on unrounded values and represents the actual price.The return after charges figures are based on the accounting NAV, as the financial statements are produced at a valuation point that is different from the published daily NAV.Operating charges are expenses associated with the maintenance and administration of the fund on a day to day basis that are actually borne by the unit class.Highest and Lowest prices are based on official published daily NAVs.A Institutional regulated accumulation Unit Class closed on 27 March 2020.B The closing net asset value of Institutional Regulated Accumulation is £102.
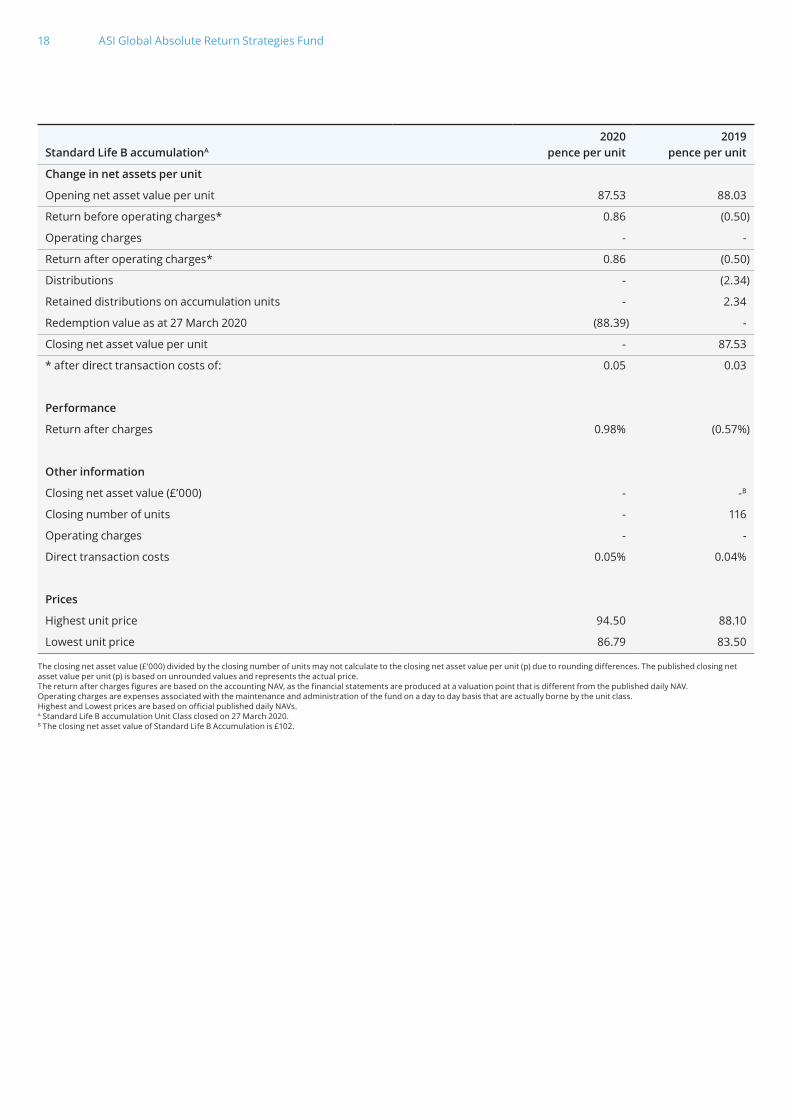
18 ASI Global Absolute Return Strategies Fund
Standard Life B accumulationA
2020pence per unit
2019pence per unit
Change in net assets per unit
Opening net asset value per unit 87.53 88.03
Return before operating charges* 0.86 (0.50)
Operating charges - -
Return after operating charges* 0.86 (0.50)
Distributions - (2.34)
Retained distributions on accumulation units - 2.34
Redemption value as at 27 March 2020 (88.39) -
Closing net asset value per unit - 87.53
* after direct transaction costs of: 0.05 0.03
Performance
Return after charges 0.98% (0.57%)
Other information
Closing net asset value (£’000) - -B
Closing number of units - 116
Operating charges - -
Direct transaction costs 0.05% 0.04%
Prices
Highest unit price 94.50 88.10
Lowest unit price 86.79 83.50
The closing net asset value (£’000) divided by the closing number of units may not calculate to the closing net asset value per unit (p) due to rounding differences. The published closing net asset value per unit (p) is based on unrounded values and represents the actual price.The return after charges figures are based on the accounting NAV, as the financial statements are produced at a valuation point that is different from the published daily NAV.Operating charges are expenses associated with the maintenance and administration of the fund on a day to day basis that are actually borne by the unit class.Highest and Lowest prices are based on official published daily NAVs.A Standard Life B accumulation Unit Class closed on 27 March 2020.B The closing net asset value of Standard Life B Accumulation is £102.

19ASI Global Absolute Return Strategies Fund
Standard Life A accumulation2021
pence per unit2020
pence per unit2019
pence per unit
Change in net assets per unit
Opening net asset value per unit 89.28 87.79 87.94
Return before operating charges* 7.75 1.51 (0.13)
Operating charges (0.03) (0.02) (0.02)
Return after operating charges* 7.72 1.49 (0.15)
Distributions (1.57) (2.29) (2.54)
Retained distributions on accumulation units 1.57 2.29 2.54
Closing net asset value per unit 97.00 89.28 87.79
* after direct transaction costs of: 0.07 0.05 0.03
Performance
Return after charges 8.65% 1.70% (0.17%)
Other information
Closing net asset value (£’000) 1,420,158 2,029,187 5,122,150
Closing number of units 1,464,052,767 2,272,857,761 5,834,469,757
Operating charges 0.03% 0.02% 0.02%
Direct transaction costs 0.07% 0.05% 0.04%
Prices
Highest unit price 99.58 95.14 88.00
Lowest unit price 88.80 87.08 83.60
The closing net asset value (£’000) divided by the closing number of units may not calculate to the closing net asset value per unit (p) due to rounding differences. The published closing net asset value per unit (p) is based on unrounded values and represents the actual price.The return after charges figures are based on the accounting NAV, as the financial statements are produced at a valuation point that is different from the published daily NAV.Operating charges are expenses associated with the maintenance and administration of the fund on a day to day basis that are actually borne by the unit class.Highest and Lowest prices are based on official published daily NAVs.

20 ASI Global Absolute Return Strategies Fund
Platform 1 accumulation2021
pence per unit2020
pence per unit2019
pence per unit
Change in net assets per unit
Opening net asset value per unit 58.59 58.03 58.54
Return before operating charges* 5.18 1.09 -
Operating charges (0.56) (0.53) (0.51)
Return after operating charges* 4.62 0.56 (0.51)
Distributions (0.59) (1.09) (1.28)
Retained distributions on accumulation units 0.59 1.09 1.28
Closing net asset value per unit 63.21 58.59 58.03
* after direct transaction costs of: 0.04 0.03 0.02
Performance
Return after charges 7.89% 0.97% (0.87%)
Other information
Closing net asset value (£’000) 337,116 372,422 537,103
Closing number of units 533,287,152 635,627,899 925,625,917
Operating charges 0.91% 0.90% 0.90%
Direct transaction costs 0.07% 0.05% 0.04%
Prices
Highest unit price 64.96 62.49 58.60
Lowest unit price 58.27 57.49 55.40
The closing net asset value (£’000) divided by the closing number of units may not calculate to the closing net asset value per unit (p) due to rounding differences. The published closing net asset value per unit (p) is based on unrounded values and represents the actual price.The return after charges figures are based on the accounting NAV, as the financial statements are produced at a valuation point that is different from the published daily NAV.Operating charges are expenses associated with the maintenance and administration of the fund on a day to day basis that are actually borne by the unit class.Highest and Lowest prices are based on official published daily NAVs.

21ASI Global Absolute Return Strategies Fund
Institutional S accumulation2021
pence per unit2020
pence per unit2019
pence per unit
Change in net assets per unit
Opening net asset value per unit 55.24 54.63 55.04
Return before operating charges* 4.87 1.02 (0.02)
Operating charges (0.43) (0.41) (0.39)
Return after operating charges* 4.44 0.61 (0.41)
Distributions (0.64) (1.10) (1.28)
Retained distributions on accumulation units 0.64 1.10 1.28
Closing net asset value per unit 59.68 55.24 54.63
* after direct transaction costs of: 0.04 0.03 0.02
Performance
Return after charges 8.04% 1.12% (0.74%)
Other information
Closing net asset value (£’000) 149,786 153,946 278,968
Closing number of units 250,980,727 278,686,778 510,634,916
Operating charges 0.74% 0.73% 0.73%
Direct transaction costs 0.07% 0.05% 0.04%
Prices
Highest unit price 61.32 58.91 55.07
Lowest unit price 54.94 54.14 52.10
The closing net asset value (£’000) divided by the closing number of units may not calculate to the closing net asset value per unit (p) due to rounding differences. The published closing net asset value per unit (p) is based on unrounded values and represents the actual price.The return after charges figures are based on the accounting NAV, as the financial statements are produced at a valuation point that is different from the published daily NAV.Operating charges are expenses associated with the maintenance and administration of the fund on a day to day basis that are actually borne by the unit class.Highest and Lowest prices are based on official published daily NAVs.

22 ASI Global Absolute Return Strategies Fund
Institutional A accumulation2021
pence per unit2020
pence per unit2019
pence per unit
Change in net assets per unit
Opening net asset value per unit 49.17 48.97 49.67
Return before operating charges* 4.41 1.00 0.07
Operating charges (0.83) (0.80) (0.77)
Return after operating charges* 3.58 0.20 (0.70)
Distributions (0.20) (0.63) (0.82)
Retained distributions on accumulation units 0.20 0.63 0.82
Closing net asset value per unit 52.75 49.17 48.97
* after direct transaction costs of: 0.04 0.03 0.02
Performance
Return after charges 7.28% 0.41% (1.41%)
Other information
Closing net asset value (£’000) 7,712 7,270 8,532
Closing number of units 14,619,125 14,786,783 17,423,595
Operating charges 1.61% 1.60% 1.60%
Direct transaction costs 0.07% 0.05% 0.04%
Prices
Highest unit price 54.27 52.47 49.70
Lowest unit price 48.90 48.25 46.79
The closing net asset value (£’000) divided by the closing number of units may not calculate to the closing net asset value per unit (p) due to rounding differences. The published closing net asset value per unit (p) is based on unrounded values and represents the actual price.The return after charges figures are based on the accounting NAV, as the financial statements are produced at a valuation point that is different from the published daily NAV.Operating charges are expenses associated with the maintenance and administration of the fund on a day to day basis that are actually borne by the unit class.Highest and Lowest prices are based on official published daily NAVs.

23ASI Global Absolute Return Strategies Fund
Portfolio StatementAs at 31 March 2021
Holding InvestmentMarket Value
£’000
Percentageof total
net assets
Bonds (32.07%) 795,646 26.64
Brazilian Real Denominated Bonds (1.31%) 26,864 0.90
Government Bonds (1.31%) 26,864 0.90
less than 5 years to maturity
29,298,000 Brazil (Fed Rep of) 10% 2025 4,060 0.13
between 5 and 10 years to maturity
111,906,000 Nota Do Tesouro 10% 2027 15,411 0.52
40,588,000 Nota Do Tesouro 10% 2029 5,575 0.19
13,207,000 Nota Do Tesouro 10% 2031 1,818 0.06
Chilean Peso Denominated Bonds (0.68%) 3,633 0.12
Government Bonds (0.68%) 3,633 0.12
less than 5 years to maturity
885,000,000 Chile (Republic of) 4.5% 2026 989 0.03
between 5 and 10 years to maturity
2,745,000,000 Chile (Republic of) 2.3% 2028 2,644 0.09
Colombian Peso Denominated Bonds (0.37%) 10,279 0.34
Government Bonds (0.37%) 10,279 0.34
between 5 and 10 years to maturity
9,069,200,000 Colombia (Republic of) 7.5% 2026 1,929 0.06
22,425,900,000 Colombia (Republic of) 7.75% 2030 4,652 0.16
between 10 and 15 years to maturity
19,270,000,000 Colombia (Republic of) 7% 2032 3,698 0.12
Czech Koruna Denominated Bonds (0.00%) 2,206 0.07
Government Bonds (0.00%) 2,206 0.07
between 15 and 25 years to maturity
77,920,000 Czech Republic (Govt of) 1.5% 2040 2,206 0.07

24 ASI Global Absolute Return Strategies Fund
Holding InvestmentMarket Value
£’000
Percentageof total
net assets
Dominican Peso Denominated Bonds (0.17%) - -
Government Bonds (0.17%) - -
Euro Denominated Bonds (1.19%) 98,272 3.29
Corporate Bonds (1.19%) 98,272 3.29
less than 5 years to maturity
1,405,000 Cirsa Finance International 6.25% 2023 1,213 0.04
1,385,000 eG Global Finance 6.25% 2025 1,200 0.04
961,000 Garfunkelux Holdco 3 6.75% 2025 845 0.03
1,062,000 INEOS 5.375% 2024 913 0.03
479,000 International Game Technology 3.5% 2024 420 0.01
1,078,000 Intrum 4.875% 2025 958 0.03
1,107,000 Kleopatra Finco 4.25% 2026 940 0.03
1,269,000 Lincoln Financing 3.625% 2024 1,091 0.04
1,847,000 Nassa Topco 2.875% 2024 1,644 0.05
2,981,000 Nidda Healthcare 3.5% 2024 2,552 0.09
1,411,000 Quatrim 5.875% 2024 1,257 0.04
1,984,000 Tele Columbus 3.875% 2025 1,714 0.06
807,000 Teva Pharmaceutical 3.25% 2022 696 0.02
266,000 Teva Pharmaceutical 4.5% 2025 238 0.01
494,000 Teva Pharmaceutical Finance Netherlands II 6% 2025 463 0.02
between 5 and 10 years to maturity
4,400,000 Abanca Corporacion Bancaria 6.125% fixed to floating 2029 4,091 0.14
486,000 Altice 3.375% 2028 403 0.01
2,497,000 Altice France 5.875% 2027 2,264 0.08
2,296,000 Atlantia 2% 2028 2,000 0.07
842,000 Cidron Aida Finco 5% 2028 726 0.02
1,792,000 International Game Technology 3.5% 2026 1,556 0.05
907,000 Intrum 3.5% 2026 770 0.03
3,538,000 Matterhorn Telecom 3.125% 2026 2,991 0.10
1,090,000 Netflix 3.625% 2027 1,061 0.04
541,000 Novelis Sheet Ingot 3.375% 2029 475 0.02
916,000 Sofima 3.75% 2028 785 0.03
405,000 Sofima 4% 2028 347 0.01
1,336,000 Verisure 3.25% 2027 1,146 0.04
414,000 Verisure 3.875% 2026 363 0.01
1,631,000 Vertical Midco 4.375% 2027 1,458 0.05
697,000 Vertical Midco FRN 2027 603 0.02
2,012,000 Ziggo 3.375% 2030 1,686 0.06

25ASI Global Absolute Return Strategies Fund
Holding InvestmentMarket Value
£’000
Percentageof total
net assets
between 10 and 15 years to maturity
452,000 Telecom Italia 7.75% fixed to floating 2033 563 0.02
Perpetual
5,400,000 Aareal Bank 7.625% fixed to floating Perpetual 4,632 0.15
1,100,000 Abertis Infraestructuras Finance 3.248% fixed to floating Perpetual 960 0.03
2,700,000 ABN Amro Bank 4.75% fixed to floating Perpetual 2,489 0.08
4,090,000 Athora Netherlands 7% fixed to floating Perpetual 3,951 0.13
3,400,000 Banco Bilbao Vizcaya Argentaria 6% fixed to floating Perpetual 3,138 0.10
1,200,000 Banco Santander 4.375% fixed to floating Perpetual 1,049 0.04
2,700,000 Banco Santander 6.25% fixed to floating Perpetual 2,348 0.08
1,496,000 BP Capital Markets 3.25% fixed to floating Perpetual 1,365 0.05
1,247,000 BP Capital Markets 3.625% fixed to floating Perpetual 1,151 0.04
3,200,000 Caixa Geral de Depositos 10.75% fixed to floating Perpetual 2,970 0.10
4,800,000 CaixaBank FRN Perpetual 4,525 0.15
4,000,000 Commerzbank 6.125% fixed to floating Perpetual 3,644 0.12
3,830,000 ING FRN Perpetual 3,113 0.10
6,183,000 Intesa Sanpaolo 5.5% fixed to floating Perpetual 5,705 0.19
2,990,000 La Mondiale 5.05% fixed to floating Perpetual 2,955 0.10
1,541,000 LeasePlan 7.375% fixed to floating Perpetual 1,430 0.05
3,582,128 Stichting 6.5% Perpetual 3,948 0.13
2,400,000 Telefonica Europe 4.375% fixed to floating Perpetual 2,220 0.07
1,840,000 Unicredit 6.625% fixed to floating Perpetual 1,684 0.06
3,110,000 Unicredit 7.5% fixed to floating Perpetual 3,133 0.10
2,730,000 Van Lanschot Kempen Wealth Management 6.75% fixed to floating Perpetual 2,430 0.08
Hungarian Forint Denominated Bonds (0.50%) 6,158 0.21
Government Bonds (0.50%) 6,158 0.21
between 5 and 10 years to maturity
1,245,320,000 Hungary (Govt of) 1.5% 2026 2,872 0.10
1,326,520,000 Hungary (Govt of) 3% 2027 3,286 0.11
Indian Rupee Denominated Bonds (0.45%) 7,065 0.24
Government Bonds (0.45%) 7,065 0.24
less than 5 years to maturity
220,730,000 India (Govt of) 7.68% 2023 2,334 0.08
224,490,000 India (Govt of) 7.72% 2025 2,391 0.08

26 ASI Global Absolute Return Strategies Fund
Holding InvestmentMarket Value
£’000
Percentageof total
net assets
between 10 and 15 years to maturity
220,230,000 India (Govt of) 7.57% 2033 2,340 0.08
Indonesian Rupiah Denominated Bonds (1.59%) 23,528 0.79
Government Bonds (1.59%) 23,528 0.79
less than 5 years to maturity
35,123,000,000 Indonesia (Govt of) 7% 2022 1,814 0.06
between 5 and 10 years to maturity
24,696,000,000 Indonesia (Govt of) 6.125% 2028 1,195 0.04
59,163,000,000 Indonesia (Govt of) 6.5% 2031 2,889 0.10
163,256,000,000 Indonesia (Govt of) 7% 2027 8,468 0.28
56,807,000,000 Indonesia (Govt of) 7% 2030 2,873 0.10
74,398,000,000 Indonesia (Govt of) 8.375% 2026 4,113 0.14
between 10 and 15 years to maturity
41,855,000,000 Indonesia (Govt of) 7.5% 2032 2,176 0.07
Malaysian Ringgit Denominated Bonds (0.91%) 16,096 0.54
Government Bonds (0.91%) 16,096 0.54
less than 5 years to maturity
24,675,000 Malaysia (Govt of) 3.48% 2023 4,422 0.15
4,730,000 Malaysia (Govt of) 3.882% 2022 842 0.03
12,666,000 Malaysia (Govt of) 4.059% 2024 2,328 0.08
between 5 and 10 years to maturity
29,734,000 Malaysia (Govt of) 3.906% 2026 5,474 0.18
between 15 and 25 years to maturity
10,178,000 Malaysia (Govt of) 3.757% 2040 1,668 0.06
7,346,000 Malaysia (Govt of) 4.935% 2043 1,362 0.04
Mexican Peso Denominated Bonds (4.04%) 31,506 1.05
Corporate Bonds (0.12%) 2,548 0.08
less than 5 years to maturity
77,384,100 Petroleos Mexicanos 7.19% 2024 2,548 0.08

27ASI Global Absolute Return Strategies Fund
Holding InvestmentMarket Value
£’000
Percentageof total
net assets
Government Bonds (3.92%) 28,958 0.97
less than 5 years to maturity
191,517,900 Mexico (United Mexican States) 5.75% 2026 6,721 0.23
176,359,000 Mexico (United Mexican States) 10% 2024 7,112 0.24
between 5 and 10 years to maturity
91,636,800 Mexico (United Mexican States) 7.5% 2027 3,455 0.11
255,103,400 Mexico (United Mexican States) 8.5% 2029 10,131 0.34
greater than 25 years to maturity
42,486,500 Mexico (United Mexican States) 8% 2047 1,539 0.05
Peruvian Sol Denominated Bonds (0.37%) 3,727 0.12
Government Bonds (0.37%) 3,727 0.12
between 15 and 25 years to maturity
8,913,000 Peru (Republic of) 5.35% 2040 1,552 0.05
10,617,000 Peru (Republic of) 6.85% 2042 2,175 0.07
Polish Zloty Denominated Bonds (0.90%) 13,426 0.45
Government Bonds (0.90%) 13,426 0.45
less than 5 years to maturity
30,409,000 Poland (Republic of) 0% 2022 5,583 0.19
17,285,000 Poland (Republic of) 2.5% 2024 3,379 0.11
between 5 and 10 years to maturity
22,450,000 Poland (Republic of) 2.5% 2026 4,464 0.15
Romanian Leu Denominated Bonds (0.11%) 5,588 0.19
Government Bonds (0.11%) 5,588 0.19
less than 5 years to maturity
6,595,000 Romania (Republic of) 3.65% 2025 1,192 0.04
between 5 and 10 years to maturity
1,080,000 Romania (Republic of) 5% 2029 213 0.01
between 10 and 15 years to maturity
12,880,000 Romania (Republic of) 3.65% 2031 2,286 0.08
10,160,000 Romania (Republic of) 4.75% 2034 1,897 0.06

28 ASI Global Absolute Return Strategies Fund
Holding InvestmentMarket Value
£’000
Percentageof total
net assets
Russian Ruble Denominated Bonds (1.52%) 19,472 0.65
Government Bonds (1.52%) 19,472 0.65
less than 5 years to maturity
253,267,000 Russia (Govt of) 7.15% 2025 2,494 0.08
between 5 and 10 years to maturity
274,788,000 Russia (Govt of) 7.05% 2028 2,666 0.09
413,939,000 Russia (Govt of) 7.65% 2030 4,164 0.14
804,523,000 Russia (Govt of) 7.75% 2026 8,105 0.27
200,986,000 Russia (Govt of) 7.95% 2026 2,043 0.07
South African Rand Denominated Bonds (4.63%) 160,576 5.38
Government Bonds (4.63%) 160,576 5.38
between 5 and 10 years to maturity
1,083,365,000 South Africa (Republic of) 8% 2030 48,387 1.62
906,758,000 South Africa (Republic of) 10.5% 2026 50,664 1.70
between 10 and 15 years to maturity
1,277,521,000 South Africa (Republic of) 8.25% 2032 54,234 1.82
between 15 and 25 years to maturity
37,219,000 South Africa (Republic of) 8.5% 2037 1,456 0.05
145,360,000 South Africa (Republic of) 9% 2040 5,835 0.19
Sterling Denominated Bonds (0.44%) 41,879 1.40
Corporate Bonds (0.44%) 41,879 1.40
less than 5 years to maturity
2,587,000 Arqiva 6.75% 2023 2,670 0.09
894,000 Bellis Acquisition 3.25% 2026 898 0.03
1,066,000 Garfunkelux Holdco 3 7.75% 2025 1,100 0.04
3,513,000 TalkTalk 3.875% 2025 3,428 0.11
between 5 and 10 years to maturity
388,000 Bellis Finco 4% 2027 389 0.01
1,097,000 Cidron Aida Finco 6.25% 2028 1,109 0.04
2,004,000 Jerrold Finco 5.25% 2027 2,029 0.07
1,628,000 Virgin Media 4.875% 2028 1,678 0.06
1,812,000 VMED O2 UK Financing I 4% 2029 1,808 0.06

29ASI Global Absolute Return Strategies Fund
Holding InvestmentMarket Value
£’000
Percentageof total
net assets
Perpetual
1,600,000 Assicurazioni Generali 6.269% fixed to floating Perpetual 1,811 0.06
1,780,000 Barclays 7.25% fixed to floating Perpetual 1,919 0.06
5,700,000 Deutsche Bank 7.125% fixed to floating Perpetual 5,968 0.20
4,680,000 Lloyds Banking 7.625% fixed to floating Perpetual 5,094 0.17
4,190,000 NatWest 4.5% fixed to floating Perpetual 4,181 0.14
1,365,000 Santander UK 7.375% Perpetual 1,427 0.05
6,038,000 Virgin Money UK 8% Perpetual 6,370 0.21
Thai Baht Denominated Bonds (0.93%) 16,903 0.57
Government Bonds (0.93%) 16,903 0.57
between 5 and 10 years to maturity
447,928,000 Thailand (Kingdom of) 1.25% Index-Linked 2028 10,566 0.35
92,719,000 Thailand (Kingdom of) 2.125% 2026 2,254 0.08
between 10 and 15 years to maturity
150,151,000 Thailand (Kingdom of) 3.775% 2032 4,083 0.14
Turkish Lira Denominated Bonds (0.32%) - -
Government Bonds (0.32%) - -
Ukrainian Hyrvnia Denominated Bonds (0.00%) 2,311 0.08
Government Bonds (0.00%) 2,311 0.08
less than 5 years to maturity
80,887,000 Ukraine (Republic of) 15.84% 2025 2,311 0.08
Uruguayan Peso Denominated Bonds (0.00%) 4,105 0.14
Government Bonds (0.00%) 4,105 0.14
less than 5 years to maturity
131,266,000 Uruguay (Republic of) 9.875% 2022 2,227 0.08
between 5 and 10 years to maturity
45,411,000 Uruguay (Republic of) 4.375% 2028 1,878 0.06
US Dollar Denominated Bonds (11.64%) 302,052 10.11
Corporate Bonds (7.02%) 282,886 9.47

30 ASI Global Absolute Return Strategies Fund
Holding InvestmentMarket Value
£’000
Percentageof total
net assets
less than 5 years to maturity
3,110,000 Adams Homes 7.5% 2025 2,363 0.08
1,431,000 Adient 9% 2025 1,152 0.04
2,424,000 Aethon United 8.25% 2026 1,815 0.06
646,000 Carnival 7.625% 2026 504 0.02
2,307,000 Carnival 10.5% 2026 1,960 0.07
155,000 CCO 5.75% 2026 116 -
1,605,000 CIFI 6% 2025 1,241 0.04
200,000 CIFI 6.45% 2024 155 0.01
1,201,000 Cirsa Finance International 7.875% 2023 891 0.03
1,443,000 Cleveland Cliffs 9.875% 2025 1,225 0.04
1,712,000 Colgate Energy 7.75% 2026 1,217 0.04
250,000 Crestwood Midstream Partners 5.75% 2025 182 0.01
1,135,000 CSN Resources 7.625% 2023 856 0.03
3,330,000 DISH DBS 5% 2023 2,519 0.08
216,000 Encompass Health 5.125% 2023 157 0.01
3,480,000 Enviva Partners 6.5% 2026 2,648 0.09
1,149,000 EQT 7.875% 2025 955 0.03
1,580,000 ESH Hospitality 5.25% 2025 1,167 0.04
3,916,000 Ford Motor Credit 4.389% 2026 2,995 0.10
675,000 GFL Environmental 3.75% 2025 497 0.02
4,279,000 Goodyear Tire & Rubber 9.5% 2025 3,476 0.12
4,964,000 HCA 5.375% 2025 4,014 0.13
3,202,396 Highlands Holdings Bond Issuer 7.625% 10/15/2025 2,489 0.08
5,915,000 Howmet Aerospace 6.875% 2025 4,965 0.17
2,540,000 Kraton Polymers 4.25% 2025 1,852 0.06
69,000 Macy's 3.625% 2024 50 -
1,886,000 Macy's 8.375% 2025 1,512 0.05
2,616,000 Navient 5.5% 2023 1,968 0.07
2,320,000 NCL 10.25% 2026 1,976 0.07
2,318,000 New Enterprise Stone & Lime Co 6.25% 2026 1,726 0.06
1,796,000 Occidental Petroleum 3.5% 2025 1,289 0.04
723,000 Occidental Petroleum 5.5% 2025 554 0.02
1,661,000 Rattler Midstream 5.625% 2025 1,257 0.04
922,000 Royal Caribbean Cruises 11.5% 2025 778 0.03
2,995,000 Sabre 7.375% 2025 2,367 0.08
1,289,000 Six Flags Theme Parks 7% 2025 1,009 0.03
2,566,000 Sixsigma Networks Mexico 7.5% 2025 1,632 0.05
2,000,000 Spirit AeroSystems 7.5% 2025 1,558 0.05
2,206,000 Sunac China 6.5% 2025 1,626 0.05
339,000 Sunac China 7.95% 2023 260 0.01
3,533,000 SunCoke Energy Partners 7.5% 2025 2,658 0.09

31ASI Global Absolute Return Strategies Fund
Holding InvestmentMarket Value
£’000
Percentageof total
net assets
5,145,000 Tenet Healthcare 4.625% 2024 3,796 0.13
1,987,000 Teva Pharmaceutical 7.125% 2025 1,591 0.05
2,212,000 Townsquare Media 6.875% 2026 1,707 0.06
594,000 Turkiye Garanti Bankasi 5.875% 2023 439 0.01
3,150,000 Turning Point 5.625% 2026 2,372 0.08
3,660,000 Valeant Pharmaceuticals 7% 2024 2,716 0.09
2,334,000 Wolverine World Wide 6.375% 2025 1,807 0.06
132,000 Wyndham Worldwide 4.15% 2024 104 -
2,294,000 ZF North America Capital 4.75% 2025 1,779 0.06
between 5 and 10 years to maturity
4,616,000 Academy 6% 2027 3,540 0.12
2,061,000 ACI Worldwide 5.75% 2026 1,578 0.05
2,351,000 Adient 4.875% 2026 1,762 0.06
1,650,000 American Airlines 5.5% 2026 1,245 0.04
2,553,000 Apergy 6.375% 2026 1,939 0.06
2,414,000 Avis 5.375% 2029 1,820 0.06
2,751,000 Ball 2.875% 2030 1,903 0.06
1,950,000 Bausch Health 8.5% 2027 1,570 0.05
2,663,000 Braskem Netherlands Finance 4.5% 2028 1,982 0.07
2,136,000 C&W Senior Financing DAC 6.875% 2027 1,651 0.06
1,273,000 CCO 5.375% 2029 994 0.03
440,000 Centene 4.25% 2027 335 0.01
1,588,000 Centene 4.625% 2029 1,243 0.04
1,290,000 CenturyLink 5.125% 2026 985 0.03
1,635,000 Cheniere Energy 4.5% 2029 1,231 0.04
1,672,000 Cheniere Energy 4.625% 2028 1,261 0.04
3,294,000 Cimpress 7% 2026 2,518 0.08
3,089,000 Clean Harbors 4.875% 2027 2,362 0.08
864,000 Consolidated Communications 5% 2028 632 0.02
2,469,000 Consolidated Communications 6.5% 2028 1,919 0.06
2,564,000 Continental Resources 4.375% 2028 1,954 0.07
1,616,000 Crestwood Midstream Partners 5.625% 2027 1,151 0.04
200,000 CSC 5.75% 2030 152 0.01
3,655,000 CSC 6.5% 2029 2,927 0.10
1,005,000 CSN Islands XI 6.75% 2028 773 0.03
430,000 CSN Resources 7.625% 2026 332 0.01
2,083,000 Encompass Health 4.5% 2028 1,544 0.05
595,000 Encompass Health 4.75% 2030 444 0.01
155,000 EQT 5% 2029 120 -
1,136,000 ESH Hospitality 4.625% 2027 870 0.03
1,068,000 Fair Isaac 4% 2028 795 0.03

32 ASI Global Absolute Return Strategies Fund
Holding InvestmentMarket Value
£’000
Percentageof total
net assets
2,347,000 Ford Motor 9.625% 2030 2,378 0.08
968,000 FXI 12.25% 2026 802 0.03
2,677,000 GCI 4.75% 2028 1,984 0.07
806,000 GFL Environmental 4% 2028 567 0.02
1,216,000 GFL Environmental 5.125% 2026 929 0.03
2,410,000 GLP Capital REIT 5.375% 2026 1,961 0.07
2,010,000 Hilcorp Energy 5.75% 2029 1,468 0.05
842,000 Hilcorp Energy 6% 2031 619 0.02
1,620,000 Icahn Enterprises 4.375% 2029 1,153 0.04
2,155,000 IHS Netherlands 8% 2027 1,688 0.06
2,921,000 Iron Mountain 4.875% 2029 2,141 0.07
3,083,000 JBS Investments II 5.75% 2028 2,357 0.08
935,000 Kraft Heinz 3% 2026 714 0.02
2,305,000 LCPR Senior Secured Financing 5.125% 2029 1,704 0.06
2,169,000 LD 6.125% 2028 1,595 0.05
2,461,000 Liquid Telecommunications 5.5% 2026 1,877 0.06
4,145,000 Logan Merger 5.5% 2027 3,147 0.11
1,316,000 Macy's 5.875% 2029 971 0.03
2,116,000 Marriott Ownership Resorts 4.75% 2028 1,549 0.05
4,902,000 MDC 3.85% 2030 3,716 0.12
1,405,000 Metinvest 8.5% 2026 1,136 0.04
1,396,000 MHP 6.95% 2026 1,060 0.04
3,080,000 Midcontinent Communications 5.375% 2027 2,323 0.08
2,654,000 Minerals Technologies 5% 2028 1,984 0.07
44,000 MPT Operating Partnership 5% 2027 34 -
4,127,000 NBM 7% 2026 3,218 0.11
1,673,000 Netflix 5.875% 2028 1,467 0.05
2,084,000 Nexstar Broadcasting 4.75% 2028 1,524 0.05
2,572,000 Nielsen Finance 5.625% 2028 1,970 0.07
2,540,000 Novelis 4.75% 2030 1,898 0.06
1,373,000 NRG Energy 3.375% 2029 972 0.03
1,887,000 NRG Energy 5.25% 2029 1,465 0.05
2,739,000 NRG Energy 6.625% 2027 2,070 0.07
736,000 NRG Energy 7.25% 2026 556 0.02
2,747,000 Occidental Petroleum 6.375% 2028 2,192 0.07
1,441,000 Occidental Petroleum 6.625% 2030 1,169 0.04
1,089,000 OneMain Finance 4% 2030 768 0.03
3,851,000 Photo Holdings Merger 8.5% 2026 3,026 0.10
2,118,000 Playtika 4.25% 2029 1,512 0.05
2,011,000 Qwest Capital Funding 6.875% 2028 1,600 0.05
2,130,000 Qwest Capital Funding 7.75% 2031 1,715 0.06
1,642,000 Rede D'or Finance 4.5% 2030 1,168 0.04

33ASI Global Absolute Return Strategies Fund
Holding InvestmentMarket Value
£’000
Percentageof total
net assets
1,595,000 Rede D'or Finance 4.95% 2028 1,190 0.04
1,553,000 Royal Caribbean Cruises 3.7% 2028 1,040 0.03
836,000 Royal Caribbean Cruises 5.5% 2028 608 0.02
2,727,000 Select Medical 6.25% 2026 2,106 0.07
1,898,000 Sirius XM Radio 5.5% 2029 1,487 0.05
1,510,000 Southwestern Energy 7.5% 2026 1,159 0.04
3,369,000 Staples 7.5% 2026 2,578 0.09
2,377,000 Sunoco 4.5% 2029 1,723 0.06
1,384,000 Tenneco 5.125% 2029 989 0.03
2,362,000 Teva Pharmaceutical 6.75% 2028 1,923 0.06
2,104,000 Trivium Packaging Finance 5.5% 2026 1,601 0.05
345,000 Twilio 3.625% 2029 254 0.01
969,000 Twilio 3.875% 2031 719 0.02
3,005,000 USA Compression Partners 6.875% 2027 2,243 0.08
1,928,000 VICI Properties 3.75% 2027 1,392 0.05
4,334,000 Vistra Operations 5.625% 2027 3,269 0.11
2,589,000 VTR Finance 6.375% 2028 2,027 0.07
2,195,000 WMG Acquisition 5.5% 2026 1,636 0.05
1,317,000 Wyndham Destinations 6.625% 2026 1,084 0.04
558,000 Ziggo 5.125% 2030 414 0.01
between 10 and 15 years to maturity
1,326,000 Encompass Health 4.625% 2031 995 0.03
1,250,000 FMG Resources August 2006 4.375% 2031 924 0.03
Perpetual
4,200,000 Australia & New Zealand Banking FRN Perpetual 2,689 0.09
1,400,000 Banco Bilbao Vizcaya Argentaria 6.5% fixed to floating Perpetual 1,096 0.04
3,520,000 Barclays 6.278% Perpetual 3,216 0.11
6,460,000 Barclays 7.75% fixed to floating Perpetual 5,108 0.17
3,910,000 BNP Paribas 6.625% fixed to floating Perpetual 3,104 0.10
4,990,000 Credit Suisse 6.25% Perpetual 3,851 0.13
3,990,000 Credit Suisse FRN Perpetual 3,011 0.10
4,090,000 Danske Bank 6.125% Perpetual 3,186 0.11
1,200,000 Deutsche 7.5% fixed to floating Perpetual 936 0.03
6,610,000 DNB Bank FRN Perpetual 4,165 0.14
1,420,000 General Motors Financial 5.75% fixed to floating Perpetual 1,079 0.04
6,365,000 Hongkong & Shanghai Banking FRN Perpetual 4,081 0.14
4,090,000 HSBC 6.25% fixed to floating Perpetual 3,134 0.11
3,940,000 ING 6.75% fixed to floating Perpetual 3,118 0.10
4,650,000 NatWest 0.5625% Perpetual 3,261 0.11
6,380,000 Societe Generale 0.62338% Perpetual 4,325 0.14

34 ASI Global Absolute Return Strategies Fund
Holding InvestmentMarket Value
£’000
Percentageof total
net assets
5,533,000 SoftBank 6% fixed to floating Perpetual 4,023 0.13
4,300,000 Standard Chartered 7.014% Perpetual 4,073 0.14
3,080,000 UBS 7% fixed to floating Perpetual 2,448 0.08
Government Bonds (4.62%) 19,166 0.64
less than 5 years to maturity
26,443,500 US Treasury 0% 2021 19,166 0.64
Equities (17.46%) 544,018 18.22
Emerging Market Equities (0.07%) 30,093 1.01
Argentina (0.00%) 5,951 0.20
5,577 MercadoLibre 5,951 0.20
Brazil (0.00%) 5,932 0.20
472,500 Vale 5,932 0.20
Chile (0.00%) 8,458 0.28
236,142 Antofagasta 3,989 0.13
109,864 Sociedad Quimica y Minera de Chile (Rights) 247 0.01
109,864 Sociedad Quimica y Minera de Chile ADR 4,222 0.14
Israel (0.07%) - -
Peru (0.00%) 5,421 0.18
110,206 Southern Copper 5,421 0.18
Russia (0.00%) 4,331 0.15
191,666 MMC Norilsk Nickel ADR 4,331 0.15
European Equities (8.34%) 95,204 3.19
Austria (0.03%) - -
Belgium (0.08%) - -
Denmark (1.03%) - -

35ASI Global Absolute Return Strategies Fund
Holding InvestmentMarket Value
£’000
Percentageof total
net assets
Finland (0.42%) - -
France (1.58%) 25,188 0.84
14,561 Eramet 751 0.03
36,125 Essilor 4,271 0.14
8,816 LVMH 4,266 0.14
44,411 Schneider Electric 4,926 0.16
270,758 Suez 4,166 0.14
47,127 Ubisoft Entertainment 2,605 0.09
56,484 Vinci 4,203 0.14
Germany (1.29%) 34,105 1.14
18,877 Adidas 4,268 0.14
144,181 BMW 10,852 0.36
71,258 Brenntag 4,418 0.15
159,902 Daimler 10,326 0.35
77,970 HelloFresh 4,241 0.14
Ireland (0.35%) 4,044 0.14
47,213 Medtronic 4,044 0.14
Italy (1.08%) - -
Netherlands (0.48%) 10,332 0.35
20,626 AMG Advanced Metallurgical 602 0.02
12,600 ASML 5,548 0.19
56,027 Heineken 4,182 0.14
Norway (0.20%) - -
Spain (0.44%) 5,617 0.19
2,276,313 Banco Santander 5,617 0.19
Sweden (0.66%) - -

36 ASI Global Absolute Return Strategies Fund
Holding InvestmentMarket Value
£’000
Percentageof total
net assets
Switzerland (0.70%) 15,918 0.53
83,481 Richemont (Cie Fin) Series 'A' 5,834 0.20
45,797 TE Connectivity 4,285 0.14
514,532 UBS 5,799 0.19
Japanese Equities (0.51%) 54,099 1.81
82,800 Advantest 5,252 0.18
57,300 Bandai Namco 2,965 0.10
151,000 Capcom 3,556 0.12
27,500 Fanuc 4,722 0.16
73,000 Konami 3,151 0.10
255,000 Kubota 4,212 0.14
433,700 Mitsubishi Electric 4,796 0.16
175,700 Nexon 4,132 0.14
10,000 Nintendo 4,054 0.14
379,800 Seiko Epson 4,484 0.15
34,800 Sony 2,646 0.09
17,100 Tokyo Electron 5,241 0.17
135,500 Yaskawa Electric 4,888 0.16
North American Equities (8.30%) 273,944 9.17
Canada (0.19%) 12,139 0.41
268,919 First Quantum Minerals 3,711 0.13
99,356 Nutrien 3,877 0.13
87,673 West Fraser Timber 4,551 0.15
United States (8.11%) 261,805 8.76
64,029 Activision Blizzard 4,316 0.14
100,143 ADM 4,137 0.14
55,287 Advanced Draine Systems 4,145 0.14
59,317 Advanced Micro Devices 3,375 0.11
40,879 AGCO 4,256 0.14
39,665 Albemarle 4,201 0.14
2,717 Alphabet 'A' 4,061 0.14
89,435 AO Smith 4,380 0.15
31,728 Avery Dennison 4,225 0.14
23,379 Boeing 4,314 0.14
150,989 Boston Scientific 4,230 0.14

37ASI Global Absolute Return Strategies Fund
Holding InvestmentMarket Value
£’000
Percentageof total
net assets
73,679 Bunge 4,233 0.14
62,745 Capital One Financial 5,786 0.19
114,747 CF Industries 3,774 0.13
25,939 Danaher 4,232 0.14
38,138 Deere & Co 10,345 0.35
94,655 Donaldson 3,992 0.13
128,873 Dow 5,973 0.20
41,976 Eaton 4,207 0.14
41,127 Electronic Arts 4,035 0.14
72,860 Emerson Electric 4,764 0.16
8,532 Equinix REIT 4,202 0.14
48,340 Fiserv 4,170 0.14
1,117,326 Ford 9,920 0.33
146,460 General Motors 6,101 0.20
28,353 Global Payments 4,143 0.14
23,963 Goldman Sachs 5,681 0.19
231,672 HP 5,331 0.18
11,386 IDEXX Laboratories 4,038 0.14
31,345 IPG Photonics 4,792 0.16
12,274 Lam Research 5,295 0.18
59,807 MasTec 4,066 0.14
26,548 McDonald's 4,312 0.14
133,774 Metlife 5,894 0.20
90,904 Micron Technology 5,813 0.19
14,271 Microsoft 2,439 0.08
43,088 MKS Instruments 5,790 0.19
10,847 NVIDIA 4,198 0.14
62,973 PACCAR 4,238 0.14
45,730 PNC Financial Services 5,814 0.19
46,226 Proto Labs 4,084 0.14
11,777 Regeneron Pharmaceuticals 4,039 0.14
125,467 Schwab (Charles) 5,927 0.20
73,410 Sensient Technologies 4,152 0.14
32,162 Siteone Landscape Supply 3,984 0.13
51,890 Starbucks 4,107 0.14
24,506 Take-Two Interactive Software 3,137 0.11
56,800 Teradyne 5,009 0.17
89,648 TJX 4,298 0.14
170,011 Trimble Navigation 9,586 0.32
93,478 Twitter 4,310 0.14
23,515 Valmont Industries 4,051 0.14
21,415 Waters 4,411 0.15

38 ASI Global Absolute Return Strategies Fund
Holding InvestmentMarket Value
£’000
Percentageof total
net assets
12,211 Zebra Technologies 4,294 0.14
432,594 Zynga 'A' 3,198 0.11
Pacific Basin Equities (0.18%) 59,994 2.01
Australia (0.10%) 20,800 0.70
153,377 BHP Billiton 3,833 0.13
467,796 Fortescue Metals 5,162 0.17
991,627 Galaxy Resources 1,385 0.05
1,208,000 MMG 487 0.02
389,333 National Australia Bank 5,577 0.19
7,586,955 Pilbara Minerals 4,356 0.14
China (0.00%) 15,696 0.52
8,439,000 China Molybdenum 'H' 3,690 0.12
453,000 Ganfeng Lithium 'H' 4,001 0.13
48,373 NetEase ADR 3,620 0.12
77,100 Tencent 4,385 0.15
40,028,409 Tianhe Chemicals* - -
Hong Kong (0.00%) 10,939 0.37
4,001,400 China Metal Recycling* - -
630,000 Galaxy Entertainment 4,111 0.14
85,700 Jardine Matheson 4,062 0.14
673,500 MTR 2,766 0.09
Malaysia (0.00%) 4,151 0.14
1,222,715 Lynas Rare Earths 4,151 0.14
Singapore (0.08%) 4,191 0.14
25,904 Sea ADR 4,191 0.14
South Korea (0.00%) 4,217 0.14
30,204 Hyundai Motor 4,217 0.14
UK Equities (0.06%) 30,684 1.03

39ASI Global Absolute Return Strategies Fund
Holding InvestmentMarket Value
£’000
Percentageof total
net assets
Basic Materials (0.00%) 22,085 0.74
340,590 Anglo American 9,680 0.32
1,412,630 Glencore 4,015 0.14
20,873 Linde 4,238 0.14
313,213 Tronox 'A' 4,152 0.14
Consumer Goods (0.06%) - -
Industrials (0.00%) 8,599 0.29
380,895 CNH Industrial 4,281 0.14
95,585 Pentair 4,318 0.15
Collective Investment Schemes (6.86%) 120,056 4.02
3,460 Aberdeen Standard Liquidity Fund (Lux) - Euro Fund Z3 Inc+ 2,920 0.10
114,487 Aberdeen Standard Liquidity Fund (Lux) - Sterling Fund Z1 Inc+ 114,487 3.83
3,655 Aberdeen Standard Liquidity Fund (Lux) - US Dollar Fund Z1 Inc+ 2,649 0.09
Exchange Traded Funds (0.00%) 175,794 5.88
45,320,000 iShares China CNY Bond UCITS ETF 175,794 5.88
Derivatives (3.65%) 71,018 2.38
Credit Default Swaps (1.30%) 49,054 1.64
USD 38,313,459 Buy CDX Emerging Markets Series 35 20/06/2026 0% 1,158 0.04
USD 85,250,000 Buy CDX Emerging Markets Series 35 20/06/2026 0% 2,577 0.09
USD 217,436,541 Buy CDX Emerging Markets Series 35 20/06/2026 0% 6,572 0.22
EUR 57,750,000 Sell iTraxx Europe Series 35 20/06/2026 5% 5,812 0.19
EUR 57,750,000 Sell iTraxx Europe Series 35 20/06/2026 5% 5,812 0.20
EUR 77,000,000 Sell iTraxx Europe Series 35 20/06/2026 5% 7,749 0.26
EUR 96,250,000 Sell iTraxx Europe Series 35 20/06/2026 5% 9,687 0.32
EUR 96,250,000 Sell iTraxx Europe Series 35 20/06/2026 5% 9,687 0.32
Equity Index Options (-0.29%) - -
Exchange Traded Options (-0.99%) - -
Forward Currency Contracts (1.16%) 23,365 0.78

40 ASI Global Absolute Return Strategies Fund
Holding InvestmentMarket Value
£’000
Percentageof total
net assets
Buy AUD 7,806,591 Sell GBP 4,348,535 13/04/2021 (39) -
Buy AUD 11,391,338 Sell GBP 6,327,378 13/04/2021 (39) -
Buy AUD 106,080,000 Sell USD 82,784,301 15/04/2021 (1,436) (0.05)
Buy AUD 205,920,000 Sell USD 160,703,056 22/04/2021 (2,787) (0.09)
Buy AUD 74,300,000 Sell USD 57,550,179 14/05/2021 (687) (0.02)
Buy BRL 68,523,970 Sell GBP 8,934,083 13/04/2021 (140) -
Buy BRL 71,185,161 Sell GBP 9,529,472 13/04/2021 (394) (0.01)
Buy BRL 5,150,000 Sell USD 957,019 20/04/2021 (33) -
Buy BRL 29,300,000 Sell USD 5,344,118 02/06/2021 (126) -
Buy CAD 2,459,375 Sell GBP 1,401,108 13/04/2021 17 -
Buy CAD 4,747,039 Sell GBP 2,688,825 13/04/2021 49 -
Buy CAD 15,000,000 Sell GBP 8,488,765 14/05/2021 161 0.01
Buy CAD 18,000,000 Sell GBP 10,244,236 14/05/2021 135 0.01
Buy CAD 67,300,000 Sell USD 53,093,966 14/06/2021 332 0.01
Buy CHF 9,900,000 Sell USD 11,165,398 14/05/2021 (459) (0.02)
Buy CLP 1,735,000,000 Sell USD 2,396,025 20/04/2021 14 -
Buy CLP 2,950,000,000 Sell USD 4,013,332 20/04/2021 68 -
Buy CNY 60,000,000 Sell GBP 6,593,289 14/05/2021 11 -
Buy COP 725,000,000 Sell USD 207,587 20/04/2021 (7) -
Buy COP 3,050,000,000 Sell USD 822,989 20/04/2021 5 -
Buy COP 32,450,000,000 Sell USD 8,917,530 20/04/2021 (64) -
Buy COP 5,740,000,000 Sell USD 1,593,514 02/06/2021 (24) -
Buy CZK 74,050,000 Sell USD 3,384,523 20/04/2021 (38) -
Buy CZK 530,422,339 Sell USD 24,656,918 20/04/2021 (572) (0.02)
Buy CZK 14,100,000 Sell USD 661,588 02/06/2021 (20) -
Buy DKK 443,629 Sell GBP 52,798 13/04/2021 (2) -
Buy DKK 9,380,347 Sell GBP 1,121,208 13/04/2021 (47) -
Buy DKK 12,117,675 Sell GBP 1,405,911 13/04/2021 (18) -
Buy DKK 12,790,650 Sell GBP 1,483,923 13/04/2021 (19) -
Buy DKK 14,352,783 Sell GBP 1,660,096 13/04/2021 (16) -
Buy DKK 14,679,431 Sell GBP 1,708,643 13/04/2021 (27) -
Buy DKK 15,551,458 Sell GBP 1,856,001 13/04/2021 (74) -
Buy DKK 30,364,103 Sell GBP 3,552,260 13/04/2021 (74) -
Buy DKK 30,749,550 Sell GBP 3,619,667 13/04/2021 (97) -
Buy DKK 43,414,533 Sell GBP 5,188,388 13/04/2021 (215) (0.01)
Buy EUR 18,609 Sell GBP 15,984 13/04/2021 - -
Buy EUR 294,561 Sell GBP 251,138 13/04/2021 - -
Buy EUR 428,685 Sell GBP 367,908 13/04/2021 (3) -
Buy EUR 432,510 Sell GBP 385,247 13/04/2021 (17) -
Buy EUR 491,919 Sell GBP 437,463 13/04/2021 (18) -
Buy EUR 497,113 Sell GBP 443,353 13/04/2021 (20) -
Buy EUR 629,677 Sell GBP 567,507 13/04/2021 (31) -

41ASI Global Absolute Return Strategies Fund
Holding InvestmentMarket Value
£’000
Percentageof total
net assets
Buy EUR 1,637,626 Sell GBP 1,435,645 13/04/2021 (40) -
Buy EUR 1,754,320 Sell GBP 1,526,528 13/04/2021 (32) -
Buy EUR 1,878,775 Sell GBP 1,629,066 13/04/2021 (28) -
Buy EUR 2,009,388 Sell GBP 1,744,113 13/04/2021 (32) -
Buy EUR 2,563,752 Sell GBP 2,216,002 13/04/2021 (32) -
Buy EUR 2,610,236 Sell GBP 2,270,885 13/04/2021 (47) -
Buy EUR 3,496,362 Sell GBP 3,070,827 13/04/2021 (92) -
Buy EUR 4,154,506 Sell GBP 3,648,869 13/04/2021 (109) -
Buy EUR 5,226,595 Sell GBP 4,626,446 13/04/2021 (173) (0.01)
Buy EUR 6,803,139 Sell GBP 6,026,065 13/04/2021 (229) (0.01)
Buy EUR 7,506,181 Sell GBP 6,493,808 13/04/2021 (98) -
Buy EUR 7,903,716 Sell GBP 6,841,751 13/04/2021 (107) -
Buy EUR 9,262,453 Sell GBP 8,135,138 13/04/2021 (243) (0.01)
Buy EUR 11,090,677 Sell GBP 9,648,804 13/04/2021 (199) (0.01)
Buy EUR 13,431,111 Sell GBP 11,619,630 13/04/2021 (176) (0.01)
Buy EUR 14,169,461 Sell GBP 12,170,374 13/04/2021 (97) -
Buy EUR 15,431,228 Sell GBP 13,553,124 13/04/2021 (405) (0.01)
Buy EUR 20,257,687 Sell GBP 17,430,369 13/04/2021 (170) (0.01)
Buy EUR 28,481,617 Sell GBP 24,577,685 13/04/2021 (310) (0.01)
Buy EUR 32,121,582 Sell GBP 28,129,319 13/04/2021 (760) (0.03)
Buy EUR 9,500,000 Sell GBP 8,292,867 04/05/2021 (195) (0.01)
Buy EUR 14,800,000 Sell GBP 12,803,258 04/05/2021 (188) (0.01)
Buy EUR 20,500,000 Sell GBP 17,817,923 04/05/2021 (345) (0.01)
Buy EUR 30,000,000 Sell GBP 26,160,660 04/05/2021 (590) (0.02)
Buy EUR 30,000,000 Sell GBP 26,164,470 04/05/2021 (594) (0.02)
Buy EUR 30,000,000 Sell GBP 26,171,775 04/05/2021 (601) (0.02)
Buy EUR 283,200,000 Sell GBP 242,823,892 04/05/2021 (1,435) (0.05)
Buy EUR 147,967,135 Sell JPY 19,110,000,000 04/06/2021 798 0.03
Buy EUR 25,500,000 Sell USD 31,258,665 14/05/2021 (914) (0.03)
Buy EUR 43,800,000 Sell USD 51,411,564 14/05/2021 83 -
Buy GBP 234,128 Sell AUD 411,401 13/04/2021 7 -
Buy GBP 1,371,527 Sell AUD 2,432,426 13/04/2021 29 -
Buy GBP 1,930,113 Sell AUD 3,466,485 13/04/2021 16 -
Buy GBP 3,530,478 Sell AUD 6,170,499 13/04/2021 124 -
Buy GBP 7,411,512 Sell AUD 13,104,182 13/04/2021 177 0.01
Buy GBP 8,120,535 Sell AUD 14,378,196 13/04/2021 183 0.01
Buy GBP 13,632,327 Sell AUD 24,291,341 13/04/2021 222 0.01
Buy GBP 9,460,067 Sell BRL 70,679,288 13/04/2021 390 0.01
Buy GBP 14,281,029 Sell BRL 107,999,431 13/04/2021 421 0.01
Buy GBP 1,506,407 Sell CAD 2,619,147 13/04/2021 (4) -
Buy GBP 1,612,331 Sell CAD 2,823,497 13/04/2021 (16) -
Buy GBP 1,889,376 Sell CAD 3,275,656 13/04/2021 - -

42 ASI Global Absolute Return Strategies Fund
Holding InvestmentMarket Value
£’000
Percentageof total
net assets
Buy GBP 2,096,839 Sell CAD 3,637,291 13/04/2021 (1) -
Buy GBP 2,196,209 Sell CAD 3,809,722 13/04/2021 (1) -
Buy GBP 2,849,941 Sell CAD 5,007,399 13/04/2021 (38) -
Buy GBP 3,232,751 Sell CAD 5,655,848 13/04/2021 (29) -
Buy GBP 8,081,069 Sell CAD 14,000,000 14/05/2021 8 -
Buy GBP 10,980,412 Sell CAD 19,000,000 14/05/2021 24 -
Buy GBP 1,435,737 Sell CHF 1,732,707 13/04/2021 101 -
Buy GBP 2,068,653 Sell CHF 2,668,521 13/04/2021 13 -
Buy GBP 3,063,998 Sell CHF 3,655,754 13/04/2021 248 0.01
Buy GBP 4,793,324 Sell CHF 5,890,002 13/04/2021 256 0.01
Buy GBP 6,687,085 Sell CNY 60,000,000 14/05/2021 83 -
Buy GBP 9,381 Sell DKK 80,700 13/04/2021 - -
Buy GBP 22,369,549 Sell DKK 183,763,485 13/04/2021 1,318 0.04
Buy GBP 8,834 Sell EUR 10,207 13/04/2021 - -
Buy GBP 429,531 Sell EUR 483,000 13/04/2021 18 -
Buy GBP 429,934 Sell EUR 483,225 13/04/2021 18 -
Buy GBP 444,480 Sell EUR 507,563 13/04/2021 12 -
Buy GBP 463,013 Sell EUR 541,000 13/04/2021 2 -
Buy GBP 514,817 Sell EUR 601,529 13/04/2021 2 -
Buy GBP 717,829 Sell EUR 842,000 13/04/2021 - -
Buy GBP 788,113 Sell EUR 883,669 13/04/2021 35 -
Buy GBP 838,577 Sell EUR 940,768 13/04/2021 37 -
Buy GBP 872,032 Sell EUR 992,872 13/04/2021 26 -
Buy GBP 1,081,348 Sell EUR 1,200,000 13/04/2021 59 -
Buy GBP 1,255,461 Sell EUR 1,451,172 13/04/2021 19 -
Buy GBP 1,705,047 Sell EUR 1,888,782 13/04/2021 96 -
Buy GBP 2,020,656 Sell EUR 2,272,190 13/04/2021 85 -
Buy GBP 2,442,761 Sell EUR 2,851,221 13/04/2021 13 -
Buy GBP 2,603,952 Sell EUR 2,928,095 13/04/2021 109 -
Buy GBP 3,218,894 Sell EUR 3,775,873 13/04/2021 2 -
Buy GBP 3,913,166 Sell EUR 4,495,794 13/04/2021 83 -
Buy GBP 4,123,341 Sell EUR 4,811,529 13/04/2021 24 -
Buy GBP 5,009,811 Sell EUR 5,843,400 13/04/2021 31 -
Buy GBP 6,803,389 Sell EUR 7,983,549 13/04/2021 1 -
Buy GBP 7,607,939 Sell EUR 8,880,321 13/04/2021 41 -
Buy GBP 9,260,644 Sell EUR 10,415,610 13/04/2021 386 0.01
Buy GBP 9,473,445 Sell EUR 10,570,375 13/04/2021 467 0.02
Buy GBP 11,391,393 Sell EUR 12,598,117 13/04/2021 657 0.02
Buy GBP 16,322,568 Sell EUR 18,556,259 13/04/2021 512 0.02
Buy GBP 20,448,710 Sell EUR 23,127,734 13/04/2021 743 0.03
Buy GBP 51,203,108 Sell EUR 56,519,601 13/04/2021 3,045 0.10
Buy GBP 198,570,816 Sell EUR 226,248,857 13/04/2021 5,795 0.19

43ASI Global Absolute Return Strategies Fund
Holding InvestmentMarket Value
£’000
Percentageof total
net assets
Buy GBP 366,026,298 Sell EUR 418,000,000 04/05/2021 9,734 0.33
Buy GBP 761,905 Sell EUR 880,128 04/06/2021 11 -
Buy GBP 38,974,320 Sell EUR 45,000,000 10/06/2021 590 0.02
Buy GBP 463,362 Sell HKD 4,937,035 13/04/2021 3 -
Buy GBP 704,422 Sell HKD 7,430,627 13/04/2021 12 -
Buy GBP 944,446 Sell HKD 10,009,567 13/04/2021 11 -
Buy GBP 1,803,120 Sell HKD 19,357,293 13/04/2021 (1) -
Buy GBP 1,828,290 Sell HKD 19,359,516 13/04/2021 23 -
Buy GBP 4,978,173 Sell HKD 53,368,087 13/04/2021 3 -
Buy GBP 8,406,260 Sell HKD 88,901,920 13/04/2021 118 -
Buy GBP 8,546,168 Sell HKD 92,211,299 13/04/2021 (50) -
Buy GBP 8,589,134 Sell HKD 90,951,007 13/04/2021 110 -
Buy GBP 9,056,654 Sell HKD 96,733,043 13/04/2021 38 -
Buy GBP 1,100,440 Sell JPY 167,215,527 13/04/2021 4 -
Buy GBP 2,449,147 Sell JPY 346,682,250 13/04/2021 175 0.01
Buy GBP 8,733,356 Sell JPY 1,241,306,576 13/04/2021 590 0.02
Buy GBP 8,945,254 Sell JPY 1,288,144,765 13/04/2021 495 0.02
Buy GBP 16,723,917 Sell JPY 2,409,254,196 13/04/2021 919 0.03
Buy GBP 22,610,990 Sell JPY 3,269,251,603 13/04/2021 1,165 0.04
Buy GBP 46,906,317 Sell JPY 6,573,315,246 13/04/2021 3,786 0.13
Buy GBP 11,280,839 Sell KRW 16,717,978,533 13/04/2021 535 0.02
Buy GBP 11,283,961 Sell KRW 16,717,978,532 13/04/2021 538 0.02
Buy GBP 9,591,038 Sell RUB 1,000,000,000 10/06/2021 83 -
Buy GBP 199,275 Sell SEK 2,242,567 13/04/2021 13 -
Buy GBP 7,626,117 Sell SEK 84,756,459 13/04/2021 578 0.02
Buy GBP 4,873 Sell THB 203,139 16/04/2021 - -
Buy GBP 9,573,325 Sell THB 390,397,332 16/04/2021 520 0.02
Buy GBP 166,445 Sell USD 227,287 13/04/2021 2 -
Buy GBP 200,669 Sell USD 278,415 13/04/2021 (1) -
Buy GBP 201,211 Sell USD 284,844 13/04/2021 (5) -
Buy GBP 201,919 Sell USD 282,000 13/04/2021 (2) -
Buy GBP 202,102 Sell USD 281,269 13/04/2021 (2) -
Buy GBP 202,556 Sell USD 282,705 13/04/2021 (2) -
Buy GBP 209,406 Sell USD 290,587 13/04/2021 (1) -
Buy GBP 209,664 Sell USD 290,946 13/04/2021 (1) -
Buy GBP 227,504 Sell USD 311,732 13/04/2021 2 -
Buy GBP 229,143 Sell USD 317,920 13/04/2021 (1) -
Buy GBP 233,855 Sell USD 325,839 13/04/2021 (2) -
Buy GBP 292,298 Sell USD 407,330 13/04/2021 (3) -
Buy GBP 292,652 Sell USD 401,000 13/04/2021 2 -
Buy GBP 300,510 Sell USD 416,258 13/04/2021 (1) -
Buy GBP 308,403 Sell USD 421,000 13/04/2021 3 -

44 ASI Global Absolute Return Strategies Fund
Holding InvestmentMarket Value
£’000
Percentageof total
net assets
Buy GBP 318,410 Sell USD 435,490 13/04/2021 3 -
Buy GBP 321,622 Sell USD 439,828 13/04/2021 3 -
Buy GBP 337,508 Sell USD 460,721 13/04/2021 4 -
Buy GBP 343,368 Sell USD 480,680 13/04/2021 (5) -
Buy GBP 348,071 Sell USD 492,000 13/04/2021 (9) -
Buy GBP 352,964 Sell USD 489,673 13/04/2021 (2) -
Buy GBP 473,579 Sell USD 655,000 13/04/2021 (1) -
Buy GBP 543,665 Sell USD 734,057 13/04/2021 12 -
Buy GBP 574,001 Sell USD 785,061 13/04/2021 5 -
Buy GBP 610,020 Sell USD 836,000 13/04/2021 4 -
Buy GBP 627,621 Sell USD 865,920 13/04/2021 - -
Buy GBP 701,069 Sell USD 976,372 13/04/2021 (7) -
Buy GBP 723,220 Sell USD 991,141 13/04/2021 5 -
Buy GBP 751,620 Sell USD 1,037,000 13/04/2021 - -
Buy GBP 756,991 Sell USD 1,054,558 13/04/2021 (7) -
Buy GBP 780,729 Sell USD 1,061,853 13/04/2021 11 -
Buy GBP 870,555 Sell USD 1,184,148 13/04/2021 12 -
Buy GBP 889,534 Sell USD 1,214,986 13/04/2021 9 -
Buy GBP 894,609 Sell USD 1,221,201 13/04/2021 10 -
Buy GBP 952,635 Sell USD 1,317,808 13/04/2021 (2) -
Buy GBP 974,029 Sell USD 1,315,144 13/04/2021 21 -
Buy GBP 1,003,126 Sell USD 1,384,000 13/04/2021 - -
Buy GBP 1,129,167 Sell USD 1,562,010 13/04/2021 (3) -
Buy GBP 1,268,481 Sell USD 1,725,235 13/04/2021 18 -
Buy GBP 1,312,799 Sell USD 1,801,000 13/04/2021 7 -
Buy GBP 1,486,503 Sell USD 2,059,062 13/04/2021 (6) -
Buy GBP 1,526,277 Sell USD 2,085,675 13/04/2021 15 -
Buy GBP 1,573,905 Sell USD 2,148,485 13/04/2021 17 -
Buy GBP 1,686,426 Sell USD 2,313,670 13/04/2021 10 -
Buy GBP 1,727,469 Sell USD 2,418,280 13/04/2021 (25) -
Buy GBP 1,744,973 Sell USD 2,442,783 13/04/2021 (25) -
Buy GBP 1,753,094 Sell USD 2,385,073 13/04/2021 24 -
Buy GBP 1,765,406 Sell USD 2,461,000 13/04/2021 (18) -
Buy GBP 1,781,757 Sell USD 2,482,958 13/04/2021 (18) -
Buy GBP 1,808,086 Sell USD 2,472,920 13/04/2021 16 -
Buy GBP 1,871,920 Sell USD 2,613,000 13/04/2021 (22) -
Buy GBP 2,076,844 Sell USD 2,872,450 13/04/2021 (5) -
Buy GBP 2,107,696 Sell USD 2,883,985 13/04/2021 17 -
Buy GBP 2,127,574 Sell USD 2,909,517 13/04/2021 19 -
Buy GBP 3,200,637 Sell USD 4,530,969 13/04/2021 (83) -
Buy GBP 3,254,421 Sell USD 4,429,890 13/04/2021 44 -
Buy GBP 3,544,687 Sell USD 4,816,538 13/04/2021 54 -

45ASI Global Absolute Return Strategies Fund
Holding InvestmentMarket Value
£’000
Percentageof total
net assets
Buy GBP 3,596,542 Sell USD 4,887,000 13/04/2021 55 -
Buy GBP 7,137,868 Sell USD 9,823,691 13/04/2021 18 -
Buy GBP 8,124,816 Sell USD 11,229,089 13/04/2021 (14) -
Buy GBP 8,523,938 Sell USD 11,685,822 13/04/2021 54 -
Buy GBP 8,867,901 Sell USD 12,087,560 13/04/2021 107 -
Buy GBP 10,416,021 Sell USD 14,498,742 13/04/2021 (92) -
Buy GBP 12,169,038 Sell USD 16,707,477 13/04/2021 60 -
Buy GBP 13,435,394 Sell USD 18,513,503 13/04/2021 17 -
Buy GBP 14,348,305 Sell USD 19,502,785 13/04/2021 213 0.01
Buy GBP 19,144,674 Sell USD 26,643,997 13/04/2021 (166) (0.01)
Buy GBP 20,697,394 Sell USD 28,776,374 13/04/2021 (159) (0.01)
Buy GBP 28,279,353 Sell USD 38,462,154 13/04/2021 403 0.01
Buy GBP 35,513,808 Sell USD 47,951,098 13/04/2021 761 0.03
Buy GBP 46,813,411 Sell USD 64,309,494 13/04/2021 204 0.01
Buy GBP 309,881,862 Sell USD 422,839,595 13/04/2021 3,423 0.11
Buy GBP 12,631 Sell USD 17,252 20/04/2021 - -
Buy GBP 160,855,625 Sell USD 222,616,094 18/05/2021 (471) (0.02)
Buy GBP 196,598,976 Sell USD 272,086,338 18/05/2021 (579) (0.02)
Buy GBP 8,897,248 Sell USD 12,266,740 19/05/2021 8 -
Buy GBP 139,433,292 Sell USD 192,848,931 19/05/2021 (321) (0.01)
Buy GBP 1,377 Sell USD 1,951 02/06/2021 - -
Buy GBP 1,500 Sell USD 2,126 02/06/2021 - -
Buy GBP 2,958 Sell USD 4,128 02/06/2021 - -
Buy GBP 8,099 Sell USD 11,476 02/06/2021 - -
Buy GBP 19,720 Sell USD 27,940 02/06/2021 (1) -
Buy GBP 21,390 Sell USD 30,306 02/06/2021 (1) -
Buy GBP 23,162 Sell USD 32,817 02/06/2021 (1) -
Buy GBP 339,958 Sell USD 473,198 02/06/2021 (3) -
Buy GBP 21,238 Sell USD 30,088 03/06/2021 (1) -
Buy GBP 299,484 Sell USD 416,862 03/06/2021 (3) -
Buy GBP 1,676,661 Sell USD 2,330,000 10/06/2021 (12) -
Buy GBP 6,073,507 Sell USD 8,500,000 10/06/2021 (86) -
Buy GBP 7,890,808 Sell USD 11,000,000 10/06/2021 (80) -
Buy GBP 13,619,218 Sell USD 19,000,000 10/06/2021 (149) -
Buy GBP 14,486,030 Sell USD 20,000,000 10/06/2021 (7) -
Buy GBP 88,544,373 Sell USD 123,000,000 10/06/2021 (586) (0.02)
Buy GBP 151,628,347 Sell USD 210,670,000 10/06/2021 (1,031) (0.03)
Buy GBP 51,000,000 Sell USD 70,284,579 14/06/2021 70 -
Buy GBP 11,541,497 Sell ZAR 243,314,370 13/04/2021 (380) (0.01)
Buy GBP 61,560,229 Sell ZAR 1,276,758,110 13/04/2021 (993) (0.03)
Buy GBP 68,943,409 Sell ZAR 1,441,498,721 13/04/2021 (1,683) (0.06)
Buy HKD 24,015,121 Sell GBP 2,188,886 13/04/2021 50 -

46 ASI Global Absolute Return Strategies Fund
Holding InvestmentMarket Value
£’000
Percentageof total
net assets
Buy HKD 35,823,089 Sell GBP 3,316,327 13/04/2021 23 -
Buy HKD 39,690,417 Sell GBP 3,683,236 13/04/2021 17 -
Buy HKD 49,438,765 Sell GBP 4,564,740 13/04/2021 44 -
Buy HKD 89,226,480 Sell GBP 8,232,854 13/04/2021 85 -
Buy HUF 183,600,000 Sell USD 620,134 20/04/2021 (18) -
Buy HUF 728,000,000 Sell USD 2,457,577 02/06/2021 (71) -
Buy IDR 5,850,000,000 Sell USD 413,719 20/04/2021 (9) -
Buy IDR 34,100,000,000 Sell USD 2,364,131 20/04/2021 (20) -
Buy IDR 79,800,000,000 Sell USD 5,591,367 02/06/2021 (113) -
Buy INR 186,500,000 Sell USD 2,546,422 20/04/2021 (5) -
Buy INR 1,215,000,000 Sell USD 16,420,250 11/05/2021 51 -
Buy INR 1,410,000,000 Sell USD 19,067,710 24/05/2021 22 -
Buy INR 1,485,000,000 Sell USD 20,045,923 24/05/2021 50 -
Buy INR 70,200,000 Sell USD 956,129 02/06/2021 (5) -
Buy INR 3,720,000,000 Sell USD 50,000,940 04/06/2021 221 0.01
Buy INR 2,000,000,000 Sell USD 27,229,407 11/06/2021 (152) -
Buy JPY 19,110,000,000 Sell EUR 147,087,007 04/06/2021 (47) -
Buy JPY 110,189,509 Sell GBP 730,668 13/04/2021 (8) -
Buy JPY 336,318,707 Sell GBP 2,215,655 13/04/2021 (9) -
Buy JPY 378,660,933 Sell GBP 2,525,012 13/04/2021 (41) -
Buy JPY 503,695,884 Sell GBP 3,481,671 13/04/2021 (177) (0.01)
Buy JPY 1,822,336,225 Sell GBP 12,040,296 13/04/2021 (86) -
Buy JPY 2,958,958,897 Sell GBP 19,612,329 13/04/2021 (202) (0.01)
Buy JPY 964,000,000 Sell USD 9,228,859 14/05/2021 (363) (0.01)
Buy JPY 3,240,000,000 Sell USD 31,209,062 14/05/2021 (1,359) (0.05)
Buy JPY 3,750,000,000 Sell USD 35,619,470 14/05/2021 (1,209) (0.04)
Buy KRW 27,100,123,876 Sell GBP 17,114,714 13/04/2021 302 0.01
Buy KRW 87,360,000,000 Sell USD 80,014,654 15/04/2021 (1,848) (0.06)
Buy KRW 171,820,000,000 Sell USD 156,333,594 22/04/2021 (2,884) (0.10)
Buy KRW 171,820,000,000 Sell USD 155,720,098 10/05/2021 (2,442) (0.08)
Buy KRW 18,180,000,000 Sell USD 16,288,717 11/05/2021 (122) -
Buy KRW 22,220,000,000 Sell USD 19,913,070 24/05/2021 (152) (0.01)
Buy KRW 23,000,000,000 Sell USD 20,468,278 24/05/2021 (54) -
Buy KRW 56,700,000,000 Sell USD 50,690,626 04/06/2021 (299) (0.01)
Buy KRW 33,100,000,000 Sell USD 29,332,061 11/06/2021 14 -
Buy MXN 27,500,000 Sell USD 1,353,937 20/04/2021 (9) -
Buy MXN 1,070,000,000 Sell USD 51,336,180 01/06/2021 431 0.01
Buy MXN 1,150,000,000 Sell USD 54,758,684 01/06/2021 765 0.03
Buy MXN 52,608,000 Sell USD 2,513,499 02/06/2021 29 -
Buy MXN 1,416,000,000 Sell USD 67,653,509 02/06/2021 771 0.03
Buy MXN 56,992,000 Sell USD 2,726,186 03/06/2021 28 -
Buy MXN 1,534,000,000 Sell USD 73,378,194 03/06/2021 767 0.03

47ASI Global Absolute Return Strategies Fund
Holding InvestmentMarket Value
£’000
Percentageof total
net assets
Buy MXN 580,000,000 Sell USD 27,886,224 11/06/2021 169 0.01
Buy MYR 3,160,000 Sell USD 780,169 02/06/2021 (14) -
Buy NOK 86,500,000 Sell USD 10,017,103 14/05/2021 84 -
Buy NOK 264,000,000 Sell USD 31,290,001 14/05/2021 (263) (0.01)
Buy NOK 301,000,000 Sell USD 34,995,995 14/05/2021 192 0.01
Buy NZD 8,110,000 Sell USD 5,912,031 14/05/2021 (169) (0.01)
Buy PEN 9,400,000 Sell USD 2,603,301 20/04/2021 (76) -
Buy PEN 12,500,000 Sell USD 3,422,266 20/04/2021 (72) -
Buy PEN 21,600,000 Sell USD 5,979,702 20/04/2021 (173) (0.01)
Buy PEN 5,550,000 Sell USD 1,517,222 02/06/2021 (31) -
Buy RON 1,185,000 Sell USD 294,606 20/04/2021 (9) -
Buy RON 4,530,000 Sell USD 1,123,607 02/06/2021 (33) -
Buy RUB 308,700,000 Sell USD 4,172,851 20/04/2021 (69) -
Buy RUB 111,000,000 Sell USD 1,478,243 02/06/2021 (15) -
Buy SEK 7,394 Sell GBP 642 13/04/2021 - -
Buy SEK 1,898,492 Sell GBP 167,250 13/04/2021 (9) -
Buy SEK 13,774,613 Sell GBP 1,215,109 13/04/2021 (70) -
Buy SEK 17,816,220 Sell GBP 1,549,141 13/04/2021 (68) -
Buy SEK 53,502,298 Sell GBP 4,649,652 13/04/2021 (200) (0.01)
Buy SEK 153,000,000 Sell USD 17,547,121 14/05/2021 10 -
Buy SEK 226,000,000 Sell USD 26,786,258 14/05/2021 (614) (0.02)
Buy SEK 595,000,000 Sell USD 71,219,990 14/05/2021 (2,123) (0.07)
Buy THB 31,869,615 Sell GBP 765,532 16/04/2021 (26) -
Buy THB 358,730,341 Sell GBP 8,683,756 16/04/2021 (365) (0.01)
Buy THB 44,800,000 Sell USD 1,490,769 20/04/2021 (42) -
Buy THB 331,000,000 Sell USD 10,829,167 20/04/2021 (173) (0.01)
Buy THB 499,050,000 Sell USD 16,578,494 11/05/2021 (443) (0.01)
Buy THB 594,000,000 Sell USD 19,708,029 24/05/2021 (510) (0.02)
Buy THB 609,950,000 Sell USD 20,259,744 24/05/2021 (540) (0.02)
Buy THB 102,400,000 Sell USD 3,403,639 02/06/2021 (93) -
Buy THB 1,530,000,000 Sell USD 50,513,387 04/06/2021 (1,135) (0.04)
Buy THB 936,000,000 Sell USD 30,383,691 11/06/2021 (319) (0.01)
Buy TRY 186,350,000 Sell USD 21,949,352 19/04/2021 175 0.01
Buy TRY 33,300,000 Sell USD 4,350,609 20/04/2021 (281) (0.01)
Buy TRY 36,700,000 Sell USD 4,790,497 20/04/2021 (307) (0.01)
Buy TRY 116,350,000 Sell USD 15,144,676 20/04/2021 (943) (0.03)
Buy USD 82,543,181 Sell AUD 106,080,000 15/04/2021 1,261 0.04
Buy USD 164,237,184 Sell AUD 211,960,000 22/04/2021 2,013 0.07
Buy USD 163,331,140 Sell AUD 211,960,000 10/05/2021 1,348 0.05
Buy USD 26,374,023 Sell AUD 34,600,000 14/05/2021 11 -
Buy USD 30,386,856 Sell AUD 39,700,000 14/05/2021 104 -
Buy USD 51,393,960 Sell AUD 67,500,000 14/05/2021 (20) -

48 ASI Global Absolute Return Strategies Fund
Holding InvestmentMarket Value
£’000
Percentageof total
net assets
Buy USD 974,271 Sell BRL 5,150,000 20/04/2021 46 -
Buy USD 3,645,481 Sell BRL 20,500,000 20/04/2021 12 -
Buy USD 5,886,313 Sell BRL 34,100,000 20/04/2021 (108) -
Buy USD 16,053,119 Sell BRL 85,815,000 11/05/2021 643 0.02
Buy USD 19,579,799 Sell BRL 104,885,000 24/05/2021 771 0.03
Buy USD 21,173,061 Sell BRL 114,000,000 24/05/2021 759 0.03
Buy USD 5,376,936 Sell BRL 29,300,000 02/06/2021 151 0.01
Buy USD 50,061,463 Sell BRL 281,000,000 04/06/2021 356 0.01
Buy USD 42,164,320 Sell BRL 245,000,000 10/06/2021 (754) (0.03)
Buy USD 31,276,100 Sell BRL 176,000,000 11/06/2021 179 0.01
Buy USD 53,395,874 Sell CAD 67,300,000 14/06/2021 (113) -
Buy USD 14,555,960 Sell CHF 13,200,000 14/05/2021 372 0.01
Buy USD 26,883,452 Sell CHF 24,200,000 14/05/2021 824 0.03
Buy USD 41,590,144 Sell CHF 36,800,000 14/05/2021 1,767 0.06
Buy USD 11,334,493 Sell CLP 8,366,500,000 20/04/2021 (227) (0.01)
Buy USD 81,381,008 Sell CNY 530,000,000 02/06/2021 723 0.02
Buy USD 79,827,779 Sell CNY 520,000,000 07/06/2021 719 0.02
Buy USD 81,295,824 Sell CNY 530,000,000 11/06/2021 702 0.02
Buy USD 4,850,668 Sell COP 17,500,000,000 20/04/2021 65 -
Buy USD 10,176,731 Sell COP 35,500,000,000 20/04/2021 375 0.01
Buy USD 16,512,336 Sell COP 58,365,000,000 11/05/2021 463 0.02
Buy USD 19,865,319 Sell COP 70,800,000,000 24/05/2021 447 0.01
Buy USD 20,214,972 Sell COP 71,335,000,000 24/05/2021 595 0.02
Buy USD 1,595,641 Sell COP 5,740,000,000 02/06/2021 26 -
Buy USD 50,441,361 Sell COP 184,000,000,000 04/06/2021 317 0.01
Buy USD 26,506,953 Sell COP 94,800,000,000 10/06/2021 545 0.02
Buy USD 27,261,449 Sell COP 97,000,000,000 11/06/2021 660 0.02
Buy USD 7,376,215 Sell CZK 160,000,000 20/04/2021 128 -
Buy USD 657,367 Sell CZK 14,100,000 02/06/2021 17 -
Buy USD 10,693,151 Sell CZK 236,000,000 10/06/2021 53 -
Buy USD 30,920,637 Sell EUR 25,500,000 14/05/2021 668 0.02
Buy USD 1,385,330 Sell GBP 1,007,069 06/04/2021 (3) -
Buy USD 61,125 Sell GBP 44,739 13/04/2021 - -
Buy USD 125,507 Sell GBP 90,467 13/04/2021 - -
Buy USD 164,073 Sell GBP 118,092 13/04/2021 1 -
Buy USD 282,705 Sell GBP 202,894 13/04/2021 2 -
Buy USD 290,946 Sell GBP 209,262 13/04/2021 2 -
Buy USD 393,953 Sell GBP 287,912 13/04/2021 (2) -
Buy USD 408,159 Sell GBP 296,567 13/04/2021 (1) -
Buy USD 428,367 Sell GBP 313,062 13/04/2021 (3) -
Buy USD 435,269 Sell GBP 310,929 13/04/2021 5 -
Buy USD 459,501 Sell GBP 332,295 13/04/2021 1 -

49ASI Global Absolute Return Strategies Fund
Holding InvestmentMarket Value
£’000
Percentageof total
net assets
Buy USD 497,535 Sell GBP 356,908 13/04/2021 4 -
Buy USD 508,400 Sell GBP 364,943 13/04/2021 4 -
Buy USD 570,877 Sell GBP 413,773 13/04/2021 - -
Buy USD 583,004 Sell GBP 421,934 13/04/2021 1 -
Buy USD 583,398 Sell GBP 419,363 13/04/2021 3 -
Buy USD 668,918 Sell GBP 482,167 13/04/2021 3 -
Buy USD 753,480 Sell GBP 539,783 13/04/2021 6 -
Buy USD 786,759 Sell GBP 571,738 13/04/2021 (2) -
Buy USD 787,605 Sell GBP 575,213 13/04/2021 (4) -
Buy USD 978,588 Sell GBP 703,023 13/04/2021 6 -
Buy USD 1,111,691 Sell GBP 817,123 13/04/2021 (11) -
Buy USD 1,116,932 Sell GBP 803,353 13/04/2021 6 -
Buy USD 1,201,894 Sell GBP 882,972 13/04/2021 (12) -
Buy USD 1,315,144 Sell GBP 966,924 13/04/2021 (14) -
Buy USD 1,410,129 Sell GBP 997,495 13/04/2021 25 -
Buy USD 1,437,014 Sell GBP 1,043,123 13/04/2021 (2) -
Buy USD 1,472,040 Sell GBP 1,061,050 13/04/2021 6 -
Buy USD 1,480,865 Sell GBP 1,080,746 13/04/2021 (7) -
Buy USD 1,502,886 Sell GBP 1,071,328 13/04/2021 18 -
Buy USD 1,749,306 Sell GBP 1,262,880 13/04/2021 5 -
Buy USD 1,985,743 Sell GBP 1,455,504 13/04/2021 (16) -
Buy USD 2,147,667 Sell GBP 1,543,805 13/04/2021 13 -
Buy USD 2,167,217 Sell GBP 1,572,925 13/04/2021 (2) -
Buy USD 2,300,454 Sell GBP 1,681,220 13/04/2021 (14) -
Buy USD 2,458,654 Sell GBP 1,782,820 13/04/2021 (1) -
Buy USD 2,695,948 Sell GBP 1,973,246 13/04/2021 (19) -
Buy USD 3,109,157 Sell GBP 2,263,278 13/04/2021 (10) -
Buy USD 3,111,029 Sell GBP 2,251,528 13/04/2021 3 -
Buy USD 3,302,182 Sell GBP 2,372,306 13/04/2021 21 -
Buy USD 3,764,182 Sell GBP 2,741,848 13/04/2021 (14) -
Buy USD 3,810,464 Sell GBP 2,822,127 13/04/2021 (60) -
Buy USD 4,120,490 Sell GBP 2,958,601 13/04/2021 28 -
Buy USD 4,228,186 Sell GBP 3,090,074 13/04/2021 (26) -
Buy USD 4,576,430 Sell GBP 3,278,497 13/04/2021 38 -
Buy USD 5,117,465 Sell GBP 3,671,903 13/04/2021 37 -
Buy USD 6,354,142 Sell GBP 4,640,634 13/04/2021 (35) -
Buy USD 6,466,949 Sell GBP 4,717,059 13/04/2021 (30) -
Buy USD 7,043,178 Sell GBP 5,154,128 13/04/2021 (49) -
Buy USD 7,533,826 Sell GBP 5,429,105 13/04/2021 31 -
Buy USD 12,786,940 Sell GBP 9,115,140 13/04/2021 152 0.01
Buy USD 13,732,900 Sell GBP 10,016,919 13/04/2021 (64) -
Buy USD 18,394,188 Sell GBP 13,348,806 13/04/2021 (17) -

50 ASI Global Absolute Return Strategies Fund
Holding InvestmentMarket Value
£’000
Percentageof total
net assets
Buy USD 20,195,617 Sell GBP 14,712,218 13/04/2021 (75) -
Buy USD 20,839,060 Sell GBP 15,078,980 13/04/2021 24 -
Buy USD 23,636,959 Sell GBP 17,315,906 13/04/2021 (185) (0.01)
Buy USD 31,544,756 Sell GBP 22,394,291 13/04/2021 468 0.02
Buy USD 38,407,946 Sell GBP 27,764,867 13/04/2021 72 -
Buy USD 85,462,868 Sell GBP 60,454,631 13/04/2021 1,486 0.05
Buy USD 109,656,178 Sell GBP 79,984,351 13/04/2021 (509) (0.02)
Buy USD 241,119 Sell GBP 172,486 15/04/2021 2 -
Buy USD 2,506,004 Sell GBP 1,792,684 15/04/2021 24 -
Buy USD 244,480 Sell GBP 179,008 20/04/2021 (2) -
Buy USD 1,490,935 Sell GBP 1,079,720 20/04/2021 1 -
Buy USD 338,028 Sell GBP 245,854 14/05/2021 (1) -
Buy USD 789,300 Sell GBP 568,380 14/05/2021 4 -
Buy USD 960,793 Sell GBP 691,873 14/05/2021 4 -
Buy USD 456 Sell GBP 327 02/06/2021 - -
Buy USD 510 Sell GBP 360 02/06/2021 - -
Buy USD 3,279 Sell GBP 2,350 02/06/2021 - -
Buy USD 4,221 Sell GBP 2,979 02/06/2021 - -
Buy USD 7,530 Sell GBP 5,315 02/06/2021 - -
Buy USD 13,921 Sell GBP 9,975 02/06/2021 - -
Buy USD 11,000,000 Sell GBP 7,879,861 10/06/2021 91 -
Buy USD 11,000,000 Sell GBP 7,942,668 10/06/2021 28 -
Buy USD 12,000,000 Sell GBP 8,594,499 10/06/2021 101 -
Buy USD 22,000,000 Sell GBP 16,031,171 10/06/2021 (89) -
Buy USD 71,032,596 Sell GBP 51,000,000 14/06/2021 472 0.02
Buy USD 2,450,046 Sell HUF 728,000,000 02/06/2021 65 -
Buy USD 20,320,475 Sell HUF 6,290,000,000 10/06/2021 (47) -
Buy USD 16,426,488 Sell IDR 232,650,000,000 11/05/2021 387 0.01
Buy USD 19,114,546 Sell IDR 272,000,000,000 24/05/2021 413 0.01
Buy USD 20,054,913 Sell IDR 284,350,000,000 24/05/2021 485 0.02
Buy USD 5,595,496 Sell IDR 79,800,000,000 02/06/2021 117 -
Buy USD 50,416,105 Sell IDR 730,000,000,000 04/06/2021 515 0.02
Buy USD 48,289,738 Sell IDR 708,000,000,000 10/06/2021 86 -
Buy USD 29,572,836 Sell IDR 432,000,000,000 11/06/2021 132 -
Buy USD 2,202,997 Sell INR 163,000,000 20/04/2021 (12) -
Buy USD 955,672 Sell INR 70,200,000 02/06/2021 4 -
Buy USD 17,434,081 Sell INR 1,290,000,000 10/06/2021 3 -
Buy USD 21,502,870 Sell JPY 2,290,000,000 14/05/2021 558 0.02
Buy USD 77,508,650 Sell KRW 87,360,000,000 15/04/2021 32 -
Buy USD 136,320,482 Sell KRW 153,640,000,000 22/04/2021 62 -
Buy USD 1,313,127 Sell MXN 27,300,000 20/04/2021 (13) -
Buy USD 2,241,374 Sell MXN 44,914,810 20/04/2021 37 -

51ASI Global Absolute Return Strategies Fund
Holding InvestmentMarket Value
£’000
Percentageof total
net assets
Buy USD 4,186,780 Sell MXN 84,000,000 20/04/2021 66 -
Buy USD 2,543,806 Sell MXN 52,608,000 02/06/2021 (7) -
Buy USD 68,126,707 Sell MXN 1,416,000,000 02/06/2021 (431) (0.01)
Buy USD 2,756,275 Sell MXN 56,992,000 03/06/2021 (7) -
Buy USD 73,795,057 Sell MXN 1,534,000,000 03/06/2021 (468) (0.02)
Buy USD 41,645,657 Sell MXN 892,000,000 10/06/2021 (1,172) (0.04)
Buy USD 776,889 Sell MYR 3,160,000 02/06/2021 11 -
Buy USD 13,946,430 Sell MYR 57,900,000 10/06/2021 (1) -
Buy USD 75,342,307 Sell NOK 651,500,000 14/05/2021 (709) (0.02)
Buy USD 34,173,424 Sell NZD 47,700,000 14/05/2021 558 0.02
Buy USD 41,594,336 Sell NZD 57,400,000 14/05/2021 1,014 0.03
Buy USD 4,961,128 Sell PEN 17,900,000 20/04/2021 147 0.01
Buy USD 12,679,979 Sell PEN 45,750,000 20/04/2021 376 0.01
Buy USD 1,519,174 Sell PEN 5,550,000 02/06/2021 32 -
Buy USD 12,358,031 Sell PEN 45,700,000 10/06/2021 155 0.01
Buy USD 335,848 Sell PLN 1,300,000 20/04/2021 5 -
Buy USD 3,372,485 Sell PLN 13,050,000 20/04/2021 47 -
Buy USD 4,406,565 Sell PLN 16,465,641 20/04/2021 169 0.01
Buy USD 1,123,097 Sell RON 4,530,000 02/06/2021 32 -
Buy USD 16,623,032 Sell RON 68,700,000 10/06/2021 200 0.01
Buy USD 1,340,490 Sell RUB 99,250,000 20/04/2021 21 -
Buy USD 1,489,720 Sell RUB 111,000,000 02/06/2021 23 -
Buy USD 22,553,393 Sell RUB 1,680,000,000 10/06/2021 372 0.01
Buy USD 4,180,935 Sell SEK 35,100,000 14/05/2021 110 -
Buy USD 41,659,053 Sell SEK 342,000,000 14/05/2021 1,743 0.06
Buy USD 14,617,625 Sell THB 445,000,000 20/04/2021 275 0.01
Buy USD 3,389,718 Sell THB 102,400,000 02/06/2021 82 -
Buy USD 27,982,685 Sell THB 863,000,000 10/06/2021 271 0.01
Buy USD 6,446,154 Sell TRY 48,300,000 20/04/2021 515 0.02
Buy USD 16,348,693 Sell TRY 138,050,000 20/04/2021 (57) -
Buy USD 21,897,767 Sell TRY 186,350,000 21/04/2021 (190) (0.01)
Buy USD 11,531,435 Sell ZAR 175,000,000 06/04/2021 (225) (0.01)
Buy USD 11,619,470 Sell ZAR 176,390,000 06/04/2021 (229) (0.01)
Buy USD 36,149,729 Sell ZAR 558,000,000 06/04/2021 (1,165) (0.04)
Buy USD 995,028 Sell ZAR 15,000,000 20/04/2021 (13) -
Buy USD 1,522,325 Sell ZAR 23,000,000 20/04/2021 (23) -
Buy USD 13,020,488 Sell ZAR 199,650,000 20/04/2021 (336) (0.01)
Buy USD 16,710,634 Sell ZAR 252,900,000 11/05/2021 (234) (0.01)
Buy USD 19,222,512 Sell ZAR 291,000,000 24/05/2021 (248) (0.01)
Buy USD 20,395,701 Sell ZAR 309,100,000 24/05/2021 (280) (0.01)
Buy USD 2,110,922 Sell ZAR 31,000,000 02/06/2021 22 -
Buy USD 48,615,445 Sell ZAR 740,000,000 04/06/2021 (774) (0.03)

52 ASI Global Absolute Return Strategies Fund
Holding InvestmentMarket Value
£’000
Percentageof total
net assets
Buy USD 31,263,928 Sell ZAR 484,000,000 10/06/2021 (879) (0.03)
Buy USD 28,016,786 Sell ZAR 419,000,000 11/06/2021 (62) -
Buy USD 59,971,032 Sell ZAR 909,390,000 06/07/2021 (607) (0.02)
Buy ZAR 154,572,269 Sell GBP 7,561,713 13/04/2021 11 -
Buy ZAR 909,390,000 Sell USD 60,685,965 06/04/2021 613 0.02
Buy ZAR 26,000,000 Sell USD 1,714,302 20/04/2021 30 -
Buy ZAR 76,000,000 Sell USD 4,959,055 20/04/2021 126 -
Buy ZAR 31,000,000 Sell USD 2,082,982 02/06/2021 (1) -
Futures (1.12%) 19,172 0.64
(333) Short NASDAQ 100 E-mini Future 18/06/2021 (449) (0.01)
(652) Short S&P 500 E-mini Future 18/06/2021 (521) (0.02)
(6,230) Short US 10 Year Ultra Future 21/06/2021 18,962 0.63
(4,332) Short US 5 Year Note (CBT) Future 30/06/2021 1,180 0.04
Inflation Swaps (0.51%) (14,564) (0.49)
EUR 176,507,527 Pay fixed 1.3175% receive floating CPTFEMU 15/03/2026 1,138 0.04
EUR 88,253,763 Pay fixed 1.33% receive floating CPTFEMU 15/03/2026 518 0.02
EUR 176,507,52 Pay fixed 1.3325% receive floating CPTFEMU 15/03/2026 1,017 0.03
EUR 88,253,763 Pay fixed 1.3725% receive floating CPTFEMU 15/03/2026 346 0.01
EUR 88,253,764 Pay fixed 1.38% receive floating CPTFEMU 15/03/2026 315 0.01
EUR 72,245,161 Pay fixed 1.38125% receive floating CPTFEMU 15/03/2026 254 0.01
EUR 88,253,763 Pay fixed 1.3825% receive floating CPTFEMU 15/03/2026 305 0.01
EUR 72,245,161 Pay fixed 1.38375% receive floating CPTFEMU 15/03/2026 246 0.01
EUR 88,253,763 Pay fixed 1.3875% receive floating CPTFEMU 15/03/2026 285 0.01
EUR 72,245,161 Pay fixed 1.41% receive floating CPTFEMU 15/03/2026 158 0.01
EUR 72,245,162 Pay fixed 1.4125% receive floating CPTFEMU 15/03/2026 150 -
EUR 48,163,441 Pay fixed 1.4325% receive floating CPTFEMU 15/03/2026 56 -
EUR 48,163,44 Pay fixed 1.435% receive floating CPTFEMU 15/03/2026 50 -
EUR 72,245,162 Pay fixed 1.435% receive floating CPTFEMU 15/03/2026 75 -
EUR 48,163,441 Pay fixed 1.4375% receive floating CPTFEMU 15/03/2026 45 -
EUR 100,250,000 Pay fixed 1.47% receive floating CPTFEMU 15/03/2026 (58) -
GBP 4,010,000 Pay fixed 3.49% receive floating UKRPI 15/01/2029 (94) -
GBP 4,010,000 Pay fixed 3.49% receive floating UKRPI 15/01/2029 (94) -
GBP 22,500,000 Pay fixed 3.49% receive floating UKRPI 15/01/2029 (527) (0.02)
GBP 79,700,000 Pay floating UKRPI receive fixed 3.34% 15/01/2026 (1,533) (0.05)
GBP 318,800,000 Pay floating UKRPI receive fixed 3.3473% 15/01/2026 (6,003) (0.20)
GBP 398,500,000 Pay floating UKRPI receive fixed 3.35375% 15/01/2026 (7,359) (0.25)
GBP 153,000,000 Pay floating UKRPI receive fixed 3.4205% 15/02/2026 (2,200) (0.07)
GBP 42,700,000 Pay floating UKRPI receive fixed 3.49% 15/01/2029 1,000 0.03

53ASI Global Absolute Return Strategies Fund
Holding InvestmentMarket Value
£’000
Percentageof total
net assets
GBP 42,700,000 Pay floating UKRPI receive fixed 3.49% 15/01/2029 1,000 0.03
GBP 43,992,578 Pay floating UKRPI receive fixed 3.5% 15/02/2029 927 0.03
GBP 44,996,019 Pay floating UKRPI receive fixed 3.52% 15/02/2029 1,065 0.04
GBP 42,700,000 Pay floating UKRPI receive fixed 3.5225% 15/02/2029 1,025 0.03
GBP 42,700,000 Pay floating UKRPI receive fixed 3.5225% 15/02/2029 1,024 0.03
GBP 44,520,000 Pay floating UKRPI receive fixed 3.53% 15/03/2029 856 0.03
GBP 44,520,000 Pay floating UKRPI receive fixed 3.53% 15/03/2029 856 0.03
GBP 42,700,000 Pay floating UKRPI receive fixed 3.585% 15/01/2029 1,526 0.05
GBP 42,700,000 Pay floating UKRPI receive fixed 3.593% 15/01/2029 1,571 0.05
GBP 45,100,000 Pay floating UKRPI receive fixed 3.595% 15/01/2029 1,671 0.06
USD 202,000,000 Pay floating USDCPI receive fixed 2.2225% 02/03/2031 (4,176) (0.14)
USD 404,000,000 Pay floating USDCPI receive fixed 2.2775% 01/03/2031 (6,705) (0.22)
USD 202,000,000 Pay floating USDCPI receive fixed 2.28375% 26/02/2031 (3,294) (0.11)
Interest Rate Swaps (0.82%) (150) -
USD 451,000,000 Pay fixed 1.745% receive floating USD-LIBOR 23/03/2031 (150) -
Total Return Swaps (0.02%) (5,859) (0.19)
USD 85,401,258Buy S&P 500 Energy Total Return Index Receive USD 1M LIBOR 0% 10/03/2022 (3,703) (0.12)
USD 43,539,626Buy S&P Regional Banks Select Industry Index Receive USD 1M LIBOR 0% 03/03/2022 (26) -
USD 42,767,245Buy S&P Regional Banks Select Industry Index Receive USD 1M LIBOR 0% 04/03/2022 535 0.02
USD 36,065,051Buy S&P Regional Banks Select Industry Index Receive USD 1M LIBOR 0% 09/03/2022 (352) (0.01)
USD 84,283,759Sell S&P 500 Utilities Sector Total Return Index Receive S&P 500 Utilities Sector Total Return Index 0.2% 10/03/2022 (2,313) (0.08)
Money Markets (12.98%) 290,972 9.74
50,000,000 Barclays CD 0% 01/04/2021 50,000 1.67
10,000,000 Credit Agricole CD 0.2% 17/05/2021 10,000 0.33
20,000,000 Credit Suisse CD 0% 23/11/2021 19,979 0.67
10,000,000 First Abu Dhabi Bank CD 0.06% 15/07/2021 10,000 0.34
20,000,000 Lloyds Financial CD 0.05% 23/04/2021 20,000 0.67
30,000,000 MUFG Bank CD 0.05% 07/04/2021 30,000 1.00
10,000,000 Nordea Bank Finland CD 0.09% 21/06/2021 10,000 0.34
20,000,000 Santander UK CD 0.06% 04/05/2021 20,000 0.67
20,000,000 Standard Chartered CD 0.03% 04/06/2021 20,000 0.67
20,000,000 UBS CD 0.07% 04/08/2021 20,000 0.67
50,000,000 Agence Centrale CP 0.06% 26/04/2021 49,998 1.67

54 ASI Global Absolute Return Strategies Fund
Holding InvestmentMarket Value
£’000
Percentageof total
net assets
20,000,000 Bayern CP 0.01% 16/04/2021 20,000 0.67
11,000,000 OP Corporate Bank CP 0.06% 03/09/2021 10,995 0.37
Reverse Repurchases (10.00%) 252,999 8.47
52,998,650 Agreement with MMBC Danske Bank 52,999 1.78
50,000,000 Agreement with National Australia Bank 01/04/2021 50,000 1.68
50,000,000 Agreement with National Australia Bank 08/04/2021 50,000 1.67
50,000,000 Agreement with Royal Bank of Canada 01/04/2021 50,000 1.67
50,000,000 Agreement with Royal Bank of Canada 08/04/2021 50,000 1.67
Total investment assets and liabilities 2,250,503 75.35
Net other assets 736,234 24.65
Total Net Assets 2,986,737 100.00
All investments (excluding OTC derivatives) are listed on recognised stock exchanges and are approved securities, regulated collective investment schemes or approved derivatives within the meaning of the FCA rules.The percentage figures in brackets show the comparative holding as at 31 March 2020.+Managed by subsidiaries of abrdn plc.*Suspended.

55ASI Global Absolute Return Strategies Fund
Statement of Total ReturnFor the year ended 31 March 2021
2021 2020Notes £’000 £’000 £’000 £’000
Income:
Net capital gains/(losses) 3 259,449 (600)
Revenue 4 76,255 200,168
Expenses 5 (19,077) (31,764)
Interest payable and similar charges 6 (500) (366)
Net revenue before taxation 56,678 168,038
Taxation 7 (9,977) (27,612)
Net revenue after taxation 46,701 140,426
Total return before distributions 306,150 139,826
Distributions 8 (46,703) (140,429)
Change in net assets attributable to unitholders from investment activities 259,447 (603)
Statement of Change in Net Assets Attributable to UnitholdersFor the year ended 31 March 2021
2021 2020£’000 £’000 £’000 £’000
Opening net assets attributable to unitholders 3,999,393 9,318,580
Amounts receivable on the issue of units 291,469 246,623
Amounts payable on the cancellation of units (1,603,938) (5,661,880)
(1,312,469) (5,415,257)
Dilution levy 4,238 9,612
Change in net assets attributable to unitholders from investment activities (see above) 259,447 (603)
Retained distribution on accumulation units 36,128 87,061
Closing net assets attributable to unitholders 2,986,737 3,999,393

56 ASI Global Absolute Return Strategies Fund
Balance SheetAs at 31 March 2021
2021 2020Notes £’000 £’000 £’000 £’000
Assets:
Fixed assets:
Investment assets 2,344,642 3,768,850
Current assets:
Debtors 9 61,982 123,642
Cash and bank balances 10 855,595 736,623
917,577 860,265
Total assets 3,262,219 4,629,115
Liabilities:
Investment liabilities (94,139) (448,355)
Creditors 11 (140,197) (18,606)
Bank overdrafts 10 (41,146) (162,761)
(181,343) (181,367)
Total liabilities (275,482) (629,722)
Net assets attributable to unitholders 2,986,737 3,999,393

57ASI Global Absolute Return Strategies Fund
For the year ended 31 March 2021
1 Accounting Policiesa. Basis of preparation
The financial statements have been prepared on a historical cost basis, as modified by the revaluation of investments, and in accordance with the Statement of Recommended Practice (SORP) for Financial Statements of Authorised Funds issued by the Investment Association in May 2014 (IMA SORP 2014), FRS 102 The Financial Reporting Standard applicable in the UK and Republic of Ireland.
The Manager has considered the impact of the emergence and spread of COVID-19 and potential implications on future operations of the fund of reasonably plausible downside scenarios. The Manager has undertaken a detailed assessment, and continues to monitor, the fund’s ability to meet its liabilities as they fall due, including liquidity, declines in global capital markets and investor redemption levels. Based on this assessment, the fund continues to be open for trading and the Manager is satisfied the fund has adequate financial resources to continue in operation and accordingly it is appropriate to adopt the going concern basis in preparing the financial statements.
b. Valuation of investmentsListed investments have been valued at fair value as at the close of business on 31 March 2021. The SORP defines fair value as the market value of each security, in an active market, this is generally the quoted bid price.
Unlisted, unapproved, illiquid or suspended securities are valued at the Managers’ best estimate of the amount that would be received from an immediate transfer at arm’s length. The Manager has appointed a Fair Value Pricing committee to review valuations.
Any open positions in derivative contracts or forward foreign currency transactions at the year-end are included in the Balance Sheet at their mark to market value.
The money market instruments of the fund have been valued on a fair value basis. Term deposits are stated at their Sterling equivalent of nominal value.
Reverse repurchase agreements are stated at their Sterling equivalent of nominal value.
c. Foreign ExchangeAssets and liabilities denominated in foreign currencies are translated into Sterling at the prevailing exchange rates as at the close of business on the reporting date.
Foreign currency transactions are translated at the rates of exchange ruling on the date of such transactions. Exchange differences on such transactions follow the same treatment as the principal amounts.
d. DilutionIn certain circumstances (as detailed in the Prospectus) the Manager may apply a dilution adjustment on the issue or cancellation of shares, which is applied to the capital of the fund on an accruals basis. The adjustment is intended to protect existing investors from the costs of buying or selling underlying investments as a result of large inflows or outflows from the fund.
e. RevenueDividends on equities and preference stocks are recognised when the securities are quoted ex-dividend, or in the case of unquoted securities when the dividend is declared.
Overseas dividends are grossed up at the appropriate rate of withholding tax and the tax consequences are shown within the tax charge.
Revenue from offshore funds is recognised when income is reported by the offshore fund operator.
Interest on bank deposits is recognised on an accruals basis.
Interest from short-term deposits is recognised on an accruals basis.
Interest on debt securities is recognised on an accruals basis.
Interest from debt securities is recognised as revenue using the effective interest method. The purchase price of the asset, the yield expectation and scheduling of payments, are all part of this calculation. Callable bonds are calculated on a yield to worst expectation generally, which may not match other calculations.
Stock dividends are recognised as revenue when they are quoted ex dividend. In the case of enhanced stock dividends, the value of the enhancement is recognised as capital.
Notes to the financial statements of ASI Global Absolute Return Strategies Fund
58 ASI Global Absolute Return Strategies Fund
Special dividends may be treated as repayments of capital or as revenue dependent on the facts of the particular case. Where receipt of a special dividend results in a significant reduction in the capital value of the holding, then the special dividend will be recognised as capital so as to ensure that the matching principle is applied to gains and losses. Otherwise, the special dividends are recognised as revenue.
Underwriting commission is taken to revenue and recognised when the issue takes place, except where the fund is required to take up all or some of the shares underwritten in which case an appropriate proportion of the commission received is deducted from the cost of the relevant shares.
Distributions from Brazilian corporations may take the form of interest on capital as an alternative to making dividend distributions. Interest on capital distributions are recognised on an accruals basis.
For dividends received from US Real Estate Investment Trusts (“REITs”), on receipt of the capital/revenue split from the REITs, the allocation of the dividend is adjusted within the financial statements.
f. ExpensesAll expenses other than those relating to the purchase and sale of investments are charged against revenue on an accruals basis in the Statement of Total Return.
Expenses relating to the purchases of investments are charged to the cost of investment and expenses relating to the sales of investments are deducted from the proceeds on sales.
g. TaxationProvision is made for corporation tax at the current rate on the excess of taxable income over allowable expenses.
UK dividends are disclosed net of any related tax credit.
Overseas dividends are disclosed gross of any foreign tax suffered and the tax element is separately disclosed in the taxation note.
The tax accounting treatment follows that of the principal amount, with charges or reliefs allocated using the marginal basis regardless of any alternative treatment that may be permitted in determining the distribution.
Any windfall overseas tax reclaims received are netted off against irrecoverable overseas tax and therefore the irrecoverable overseas tax line in the taxation note may be negative.
Deferred taxation is provided on all timing differences that have originated but not reversed by the balance sheet date other than those differences regarded as permanent. Any liability to deferred tax is provided at the average rate of tax expected to apply. Deferred tax assets and liabilities are not discounted to reflect the time value of money.
Deferred tax assets are only recognised to the extent that it is regarded more likely than not that there will be taxable profits against which the reversal of underlying timing differences can be offset.
h. DistributionsAll of the net revenue available for distribution at the year end will be distributed. Where the fund has accumulation unitholders, this will be reinvested. Where the fund has income unitholders, this will be paid.
Gains and losses on non-derivative investments and currencies, whether realised or unrealised, are taken to capital and are not available for distribution. Cash flows associated with derivative transactions are allocated between the revenue and capital property of the fund according to the motives and circumstances of the particular derivative strategy. The investment manager articulates the motives and circumstances underlying the derivative strategy and the Manager assesses these in association with financial reporting constraints enshrined within the SORP to allocate the cash flows accordingly.
i. EqualisationEqualisation appears within the fund reports as part of the distribution. This represents the net revenue in the fund unitprice attached to the issue and cancellation of units. It will form part of any distributions at the period end attributable to unitholders.
j. DerivativesThe fund makes use of derivatives. Derivatives can be used to reduce risk or cost, or to generate additional capital or income consistent with the risk profile of the fund (often referred to as “Efficient Portfolio Management”). Some strategies may permit use of derivatives with a higher or lower frequency or for investment purposes. The accounting for each derivative is applied consistently in line with the derivative type; the valuation policy and market convention. Market convention for derivatives is often based on total return; however where a fund strategy or derivative type is defined with revenue in mind the accounting treatment can have a revenue element, forming part of the distribution, highlighted in the distribution policy. The Statement of Total Return captures all realised and unrealised gains regardless of nature. The Portfolio Statement will show the individual derivative contracts as net positions in line with the valuation policy.
There are three broad transaction types: derivatives create a future asset or liability recognised as unrealised profit or loss until the date of maturity where cash is exchanged; swaps realise amounts of profit or loss in line with an agreed schedule until maturity; options recognise a premium paid or received, with the right or obligation to buy “call” or sell “put” an asset, exercised when the option owner is in the money. These transaction types break into three broad strategies.

59ASI Global Absolute Return Strategies Fund
The fund makes use of the following transactions in line with their policy: forward currency exchange contracts (a derivative of the exchange rate); cross currency swaps; currency options and other currency derivatives. These transactions relate to the future expectations of foreign exchange rates. The future expectation is based on the current interest rates projected to a forward date. Currency derivatives exchange one currency for another currency at a future date.
The fund makes use of the following transactions in line with their policy: bond future contracts (a derivative of the bond market or asset); credit default swaps; interest rate swaps; overnight index swaps; inflation swaps; interest rate options; swaptions; total return bond swaps and other bond related derivatives. These transactions relate to the future expectations on debt assets. The future expectations can be based on an individual asset or a market. Bond derivatives can relate to the future credit expectations; interest rate expectations; inflation expectations or a combination of these.
The fund makes use of the following transactions in line with their policy: equity future contracts (a derivative of the equity market or asset); variance swaps (differences in volatility between two assets); equity options; total return equity swaps and other equity related derivatives. These transactions relate to the future expectations on equity assets. The future expectations can be based on a an individual asset or a market. Equity derivatives relate to the future expectations in equity markets. Equity markets are subject to the variables found in bond markets, however there is not an explicit relationship to derive a price.
k. Collateral and marginThe fund undertakes derivative transactions, (reverse) repurchase and sale transactions exchange investment assets based on legal agreements. In line with collective investment scheme rules and ASI policy collateral or margin must be exchanged to limit the exposure to investors should an agreement fail. Collateral is exchanged at an agreement level on a net basis following ASI policy at a counterparty level within the fund. Collateral is monitored and where required exchanged daily. Collateral is bilateral in nature exchanged between the two counterparties in a transaction. Margin is similar to collateral limiting the risk for investors. The main difference is the exchange of initial margin, required before a contract is opened. Once opened the exchange of variation margin is monitored and where required exchanged daily. Both collateral and margin do not affect the valuation of the asset they are protecting or the fund unless re-hypothecated (used to buy) into another investment asset. The fund does not re-hypothecate but may use liquidity collective investments to manage cash effectively.
2 Risk management policiesGeneric risks that the Aberdeen Standard Investments (ASI) range are exposed to and the risk management techniques employed are disclosed below. Numerical disclosures and specific risks, where relevant, are disclosed within the financial statements.
The Financial Conduct Authority (FCA) Collective Investment Schemes Sourcebook (COLL) and FCA Funds Sourcebook (FUND) rules require the Management Company to establish, implement and maintain an adequate and documented Risk Management Process (RMP) for identifying the risks they manage, or might be, exposed to. The RMP must comprise of such procedures as are necessary to enable ASI to assess the exposure of each fund it manages to market risk, liquidity risk, counterparty risk, operational risk and all other risks that might be material.
ASI functionally and hierarchically separates the functions of risk management from the operating units and portfolio management functions, to ensure independence and avoid any potential or actual conflicts of interest. The risk management function has the necessary authority, access to all relevant information, staff and regular contact with senior management and the Board of Directors of the Company. The management of investment risk within ASI is organised across distinct functions, aligned to the well-established ‘three lines of defence’ model.
1. Risk ownership, management and control.
2. Oversight of risk, compliance and conduct frameworks.
3. Independent assurance, challenge and advice.
The risk management process involves monitoring funds on a regular and systematic basis to identify, measure and monitor risk and where necessary escalate appropriately, including to the relevant Board, any concerns and proposed mitigating actions.
The risk team, in line with client expectations and the investment process, develops the risk profiles for the funds in order to set appropriate risk limits. Regulatory limits as well as those agreed, are strictly enforced to ensure that ASI does not inadvertently (or deliberately) breach them and add additional risk exposure. In addition, there is an early warnings system of potential changes in the portfolio risk monitoring triggers. Where possible, these are coded into the front office dealing system, in a pre-trade capacity, preventing exposures or breaching limits before the trade is actually executed.
Risk Definitions & Risk Management Processesi) Market Risk is the risk that economic, market or idiosyncratic events cause a change in the market value of Client assets.
Market Risk can be broadly separated into two types:
(1) Systematic risk stems from any factor that causes a change in the valuation of groups of assets. These factors may emerge from a number of sources, including but not limited to economic conditions, political events or actions, the actions of central banks or policy makers, industry events or, indeed, investor behaviour and risk appetite.

60 ASI Global Absolute Return Strategies Fund
(2) Specific or Idiosyncratic Risk, which is the part of risk directly associated with a particular asset, outside the realms of, and not captured by Systematic Risk. In other words, it is the component of risk that is peculiar to a specific asset, and may manifest itself in various guises, for example: corporate actions, fraud or bankruptcy.
Portfolios are subject to many sub-categories of market risk. Many of these risks are interlinked and not mutually exclusive. Examples of these types of investment risk include: Country risk; Sector risk; Asset-class risk; Inflation/deflation risk; Interest rate risk; Currency risk; Derivatives risk; Concentration risk; and Default risk. Factors that cause changes in market risks include: future perceived prospects (i.e. changes in perception regarding the future economic position of countries, companies, sectors, etc.); shifts in demand and supply of products and services; political turmoil, changes in interest rate/inflation/taxation policies; major natural disasters; recessions; and terrorist attacks.
There are several ways in which to review and measure investment risk. The risk team recognises that each method is different and has its own unique insights and limits, and applies the following measurements for each fund, where relevant:
• Leverage: has the effect of gearing a fund’s expected performance by allowing it to gain greater exposure to underlying investment opportunities (gains and losses). The higher the leverage the greater the risk (potential loss).
• Value-at-Risk (VaR) and Conditional VaR (CVaR): VaR measures with a degree of confidence the maximum the fund could expect to lose in any given time frame. Assuming a normal (Gaussian) distribution, this is a function of the volatility of the fund’s returns. The higher the volatility, the higher the VaR, the greater the risk. CVaR calculates the expected tail loss, under the assumption that the VaR has been reached.
• Volatility, Tracking Error (TE): Volatility measures the size of variation in returns that the fund is likely to expect. The higher the volatility the higher the risk. TE measures the expected magnitude of divergence of returns between the fund and benchmark over a given time.
• Risk Decomposition: Volatility, tracking error and VaR may be broken down to show contribution from market related factors (“Systematic” Risk) and instrument specific (Idiosyncratic Risk). This is not a different measure as such, but is intended to highlight the sources of volatility and VaR.
• Concentration Risk: By grouping the portfolio into various different exposures (e.g. country, sector, issuer, asset, etc.), we are able to see where, if any, concentration risk exists.
• Stress Tests and Scenario Analysis: This captures how much the current portfolio will make or lose if certain market conditions occur.
• Back Testing: This process helps to assess the adequacy of the VaR model and is carried out in line with UCITS regulatory requirements (FCA COLL 6.12). Excessive levels of overshoots and the reasons behind them are reported to the Board.
To generate these risk analytics the risk team relies on third party calculation engines, such as APT, Bloomberg PORT+, RiskMetrics, UBS Delta and Axioma. Once the data has been processed, it is analysed by the risk team, generally reviewing absolute and relative risks, change on month and internal peer analysis. Any issues or concerns that are raised through the analysis prompt further investigation and escalation if required. Breaches of hard limits are also escalated immediately. All client mandated and regulatory risk limits are monitored on a daily basis.
Stress tests are intended to highlight those areas in which a portfolio would be exposed to risk if the current economic conditions were likely to change. An economic event may be a simple change in the direction of interest rates or return expectations, or may take the form of a more extreme market event such as one caused through military conflict. The stress test itself is intended to highlight any weakness in the current portfolio construction that might deliver unnecessary systematic exposure if the market were to move abruptly.
Stress testing is performed on a regular basis using relevant historical and hypothetical scenarios.
ii) Liquidity risk is defined as the risk that a portfolio may need to raise cash or reduce derivative positions on a timely basis either in reaction to market events or to meet client redemption requests and may be obliged to sell long term assets at a price lower than their market value. Liquidity is also an important consideration in the management of portfolios: Portfolio Managers need to pay attention to market liquidity when sizing, entering and exiting trading positions.
Measuring liquidity risk is subject to three main dimensions:
• Asset Liquidity Risk – how quickly can assets be sold.
• Liability Risk - managing redemptions as well as all other obligations arising from the liabilities side of the balance sheet.
• Contingency Arrangements or Liquidity Buffers – utilising credit facilities etc.

61ASI Global Absolute Return Strategies Fund
Liquidity Risk Management FrameworkASI has a liquidity risk management framework in place applicable to the funds and set out in accordance with its overall Risk Management Process, relative to the size, scope and complexity of the funds. Liquidity assessment and liquidity stress testing is typically performed monthly, monitoring both the asset and liability sides. Asset side stressed scenarios are considered based on the nature of different asset classes and their liquidity risks to demonstrate the effects of a market stress on the ability to sell-down a fund. Liability side analysis includes stress scenarios on the investor profile as well as liabilities on the balance sheet. Any particular concerns noted or liquidity risk limit breaches are escalated to the relevant Committees and Boards, if material.
iii) Counterparty credit risk is the risk of loss resulting from the fact that the counterparty to a transaction may default on its obligations prior to the final settlement of the transaction’s cash flow. Credit risk falls into both market risk and specific risk categories. Credit risk is the risk that an underlying issuer may be unable (or unwilling) to make a payment or to fulfil their contractual obligations. This may materialise as an actual default or, or to a lesser extent, by a weakening in a counterparty’s credit quality. The actual default will result in an immediate loss whereas, the lower credit quality will more likely lead to mark-to-market adjustment.
Transactions involving derivatives are only entered into with counterparties having an appropriate internal credit rating that has been validated by the credit research team and approved by the relevant credit committee. Appropriate counterparty exposure limits will be set and agreed by these committees and the existing credit exposures will be assessed against these limits.
iv) Operational RiskOperational risk can be defined as the risk of loss resulting from inadequate or failed internal processes, people and systems or from external events. Operational risk also includes the breakdown of processes to comply with laws, regulations or directives.
Operational Risk ManagementAn Operational Risk Management Framework is in place to identify, manage and monitor appropriate operational risks, including professional liability risks, to which the Management Company and the funds are or could be reasonably exposed. The operational risk management activities are performed independently as part of one of the functions of the Risk Division.
The Group’s Risk Management Framework is based upon the Basel II definition of operational risk which is “the risk of loss resulting from inadequate or failed internal processes, people and systems or from external events”.
The Group’s management of operational risk is therefore aimed at identifying risks in existing processes and improving existing controls to reduce their likelihood of failure and the impact of losses. The Group has developed a framework that embodies continuous improvement to internal controls and ensures that the management of risk is embedded in the culture of the Group.
The identification, management, monitoring and resolution of events, risks and controls are facilitated via the Group’s risk management system, Shield. The system is designed to facilitate the convergence of governance, risk and compliance programmes and automate a comprehensive review and assessment of operational risks.
3 Net Capital Gains/(Losses)
2021£’000
2020£’000
Non-derivative securities 316,776 9,074
Derivative contracts (101,864) 10,793
Forward currency contracts 49,552 (16,698)
Other losses (4,834) (3,457)
Transaction charges (181) (312)
Net capital gains/(losses) 259,449 (600)

62 ASI Global Absolute Return Strategies Fund
4 Revenue
2021£’000
2020£’000
Bank and margin interest 2,465 18,930
Income from Overseas Collective Investment Schemes
Unfranked income 2,308 -
Interest on debt securities 52,988 136,166
Overseas dividends 14,716 28,655
Overseas REIT 2,548 6,415
Reverse repurchase interest 36 619
UK dividends 1,156 9,238
UK REIT 38 145
Total revenue 76,255 200,168
5 Expenses
2021£’000
2020£’000
Payable to the Manager, associates of the Manager and agents of either of them:
Manager’s periodic charge 17,364 29,154
Dealing charge 225 288
Registration fees 991 1,497
18,580 30,939
Payable to the Trustee or associates of the Trustee, and agents of either of them:
Safe custody fee 213 503
Trustee fees 186 202
399 705
Other:
Audit fee 56 55
Professional fees 42 65
98 120
Total expenses 19,077 31,764
Irrecoverable VAT is included in the above expenses where relevant.
6 Interest Payable and Similar Charges
2021£’000
2020£’000
Derivative expense 391 86
Interest payable 109 280
Total interest payable & similar charges 500 366

63ASI Global Absolute Return Strategies Fund
7 Taxation
2021£’000
2020£’000
(a) Analysis of charge in year
Corporation tax 8,307 25,929
Double taxation relief (1,030) (3,124)
Adjustments in respect of prior periods (115) -
Overseas taxes 2,859 4,763
Total current tax 10,021 27,568
Deferred tax (note 7(c) (44) 44
Total taxation (note 7b) 9,977 27,612
(b) Factors affecting current tax charge for the year
The tax assessed for the year is less than the standard rate of corporation tax in the UK for authorised Unit Trusts (20%). The differences are explained below:
Net revenue before taxation 56,678 168,038
Corporation tax at 20% (2020: 20%) 11,336 33,608
Effects of:
Revenue not subject to taxation (3,166) (7,542)
Overseas taxes 2,860 4,763
Double taxation relief (1,030) (3,124)
Adjustments in respect of prior periods (115) -
Revenue taxable in other periods 92 (93)
Total tax charge for year (note 7a) 9,977 27,612
Authorised Unit Trusts are exempt from tax on capital gains in the UK. Therefore, any capital gain is not included in the above reconciliation.
(c) Deferred tax
Deferred tax charge at the start of the year 44 -
Deferred tax charge in statement of total return for year (note 7a) (44) 44
Provision at the end of the year - 44
(d) Factors that may affect future tax chargeAt the year end there are no surplus expenses and therefore no deferred tax asset in the current or prior year.

64 ASI Global Absolute Return Strategies Fund
8 Distributions (including the movement between net income and distributions)
2021£’000
2020£’000
Distribution 36,128 87,061
Add: Income deducted on cancellation of units 12,561 55,701
Deduct: Income received on issue of units (1,986) (2,333)
Total distributions for the year 46,703 140,429
Movement between net revenue and distributions
Net revenue after taxation 46,701 140,426
Undistributed revenue brought forward 3 6
Undistributed revenue carried forward (1) (3)
Total distributions for the year 46,703 140,429
Details of the distribution per unit are set out in this fund’s distribution table.
9 Debtors
2021£’000
2020£’000
Accrued revenue 11,431 19,057
Amounts receivable from the Manager for the issue of units 3,075 1,803
Corporation tax receivable - 6,046
Overseas withholding tax recoverable 12,390 13,489
Sales awaiting settlement 35,086 83,247
Total debtors 61,982 123,642
10 Liquidity
2021£’000
2020£’000
Cash and bank balances
Cash at bank 5,022 56,879
Cash at broker 140,133 298,126
Collateral cash pledged to counterparties~ 13,154 58,330
Deposits with original maturity of less than 3 months 697,286 323,288
855,595 736,623
Bank overdrafts
Collateral cash pledged by counterparties^ (40,130) (162,761)
Overdraft at bank (1,016) -
(41,146) (162,761)
Aberdeen Standard Liquidity Fund (Lux) - Sterling Fund* 114,487 154,779
Aberdeen Standard Liquidity Fund (Lux) - Euro Fund* 2,920 119,474
Aberdeen Standard Liquidity Fund (Lux) - US Dollar Fund* 2,649 -
Net liquidity 934,505 848,115
~ This reflects cash the fund retains beneficial ownership of however which is currently being used to manage bilateral counterparty exposure on out of the money derivative positions.^ This reflects cash the fund has taken receipt of to support in the money derivative positions and mitigate counterparty risk to the fund.* Although reflected in the investment assets figure, liquidity funds are used by the fund as a liquidity vehicle and commonly reflects collateral held by the fund. Therefore, the Manager considers the net liquidity position of the fund as the aggregate of cash at bank and in hand, bank overdrafts and liquidity fund positions.

65ASI Global Absolute Return Strategies Fund
11 Creditors
2021£’000
2020£’000
Accrued expenses payable to the Manager 1,327 1,701
Accrued expenses payable to the Trustee or associates of the Trustee 84 118
Amounts payable to the Manager for cancellation of units 2,311 7,869
Corporation tax payable 133 -
Other accrued expenses 56 88
Purchases awaiting settlement 136,286 8,786
Deferred tax payable - 44
Total creditors 140,197 18,606
12 Related Party TransactionsAberdeen Standard Fund Managers Limited, as Manager, is a related party and acts as principal in respect of all transactions of units in the fund.
The aggregate monies received through issue and paid on cancellation of units are disclosed in the statement of change in net assets attributable to unitholders.
Any amounts due from or due to Aberdeen Standard Fund Managers Limited at the end of the accounting year are disclosed in notes 9 and 11.
Amounts payable to Aberdeen Standard Fund Managers Limited, in respect of periodic charge and registration services, are disclosed in note 5 and any amounts due at the year end in note 11.
13 Portfolio Transaction CostsThere are no transaction costs associated with the purchases or sales of bonds, collective investment schemes and derivatives during the year, or in the prior year.
Bonds are dealt on a spread agreed between buyer and seller with reference to the expected cashflows and current credit profiles.
Collective investments operate within the terms of the offer document or prospectus. Typically we do not invest into funds that require an initial charge to be made. The underlying price may contain an estimation of cost known as a dilution levy which is applied from time to time.
Derivatives are dealt on a spread agreed between buyer and seller with reference to the underlying investment.
Purchases Sales
Trades in the year2021
£’0002020
£’0002021
£’0002020
£’000
Bonds 1,583,977 2,197,131 2,100,928 3,520,300
Equities 1,880,557 1,136,815 2,327,021 2,289,672
Collective investment schemes 880,202 1,188,643 858,591 1,182,958
Money Market Instruments 1,307,250 4,127,624 1,536,028 6,509,570
Corporate actions 5,615 - 90 123
Trades in the year before transaction costs 5,657,601 8,650,213 6,822,658 13,502,623
Commissions
Equities 533 413 (547) (577)
Collective investment schemes 52 - - -
Total commissions 585 413 (547) (577)

66 ASI Global Absolute Return Strategies Fund
Purchases Sales
Trades in the year2021
£’0002020
£’0002021
£’0002020
£’000
Taxes
Bonds - - - (801)
Equities 1,058 1,670 (330) (14)
Total taxes 1,058 1,670 (330) (815)
Total transaction costs 1,643 2,083 (877) (1,392)
Total net trades in the year after transaction costs 5,659,244 8,652,296 6,821,781 13,501,231
Purchases Sales
Total transaction costs expressed as a percentage of asset type cost
2021%
2020%
2021%
2020%
Commissions
Equities 0.03 0.04 0.02 0.03
Collective investment schemes 0.01 - - -
Taxes
Bonds - - - 0.02
Equities 0.06 0.15 0.01 -
Total transaction costs expressed as a percentage of net asset value
2021%
2020%
Commissions 0.03 0.02
Taxes 0.04 0.04
At the balance sheet date the average portfolio dealing spread (i.e. the spread between bid and offer prices expressed as a percentage of the offer price) was 1.65% (2020: 0.52%), this is representative of the average spread on the assets held during the year.
14 Units in issue reconciliation
Openingunits2020
Creationsduring
the year
Cancellationsduring
the year
Conversionsduring
the year
Closingunits2021
Retail accumulation 891,888,610 60,029,167 (239,367,895) (14,889) 712,534,993
Institutional accumulation 925,434,214 48,969,759 (422,422,541) (114,204) 551,867,228
Standard Life accumulation 14,043,108 829,185 (1,398,583) - 13,473,710
Standard Life A accumulation 2,272,857,761 197,347,951 (1,006,152,945) - 1,464,052,767
Platform 1 accumulation 635,627,899 8,991,255 (110,256,576) (1,075,426) 533,287,152
Institutional S accumulation 278,686,778 19,086,034 (48,122,801) 1,330,716 250,980,727
Institutional A accumulation 14,786,783 - (167,658) - 14,619,125

67ASI Global Absolute Return Strategies Fund
15 Fair Value HierarchyThe three levels of the fair value hierarchy under FRS 102 are described below:
Level 1: Unadjusted quoted market prices in active markets that are accessible at the measurement date for the identical unrestricted assets or liabilities.
Level 2: Inputs other than quoted prices included within Level 1 that are observable for the asset or liability, either directly (as prices) or indirectly (derived from prices).
Level 3: Inputs for asset or liability that are not based on observable market data (unobservable inputs).
Fair value of investment assets
2021£’000
Level 1
2021£’000
Level 2
2021£’000
Level 3
2020£’000
Level 1
2020£’000
Level 2
2020£’000
Level 3
Bonds 19,166 776,480 - 185,048 1,097,450 -
Equities 544,018 - - 697,968 - -
Money Market Instruments - 290,972 - - 519,178 -
Collective Investment Schemes 175,794 120,056 - - 274,253 -
Derivatives 20,142 145,015 - 103,794 491,145 -
Reverse Repurchase Agreements - 252,999 - - 400,014 -
Total investment assets 759,120 1,585,522 - 986,810 2,782,040 -
Fair value of investment liabilities
Derivatives (970) (93,169) - (98,693) (349,662) -
Total investment liabilities (970) (93,169) - (98,693) (349,662) -
16 Risk Management Policies and DisclosuresThe risks inherent in the fund’s investment portfolio are as follows:
Foreign currency riskFluctuations in the foreign exchange rates can adversely affect the value of a portfolio. The following table details the net exposure to the principal foreign currencies that the fund is exposed to including any instruments used to hedge against foreign currencies, if applicable.
Currency
Net foreign currency exposure
2021£’000
Net foreign currency exposure
2020£’000
Australian Dollar (159,683) (54,318)
Brazilian Real (107,510) (9,433)
Canadian Dollar 66 (911)
Chilean Peso (212) 4,394
China Renminbi (170,432) (9,767)
Colombian Peso (106,046) (491)
Czech Koruna 9,958 20,060
Danish Krone 3,060 12,995
Dominican Republic Peso - 6,833
Euro 44,975 (54,686)
Hong Kong Dollar (2,711) (18,701)
Hungarian Forint (7,939) (7,773)
Indian Rupee 92,972 (19,487)
Indonesian Rupiah (104,922) 8,861
Japanese Yen 39,188 513,431
Kazakhstan Tenge - 1,626

68 ASI Global Absolute Return Strategies Fund
Currency
Net foreign currency exposure
2021£’000
Net foreign currency exposure
2020£’000
Malaysian Ringgit 6,207 20,265
Mexican Peso 91,298 124,282
New Zealand Dollar (49,945) -
Norwegian Krone 1,313 (73,316)
Peruvian New Sol (8,609) (670)
Philippines Peso - (9)
Polish Zloty 8,293 49,542
Romanian Leu (5,830) (15,113)
Russian Ruble (3,150) 33,983
Singapore Dollar - (2,183)
South Africa Rand (145,280) (64,616)
South Korean Won 234,014 (76,532)
Swedish Krona 52,560 (3,931)
Swiss Franc (43,504) 10,981
Taiwan Dollar - (78,387)
Thai Baht 95,612 (239,731)
Turkish Lira 2,423 (4,894)
Ukraine Hryvna 2,337 -
Uruguay Peso 4,184 -
US Dollar 250,968 140,436
Total 23,655 212,740
Interest rate riskInterest rate risk is an unfavourable change in interest rates that can affect the price of a security, which in turn results in the portfolio experiencing a loss. Interest rate changes not only affect fixed income products but have material impacts on funding arrangements and other asset types.
The following table shows separately the value of investments at fixed interest rates, at variable rates and those that are non-interest bearing instruments.
The interest rate risk profile of the fund’s investments at the year end consists of:
2021
Floating rate financial
assets£’000
Fixed rate financial
assets£’000
Financial assets/(liabilities) not
carrying interest£’000
Total£’000
Currency
UK Sterling 1,174,100 332,851 1,456,131 2,963,082
Australian Dollar 89 - (159,772) (159,683)
Brazilian Real - 26,864 (134,374) (107,510)
Canadian Dollar 14 - 52 66
Chilean Peso - 3,633 (3,845) (212)
China Renminbi - - (170,432) (170,432)
Colombian Peso - 10,279 (116,325) (106,046)
Czech Koruna - 2,206 7,752 9,958
Danish Krone - - 3,060 3,060
Euro 21,374 84,438 (60,837) 44,975

69ASI Global Absolute Return Strategies Fund
2021
Floating rate financial
assets£’000
Fixed rate financial
assets£’000
Financial assets/(liabilities) not
carrying interest£’000
Total£’000
Hong Kong Dollar 7 - (2,718) (2,711)
Hungarian Forint - 6,158 (14,097) (7,939)
Indian Rupee 715 7,066 85,191 92,972
Indonesian Rupiah - 23,528 (128,450) (104,922)
Japanese Yen 7 - 39,181 39,188
Malaysian Ringgit 77 16,096 (9,966) 6,207
Mexican Peso - 31,505 59,793 91,298
New Zealand Dollar - - (49,945) (49,945)
Norwegian Krone - - 1,313 1,313
Peruvian New Sol - 3,727 (12,336) (8,609)
Polish Zloty - 13,426 (5,133) 8,293
Romanian Leu - 5,588 (11,418) (5,830)
Russian Ruble 298 19,472 (22,920) (3,150)
South Africa Rand 3,169 160,576 (309,025) (145,280)
South Korean Won - - 234,014 234,014
Swedish Krona 51 - 52,509 52,560
Swiss Franc 22 - (43,526) (43,504)
Thai Baht 10,566 6,337 78,709 95,612
Turkish Lira - - 2,423 2,423
Ukraine Hryvna - 2,311 26 2,337
Uruguay Peso 1,878 2,227 79 4,184
US Dollar 8,230 280,519 (37,781) 250,968
Total 1,220,597 1,038,807 727,333 2,986,737
2020
Floating rate financial
assets£’000
Fixed rate financial
assets£’000
Financial assets/(liabilities) not
carrying interest£’000
Total£’000
Currency
UK Sterling 860,772 936,604 1,989,277 3,786,653
Australian Dollar 9,487 - (63,805) (54,318)
Brazilian Real - 52,391 (61,824) (9,433)
Canadian Dollar 6 - (917) (911)
Chilean Peso - 27,090 (22,696) 4,394
China Renminbi 6 - (9,773) (9,767)
Colombian Peso - 14,913 (15,404) (491)
Czech Koruna - - 20,060 20,060
Danish Krone 75 - 12,920 12,995
Dominican Republic Peso - 6,653 180 6,833
Euro (7,943) 44,653 (91,396) (54,686)
Hong Kong Dollar 8 - (18,709) (18,701)
Hungarian Forint - 19,844 (27,617) (7,773)
Indian Rupee 695 17,927 (38,109) (19,487)
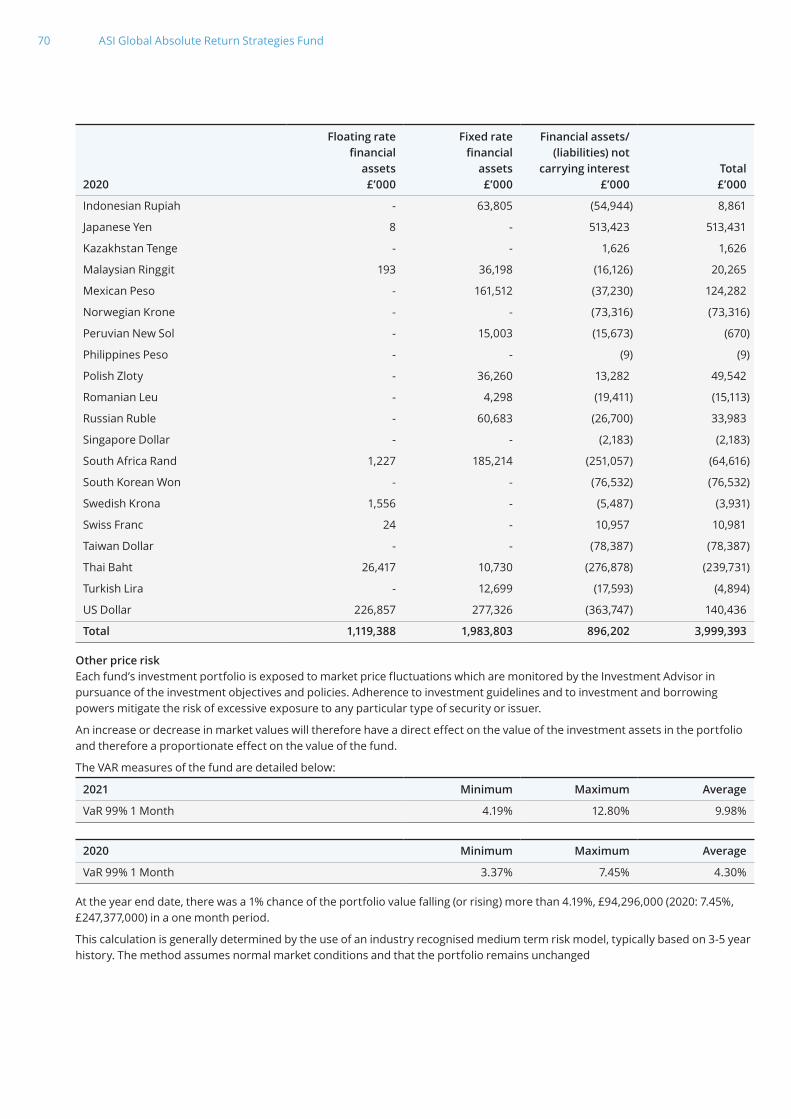
70 ASI Global Absolute Return Strategies Fund
2020
Floating rate financial
assets£’000
Fixed rate financial
assets£’000
Financial assets/(liabilities) not
carrying interest£’000
Total£’000
Indonesian Rupiah - 63,805 (54,944) 8,861
Japanese Yen 8 - 513,423 513,431
Kazakhstan Tenge - - 1,626 1,626
Malaysian Ringgit 193 36,198 (16,126) 20,265
Mexican Peso - 161,512 (37,230) 124,282
Norwegian Krone - - (73,316) (73,316)
Peruvian New Sol - 15,003 (15,673) (670)
Philippines Peso - - (9) (9)
Polish Zloty - 36,260 13,282 49,542
Romanian Leu - 4,298 (19,411) (15,113)
Russian Ruble - 60,683 (26,700) 33,983
Singapore Dollar - - (2,183) (2,183)
South Africa Rand 1,227 185,214 (251,057) (64,616)
South Korean Won - - (76,532) (76,532)
Swedish Krona 1,556 - (5,487) (3,931)
Swiss Franc 24 - 10,957 10,981
Taiwan Dollar - - (78,387) (78,387)
Thai Baht 26,417 10,730 (276,878) (239,731)
Turkish Lira - 12,699 (17,593) (4,894)
US Dollar 226,857 277,326 (363,747) 140,436
Total 1,119,388 1,983,803 896,202 3,999,393
Other price riskEach fund’s investment portfolio is exposed to market price fluctuations which are monitored by the Investment Advisor in pursuance of the investment objectives and policies. Adherence to investment guidelines and to investment and borrowing powers mitigate the risk of excessive exposure to any particular type of security or issuer.
An increase or decrease in market values will therefore have a direct effect on the value of the investment assets in the portfolio and therefore a proportionate effect on the value of the fund.
The VAR measures of the fund are detailed below:
2021 Minimum Maximum Average
VaR 99% 1 Month 4.19% 12.80% 9.98%
2020 Minimum Maximum Average
VaR 99% 1 Month 3.37% 7.45% 4.30%
At the year end date, there was a 1% chance of the portfolio value falling (or rising) more than 4.19%, £94,296,000 (2020: 7.45%, £247,377,000) in a one month period.
This calculation is generally determined by the use of an industry recognised medium term risk model, typically based on 3-5 year history. The method assumes normal market conditions and that the portfolio remains unchanged

71ASI Global Absolute Return Strategies Fund
Counterparty risk Credit quality of debt security investment assets
The following table shows the credit quality of the part of the investment portfolio that is invested in debt securities.
2021Market value
£’000
Percentage of total net assets
%
Investment grade securities 208,771 7.00
Below investment grade securities 582,927 19.51
Unrated securities 3,948 0.13
Total value of securities 795,646 26.64
2020Market value
£’000
Percentage of total net assets
%
Investment grade securities 713,259 17.83
Below investment grade securities 567,389 14.19
Unrated securities 1,850 0.05
Total value of securities 1,282,498 32.07
Investment grade information used in the above table is based on credit ratings issued by market vendors.
Financial derivatives instrument riskThese types of transaction can introduce market exposure greater than the market value of the instrument. These transactions exchange benefits with a third party at a future date creating both counterparty and concentration risk. The Investment Adviser’s policies for managing these risks are outlined in the fund’s prospectus.
At the balance sheet date the fund had the following exposures:
2021 2020
Leveraged instrumentsMarket exposure
£’000Market value
£’000Market exposure
£’000Market value
£’000
Exchange Traded Options - - 449,241 (39,684)
Forward Currency Contracts 11,153,274 23,365 14,551,997 46,529
Futures 1,193,197 19,172 3,957,347 44,785
Equity Index Options - - 159,582 (11,526)
Swaps 4,351,971 28,480 9,700,742 106,480
Total market exposure 16,698,442 71,017 28,818,909 146,584
The total market exposure is the sum of the notional derivative contracts on a gross basis with no offsetting.
Derivative Exposure Percent - Fund Commitment Gross Leverage Percent - Fund Leverage
2021 218.73% 526.99%
2020 379.47% 593.49%
Counterparty ExposureDerivative instruments involve an agreement to exchange a benefit at a future date. This introduces counterparty risk where an agreement is bilateral (between two parties) and concentration risk where a clearing broker operates on an exchange. Where the counterparty or clearing broker is not solvent the market exposure obtained would be lost.
2021
Cash (held)/pledged
£’000
Stock (held)/pledged
£’000
Market value of derivatives
£’000
Broker concentrations
Bank of America Merrill Lynch 140,133 13,922 43,205
140,133 13,922 43,205

72 ASI Global Absolute Return Strategies Fund
2020
Cash (held)/pledged
£’000
Stock (held)/pledged
£’000
Market value of derivatives
£’000
Broker concentrations
Bank of America Merrill Lynch 298,126 86,954 61,274
298,126 86,954 61,274
Counterparty TableAt the balance sheet date the fund had the following exposures:
Collateral (held)/pledged
2021
Money market
£’000
Bi-lateral swaps£’000
Bi-lateral forwards
£’000
Reverse repo
£’000Cash£’000
Stock£’000
Net exposure
£’000
Counterparties
Agence Centrale 49,998 - - - - - 49,998
Bank of America Merrill Lynch - - (130) - - - (130)
Barclays 50,000 1,158 (1,542) - (3,059) - 46,557
Bayern 20,000 - - - - - 20,000
BNP Paribas - - 1,438 - (2,683) - (1,245)
Citigroup - (5,482) (3,463) - 8,480 - (465)
Credit Agricole 10,000 - (311) - 620 - 10,309
Credit Suisse 19,979 - - - - - 19,979
Dankse Bank - - - 52,999 363 (52,999) 363
Deutsche Bank - - 280 - (528) - (248)
First Abu Dhabi Bank 10,000 - - - - - 10,000
Goldman Sachs - 8,771 5,036 - (12,240) - 1,567
HSBC - - (2,467) - 3,564 152 1,249
JP Morgan - - 565 - (527) - 38
Lloyds Bank 20,000 - 80 - (143) - 19,937
Morgan Stanley - - 16,227 - (14,564) - 1,663
MUFG Bank 30,000 - - - - - 30,000
National Australia Bank - - - 100,000 - (100,593) (593)
NatWest Markets - - 4,695 - - (4,157) 538
Nordea Bank 10,000 - - - - - 10,000
OP Corporate Bank 10,995 - - - - - 10,995
Royal Bank of Canada - - 1,037 100,000 (2,460) (100,000) (1,423)
Santander 20,000 - - - - - 20,000
Societe Generale - - (505) - 490 214 199
Standard Chartered 20,000 - 1,859 - (2,649) - 19,210
StateStreet - - 433 - (420) - 13
UBS 20,000 - 133 - (855) - 19,278
Total 290,972 4,447 23,365 252,999 (26,612) (257,383) 287,788

73ASI Global Absolute Return Strategies Fund
Collateral (held)/posted
2020
Money market
£’000
Bi-lateral options
£’000
Bi-lateral swaps £’000
Bi-lateral forwards
£’000
Reverse repo
£’000Cash £’000
Stock £’000
Net exposure
£’000
Counterparties
Bank of America Merrill Lynch 10,000 - - (11,038) - 5,140 - 4,102
Bank of China 39,987 - - - - - - 39,987
Bank of Montreal 9,971 - - - - - - 9,971
Bank of Nova Scotia 19,499 - - - - - - 19,499
Banque Federative du Credit Mutuel 19,950 - - - - - - 19,950
Barclays 10,000 - 24,225 10,554 - (34,826) - 9,953
BNP Paribas 10,000 - - 32,016 100,000 (27,371) (100,000) 14,645
China Construction Bank 45,000 - - - - - - 45,000
Citigroup - - - 23,053 - (25,150) - (2,097)
Credit Agricole 20,000 - - (10,990) - 5,916 7,002 21,928
Credit Suisse 20,000 - - - - - - 20,000
Danske Bank 25,000 - - - - - - 25,000
Deutsche Bank - - - 17,237 - (16,131) - 1,106
First Abu Dhabi Bank 25,000 - - - - - - 25,000
Goldman Sachs - (11,526) 953 (16,880) - 24,742 2,123 (588)
Handelsbanken 30,000 - - - - - - 30,000
HSBC - - - 4,406 100,014 (4,092) (100,014) 314
ING 9,984 - - - - - - 9,984
JP Morgan - - - (7,382) - 7,032 - (350)
La Banque Postale 19,994 - - - - - - 19,994
Lloyds Bank 20,000 - - (2,381) - 1,330 777 19,726
Morgan Stanley - - 25,129 13,230 - (38,487) - (128)
MUFG Bank 30,000 - - - - - - 30,000
Natixis 20,000 - - - - - - 20,000
Natwest Markets - - - 11,431 - (9,584) - 1,847
Nordea Bank 19,972 - - - - - - 19,972
OP Corporate Bank 54,894 - - - - - - 54,894
Royal Bank of Canada 9,927 - - (5,253) - 5,061 - 9,735
Santander 20,000 - - - - - - 20,000
Societe Generale 20,000 - - 7,425 - (7,120) - 20,305
Standard Chartered 10,000 - - (9,202) 100,000 - (91,225) 9,573
StateStreet - - - (4,772) - 5,240 - 468
Toronto-Dominion Bank - - - - 100,000 - (100,000) -
UBS - - - (4,925) - 3,869 2,072 1,016
Total 519,178 (11,526) 50,307 46,529 400,014 (104,431) (379,265) 520,806
Stock collateral is of an appropriate quality and date for the fund.

74 ASI Global Absolute Return Strategies Fund
Collateral stock issuer concentration2021
£’0002020
£’000
United Kingdom (Govt. of) (257,749) (400,014)
US Treasury 14,288 107,703
(243,461) (292,311)
Margin exchanged and collateral held or pledged is in the form of high quality assets e.g. cash/gilts. Positions are fully collateralised at all times. Restrictions are placed on the right of either party to reuse collateral assets.
Liquidity riskThe following table provides a maturity analysis of the fund’s financial liabilities on a contractual basis.
2021On demand
£’000Up to one year
£’000
Over one year but not more
than five years£’000
Over five years£’000
Total£’000
Derivatives
Investment liabilities - 61,947 - 32,192 94,139
Non-derivatives
Other creditors - 140,197 - - 140,197
Bank overdrafts 41,146 - - - 41,146
Total financial liabilities 41,146 202,144 - 32,192 275,482
2020On demand
£’000Up to one year
£’000
Over one year but not more
than five years£’000
Over five years£’000
Total£’000
Derivatives
Investment liabilities - 376,143 18,589 53,623 448,355
Non-derivatives
Other creditors - 18,606 - - 18,606
Bank overdrafts 162,761 - - - 162,761
Total financial liabilities 162,761 394,749 18,589 53,623 629,722
17 Subsequent EventsSince the year end, markets and operations have continued to be disrupted by the effects of the COVID-19 pandemic. Since the year end the NAV per the Platform 1 Accumulation Units class has decreased by 1.00% (to 19 July 2021). Contingency plans at the Manager and key service suppliers have proven effective in mitigating the effects on management of the portfolio and on all supporting operations.

75ASI Global Absolute Return Strategies Fund
Distribution tableFor the year ended 31 March 2021 (in pence per unit)
Final dividend distributionGroup 1 - units purchased prior to 1 April 2020Group 2 - units purchased between 1 April 2020 and 31 March 2021
Revenue EqualisationDistribution paid
28/05/21Distribution paid
29/05/20
Retail accumulation
Group 1 0.4823 - 0.4823 1.1321
Group 2 0.1841 0.2982 0.4823 1.1321
Institutional accumulation
Group 1 0.8638 - 0.8638 1.5655
Group 2 0.4269 0.4369 0.8638 1.5655
Standard Life accumulation
Group 1 1.5040 - 1.5040 2.2161
Group 2 0.8937 0.6103 1.5040 2.2161
Standard Life A accumulation
Group 1 1.5670 - 1.5670 2.2918
Group 2 0.8248 0.7422 1.5670 2.2918
Platform 1 accumulation
Group 1 0.5908 - 0.5908 1.0876
Group 2 0.2277 0.3631 0.5908 1.0876
Institutional S accumulation
Group 1 0.6374 - 0.6374 1.1013
Group 2 0.2134 0.4240 0.6374 1.1013
Institutional A accumulation
Group 1 0.2049 - 0.2049 0.6349
Group 2 0.2049 - 0.2049 0.6349
EqualisationThis applies only to units purchased during the distribution period (group 2 units). It is the average amount of revenue included in the purchase price of group 2 units and is refunded to the holders of these units as a return of capital. Being capital it is not liable to income tax but must be deducted from the cost of units for capital gains tax purposes.

76 ASI Global Absolute Return Strategies Fund
The Trust engages in Securities Financing Transactions (SFTs) (as defined in Article 3 of Regulation (EU) 2015/2365, SFTs include repurchase transactions, securities or commodities lending and securities or commodities borrowing, buy-sell back transactions or sell-buy back transactions and margin lending transactions). In accordance with Article 13 of the Regulation, the Trust’s involvement in and exposures related to repurchase transactions and total return swaps (TRS) for the accounting year ended 31 March 2021 are detailed below:
Global data
Type
Total Outstanding
Value £’000
% of Lendable
assets % of NAV
Reverse Repurchase transactions 252,999 12.77 8.47
Total return swaps (5,860) (0.30) (0.20)
Concentration dataCounterparty exposure and security transferred in relation to Reverse repurchase agreements is dealt with in note 16 on page 72.
Counterparties total return swapsMarket value
£’000
Citigroup (5,482)
Goldman Sachs International Bank (378)
(5,860)
Aggregate Transaction Data
Country of registration Settlement
Type Collateral Quality Currency
Market value SFT
£’000
Maturity tenor SFT or TRS
Maturity tenorcollateral
Reverse Repurchase transactions
Danske Bank UK Bilateral UK Treasury AAA GBP 52,999 One week on demand
National Australia Bank UK Bilateral UK Treasury AAA GBP 100,000 One day to eight days on demand
Royal Bank of Canada UK Bilateral UK Treasury AAA GBP 100,000 One day to eight days on demand
Total return swaps
Citigroup UK Bilateral Cash n/a GBP (5,482) three months to a year on demand
Goldman Sachs UK Bilateral Cash n/a GBP (378) three months to a year on demand
Money market funds Total Return %
Aberdeen Standard Liquidity Fund (Lux) - Euro Fund -
Aberdeen Standard Liquidity Fund (Lux) - Sterling Fund 0.27
Aberdeen Standard Liquidity Fund (Lux) - US Dollar Fund 0.04
Safekeeping of collateralAs at the year end date, collateral was received for reverse repurchase transactions into a segregated account at the Trust’s Custodian in the form of UK Treasury bonds, valued at £253m.
As at the year-end date, total return swap net positions at each counterparty are ‘in the money’, however, collateral margins are maintained across all bilateral derivative positions with each counterparty and therefore, specific values in relation to total return swaps are not specified.
Data on return and cost for each type of SFTs and total return swapsAll returns and costs from reverse repurchase agreements and total return swap transactions accrue to the Trust and are not subject to any returns sharing arrangements with the Manager or any other third parties.
As at the year end, the reverse repurchase agreements have returned a gain of £36,000 and total return swaps returned a loss of £2m.
Securities Financing Transactions Disclosure (unaudited)

77ASI Global Absolute Return Strategies Fund
Remuneration PolicyThe abrdn plc Remuneration Policy applies with effect from 1 January 2018. The purpose of the abrdn plc Remuneration Policy (the “Policy”) is to document clearly the remuneration policies, practices and procedures of Standard Life Aberdeen. It has been approved by the abrdn plc Remuneration Committee and is subject to the Remuneration Committee’s annual review. The Policy applies to employees of the Standard Life Aberdeen group of companies (“SLA”).
Effective from 5 July 2021 Standard Life Aberdeen plc was renamed abrdn plc.
The Management Company, Aberdeen Standard Fund Managers Limited is authorised and regulated in the United Kingdom by the Financial Conduct Authority (“FCA”) and is a wholly owned subsidiary of abrdn plc.
The Remuneration Committee of abrdn plc adopted a UCITS V Remuneration Policy to ensure that the requirements of the Undertakings for Collective Investment Transferrable Securities V Directive (UCITS V) are fully adhered to by the group. This policy applies to Aberdeen Standard Fund Managers Limited and the UCITS Funds it manages. This policy is available on request.
Remuneration PrinciplesSLA applies Group wide principles for remuneration policies, procedures and practices ensuring that remuneration design and the basis for awards will be clear, transparent and fair, in line with business strategy, objectives, culture, values and long term interests of SLA. Remuneration policies, procedures and practices should be consistent with and promote good conduct which includes sound and effective risk management and not encourage risk taking that exceeds the level of tolerated risk of SLA. Total variable remuneration will be funded through pre-agreed distribution metrics. Where SLA’s financial performance is subdued or negative, total variable remuneration should generally be contracted, taking into account both current remuneration and reductions in pay-outs of amounts previously granted and having regard for SLA’s long term economic viability.
In addition to applying the SLA wide principles above, Aberdeen Standard Investments (“ASI”) applies a number of additional principles including the following, when determining remuneration for employees:
a) Remuneration should be competitive and reflect both financial, non-financial and personal performance;
b) Our remuneration design will align the interests of employees, shareholders and importantly our clients/customers;
c) Our remuneration structure will reward delivery of results over appropriate time horizons and will include deferred variable compensation at an appropriate level for the employee’s role;
d) We will provide an appropriate level of fixed remuneration to balance risk and reward.
Governance and Regulatory ComplianceThe Remuneration Committee is made up of independent non-executive directors and makes recommendations to the Board of abrdn plc (the ”Board”) to assist it with its remuneration related duties. The Chief Human Resources Officer of Standard Life Aberdeen is responsible for ensuring the implementation of the Policy in consultation with the Remuneration Committee as well as other members of the Executive Committee (“Executive Body”) (as defined by the Board), if appropriate.
Financial and non-financial criteriaVariable remuneration is based on a rounded assessment of Group, Divisional and individual performance. When assessing individual performance, financial as well as non-financial criteria are taken into account. Individual performance is based on the individual’s appraisal, which includes an employee’s compliance with controls and applicable company standards including the Group’s Code of Ethics, including Treating Customers Fairly and Conduct Risk.
Conflicts of interestThe Conflicts of Interest Policy is designed to avoid conflicts of interest between SLA and its clients. This Policy prohibits any employee from being involved in decisions on their own remuneration. Furthermore, all employees are required to adhere to SLA’s Global Code of Conduct, which encompasses conflicts of interest.
The Policy should, at all times, adhere to local legislation, regulations or other provisions. In circumstances or in jurisdictions where there is any conflict between the Policy and local legislation, regulations or other provisions, then the latter will prevail.
Remuneration (unaudited)

78 ASI Global Absolute Return Strategies Fund
Remuneration FrameworkEmployee remuneration is composed principally of fixed and variable elements of reward as follows:
a) Fixed reward (fixed remuneration: salary (and cash allowances, if appropriate); and Benefits (including pension).
b) Variable reward (bonus, a proportion of which may be subject to retention or deferral depending on role and regulatory requirements) and senior employees may also be awarded a long-term incentive award).
Appropriate ratios of fixed: variable remuneration will be set to as to ensure that:
a) Fixed and variable components of total remuneration are appropriately balanced and
b) The fixed component is a sufficiently high proportion of total remuneration to allow Standard Life Aberdeen to operate a fully flexible policy on variable remuneration components, including paying no variable remuneration component.
Fixed Remuneration Base salary provides a core reward for undertaking the role, where appropriate, and depending on the role, geographical or business market variances or other indicators, additional fixed cash allowances may make up a portion of fixed remuneration.
Benefits Benefits are made up of: core benefits, which are provided to all employees; and extra voluntary benefits that may be chosen by certain employees and which may require contribution through salary sacrifice or other arrangements. Extra voluntary benefits are designed to support the health and wellbeing of employees through enabling individual selection based on lifestyle choices. Standard Life Aberdeen will ensure that the core and voluntary employee benefits policies are in line with relevant market practice, its views on managing its business risk objectives, culture and values and long-term interests and local requirements.
Pension Standard Life Aberdeen’s pension policies (which consist of defined contribution plans and legacy defined benefit plans) are in line with legislative requirements, governance structures and market practice, and reflect Standard Life Aberdeen’s long-term views on risk and financial volatility, its business objectives, culture and values and long-term interests and local requirements. In certain circumstances, SLA may offer a cash allowance in lieu of any pension arrangement.
Annual Performance Bonus Awards
Employees who have been employed during a performance year (1 January to 31 December) may be eligible to be considered for an annual bonus in respect of that year. Eligibility criteria for an annual bonus are set out in the rules of the relevant bonus plan and/or contract of employment, as appropriate. The bonus plan in place is designed to reward performance in line with the business strategy, objectives, culture and values, long term interests and risk appetite of SLA. All Executive Directors are awarded bonuses under a SLA bonus plan as detailed in the Directors’ Remuneration Report.
Other variable Pay Plans Selected employees may participate in other variable pay plans, for example, performance fee share arrangements, where it is appropriate for their role or business unit. These plans operate under the overarching remuneration principles that apply across the group and, where appropriate, are also subject to specific principles governing incentives and are compliant with the requirements of any applicable regulatory standards.
Clawback/MalusA clawback/malus principle applies to the variable pay plan. This enables the Remuneration Committee to seek to recoup the deferred amount of any unvested variable pay, in the exceptional event of misstatement or misleading representation of performance; a significant failure of risk management and control; or serious misconduct by an individual.
Guaranteed Variable RemunerationGuaranteed variable remuneration is exceptional, occurs only in the context of hiring new staff and is limited to the first year of service.
UCITS V Identified StaffStaff considered UCITS V Identified Staff are those categories of staff whose professional activities have a material impact on the decision making profiles of the Management Company or the UCITS Funds that the Management Company manages.
UCITS V identified staff will include; Senior Management; Decision makers, Staff engaged in control functions; and any employees receiving total remuneration that takes them into the same remuneration bracket as senior management and decision makers, and whose professional activities have a material impact on the risk profiles of the Company or the Funds that the Company manages.

79ASI Global Absolute Return Strategies Fund
Control FunctionsSLA adheres to the principles and guidelines of regulations that apply to SLA in defining control functions. control functions include, but are not necessarily limited to, Risk, Compliance, Internal Audit and Actuarial functions or roles.
SLA will ensure that, as appropriate, senior employees engaged in a control function:
a) Are independent from the Business Units they oversee;
b) Have appropriate authority, and
c) Their remuneration is directly overseen by the Remuneration Committee.
This is achieved by the main control functions being outside the business, and a material proportion of their annual incentives being subject to a scorecard based on the performance of the control function. Performance against the scorecard is reviewed by the relevant independent governing committee (either Risk & Capital Committee, or Audit Committee). SLA’s People Function reviews the remuneration of employees in control functions and benchmarks with the external market to ensure that it is market competitive and adequately reflects employees’ skills and experience.
Personal HedgingUCITS V Identified Staff are not permitted to undermine the risk alignment effects of the UCITS V Remuneration Code. Personal hedging strategies; or remuneration-related insurance; or liability-related insurance is not permissible on remuneration.
Employee Remuneration DisclosureThe table below provides an overview of the following:
• Aggregate total remuneration paid by Aberdeen Standard Fund Managers Limited to its entire staff; and
• Aggregate total remuneration paid by Aberdeen Standard Fund Managers Limited to its ‘Identified Staff’.
The ‘Identified Staff’ of Aberdeen Standard Fund Managers Limited are those employees who could have a material impact on the risk profile of Aberdeen Standard Fund Managers Limited or the UCITS Funds it manages, including ASI Global Absolute Return Strategies Fund.
This broadly includes senior management, decision makers and control functions. For the purposes of this disclosure, ‘Identified Staff’ includes employees of entities to which activities have been delegated.
Amounts shown reflect payments made during the financial reporting period in question. The reporting period runs from 1 January 2020 to 31 December 2020 inclusive.
ASI Global Absolute Return Strategies Fund Headcount
Total Remuneration UCITS proportion
£’000 £’0004
Aberdeen Standard Fund Managers Limited staff1 137 33,224 5,084
of which
Fixed remuneration 24,540 3,755
Variable remuneration 8,684 1,329
Carried Interest NIL
Aberdeen Standard Fund Managers Limited ‘Identified Staff’2 199 7,456 2,851
of which
Senior Management3 9 723 277
Other ‘Identified Staff’ 190 6,733 2,575
1 As there are a number of individuals indirectly and directly employed by Aberdeen Standard Fund Managers Limited this figure represents an apportioned amount of SLA’s total remuneration fixed and variable pay, apportioned to the relevant UCITS Fund on an AUM basis, plus any carried interest paid by the UCITS Fund. The Headcount figure provided reflects the number of beneficiaries calculated on a Full Time Equivalent basis.2 The Identified Staff disclosure represents total compensation of those staff of the Management Company who are fully or partly involved in the activities of the Management Company, apportioned to the estimated time relevant to the Management Company, based on their time in role during the reporting period and the Management Company’s proportion of SLA’s total AUM. Across the ‘Identified Staff’, the average percentage of AUM allocation per individual based on work undertaken for Aberdeen Standard Fund Managers Limited as a Management Company was 10.99%.3 Senior management are defined in this table as Management Company Directors and members of the abrdn plc Board, together with its Executive Committee, Investment Management Committee and Global Product Forum.4 This figure represents an apportioned amount of the total remuneration of the ‘Identified staff’ attributable to the UCITS Fund allocated on an AUM basis.

80 ASI Global Absolute Return Strategies Fund
Further Information
ASI Global Absolute Return Strategies Fund is an authorised unit trust scheme, under the FCA regulations.
Consumers’ rights and protections, including any derived from EU legislation, are currently unaffected by the result of the UK referendum to leave the European Union and will remain unchanged unless and until the UK Government changes the applicable legislation.
DocumentationCopies of the current Prospectus and Key Investor Information Documents (KIIDs) for the ASI Global Absolute Return Strategies Fund, daily prices, together with the latest Annual (and if issued later the interim) Report and Accounts for any fund, are available to download at aberdeenstandard.com. A paper copy of the Report and Accounts is available on request from the Manager.
Notices/CorrespondencePlease send any notices to Aberdeen Standard Fund Managers Limited, PO Box 12233, Chelmsford, Essex CM99 2EE. Any notice to the Manager will only be effective when actually received by the Manager. All notices will be sent to the investor at the address set out in the Application form or the latest address which the investor has notified to the Manager, and will be deemed to have been received three days after posting.
Events detailed in these terms and conditions will be carried out on the dates specified, unless the dates are a non-business day, when they will be carried out on the next business day.
Complaints and CompensationIf you need to complain about any aspect of our service, you should write to the Complaints Team, Aberdeen Standard Investments, 10 Queen’s Terrace, Aberdeen, AB10 1XL, who will initiate our formal complaints procedure. If you prefer, you may call the Complaints Team on 01224 404490 or email [email protected] in the first instance. Alternatively if you have a complaint about the fund you can contact the Trustee directly. A leaflet detailing our complaints procedure is available on request.
We will endeavour to response your complaint as soon as possible and will notify you of our outcome within 8 weeks. If the complaint is not resolved by us to your satisfaction then you may have the right take your complaint to the Financial Ombudsman Service (FOS). To contact the FOS Service you should write to The Financial Ombudsman Service, Exchange Tower, London, E14 9SR, email complaint. [email protected] or telephone 0800 023 4567 (free for landlines and mobiles) or 0300 123 9123 (calls cost no more than calls to 01 and 02 numbers) or +44 20 7964 0500 (available from outside the UK – calls will be charged).
We are covered by the Financial Services Compensation Scheme, which means if we become insolvent, you may be entitled to compensation. The level of compensation will depend on the type of business and the circumstances of your claim. Investments are covered up to £85,000 for claims against firms that fail on or after 1 April 2019. Details are available from the FSCS Helpline on 0800 678 1100 or 020 7741 4100 and on the FSCS website: www.fscs.org.uk.
UCITSThe fund was certified under the Undertaking for Collective Investment in Transferable Securities (UCITS) directive, which allows the Manager to market the fund in member States of the European Union subject to relevant local laws, specifically marketing laws.

Visit us onlineaberdeenstandard.com121044607
The above document is strictly for information purposes only and should not be considered as an offer, investment recommendation or solicitation, to deal in any of the investments or funds mentioned herein and does not constitute investment research. Aberdeen Standard Fund Managers Limited (Aberdeen) does not warrant the accuracy, adequacy or completeness of the information and materials. Any research or analysis used in the preparation of this document has been procured by Aberdeen for its own use and may have been acted on for its own purpose. The results thus obtained are made available only coincidentally and the information is not guaranteed as to its accuracy. Some of the information in this document may contain projections or other forward looking statements regarding future events or future financial performance of countries, markets or companies. These statements are only predictions and actual events or results may differ materially. The reader must make their own assessment of the relevance, accuracy and adequacy of the information contained in this document and make such independent investigations, as they may consider necessary or appropriate for the purpose of such assessment. Any opinion or estimate contained in this document is made on a general basis and is not to be relied on by the reader as advice. Neither Aberdeen nor any of its employees, associated group companies or agents have given any consideration to nor have they or any of them made any investigation of the investment objectives, financial situation or particular need of the reader, any specific person or group of persons. Accordingly, no warranty whatsoever is given and no liability whatsoever is accepted for any loss arising whether directly or indirectly as a result of the reader, any person or group of persons acting on any information, opinion or estimate contained in this document. Aberdeen reserves the right to make changes and corrections to any information in this document at any time, without notice.
Issued by Aberdeen Standard Fund Managers Limited. Authorised and regulated by the Financial Conduct Authority in the United Kingdom.