Embed Size (px)
Citation preview
DTi F 0. COpyWRDC-TR-90-4099
,ASFR AND .LECTRONIC STUDIES OF METALLIZATIONSIN ELECTRONICS DEVICES
d, 7ahnviM, Rotol
I.srtal Institute of MetalsTechnion Research and Development Foundation-lochnion City, Haifa, 32000 Israel
0)NN
October 1990
Final Report for Period Sep 88 - Aug 89
Approved for public release; distribution unlimited
DTICE L E C orF
DEC I I
MATERIALS LABORATORYWRIGHT RESEARCH DEVELOPMENT CENTERAIR FORCE SYSTEMS COMMANDWRIGHT-PATTERSON AIR FORCE BASE, OHIO 45433-6533
90 k II 078
NOTICE
WHEN GOVERNMENT DRAWINGS, SPECIFICATIONS, OR OTHER DATA AREUSED FOR ANY PURPOSE OTHER THAN IN CONNECTION WITH A DEFINITELYGOVERNMENT-RELATED PROCUREMENT, THE UNITED STATES GOVERNMENTINCURS NO RESPONSIBILITY OR ANY OBLIGATION WHATSOEVER. THE FACTTHAT THE GOVERNMENT MAY HAVE FORMULATED OR IN ANY WAY SUPPLIEDTHE SAID DRAWINGS, SPECIFICATIONS, OR OTHER DATA, IS NOT TO BEREGARDED BY IMPLICATION, OR OTHERWISE IN ANY MANNER CONSTRUED,AS LICENSING THE HOLDER OR ANY OTHER PERSON OR CORPORATION; ORAS CONVEYING ANY RIGHTS OR PERMISSION TO MANUFACTURE, USE, ORSELL ANY PATENTED INVENTION THAT MAY IN ANY WAY BE RELATEDTHERETO.
THIS REPORT HAS BEEN REVIEWED BY THE OFFICE OF PUBLICAFFAIRS (ASD/PA) AND IS RELEASABLE TO THE NATIONAL TECHNICALINFORMATION SERVICE (NTIS). AT NTIS IT WILL BE AVAILABLE TO THEGENERAL PUBLIC INCLUDING FOREIGN NATIONS.
THTS TECHNICAL AEPORT HAS BEEN REVIEWED AND IS APPROVED FORPUBLICATION.
GEORGEOA. SLENSKI THOMAS D. COOPER, ChiefMaterials Integrity Branch Materials Integrity BranchSystems Support Division Systems Support DivisionMaterials Laboratory Materials Laboratcry
FOR THE COMMANDER
7 /
WARREN P. J9tNSON, ChiefSystem _%pport DivisionMaterials Laboratory
IF YOUR ADDRESS HAS CHANGED, IF YOU WISH TO BE REMOVED FROMOUR MAILING LIST, OR IF THE ADDRESSEE IS NO LONGER EMPLOYED BY
YOUR ORGANIZATION, PLEASE NOTIFY WRDC/MLSA, WRIGHT-PATTERSONAFB, OHIO 45433-6533 TO HELP MAINTAIN A CURRENT MAILING LIST.
COPIES OF THIS REPORT SHOULD NOT BE RETURNED UNLESS RETURNIS REQUIRED BY SECURITY CONSIDERATIONS, CONTRACTUAL OBLIGATIONS,OR NOTICE ON A SPECIFIC DOCUMENT.
REPORT DOCUMENTATION PAGE obs A .rovI
IIIII 07 41
No se f?"WMO gOu 0" for t n (Ocllmo Of I formatIOf It lmsunateE tO avqerag I nou ow rWoonse. incuoing we time fo rrimeva q AI1n JC1AI. watdirnq e dat owem.4 am fnefimtsim" moas ti need".ndo arno3m ig and r wwtnq Ol~iGOn of informaiIon.. wr €o meme "euW00ft leatI m I " dat sou ,
m~~~~~~~~~~~na~~~~~~Q601 Mr WAS" " 1 e~~l eCIftO f'tramnSfacmmfutl, O fla t e or a" coUw I'wt Of tt= Q#t Ijfrnauc e. n su uo to reucn tno, to W&mna tonA neaaaUattMe Sgrotl. 01r~a&ctora, InfrOffitW OfaWStion and AMOMu 315I Jefflam"
Oav* Mogmwaw. Swte 1204. Ault~goe. VA 22Z024302. anid -to thfiwoofS~ Mlfleqomeait and luaqet Paoffwors lieowon @t Dt0O 4.41M8.Wa~ffiuutqwoc igga%
1. AGENCY USE ONLY (Leavo Wlant) 2. REPORT DATE 3. REPORT TYME AND DATES COVEREDOct 1990 Final Scientific, 1 Sep 88-31 Aug-89
4. TITLE AND SUBTITLE S. FUNDING NUMBERSLASER AND ELECTROCHEMICAL STUDIES OF METALLIZATIONS IN
ELECTRONIC DEVICES Grant
AFOSR 86-0315L. AUTHOR(S)
J. Zahavi and M. Rotel
7. PERFORMING ORGANIZATION NAME(S) AND AOORESS(ES) I. PERFORMING ORGANIZATIONREPORT NUMBERIsrael Institute
of Metals504-591
Technion Research and Development FoundationTechnion City, Haifa, 32000 Israel
3. SPONSORINGI MONITORING AGENCY NAME(S) AND ADORESS(ES) 10. SPONSORING MONITORINGSponsoring Agency: Wright Research and Development Center AGENCY REPORT NUMBER
Materials Laboratory, Wright-Patterson AFB, OH 45433Monitoring Agency: European Office of Aerospace Research WRDC-TR-90-4099
and Development, Box 14, FPO New York 09510-0200
11. SUPPLEMENTARY NOTESThis research was partialTy funded by the inhouse independent research fund.
12a. DISTRISUTIONIAVAILABILITY STATEMENT 12b DISTRIBUTION CODE
4Approved for public release;Distribution unlimited
A
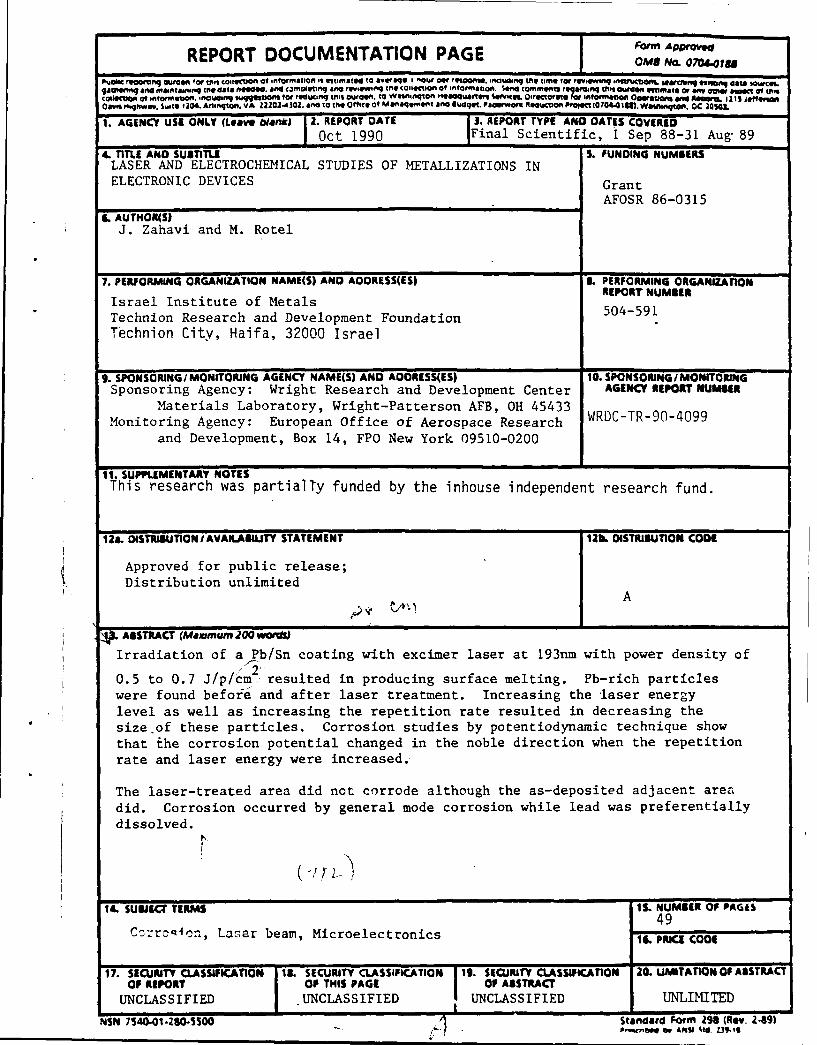
ABSTRACT (MaMmum 200 wo'li
Irradiation of a Pb/Sn coating with excimer laser at 193nm with power density of
2'0.5 to 0.7 J/p/cm, resulted in producing surface melting. Pb-rich particleswere found befofe and after laser treatment. Increasing the laser energy
level as well as increasing the repetition rate resulted in decreasing the
size.of these particles. Corrosion studies by potentiodynamic technique show
that the corrosion potential changed in the noble direction when the repetition
rate and laser energy were increased.
The laser-treated area did not corrode although the as-deposited adjacent area
did. Corrosion occurred by general mode corrosion while lead was preferentially
dissolved.
14. SUIUECT TERMS IS NUMBER OF PAGES49
Crrcin, Laser beam, Microelectronics IL PRICE COo.
17. SECURITY CLaSIFIAON 18. SECURITY CLASSIFICATION 19. SECURITY CLASSIFICATION 20. LIMTATION OF ABSTRACTOF REPORT OF THIS PAGE I Of ABSTRACT
UNCLASSIFIED UNCLASSIFIED UNCLASSIFIED UNLIMITED
NSN 7540-01-2W500- Standard Form 290 (Rev. 249)0'%r't Ow t A S tE. L39. o
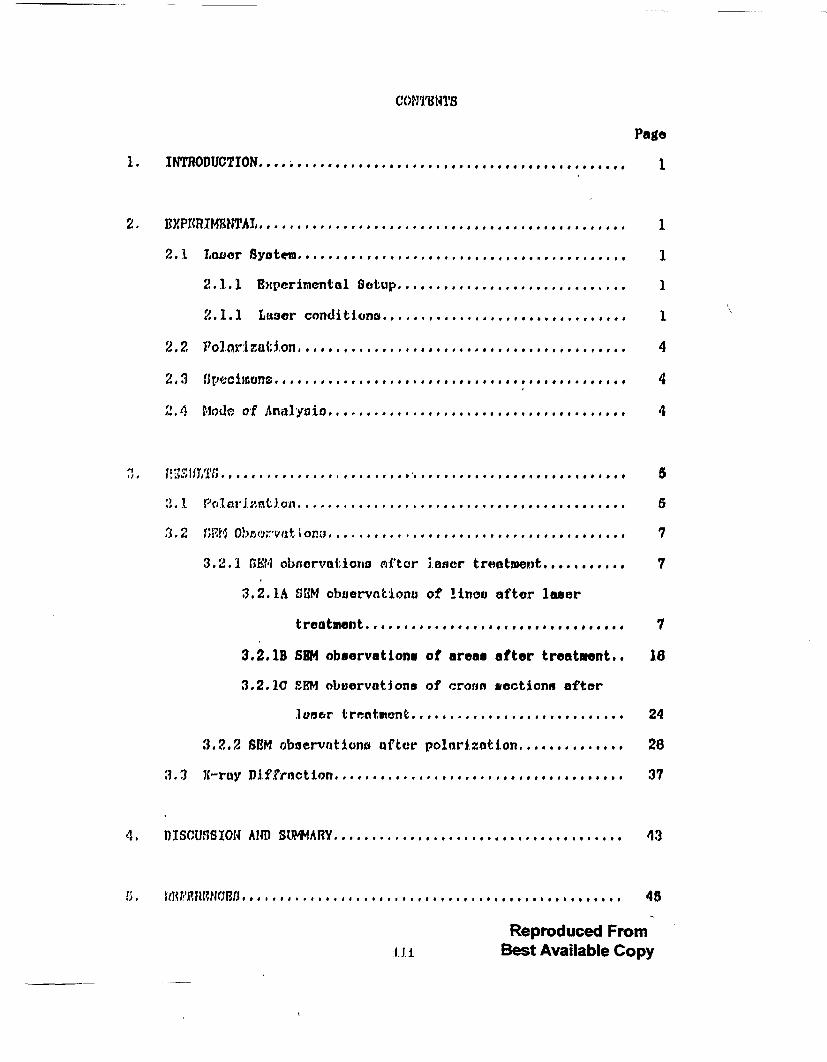
CON'JTUt4TS
Page
1. INTRODUCTION .. .. . ... ..... . .. .............. . 1
2. W EPIRTMENTAT .................................... o..........o.. 1
2.1] Lnuer Systemn ......................... ... .. .. ...... 1
2.1.1 Experimental Sotup . .......................... . 1
2.1.1 Laser conditions ....................... .......... I
2.2 o a i on ........ .... .......................... 4
2.3 B ecizone ..................... 4
M 'ode of Analy in ............................. 4
3. I;................... .. . . ... ...... . . . .. . .. . 5
:l. 1 Po1 J. I~ Of................................................ 5
3,2 fBM O ,.s' t on ............. .......... .. ........ 7
3.2.1 5E4,1 obacrvationw nfter leanor treatment .......... 7
3.2.1A SUM obuervntionu of lino after laser
treatment .................................. 7
3.2.1B 5HM observations of areas after treatment.. 16
3.2.10 SHM observations of crogn *ectionx after
, eer treatmnt ..... ....... ...... ........ 24
3.2.2 SHM observations after polnrization .............. 26
3.3 X-ray Dif.raction ..................... . . .. ...... 37
4. ,ISCUSSION AND SU.. . ARY.......................................... 43
5~. Ya I4 # 9 9 * 91* *9 *9 99 I9 9~ 9* * V9?ICH5............. 45
Reproduced From, j. ~Best Available Copy
During this year Pb/Sn coatings were irradiated with excimer laser at
higher energies (0.5 to 0.7 J/p/cm 2). The treated and untreated surfaces were
studied by observing tho coating morphology before and after potentiodynamic
polari zat1 on. The laser-treated su-faces rho, d reduction in Pb-rich
particles as repei.Lion rate and energy were increasd. Corrosion of the as-
depositO ai-ta occur'ed through preferential lead dissolution, possibly
because of the more anodic corrosion potential,
2. SIPIIff WU#t
2.1 Laa~r Sy sie
2.1.1 Ezperimental setup
The laser used in our experiments was the excimer model 20IMSC (Lambda
Physik). In these experiments the laser was focused perpendicular to the
specimen through nit optimally-shaped lens in order to achieve higher energies
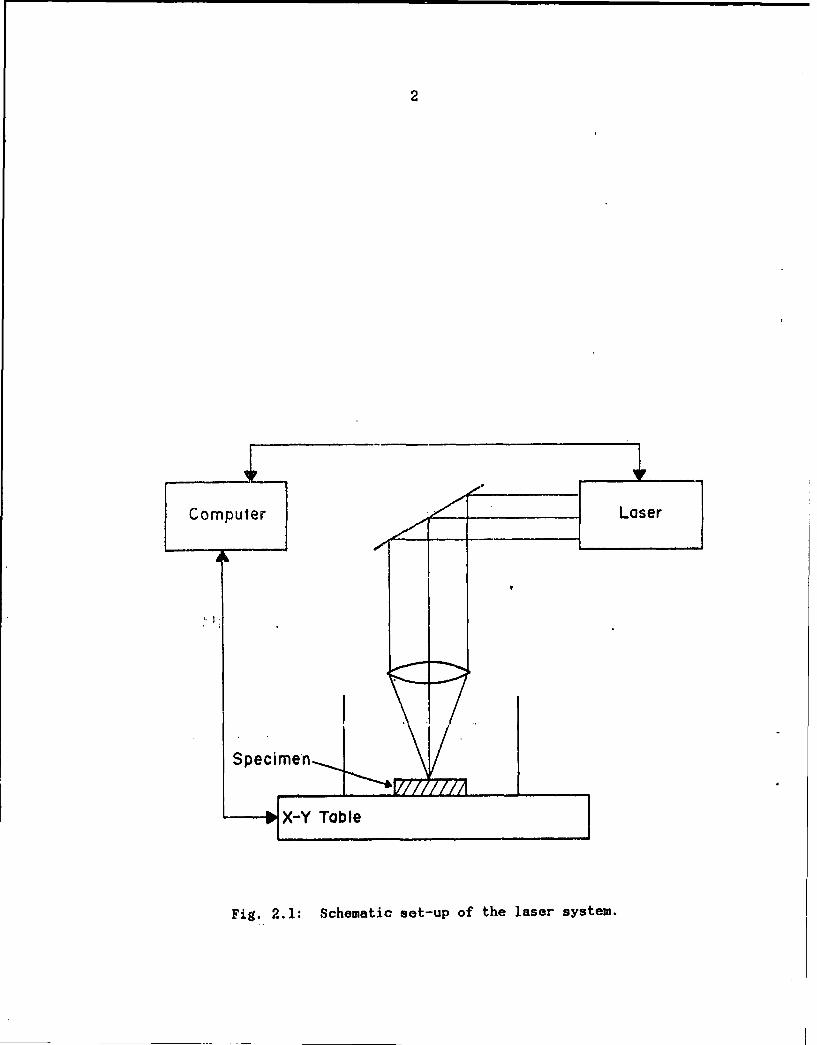
than those used during the proceding year. Fig. 2.1 shows the schematic
set-up.
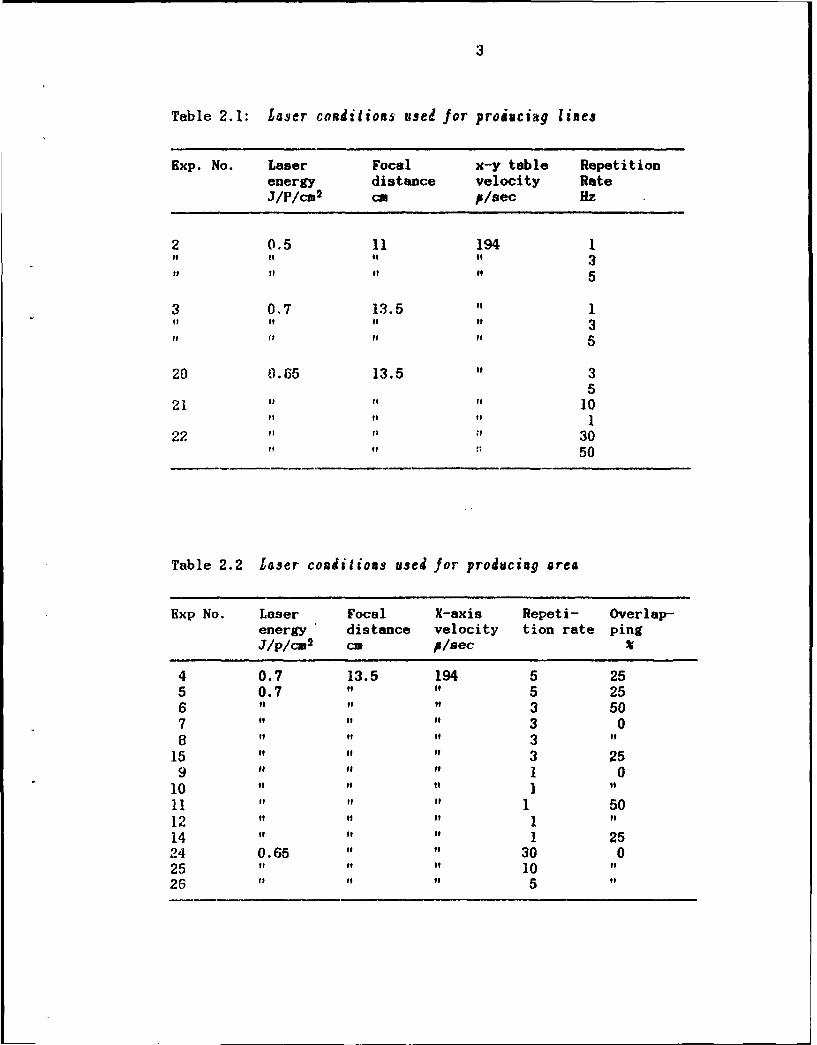
2.1.2 Laser conditions
In order to select the laser operating conditions lines were produced at
different focal distances (i.e. different pulse energies). These conditions
were used afterwards to produce areas with varying overlapping which were used= =
for polarization tests. Tables 2.1 and 2.2 summarize the laser conditions
used in these experiments.o-' s ribut ion/Avnilability Codes
SlAvnil an-d/or
-- J ..specl
Computer Loser
Specimen-
Fig. 2.1: Schematic set-up of the laser system.
3
Table 2.1: L4ser conditions used for producing lines
Exp. No. Laser Focal x-y table Repetitionenergy distance velocity RateJ/Pl2 cm F/sec Hz
2 0.5 11 194 1it it to to 3
f it it it 5
3 0.7 13.5 " 1of to "1 "t 3it if tf of 5
20 0. 65 13.5 o 35
21 ff It 10ftft t! I
22 1 30ft "f 50
Table 2.2 Laser conditions used for producing area
Exp No. Laser Focal X-axis Repeti- Overlap-energy distance velocity tion rate pingJ/p/cM2 c p/sec
4 0.7 13.5 194 5 255 0.7 t i 5 256 ft t 3 507 of of 3 08 f " t 3 o
15 " o " 3 259 of o 1 010 "t f t I 11 " " " 1 5012 of i 1 o14 t " o 1 2524 0.65 i " 30 02 5 t t " 1 0 "
26 If f 5 "
4
2.2 Polarization
Polarization was carried out on a corrosion measurement unit model 350A
(EGSG Princeton Applied Research). Potentiodynmmic polarization was applied
in order to evaluate the effect of laser treatment on the corrosion process of
the Pb-Sn coating, the parameters being as follows:
Scan rate: 0.5 mV/sec
initial potential: -1.0 Volt (versus S.C.E.)
Vertex potential: 0.0 V or 1.5 V (versus S.C.E.)
Initial delay: 5 min.
A detailed description of' the polarization technique was given in the first
annual research report (1).
2.3 Specimens
The specimens used for laser treatment and polarization were commercial
40-60 Pb-Sn coatings on epoxy plated by copper electrolysis. The coating was
about 17microns and the copper layer about 40 microns thick.
2.4 lode of Auslysis
Optical microscopy was carried out with a Nikon instrument equipped with
a camera.
Scaming electron microscopy was carried out with Joel T-840 and T-200
instruments.
Semiquontctive micronsalpsis was carried out with X-ray energy dispensive
unit (EDS), Tracer PN 200 and Link AN10000.
I-ray diffraction was carried out with Philips x-ray generator, model
1730 using a Cu lamp with graphite monochrouator and a vertical
diffractometer.
5
RESULTS
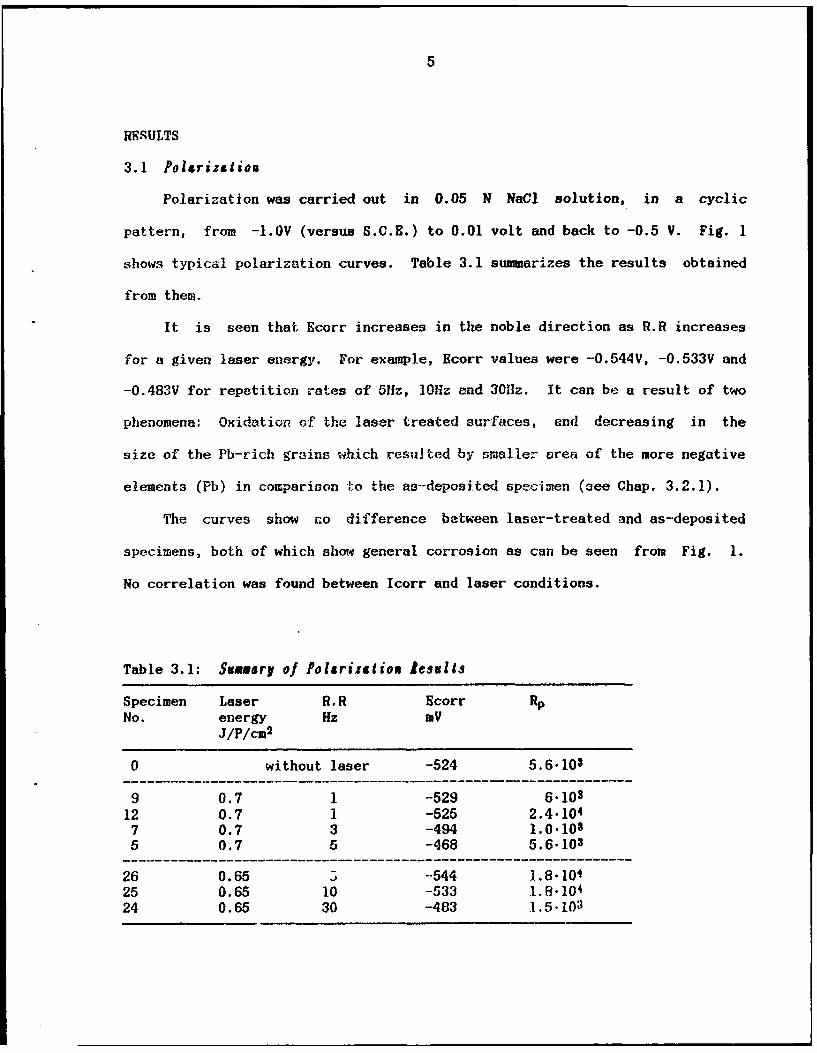
3.1 Polarization
Polarization was carried out in 0.05 N NaCl solution, in a cyclic
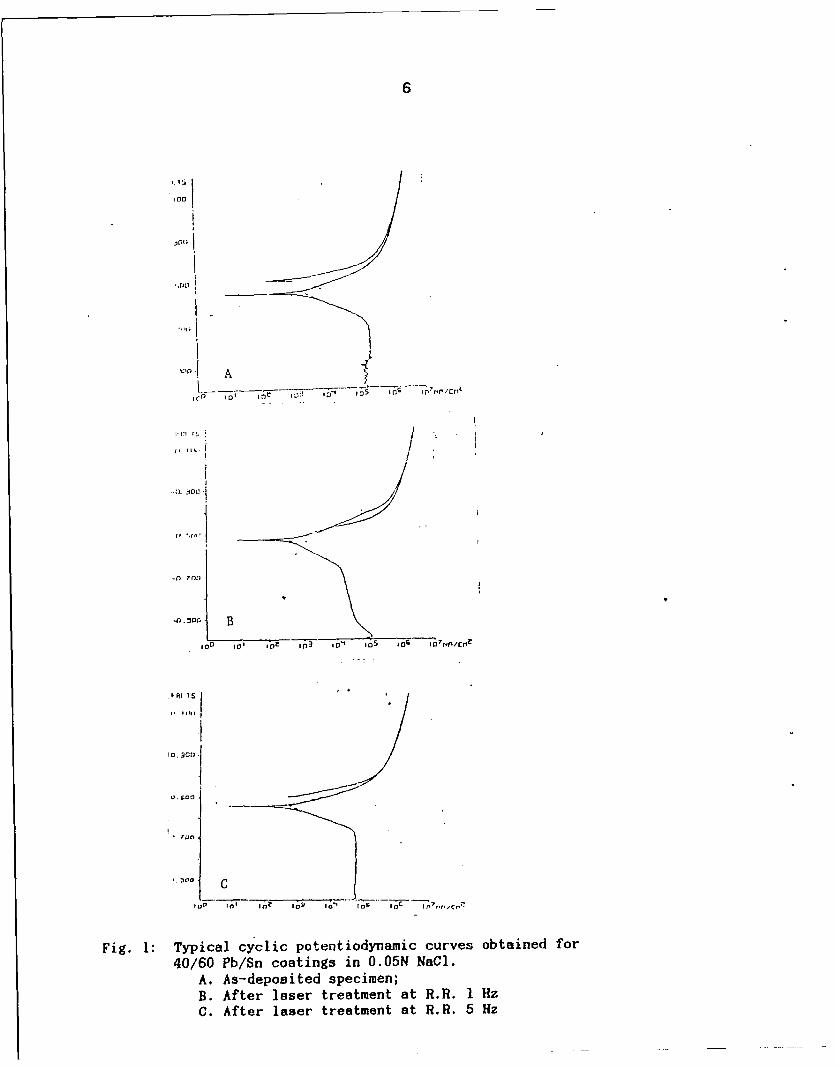
pattern, from -1.oV (versus S.C.E.) to 0.01 volt and back to -0.5 V. Fig. 1
shows typical polarization curves. Table 3.1 summarizes the results obtained
from them.
It is seen that Ecorr increases in the noble direction as R.R increases
for a given laser energy. For example, Ecorr values were -0.544V, -0.533V and
-0.483V for repetition rates of 5z, 10Hz and 30Hz. It can be a result of two
phenomena: Oxidation of the laser treated surfaces, and decreasing in the
size of the Pb-rich grains which resulted by smaller area of the more negative
elements (Pb) in comparison to the as--deposited specimen (see Chap. 3.2.1).
The curves show no difference between laser-treated and as-deposited
specimens, both of which show general corrosion as can be seen from Fig. 1.
No correlation was found between Icorr and laser conditions.
Table 3.1: Summary of Polsrization lesults
Specimen Laser R.R Ecorr RpNo. energy Hz mV
J/P/CM2
0 without laser -524 5.6103
9 0.7 1 -529 610312 0.7 1 -525 2.4.1047 0.7 3 -494 1.0.10s
5 0.7 5 -468 5.6-103
26 0.65 -544 1.8.10425 0.65 10 -533 1.8.10424 0.65 30 -483 .5.103
6
I on
in1
)
,1 , C) 5 1 n .
I/
-0 7M1)
Q. SOO -
I...300 C
"4°° C B
*n III,
Fig. 1: Typical cyclic potentiodynamic curves obtained for
40/60 Pb/Sn coatings in 0.05N NaCl.A. As-deposited specimen;B. After laser treatment at R.R. 1 Hz
C. After laser treatment at R.R. 5 Hz
7
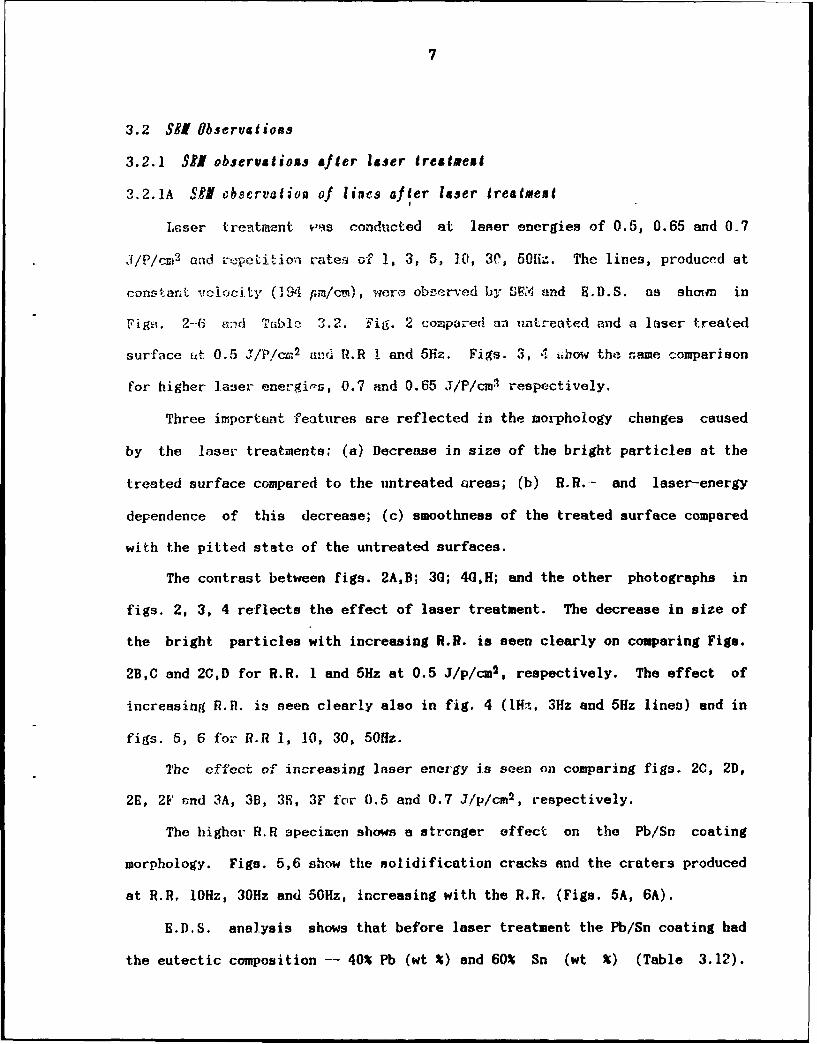
3.2 SR Observations
3.2.1 SRI observlaions ljfer laser treatment
3.2.1A SY observation of lines after laser treatment
Laser treatment vas conducted at laser energies of 0.5, 0.65 and 0.7
J/P/cM 2 and ripeLition rates of 1, 3, 5, 10, 30, 50z. The lines, produced at
constant velocity (194 pm/cn), were observed by S0'3 and E.D.S. as showm in
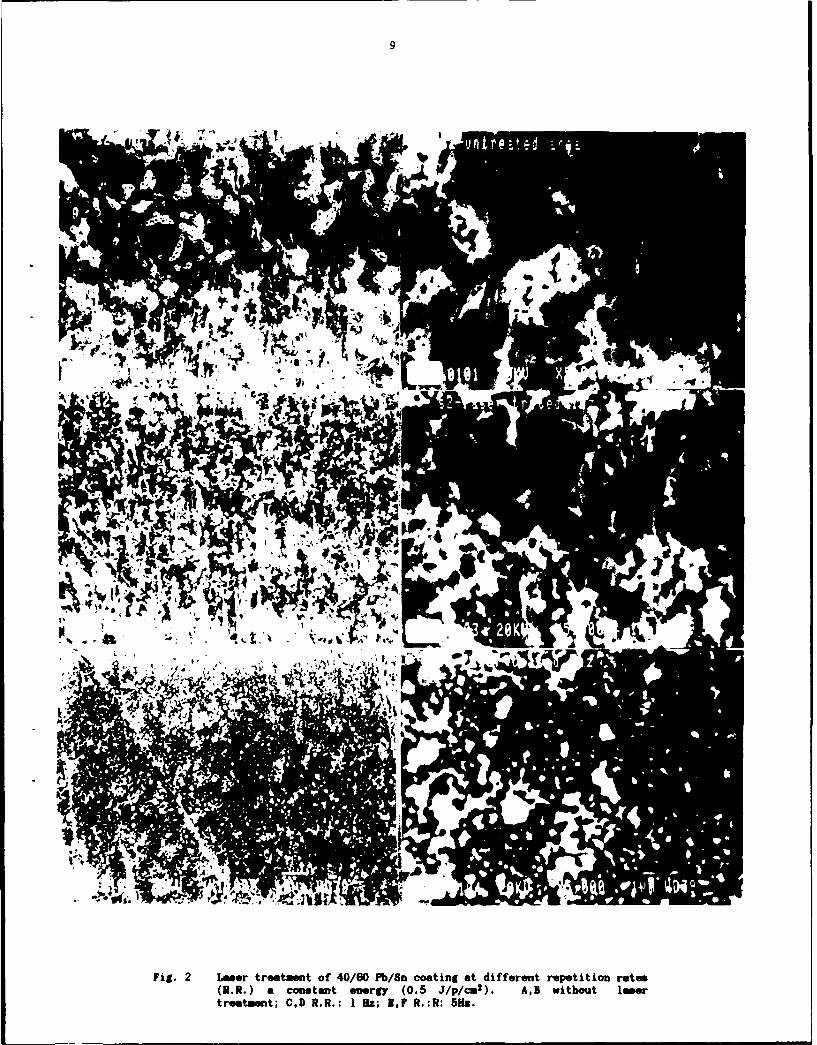
Figs. 2-6 a:nd Table 3.2. Fig. 2 compared an untreated and a laser treated
surface t 0.5 J/P/cm2 and R.R I and 5Hz. Figs. 3, A hhow the same comparison
for higher laser energins, 0.7 and 0.65 J/P/cml respectively.
Three important features are reflected in the morphology changes caused
by the laser treatments; (a) Decrease in size of the bright particles at the
treated surface compared to the untreated areas; (b) R.R.- and laser-energy
dependence of this decrease; (c) smoothness of the treated surface compared
with the pitted state of the untreated surfaces.
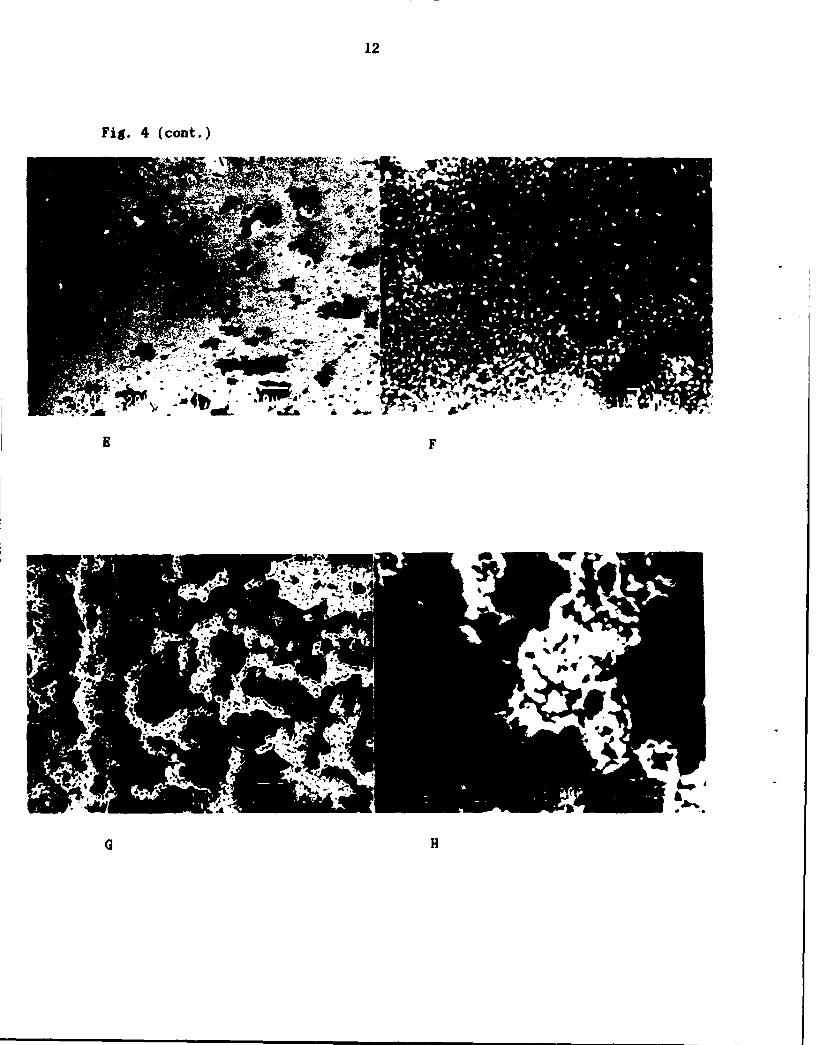
The contrast between figs. 2A,B; 3G; 4G,H; and the other photographs in
figs. 2, 3, 4 reflects the effect of laser treatment. The decrease in size of
the bright particles with increasing R.R. is seen clearly on comparing Figs.
2B,C and 2C,D for R.R. 1 and 5Hz at 0.5 J/p/cm2 , respectively. The effect of
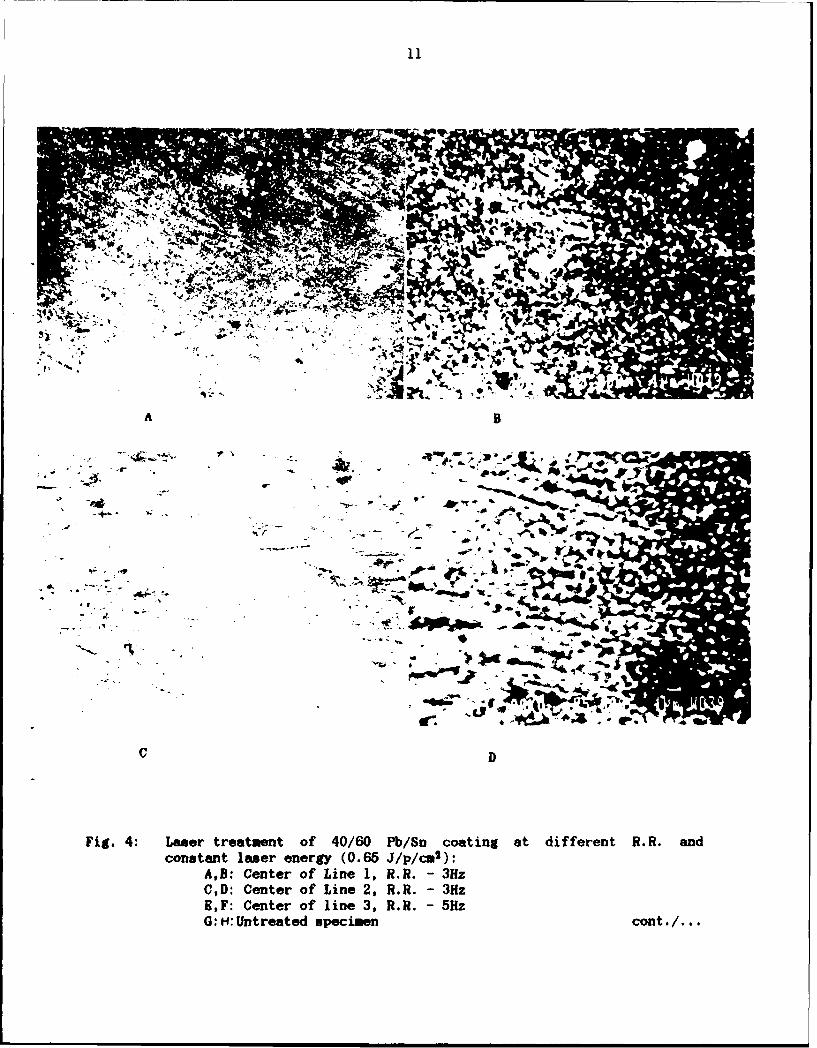
increasing R.R. is seen clearly also in fig. 4 (1H, 3Hz and 5Hz lines) and in
figs. 5, 6 for R.R 1, 10, 30, 50Hz.
The effect of increasing laser energy is seen on comparing figs. 2C, 2D,
2E, 2F and 3A, 3B, 3E, 3F for 0.5 and 0.7 J/p/cm2 , respectively.
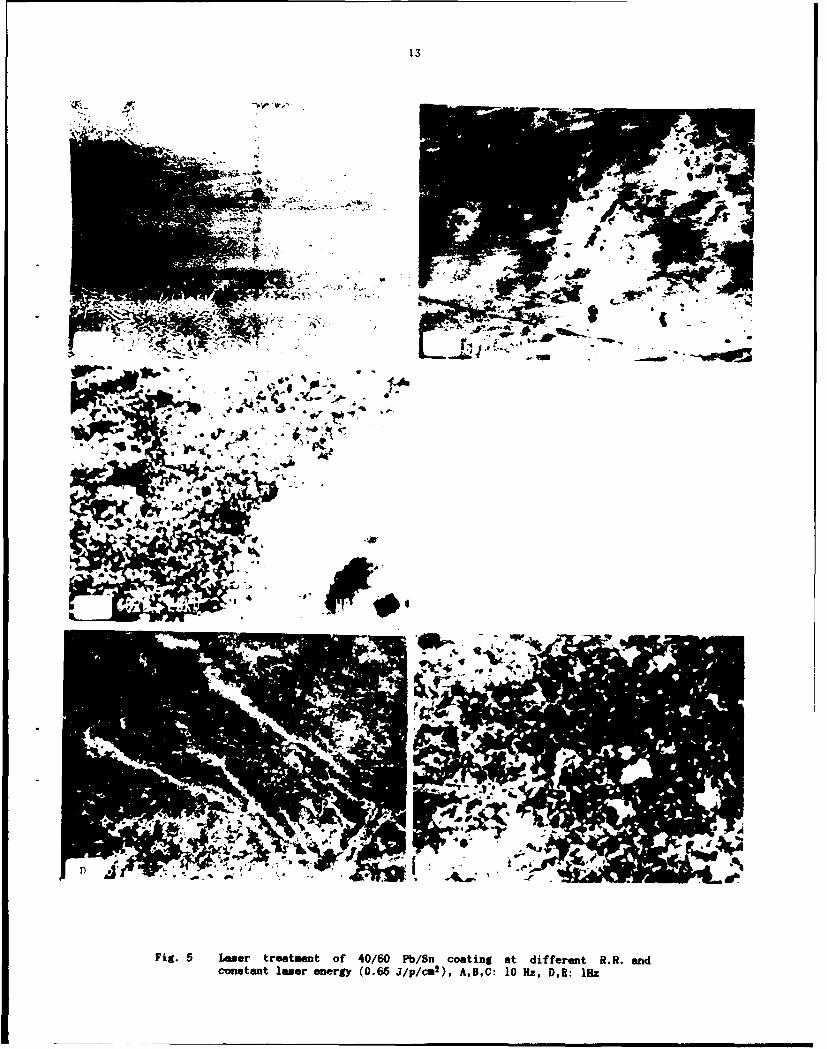
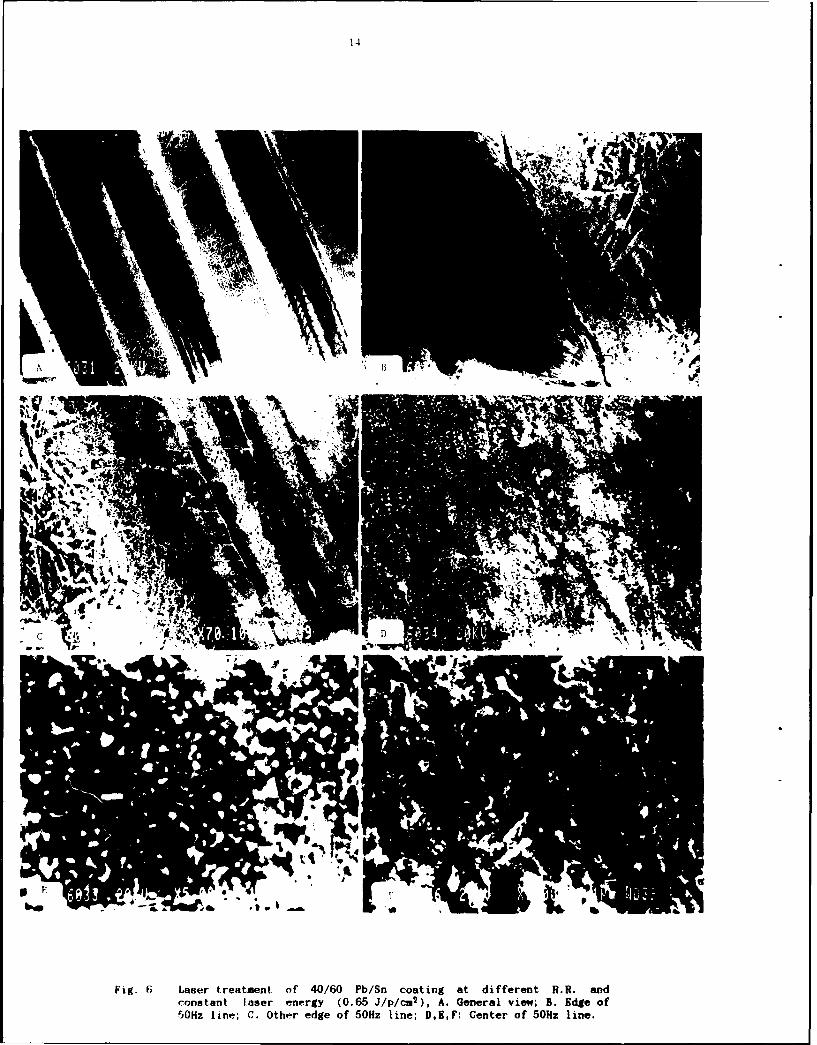
The higher R.R specimen shows a stronger effect on the Pb/Sn coating
morphology. Figs. 5,6 show the solidification cracks and the craters produced
at R.R. 10Hz, 30Hz and 50Hz, increasing with the R.R. (Figs. 5A, 6A).
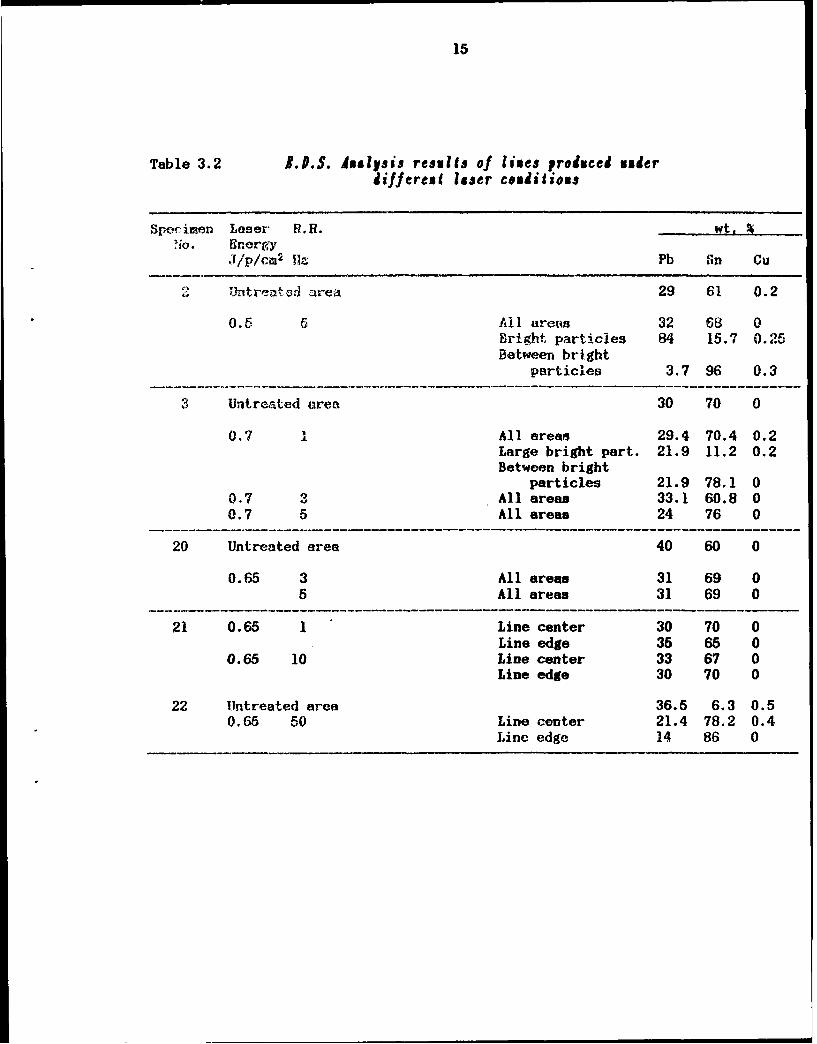
E.D.S. analysis shows that before laser treatment the Pb/Sn coating had
the eutectic composition -- 40% Pb (wt %) and 60% Sn (wt %) (Table 3.12).
8
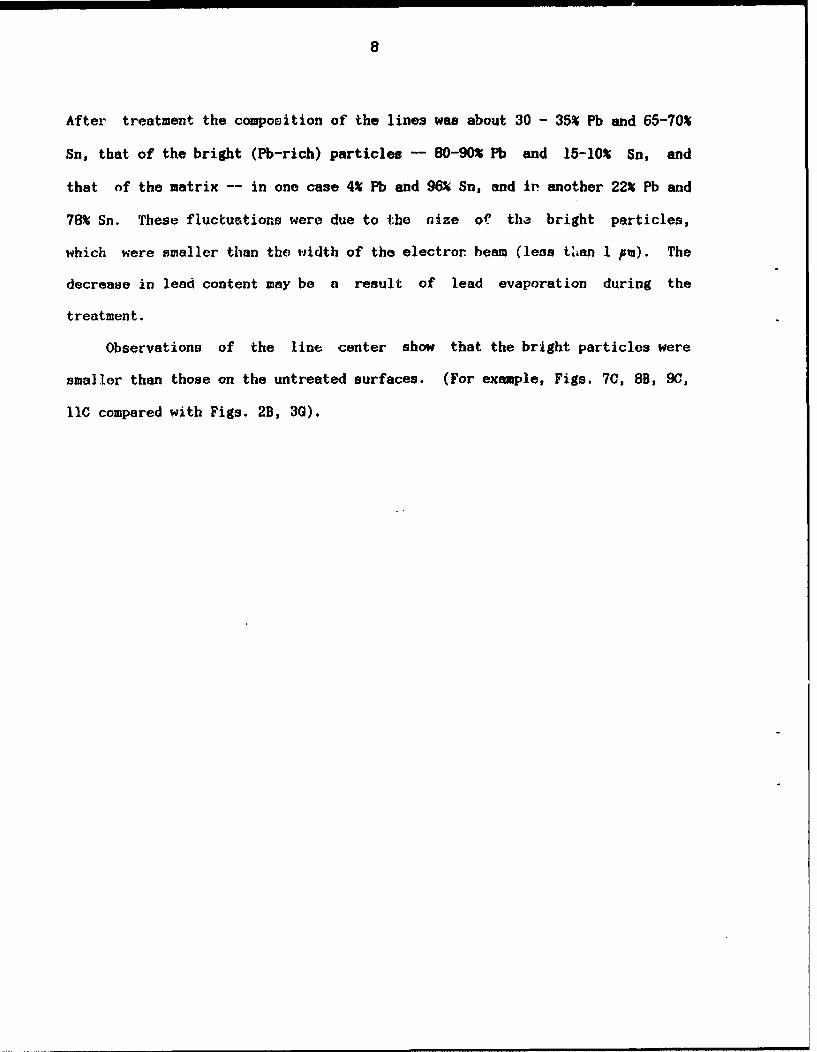
After treatment the composition of the lines was about 30 - 35% Pb and 65-70%
Sn, that of the bright (Pb-rich) particles - 80-90% Pb and 15-10% Sn, and
that of the matrix -- in one case 4% Pb and 96% Sn, and in another 22% Pb and
78% Sn. These fluctuations were due to the nize of tha bright particles,
which were smaller than the width of the electror beam (lees than 1 pm). The
decrease in lead content may be a result of lead evaporation during the
treatment.
Observations of the line center show that the bright particles were
smaller than those on the untreated surfaces. (For example, Figs. 7C, 8B, 9C,
11C compared with Figs. 2B, 30).
9
Fig. 2 Laser tresatment of 40/60 Pb/Sn coating at different reptition rates(U.N.) a constant energy (0.5 J/p/cm2 ). A,B witbout lasertreatment; C,D U.N.: 1 Hiz; l,F R. :R: 5Hz.
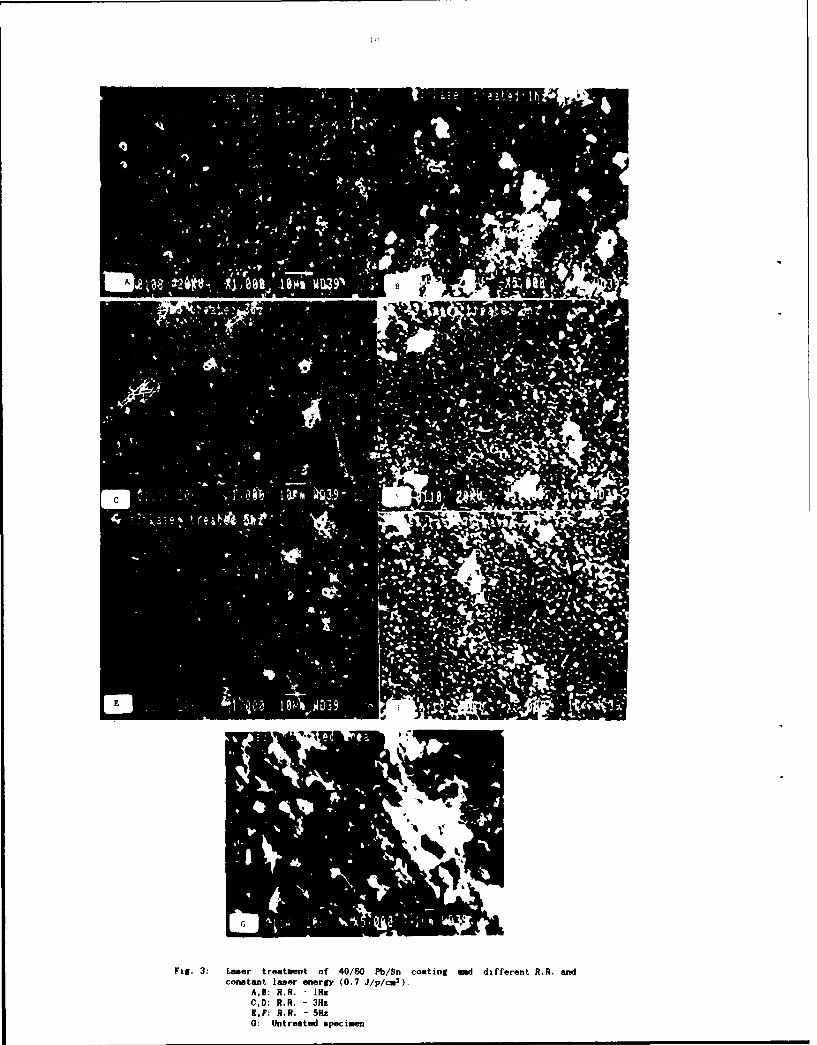
Fig. 3: Laser treatment of 40/60 Pb/Sn coating and different R.R. andconstant laser energy (0.7 J/p/c=2 ).
A,B: R.R. - 1HzC,D: R.R. - 3HzB,?: R.R. - 5Hz0: Untreated specimen
11.
4475
...
0
.- -'fl
S.., 40-
C~ D
AB: ~ Cetro in ,RR - 3Hz
CD Cente ofLn ,RR H
EF Cete of lie3 .R
ig.4: asertretente of4060P/Sccainmaeifern con./...
12
Fig. 4 (cant.)
... -----
.F'hall
13
INS -,pqP
bo~
Fig. 5 Laser treatment of 40/60 Pb/Sn coating at different R.R. andconstant laser energy (0.66 J/p/cm2 ), A,B,C: 10 Hz, D,R: 1Hz
J614
A
II
Fig. 6 Laser treatment of 40/60 Pb/Sn coating at different R.R. andconstant loser energy (0.65 J/p/cu2), A. General view; B. Edge of50Hz line; C. Other edge of 50Hz line; D,H,F: Center of 50Hz line.
15
Table 3.2 I.P.S. Aslysis results of lies produced vuderiiffereni laser conditions
Spec imen Leser R.H. wt. Mio. Energy,
J/P/cM 2 fiz Pb Sn Cu
Ihitreatod area 29 61 0.2
0.5 6 Ail area 32 68 0Bright particles 84 15.7 0.25Betw€een bright
particles 3.7 96 0.3
3 Untreated area 30 70 0
0.7 1 All areas 29.4 70.4 0.2Large bright part. 21.9 11.2 0.2Between bright
particles 21.9 78.1 00.7 3 All areas 33.1 60.8 00.7 5 All areas 24 76 0
20 Untreated area 40 60 0
0.65 3 All areas 31 69 05 All areas 31 69 0
21 0.65 1 Line center 30 70 0Line edge 36 66 0
0.65 10 Line center 33 67 0Line edge 30 70 0
22 Untreated area 36.5 6.3 0.50.65 50 Line center 21.4 78.2 0.4
Line edge 14 86 0
16
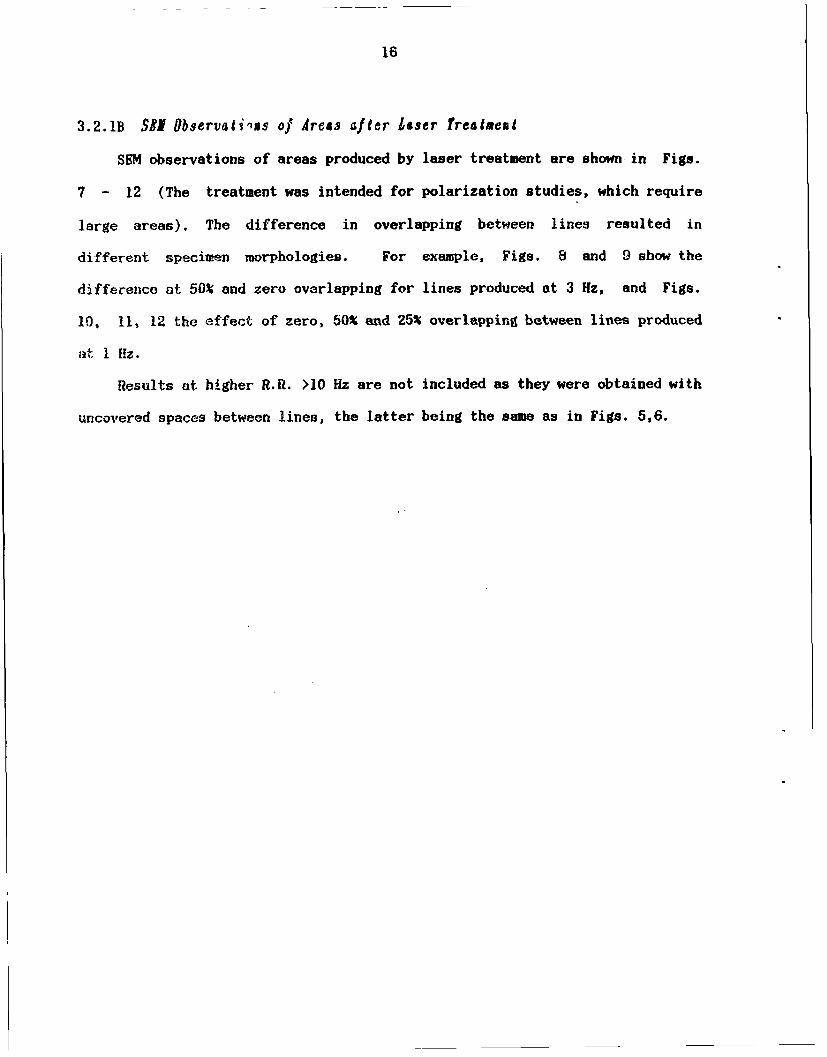
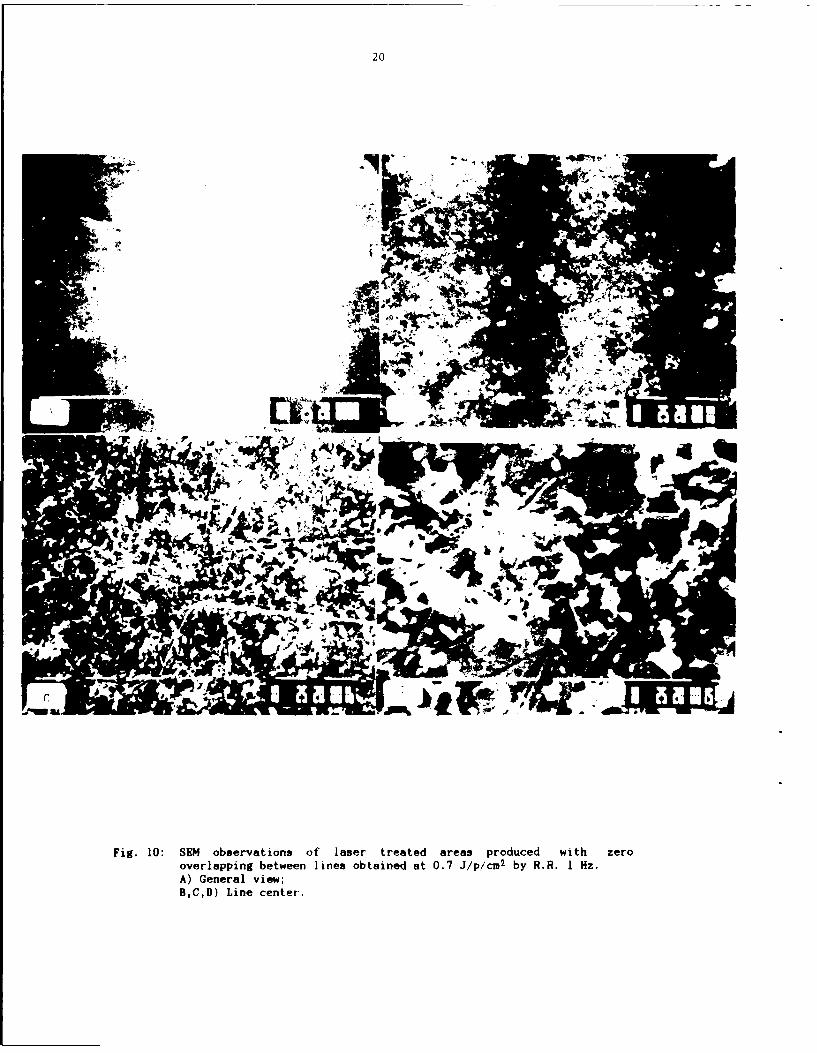
3.2.1B SBJ Observaliius of Jreas after £sser freatment
SEM observations of areas produced by laser treatment are shown in Figs.
7 - 12 (The treatment was intended for polarization studies, which require
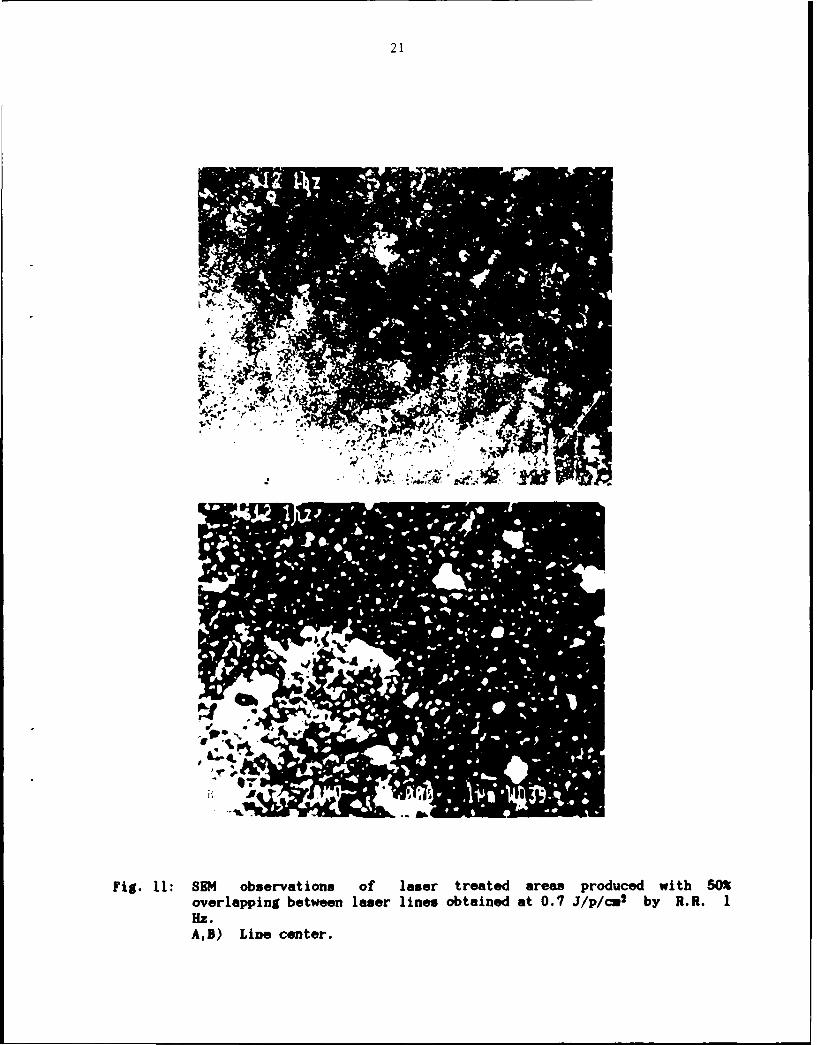
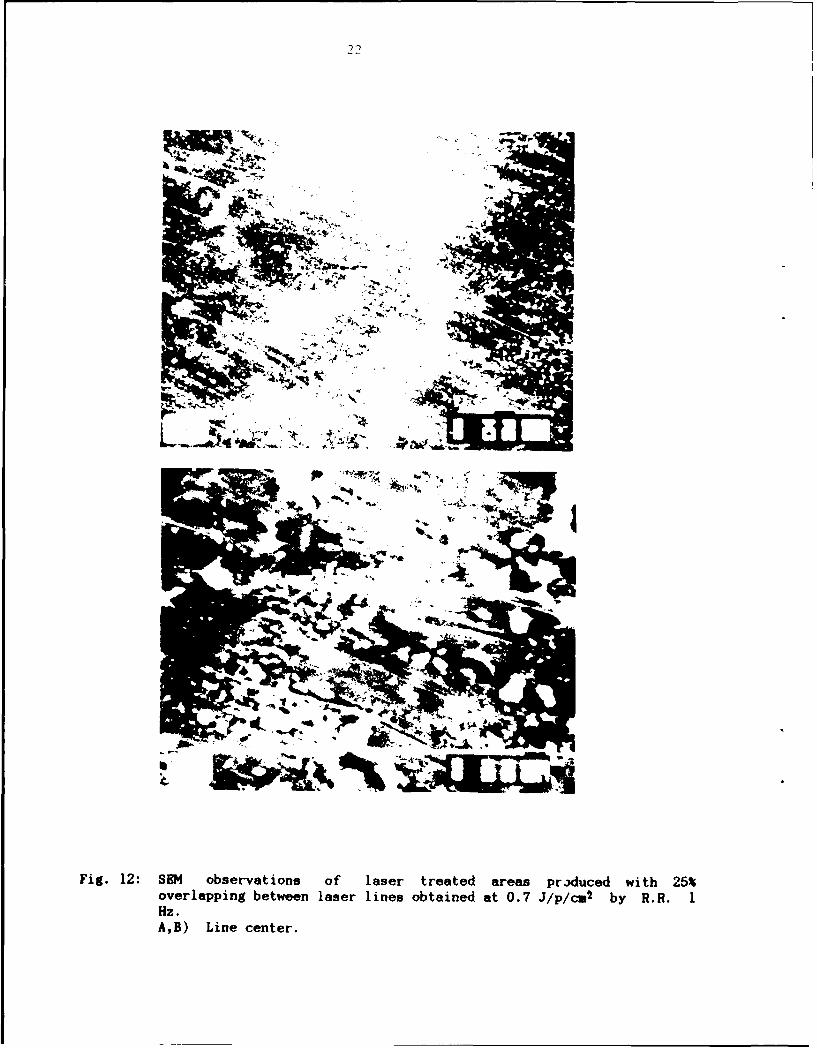
large areas). The difference in overlapping between lines resulted in
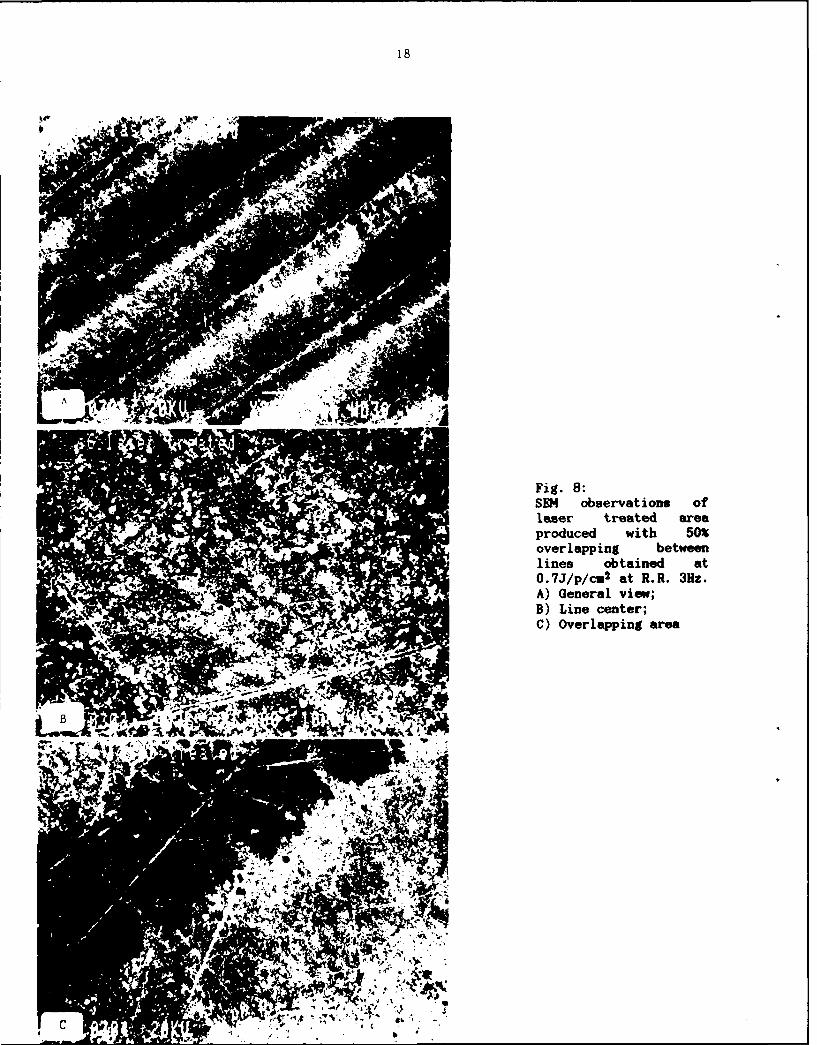
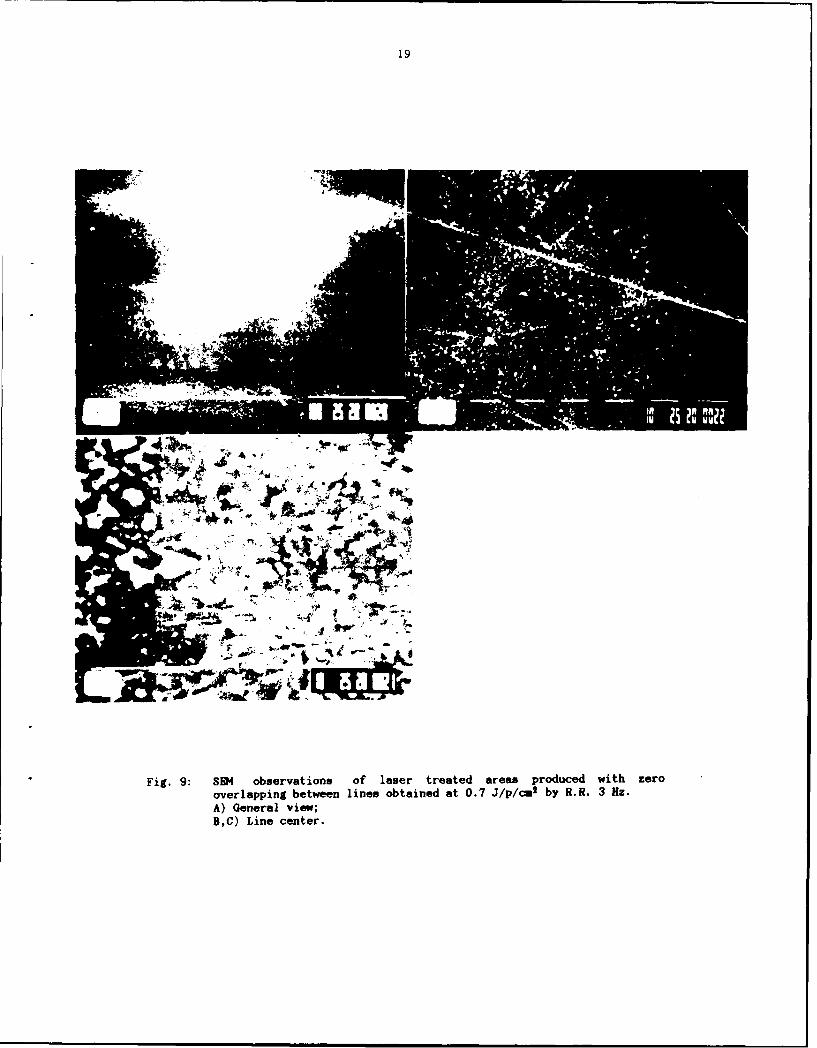
different specimen morphologies. For example, Figs. 8 and 9 show the
difference al: 50% and zero overlapping for lines produced at 3 Hz, and Figs.
10, 11, 12 the effect of zero, 50% and 25% overlapping between lines produced
at 1 Hz.
Results at higher R.R. >10 Hz are not included as they were obtained with
uncovered spaces between lines, the latter being the same as in Figs. 5,6.
17
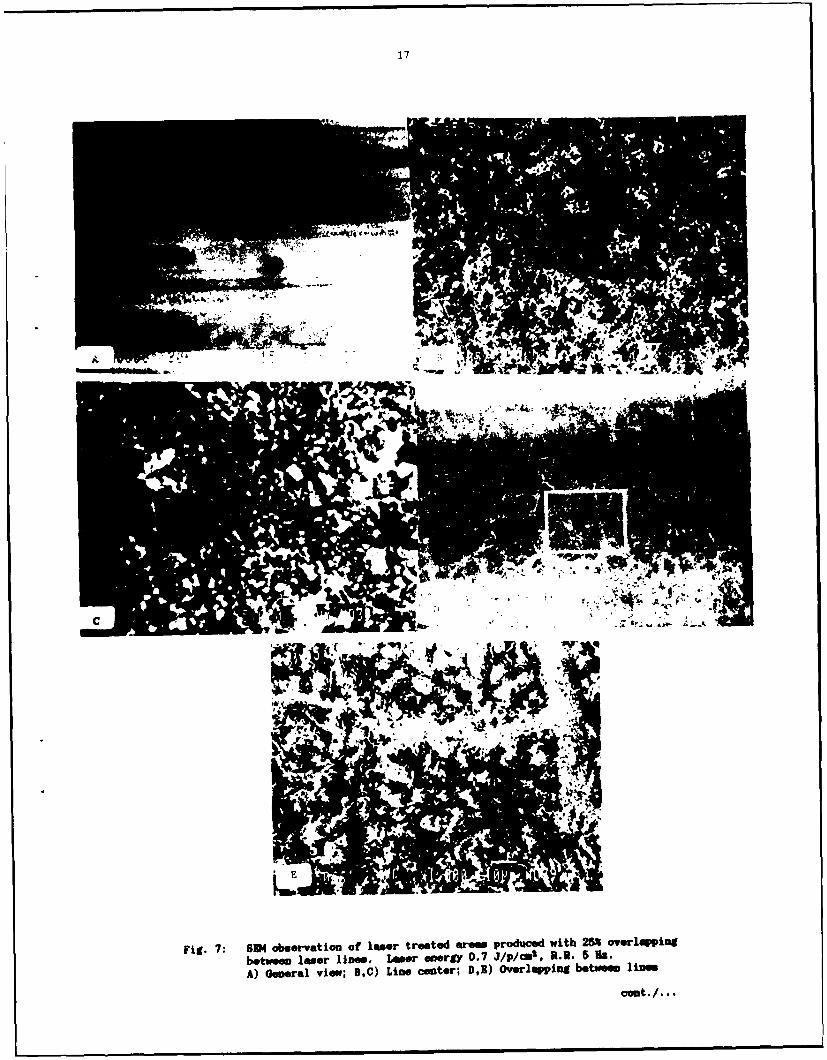
Fig. 7: 834 observation of lower treated areas Produced with 25* OvwlspingTbetween lager lines. Laser energy 0.7 J/p/cml, R.R. 59Hs.
A) General view; 9,C) Line center; D,E) Overlapping betwe lines
cant./...
18
-~ Fig. 8:.SEM observations of
£laser treated areaproduced with 50%
4.overlapping between* .- lines obtained at
- * O.7J/p/cu2 at R.R. 3Hz.A) General view;
* B) Line center;* C) Overlapping are
Cra * a -IN
19
41
Fig. 9: SEM observations of laser treated areas produced with zerooverlapping between lines obtained at 0.7 J/p/cu
2 by R.R. 3 Hz.A) General view;8,C) Line center.
20
*Ile
LAt7 A
Fig. 10: SEM observations of laser treated areas produced with zerooverlapping between lines obtained at 0.7 j/p/CM2 by R.R. I Hz.A) General view;BC,D) Line center.
21
Fig. 11: SEM observations of laser treated areas produced with 60%overlapping between laser lines obtained at 0.7 j/p/Cut by R.R. 1HZ.AD) Line center.
22a
Fig. 12: SEN observations of laser treated areas produced with 25%aoverlapping between laser lines obtained at 0.7 J/p/cu2 by R.R.1Hz.A,B) Line center.
23
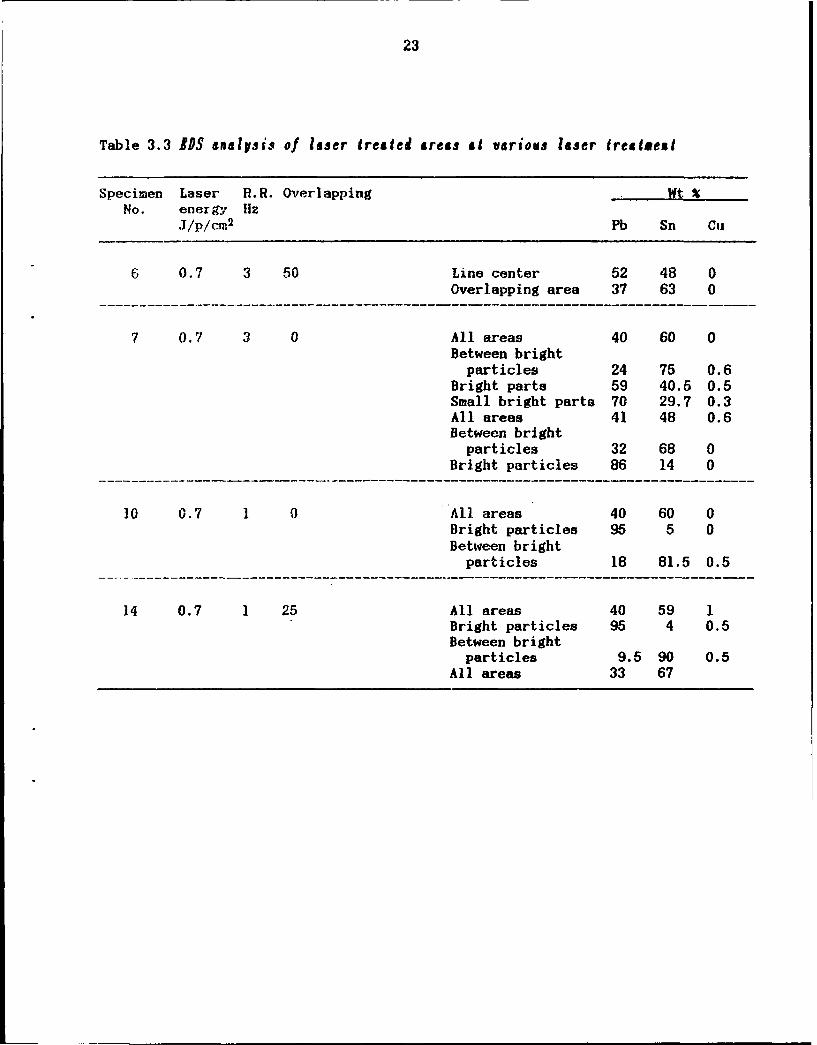
Table 3.3 IDS analysis of laser irested areas at various laser treatdeat
Specimen Laser R.R. Overlapping Wt %No. energy lIz
J/p/cW,2 Pb Sn Cu
6 0.7 3 50 Line center 52 48 0Overlapping area 37 63 0
7 0.7 3 0 All areas 40 60 0Between bright
particles 24 75 0.6Bright parts 59 40.5 0.5Small bright parts 70 29.7 0.3All areas 41 48 0.6Between bright
particles 32 68 0Bright particles 86 14 0
10 0.7 1. 0 All areas 40 60 0Bright particles 95 5 0Between bright
particles 18 81.5 0.5
14 0.7 1 25 All areas 40 59 1Bright particles 95 4 0.5Between bright
particles 9.5 90 0.5All areas 33 67
24
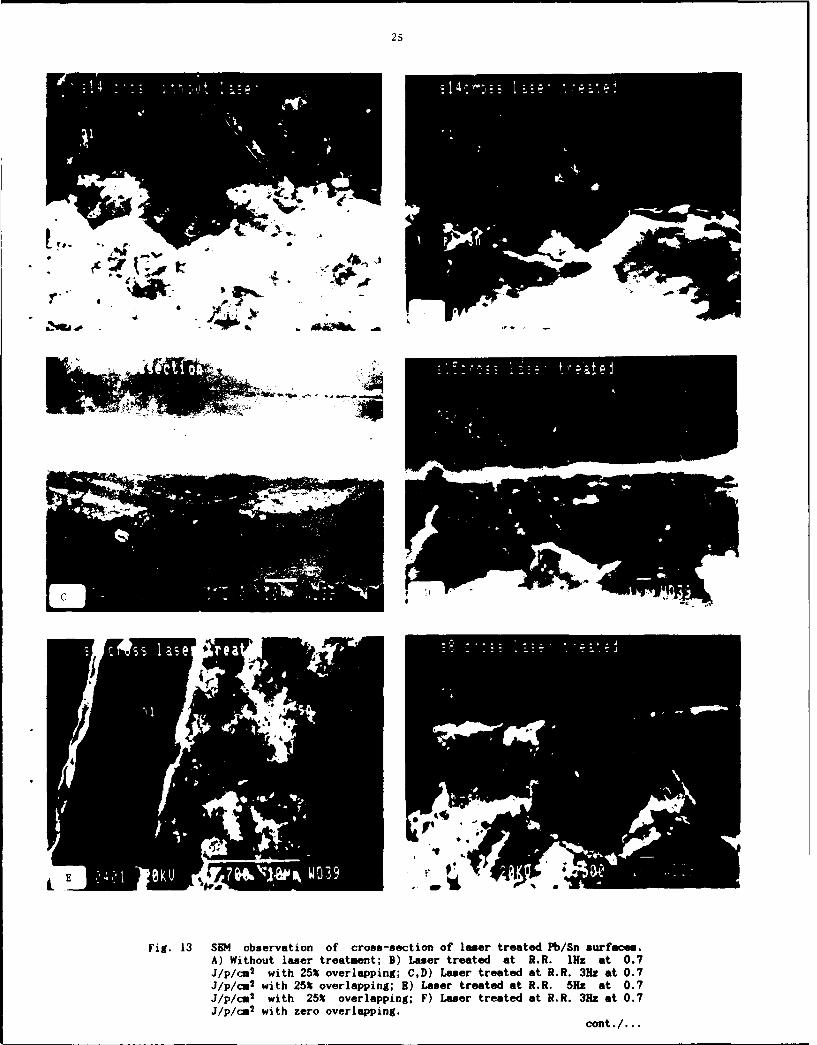
3.2.1 SR1 Observations of Crosa-sections sfjer Isser trestmaet
Treated specimens were cut perpendicular to the laser lines, and
cross-sections were taken for examination of the effect of treatment
parameters. No differences were found between treated and untreated surfaces,
or under different laser conditions (Fig. 13). This can be a result of the
smail penetration depth of the laser beam into the coating.
25
E 'F
Fig. 13 SM osrain o rs-etono-ae rae b ufc@
A) ithut asrtetet B)Lsrtetd a . lz t 07
J//A ih2%oelpig ,) ae rae tRR ra .J//2 ih25 vrapng )Lsrtrae tRR.5z a .
J//' ih 25 vrapng )Lsrtrae.tRR.3za .
J/p/CM .9 wihzr velpig
cont
26
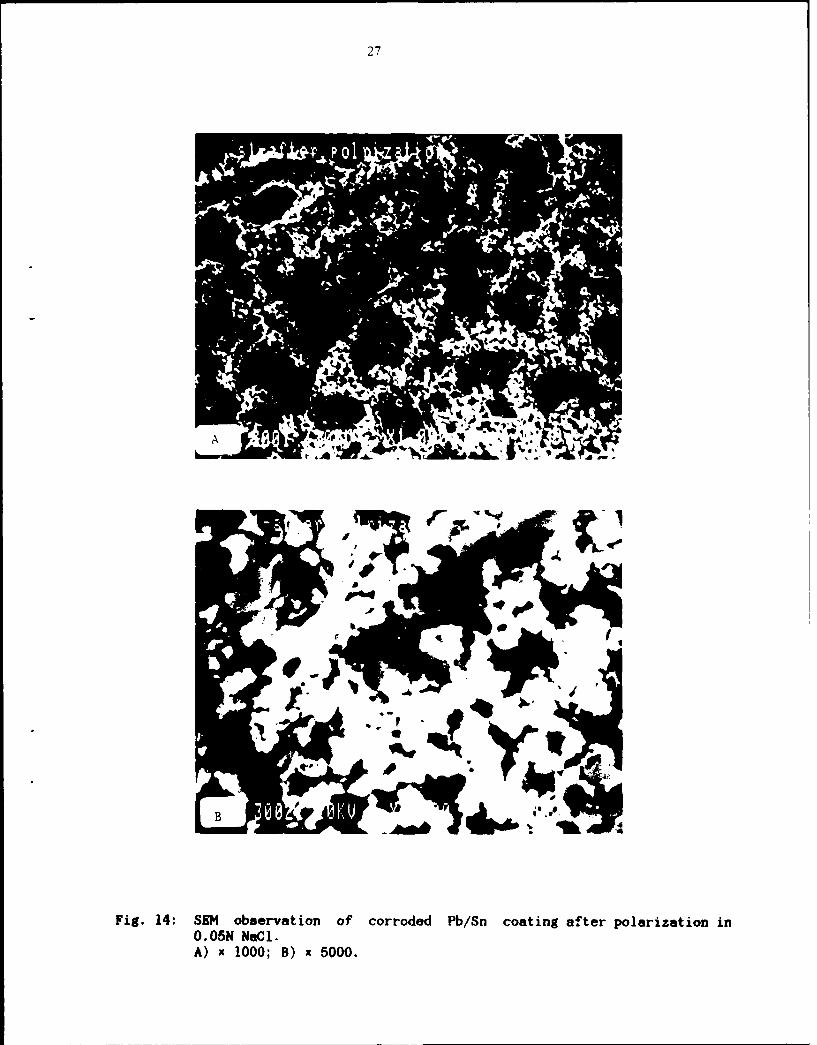
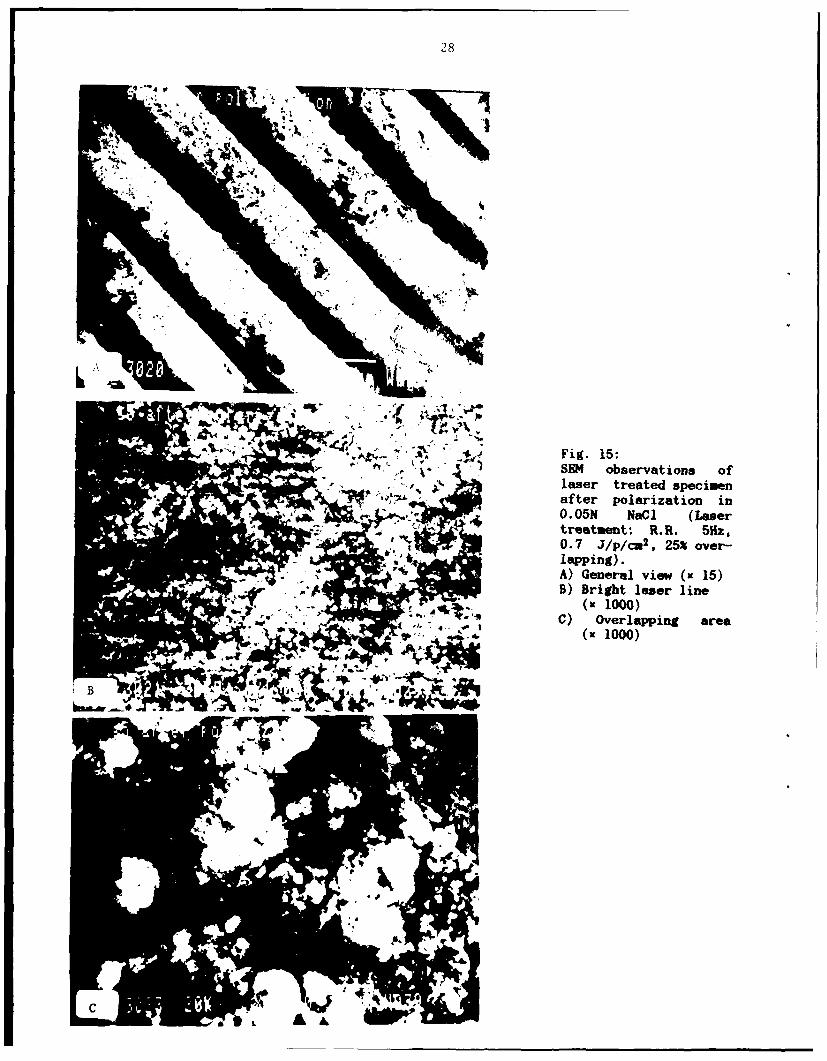
3.1.2 SHI observstion aftr polarizslio
Polarization was carried out in 0.05 NaCI solution in order to evaluate
the effect of laser treatment on corrosion resistance of the specimens. Fig.
14 shows the corroded as-deposited specimen, while Figs. 15 to 18 show the
corroded area after treatment with full cover and Figs. 19 to 21 the same with
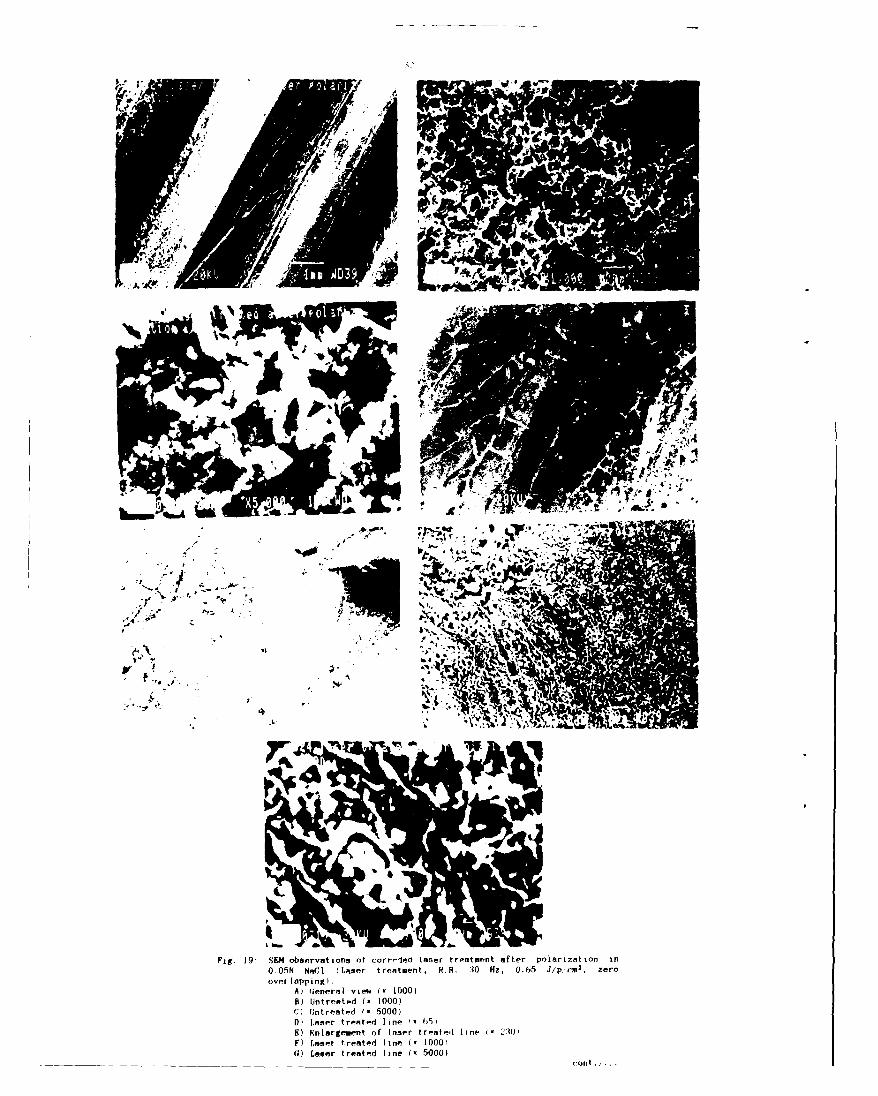
uncovered spaces between lines for R.R. > 10 Hz.
In both Figs. 14 and 15, loss of grains can be seen in the lead-depleted
surface; in the latter figure, where the polarization scan range was -lV to
-l.5V (vs. oCE), both the line centers and overlapping areas were corroded and
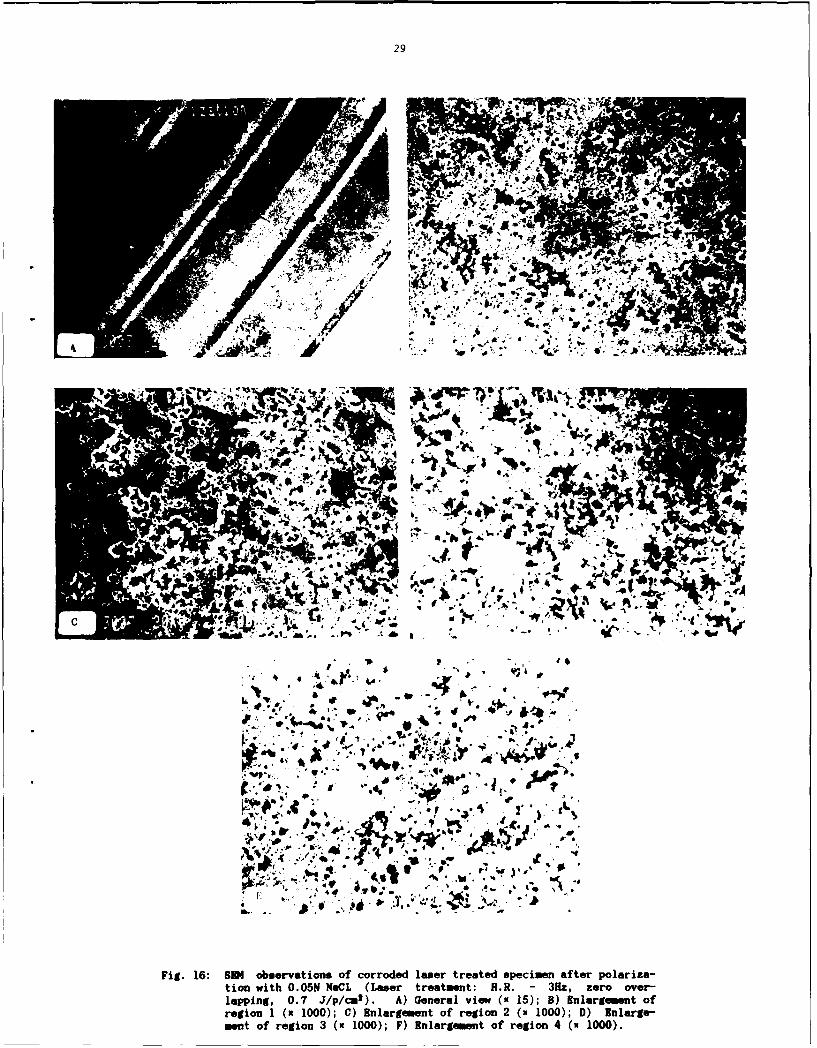
the copper underlayer is actually visible. By contrast, Fig. 16, where scan
range was -lV to O.OV (vs. S.C.E.), the corrosion process did not reach the
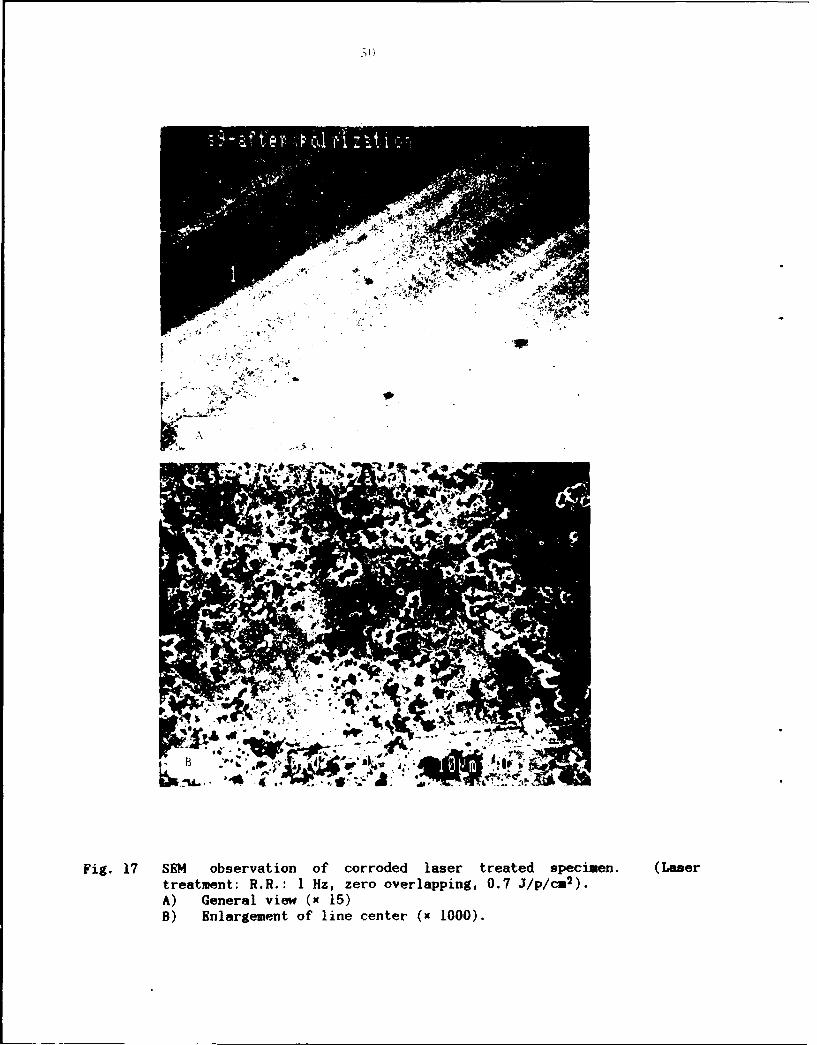
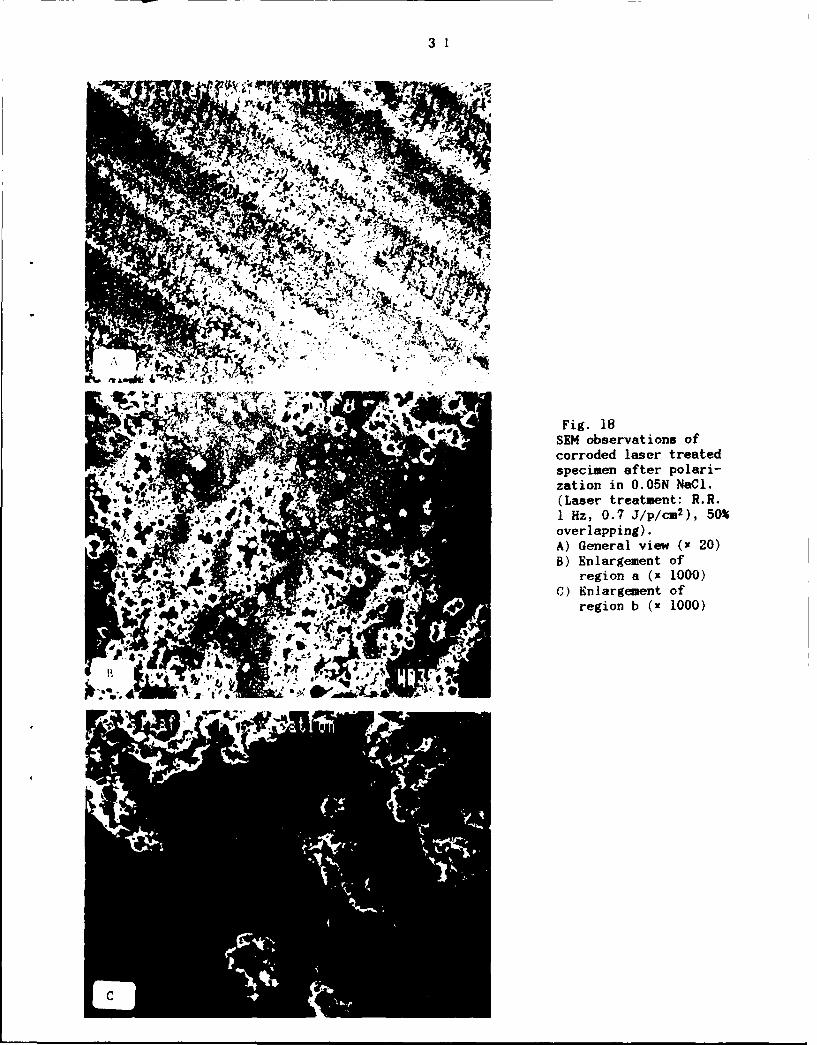
copper. The same effects were observed with the other treatment variants as
shown in Figs. 16, 17.
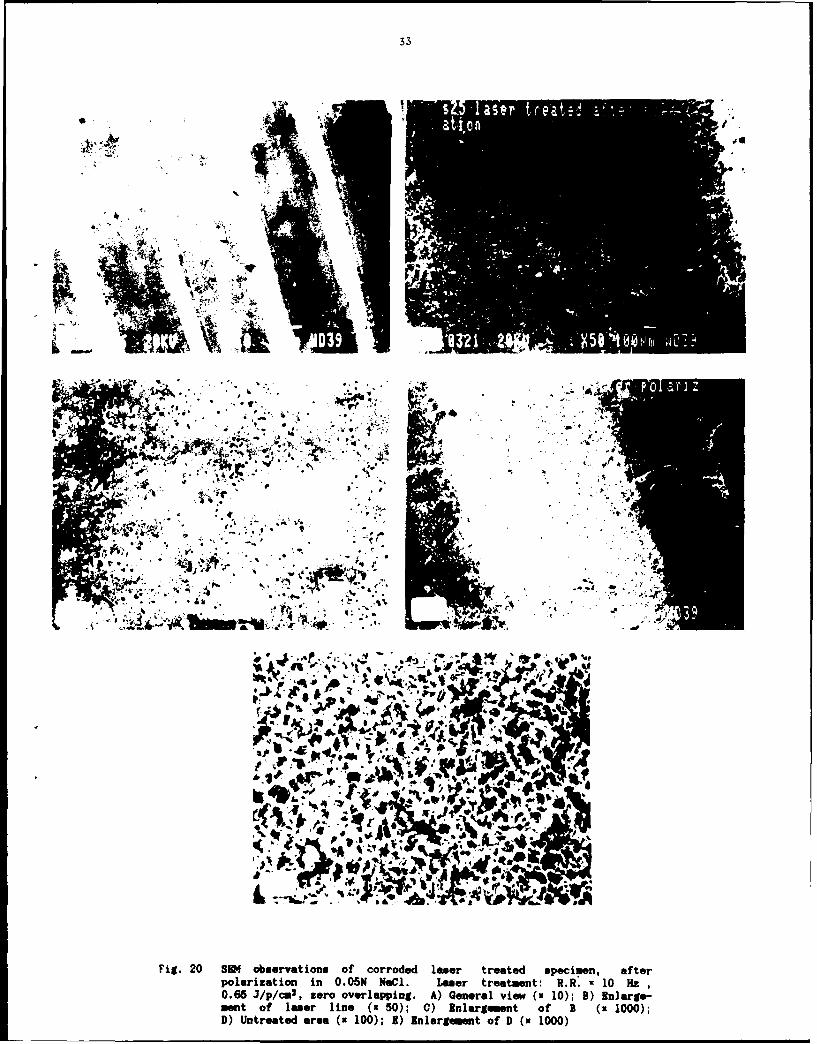
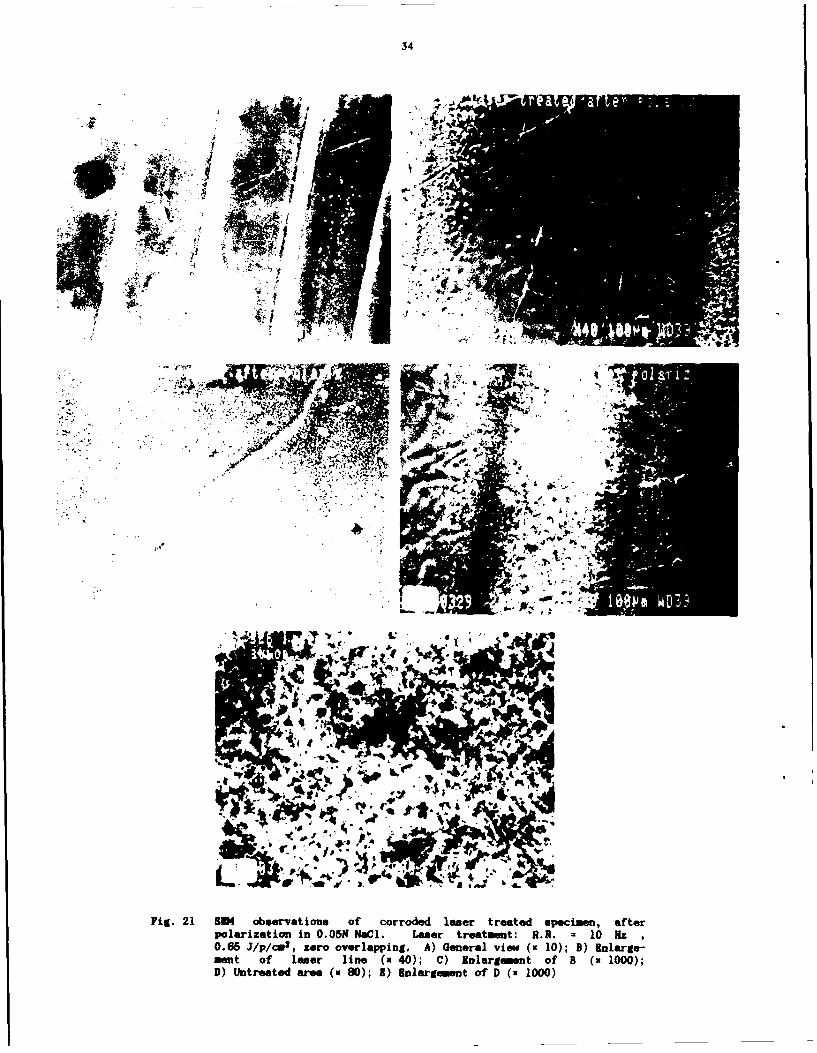
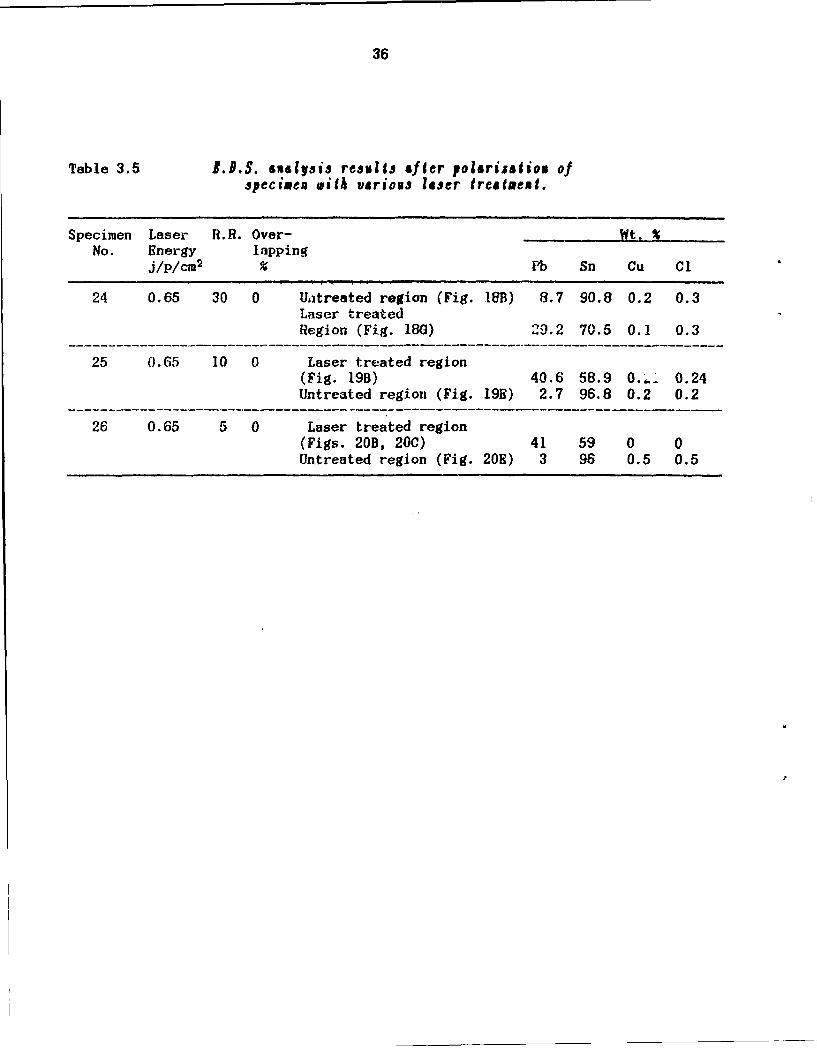
The third specimen exhibited distinctly different behavior. Here, only
the untreated areas between the laser lines were corroded while the laesr
treated area remained unattacked (Figs. 19 D,E,F; 20B,C; 21B,C). This is also
confirmed by H.D.S. results. The initial composition of 30-40% Pb and 70-60%
Sn was found also after poJarization in the laser-treated line, while at the
untreated area lead was preferentially dissolved, leaving about 3% lead and
more than 90% Sn (Table 3.5). This can be a result of the decreasing in the
size of the Pb-rich grains and oxidation of the laser treated surfaces.
From these results it can be concluded that the laser-treated areas were
more corrosion-resistant than the untreated ones.
27
1*0.0
Fig. 14: SEN observation of corroded Pb/Sn coating alfter polarization in0.05N NaCi.A) x 1000; B) x 5000.
28
~ -A. e Fig. 15:SEM observations oflaser treated specimenafter polarization in0.05N NaCI (Lasertreatmentt R.R. 5RI2,0.7 J/p/W2, 25% over-
A) General view (x' 15)B) Bright laser line
* ., i~;C) Overlapping area
('1000)
29
~%
'
Y - I' ft*_t
4P~4
1, 1
V eF-4-0
Fig 16 SE oberain ocorddlsrteedcime fe oaiation ~ ~ ~ ~~~d wih00NNC Lsrtetmn:RR ,zr vr
lapn, . //cl. A)Gnrl iw(x1) ) nageeto
regin 1(x 000)C)Enlremen ofrgo x10) )Elre
mi.16 entosevin of corrode 3 m10) )Elaereaete ofpecimen 4fe pvlari0a-
.... -.
Fig. 17 SEM observation of corroded laser treated specimen. (Lasertreatment: R.R.: 1 Hz, zero overlapping, 0.7 J/p/C 2 ).A) General view (x 15)B) Enlargement of line center (x 1000).
3 1
Fig. 18SEM observations ofcorroded laser treatedspecimen after polari-zation in 0.05N NaCi.(Laser treatment: R.R.1 Hz, 0.7 J/p/cm2), 50%overlapping).A) General view (x 20)B) Enlargement of
region a (x 1000)C) Enlargement of
region b (x 1000)
lit
4'4'It
7Olt
over[ aapn )
8 i retd( 00 )
N ae . t S, lie N 5
0OS RaCI a Iser tratment line 2:3Hz,0.6 /~mzrove lapig)B) Lnrae (I 1000)
0) Laser treate~d line (. 5000)cont., .
33
I J
* !KY
'el~M>
0 40
r--r'-..
49
lie 4
Fig. 20 SEN observations of corroded laser treated specimen, afterpolarization in 0.06M Nedl. Laser treatment: R.R. = 10 Hz,0.66 J/p/cm2, zero overlapping. A) General view (m 10); B) Bnlargs-ment of laser line (x 50); C) Enlargement of 3 (R 1000);D) Untreated area (x 100); 1) Enlargement of D (n 1000)
34
'S..
4~ r
-r .%A
fo~zrt
Fig. 21 SEN observations of corroded laser treated specimen, afterpolarization in 0.05M NuCi. Laser treatment: E.R. z 10 Hz,0.66 J/p/cs2, zero overlapping. A) General view (x 10); B) Enlarge-meet of laser line (x 40); C) Sniergae et of B (n 1000);D) Untreated area (m 90); 1) Hlargamnt of D (w 1000)
35
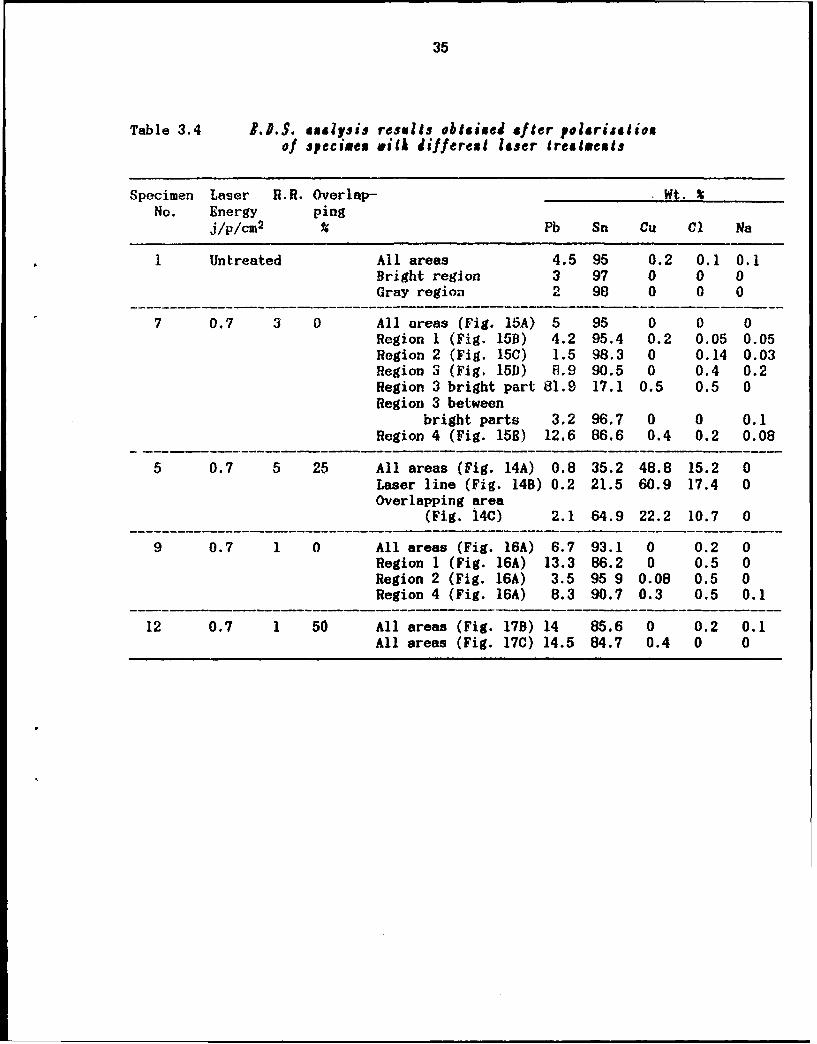
Table 3.4 1.15.all~sis results obtained aftecr polarizationof speci Aen *ita different laser treattents
Specimen Laser R.R. Overlap- Wt. %No. Energy ping
j/p/cm2 Pb Sn Cu Cl Na
1 Untreated All areas 4.5 95 0.2 0.1 0.1Bright region 3 97 0 0 0Gray region 2 98 0 0 0
7 0.7 3 0 All areas (Fig. 15A) 5 95 0 0 0Region 1 (Fig. 15B) 4.2 95.4 0.2 0.05 0.05Region 2 (Fig. 15C) 1.5 98.3 0 0.14 0.03Region 3 (Fig, 15D) 8.9 90.5 0 0.4 0.2Region 3 bright part 81.9 17.1 0.5 0.5 0Region 3 between
bright parts 3.2 96.7 0 0 0.1Region 4 (Fig. 15E) 12.6 86.6 0.4 0.2 0.08
5 0.7 5 25 All areas (Fig. 14A) 0.8 35.2 48.8 15.2 0Laser line (Fig. 14B) 0.2 21.5 60.9 17.4 0Overlapping area
(Fig. 14C) 2.1 64.9 22.2 10.7 0
9 0.7 1 0 All areas (Fig. 16A) 6.7 93.1 0 0.2 0Region I (Fig. 16A) 13.3 86.2 0 0.5 0Region 2 (Fig. 16A) 3.5 95 9 0.08 0.5 0Region 4 (Fig. 16A) 8.3 90.7 0.3 0.5 0.1
12 0.7 1 50 All areas (Fig. 17B) 14 85.6 0 0.2 0.1All areas (Fig. 17C) 14.5 84.7 0.4 0 0
36
Table 3.5 N.P.S. analysis results aler polarijasion ofspecimen with various laser treatment.
Specimen Laser R.R. Over- Wt.No. Energy lapping
j/p/c % Pb Sn Cu Cl
24 0.65 30 0 Untreated region (Fig. lOB) 8.7 90.8 0.2 0.3Laser treatedRegion (Fig. 18G) 29.2 70.5 0.1 0.3
25 0.65 10 0 Laser treated region(Fig. 19B) 40.6 58.9 0.. 0.24Untreated region (Fig. 19B) 2.7 96.8 0.2 0.2
26 0.65 5 0 Laser treated region(Figs. 20B, 20C) 41 59 0 0Untreated region (Fig. 20H) 3 96 0.5 0.5
37
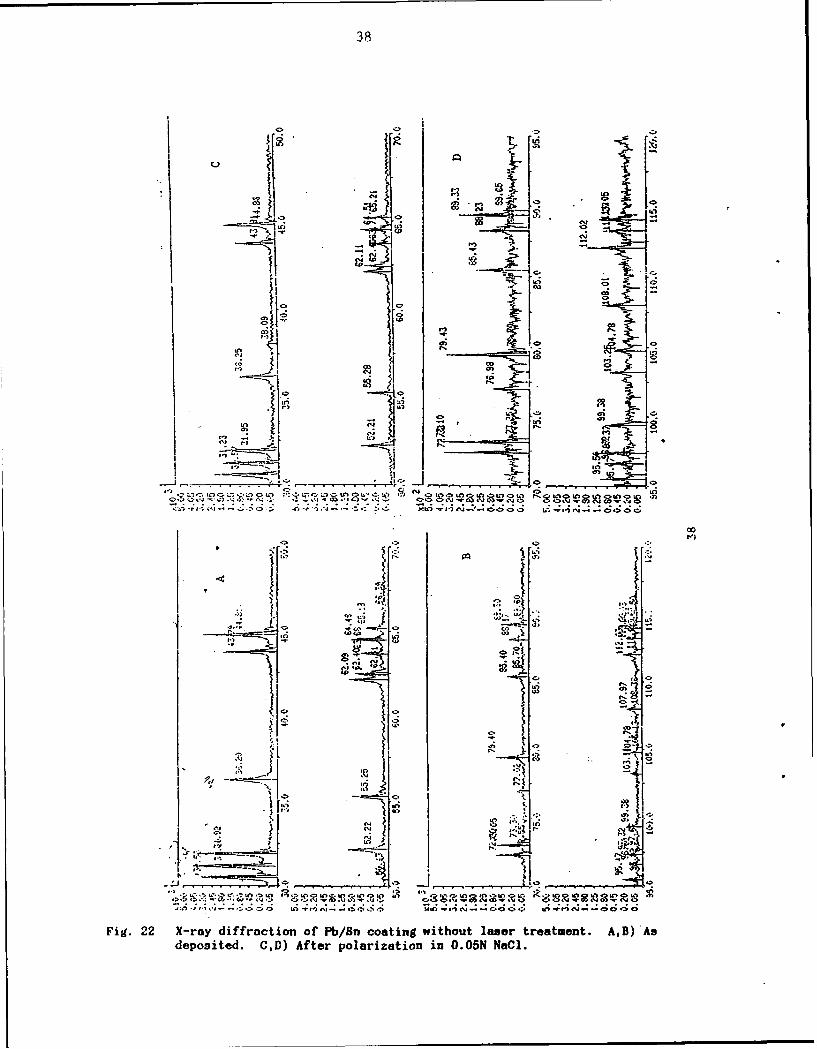
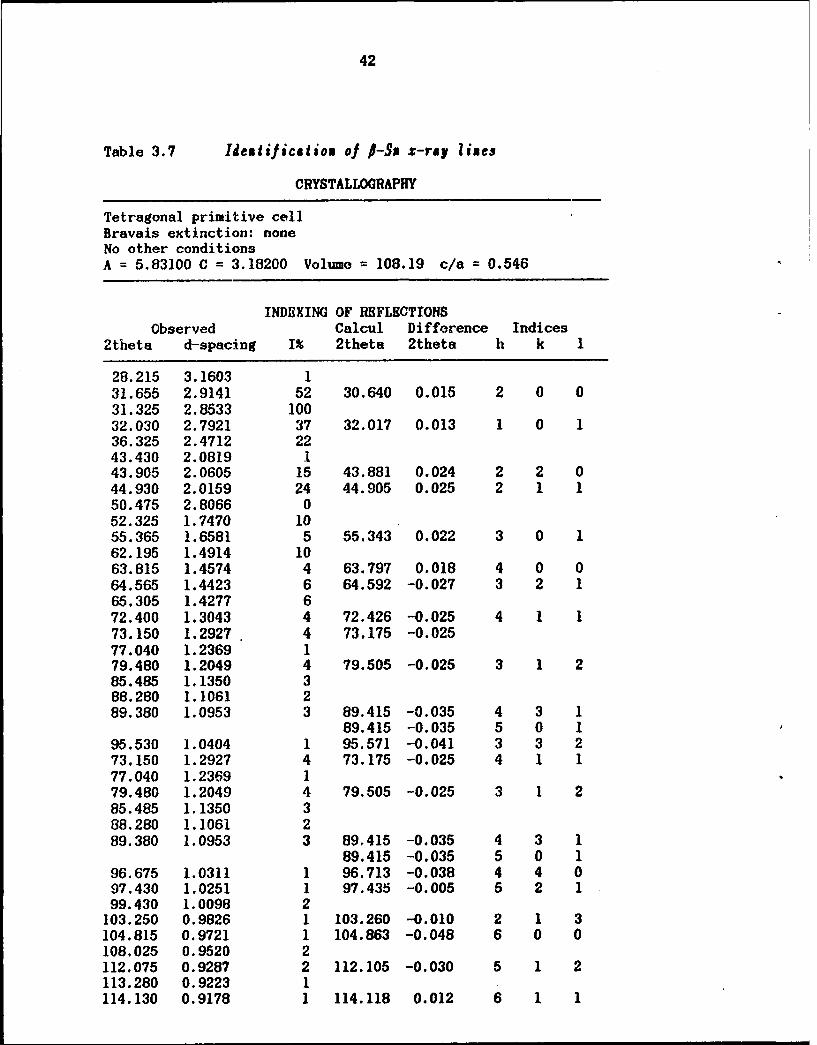
3.3 I-rsy Piffreclion
X-ray diffraction of the as-deposited Pb/Sn coating before and after
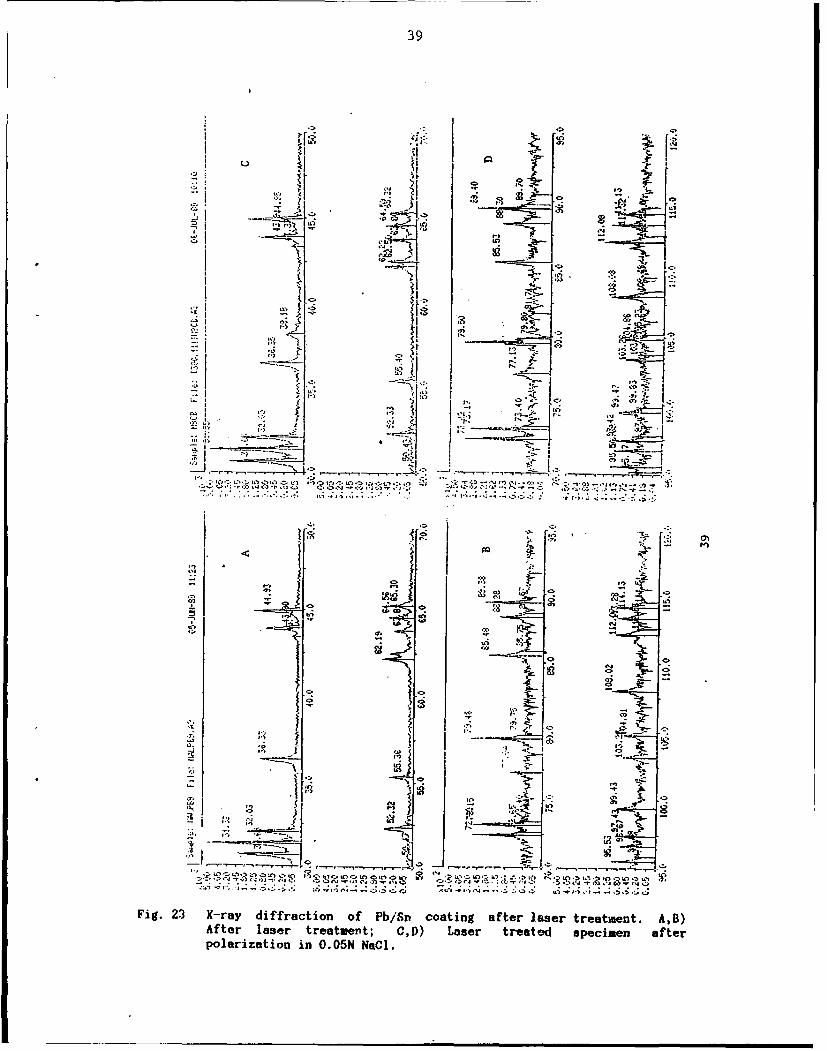
polarization is shown in Fig. 22. Fig. 23 is the x-ray diffraction pattern of
the laser treated specimen before and after polarization. Tables 3.6 and 3.7
show the calculated x-ray distances and their fit according to the ASITM
standard.
The main difference between the as-deposited and the laser-treated
specimens is the change in the relationship between the 1/10 ratios of the two
metals at 20 from 30 to 32, as can be seen in Fig. 22A and 23A. In the
as-deposited specimen the diffraction lines for Sn (200), Pb (1ll) and Sn
(101) had the same I/IO, but after laser treatment the ratio of Sn(200) and
Sn(l0l) decreased. This is attributable to the laser treatment, which may have
caused a partial shift in the tin orientation in the course of the melting
process.
X-ray analysis showed that the tin used was $-tin, a tetragonal primitive
cell with A = 5.831 and C = 3.182 according to ASTM 4-0673. Pb lines were
fitted according to ASTH 4-0686. Lead is a cubic system with A = 4.9506; our
results fitted a calculation based on a = 4.947.
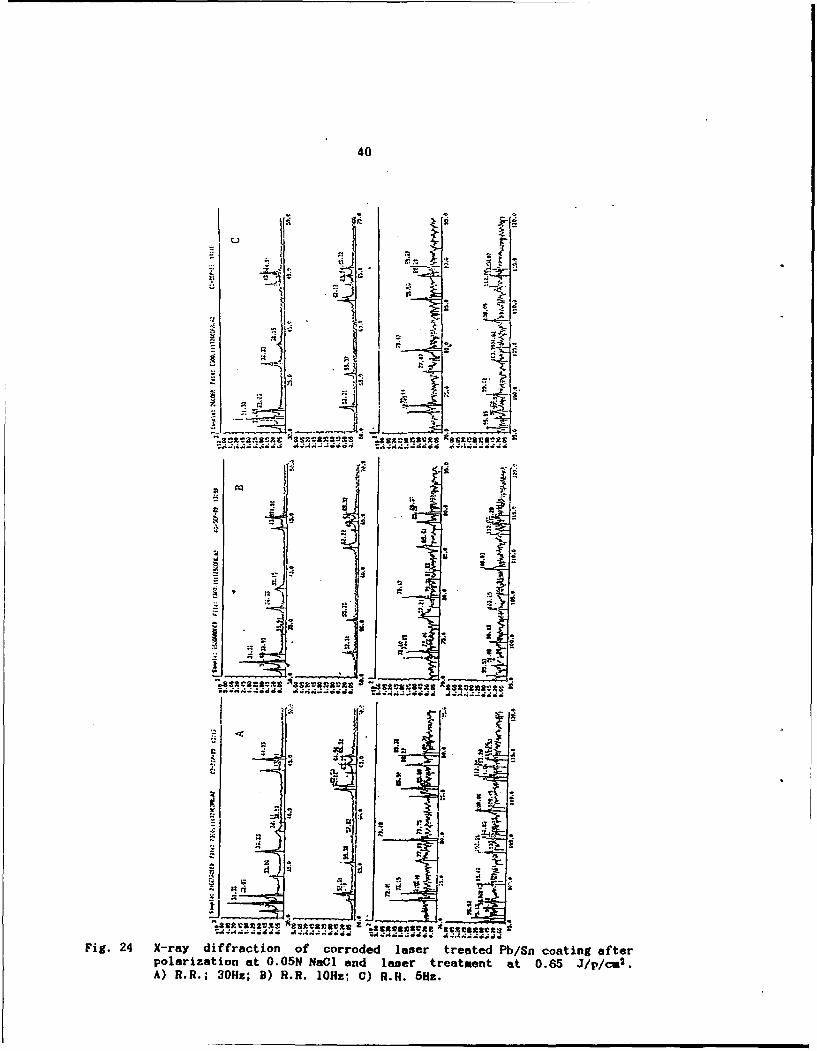
X-ray pattern of the Pb/Sn coating after polarization are shown in Figs.
22C,D, 23C,D, 24. No difference was observed against the pattern of the as
deposited specimen (Figs. 22A,D; 23A,B.
38
9~
C..
.- ,. . ..
~00
CA-
-, [,, Ifl .
~ . ,~l-L -- .-- .~ a,- -,-n, .. . . . .
all,
""~.: C ,.' ..,r.,. ;w , .,''o g " .., ,q ., .
* r
depsied Ca) Afe oaiaini .5 a1
t
-'-I
Le) _#-, ^rj U~ 1 j CO 1P00
Fig. 22 X-ray diffraction of Pb/Sn coating without laser treatment. AB)'Asdeposited. C,D) After polarization in 0.05N NaCi.
39
... 99. . I " -.
.. I- I }9
:444
'9
C._) S I
99....o .--I I . " --' : 9 ;;- , -. 99.
p'l i in 0 N a-l
,. I ... .. . o.- . .. .
- ;.. 999 o' - ..
C. -
.,- -,, . , ,
99: -. ..z. ,- ._g
• ..-.- t-.. ,:.
"-
., .;, -"-"-
.999 -) '- --,-2 ' .,- ,-,----- _ x_
9.. X-a dfrcto f bS caig fe ].sr ratet. AAfer laer teamet; -,. Lae traed secmn fe
Fig. 2 olr a tiffraci n O f Pb S oa i g a teCa er t e t en.A B
40
C.) .4:
zk'
IS7
±_-~-I xi
Fig. ~ ~ ., 24 X-a diffractionS of corode laser trae ncain fepoaiaina .5 alad lsr tetet a .5 Jpc2
A) RR.; G~z 0) .R.1O~z C)R.R.6Hz

41
Table 3.6 Uenificaeion of lead z-ray lines
CRYSTALLOGRAPHY
Cubic face centered cellSpace group code: FM3MSpace group nr. : 225Bravais extinction: hkl for h+k=2n and k+1=2nNo other extinctionsA = 4.94675 Volume = 121.05
INDEXING OF REFIECTIONSObserved Calcul Difference Indices
2theta d-spacing I 2theta 2theta h k 1
28.215 3.1603 131.655 2.9141 5231.325 2.8533 100 31.294 0.031 1 1 132.030 2.7921 3736.325 2.4712 22 36.292 0.033 2 0 043.430 2.0819 143.905 2.0605 1544.930 2.0159 2450.475 2.8066 052.325 1.7470 ]055.365 1.6581 562.195 1.4914 10 62.190 0.005 3 1 163.815 1.4574 464.565 1.4423 665.305 1.4277 6 65.289 0.016 2 2 272.400 1.3043 473.150 1.2927 477.040 1.2369 1 77.053 -0.013 4 0 079.480 1.2049 485.485 1.1350 3 85.494 -0.009 3 3 188.280 1.1061 2 68.277 0.003 4 2 089.380 1.0953 373.150 1.2927 477.040 1.2369 1 77.053 -0.013 4 0 079.480 1.2049 485.485 1.1350 3 85.494 -0.009 3 3 188.280 1.1061 2 88.277 0.003 4 2 089.380 1.0953 395.530 1.0404 196.675 1.0311 197.430 1.0251 199.430 1.0098 2 99.434 -0.004 4 2 2103.250 0.9826 1108.025 0.9520 2 108.023 0.002 3 3 3
108.023 0.002 5 1 1112.075 0.9287 2113.280 0.9223 1114.130 0.9178 1
42
Table 3.7 Ilexiificaiion of P-Sx x-ray lies
CRYSTALLOGRAPHY
Tetragonal primitive cellBravais extinction: noneNo other conditionsA = 5.83100 C = 3.18200 Volume = 108.19 c/a = 0.546
INDEXING OF REFLECTIONSObserved Calcul Difference Indices
2theta d-spacing I% 2theta 2theta h k 1
28.215 3.1603 131.655 2.9141 52 30.640 0.015 2 0 031.325 2.8533 10032.030 2.7921 37 32.017 0.013 1 0 136.325 2.4712 2243.430 2.0819 143.905 2.0605 15 43.881 0.024 2 2 044.930 2.0159 24 44.905 0.025 2 1 150.475 2.8066 052.325 1.7470 1055.365 1.6581 5 55.343 0.022 3 0 162.195 1.4914 1063.815 1.4574 4 63.797 0.018 4 0 064.565 1.4423 6 64.592 -0.027 3 2 165.305 1.4277 672.400 1.3043 4 72.426 -0.025 4 1 173.150 1.2927 4 73.175 -0.02577.040 1.2369 179.480 1.2049 4 79.505 -0.025 3 1 285.485 1.1350 388.280 1.1061 289.380 1.0953 3 89.415 -0.035 4 3 1
89.415 -0.035 5 0 195.530 1.0404 1 95.571 -0.041 3 3 273.150 1.2927 4 73.175 -0.025 4 1 177.040 1.2369 179.480 1.2049 4 79.505 -0.025 3 1 285.485 1.1350 388.280 1.1061 289.380 1.0953 3 89.415 -0.035 4 3 1
89.415 -0.035 5 0 196.675 1.0311 1 96.713 -0.038 4 4 097.430 1.0251 1 97.435 -0.005 5 2 199.430 1.0098 2103.250 0.9826 1 103.260 -0.010 2 1 3104.815 0.9721 1 104.863 -0.048 6 0 0108.025 0.9520 2112.075 0.9287 2 112.105 -0.030 5 1 2113.280 0.9223 1114.130 0.9178 1 114.118 0.012 6 1 1
43
4. SUJIIAIY
Irradiation of 40/60 Pb/Sn coatings with excimer laser at high laser
energies of 0.5 to 0.7 J/p/cm2 caused their melting. The main findings were:
- The size of the Pb-rich particles was reduced as repetition rate
increased, and also as the energy level increased.
- The corrosion potential changed in the noble direction as repetition rate
increased at a given laser energy.
- Lead was preferentially dissolved.
- Specimens prepared with laser lines at repetition rates of 5, 10 and 30
did not corrode, unlike the as-deposited adjusted area, as was shown by
SEM observation.
- No difference was observed between polarization curves type of
as-deposited and laser-treated specimens; both underwent by general mode
corrosion.
- X-ray diffraction shows that i-Sn and Pb were the main components of the
as deposited, laser treated and corroded coatings.
The difference between the as-deposited and laser-treated specimens was
reflected both in morphology and in corrosion resistance. Smaller Pb-rich
particles were found after laser treatment, and the as-deposited area was
corroded while the laser-treated adjusted lines were not. These phenomena can
be explained by the nobler potential of the laser-treated area which was a
result of increased tin area as the Pb-rich particles decreased (The potential
of tin is nobler by O.lV than that of lead), and also a result of the
oxidation of the laser treated area.
44
The area with more negative potential, (the as-deposited) served as an
anodic site and dissolved, while the nobler area (the laser treated) remained
intact. Dissolution of the latter would have set in, if the former were
completely removed.
These results, obtained in the course of this year, indicated that
irradiation at higher laser energy (0.5 to 0.7 J/p/cm 2) and R.R. above 5Hz
makes for improved corrosion resistance of the Pb/Sn coating.
45
lf ere 3Ce
1) "Laser and Electrochemical studies of Metallizations in Electronic
Devices". First Annual Research Report. J. Zahavi, M. Rotel, B. Dobbs,
Technion City, Haifa, January 1987.
2) "Laser and Electrochemical studies of Metallizations in Electronic
Devices". Second Annual Research Report. December 1987.
US GOVERNMENT PRTNTING OFFICE: 1990-548-076-44034/11