Embed Size (px)
Citation preview

29 May 2017, Singapore
ASEAN+3 Regional Economic Outlook (AREO) 2017:
Risks and Opportunities

2
Introduction: About AMRO
Mandate
• Conduct macroeconomic and financial surveillance of global and regional economies
• Contributes to early detection of risks, policy recommendations for remedial actions
and effective decision-making of the CMIM
• Conducting macroeconomic
surveillance (regional, member
countries, functional/sectoral) and
conducting thematic studies/research
• Providing support to the members to
ensure that the CMIM is operationally
ready
CMIM Support Surveillance
• Providing TA to the members to enhance their human and institutional capacities for
macroeconomic surveillance and implementation of CMIM
Technical Assistance (TA)
Core Functions

ASEAN+3 Regional Economic Outlook (AREO) 2017
3
I ASEAN+3 Macroeconomic
Prospects and Challenges
II Thematic Chapter: ASEAN+3
Region 20 Years after the Asian
Financial Crisis
Contents

3
I ASEAN+3 Macroeconomic Prospects and Challenges
II Thematic Chapter: ASEAN+3 Region 20 Years after the Asian
Financial Crisis
AREO 2017: Contents
Chapters

3
I ASEAN+3 Macroeconomic Prospects and Challenges
II Thematic Chapter: ASEAN+3 Region 20 Years after the Asian
Financial Crisis
AREO 2017: Contents
Chapters

4
I ASEAN+3 Macroeconomic Prospects and Challenges
II Thematic Chapter: ASEAN+3 Region 20 Years after the Asian
Financial Crisis
AREO 2017: Contents
Chapters

Regional Growth Outlook
Amid the external uncertainties, regional growth will continue to be driven by
domestic demand. Growth is anticipated to moderate slightly, but sustained
around 5 percent in 2017-18
7 Source: National authorities, AMRO
p/ Projections
China
Japan (FY)
Korea
ASEAN-4 & VN
BCLM
HK & SG
ASEAN+3
‘16 ‘17 p/ ‘18 p/
6.7 6.5 6.3
1.4 1.3 1.1
2.8 2.5 2.6
5.0 5.1 5.2
5.6 6.5 6.8
2.0 2.1 2.3
5.3 5.2 5.1
AMRO’s Baseline Growth and Inflation Projections

8
Regional Growth Outlook
The recent recovery in global trade, if sustained, could provide some upsides
to regional exports and growth
Note: ASEAN excludes BCLM economies
Source: National Authorities
Regional Exports by Major Destinations

China Outlook
In China, the economy posted a relatively high growth in Q1 2017. Private
investment is also firming, reflecting the pick-up in domestic economic
activities, alongside an improvement in corporate profits
9 Source: NBS, AMRO
China: Private Sector Profitability China: Private Sector Investment

China Outlook
Concerns about China’s capital outflows have eased recently, partly reflecting
the strengthened capital flows management which helped in containing RMB
exchange rate volatility
10 Source: PBC, SAFE, AMRO
China: Exchange Rate Developments China: Capital Flows Developments

11
Japan Outlook
In Japan, growth is expected to remain strong in 2017, higher than the
potential growth rate, while achieving the price stability target of 2.0 percent
remains challenging
Japan: Inflation and Price Stability Target Japan: Real GDP Growth
Source: Cabinet Office, JMOF, BOJ, AMRO
p/ Projections

Note: Expected Default Frequency (EDF) is a measure of the probability that a firm will default over a specified period of time (typically one year). “Default” is defined
as failure to make scheduled principal or interest payments. According to the Moody’s EDF model, a firm defaults when the market value of its assets (the value
of the ongoing business) falls below its liabilities payable (the default point). The firm level EDFs are aggregated to form EDFs at the sectoral and country level
Source: AMRO
12
Spillover Analysis (Shocks from 1% sustained decrease (or increase)
in U.S.’ & China’s real & financial variables ), Preliminary
1% Sustained Decline in Real GDP Growth Mean Impact on Regional EMs
(Cumulative, 36 months)
• 1% sustained decline in U.S.’ real
GDP growth
Impact on growth
-0.11 ppts
• 1% sustained decline in China’s real GDP
growth
Impact on growth
-0.75 ppts
Impact on nominal export growth (in local currency)
-1.35 ppts
1% Sustained Increase in Expected
Default Frequency (EDF)
Mean Impact on Regional EMs
(Cumulative, 12 months)
Banking
Sector
Shocks
• U.S.’ banking sector soundness
• China’s banking sector soundness
+0.11 ppts (Impact on Regional Banks’ EDF)
+0.25 ppts (Impact on Regional Banks’ EDF)
Corporate
Sector
Shocks
• China’s corporate sector
soundness
+0.11 ppts (Impact on Regional Banks’ EDF)
+0.12 ppts (Impact on Regional Corporates‘ EDF)
1. Real Sector Shocks
2. Financial Sector Shocks
8

13
Risks Spotlight: Capital Flows Volatility and Reversal Risks
Financial markets have been largely stable, with the resumption of capital
inflows, although risks remain tilted to the downside, mainly from global policy
uncertainties
Notes: All data are to up to end-April 2017, except for bond (up to end-Apr 2017). The Bloomberg Asia Currency Index refers to ADXY.
Source: National Authorities, Bloomberg
Non-Resident Net Capital Flows (ASEAN-4 and Korea)
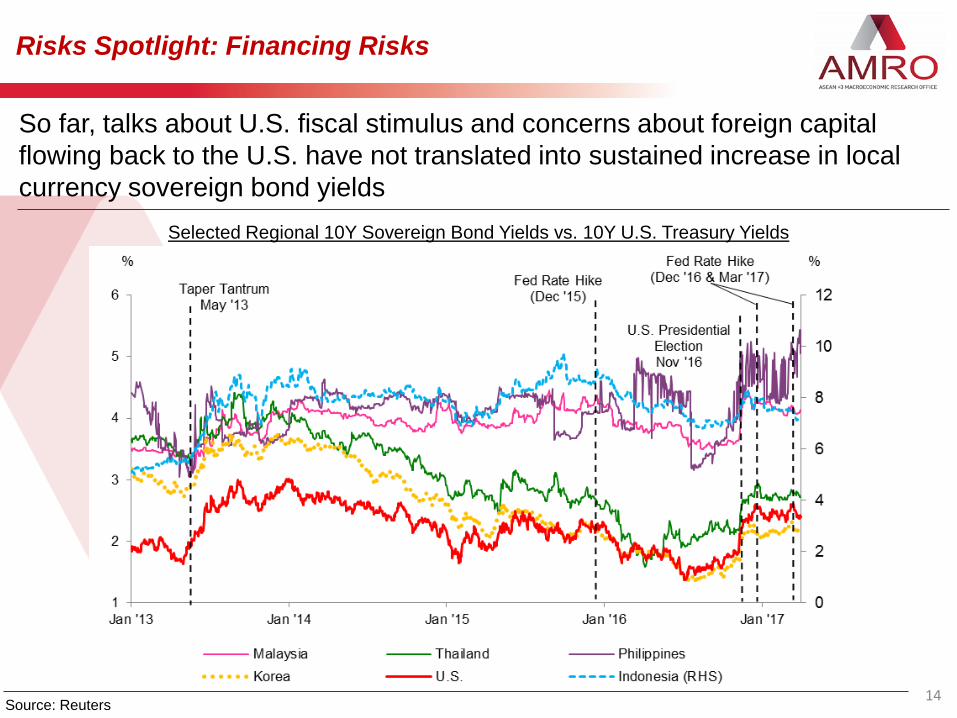
Risks Spotlight: Financing Risks
So far, talks about U.S. fiscal stimulus and concerns about foreign capital
flowing back to the U.S. have not translated into sustained increase in local
currency sovereign bond yields
Selected Regional 10Y Sovereign Bond Yields vs. 10Y U.S. Treasury Yields
14 Source: Reuters

15
Risks Spotlight: Financing Risks
Potential escalation of global uncertainties could amplify the financial stability
risks of regional economies (sovereigns and non-financial corporates (NFCs)
with large external financing needs, given the rising cost of borrowing ahead
Source: National Authorities, World Bank, IIF, AMRO
Baseline Current Account Projections Maturity Profile of Regional NFC Debt
Note: The data includes non-financial corporations and financial corporations.
Regional Asia EM in the sample includes China, Hong Kong, China;
Indonesia, Malaysia, Singapore, Korea, and Thailand.
p/ Projection
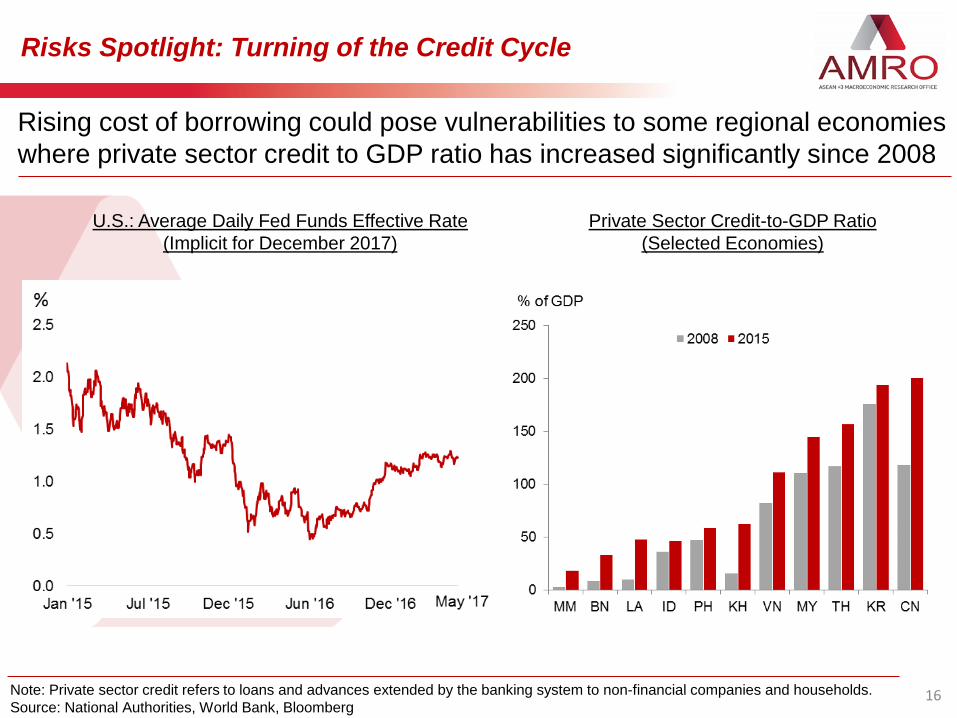
16
Risks Spotlight: Turning of the Credit Cycle
Rising cost of borrowing could pose vulnerabilities to some regional economies
where private sector credit to GDP ratio has increased significantly since 2008
Note: Private sector credit refers to loans and advances extended by the banking system to non-financial companies and households.
Source: National Authorities, World Bank, Bloomberg
U.S.: Average Daily Fed Funds Effective Rate
(Implicit for December 2017)
Private Sector Credit-to-GDP Ratio
(Selected Economies)
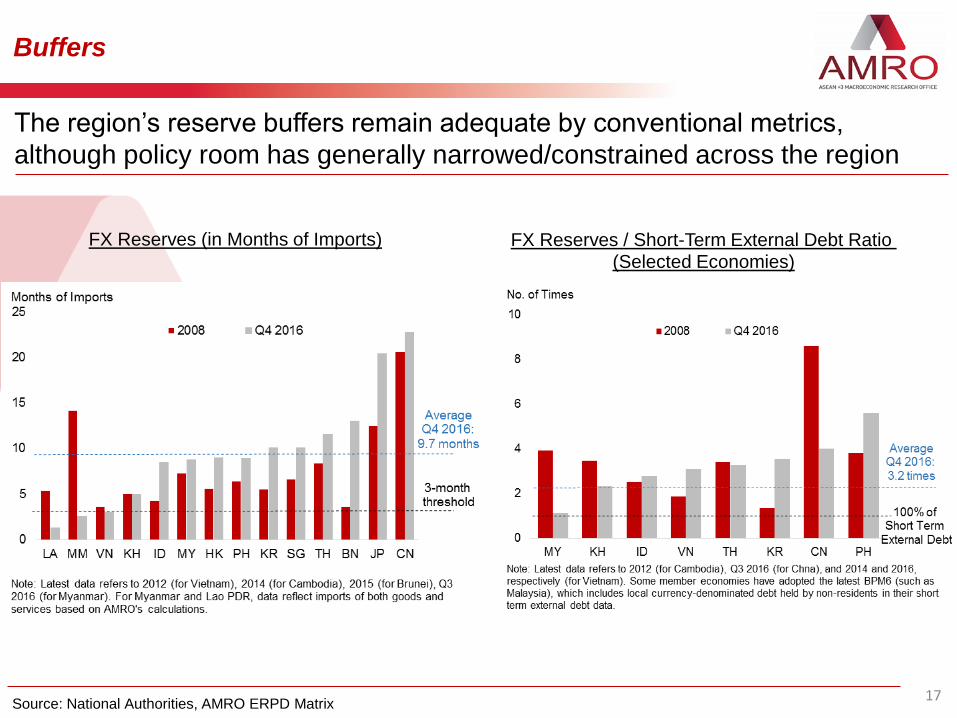
Buffers
17
FX Reserves (in Months of Imports) FX Reserves / Short-Term External Debt Ratio (Selected Economies)
Source: National Authorities, AMRO ERPD Matrix
The region’s reserve buffers remain adequate by conventional metrics,
although policy room has generally narrowed/constrained across the region
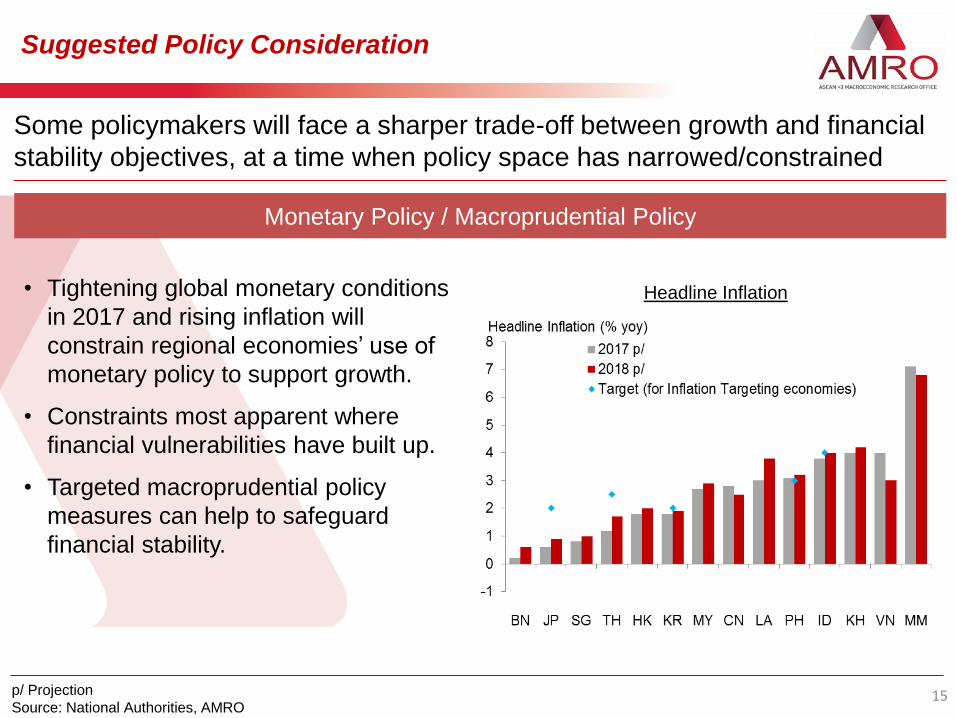
Suggested Policy Consideration
15
• Tightening global monetary conditions
in 2017 and rising inflation will
constrain regional economies’ use of
monetary policy to support growth.
• Constraints most apparent where
financial vulnerabilities have built up.
• Targeted macroprudential policy
measures can help to safeguard
financial stability.
Monetary Policy / Macroprudential Policy
Some policymakers will face a sharper trade-off between growth and financial
stability objectives, at a time when policy space has narrowed/constrained
p/ Projection
Source: National Authorities, AMRO
Headline Inflation

Policy Issues
19
Government Debt-to-GDP Ratio (Selected Economies) Central Government Fiscal Revenue Performance
Source: National Authorities, AMRO
• Fiscal conditions are expected to remain generally tight due to revenue shortfalls in
some economies, with debt-to-GDP ratio edging higher. In economies with weaker
fiscal position, reprioritizing and rebalancing existing expenditure programs should
be the first steps pursued.
Fiscal Policy

20 Source: COMTRADE, OECD, AMRO
On structural developments, the region has become an important source of final
demand, benefiting from the growing regional integration, and rising middle
class in China, which can cushion the impact of potential protectionist threats
Structural Developments – Leveraging Regional Integration
Share of Exports Destined for Final Demand in the Region
(2015 Estimates)
China’s Imports of Consumption Goods
from ASEAN
21 e/ Estimates
Source: ASEANStats, AMRO
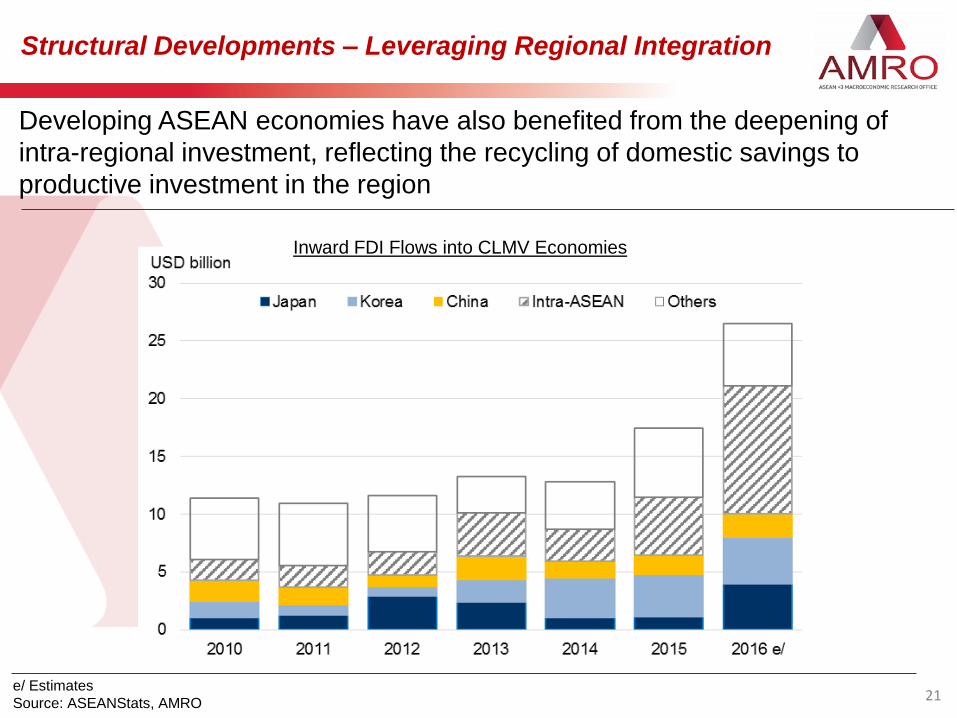
Developing ASEAN economies have also benefited from the deepening of
intra-regional investment, reflecting the recycling of domestic savings to
productive investment in the region
Inward FDI Flows into CLMV Economies
Structural Developments – Leveraging Regional Integration

16
I ASEAN+3 Macroeconomic Prospects and Challenges
II Thematic Chapter: ASEAN+3 Region 20 Years after the Asian
Financial Crisis
Chapters
AREO 2017: Contents

Theme: 20 Years after the Asian Financial Crisis (AFC)
2017 marks twenty years after the Asian Financial Crisis (AFC), a landmark
event in the ASEAN+3 region.
Source: AMRO 17
20 Years post-AFC
Shaped the subsequent
foundations and trajectory
of economic growth and
regional integration
Shaped policymakers’ perspectives on
crisis management and resolution
• Highlighted the urgent need for regional financial
cooperation
CMI (2000-09), CMIM (2010 onwards)
Establishment of AMRO as independent
macroeconomic surveillance unit supporting the
CMIM (2011)

Theme: 20 Years after the Asian Financial Crisis (AFC)
Source: National Authorities, AMRO 18
First Decade Post-AFC: Rebuilding Foundations 1
• Period of economic consolidation
after a sharp negative shock
• Painful policy adjustments in
exchange rate regimes, corporate
and financial sector reforms,
fiscal consolidation, and reforms
in prudential regulation
• Policy adjustments enabled the
affected economies to rebuild the
foundations for economic growth,
with exports leading the recovery
Real GDP: ASEAN-4 and Korea

Theme: 20 Years after the Asian Financial Crisis (AFC)
Source: ASEANstats 20
2007 – 2016: Rebalancing and Leveraging Regional Integration 2
• Openness to trade, FDI and
capital flows post-AFC enabled
the region (esp. CLMV
economies) to reap the benefits
from growing regional
integration and the emergence
of China
• Increased intra-regional financial
flows have eased the ASEAN+3
region’s rebalancing from
export-led to domestic-led
demand.
Host Source 2013 2014 2015
Cambodia
China 22.5 32.1 31.6
Japan 3.0 4.9 3.1
Korea 14.0 6.2 4.2
ASEAN-4 & SG 19.1 11.2 14.9
Lao PDR
China 35.1 67.3 61.6
Japan 0.4 0.2 7.0
Korea 2.5 1.4 4.2
ASEAN-4 & SG 4.7 11.8 7.6
Myanmar
China 30.2 7.5 1.9
Japan 1.4 4.0 3.4
Korea 0.0 1.2 1.3
ASEAN-4 & SG 44.6 69.8 74.5
Vietnam
China 10.7 2.3 3.2
Japan 26.6 10.5 8.1
Korea 19.9 35.3 29.6
ASEAN-4 & SG 23.0 16.4 17.6
Plus-3 and ASEAN shares of FDI inflows to CLMV

Theme: 20 Years after the Asian Financial Crisis (AFC)
Source: AMRO, IMF 21
Capital Inflows Post-GFC
Eased rebalancing towards
domestic demand, but posed risks
to financial stability
Financial vulnerabilities: credit growth,
asset price inflation, leverage
Amplifies pro-cyclicality of financial cycle
and volatility, especially with lack of
depth in financial markets in EMs
Policy response
• Pragmatic and robust use of policy tools,
including macroprudential measures
Macroprudential policies
Capital flow management measures
FX interventions + greater flexibility
in exchange rates
Capital Inflows (Net) (ASEAN-4, Singapore, China and Korea)

Theme: 20 Years after the Asian Financial Crisis (AFC)
22
In the current
uncertain global
environment, the AFC
continues to offer
valuable lessons to
policymakers
Focus on risks arising from financial markets and
capital outflows (inter-connectedness and contagion risks)
I
Flexible and responsive policy framework, and
strengthening of buffers II
Greater financial cooperation within the region to deal
with external shocks. III
Lessons from the AFC
Theme: 20 Years after the Asian Financial Crisis (AFC)
23
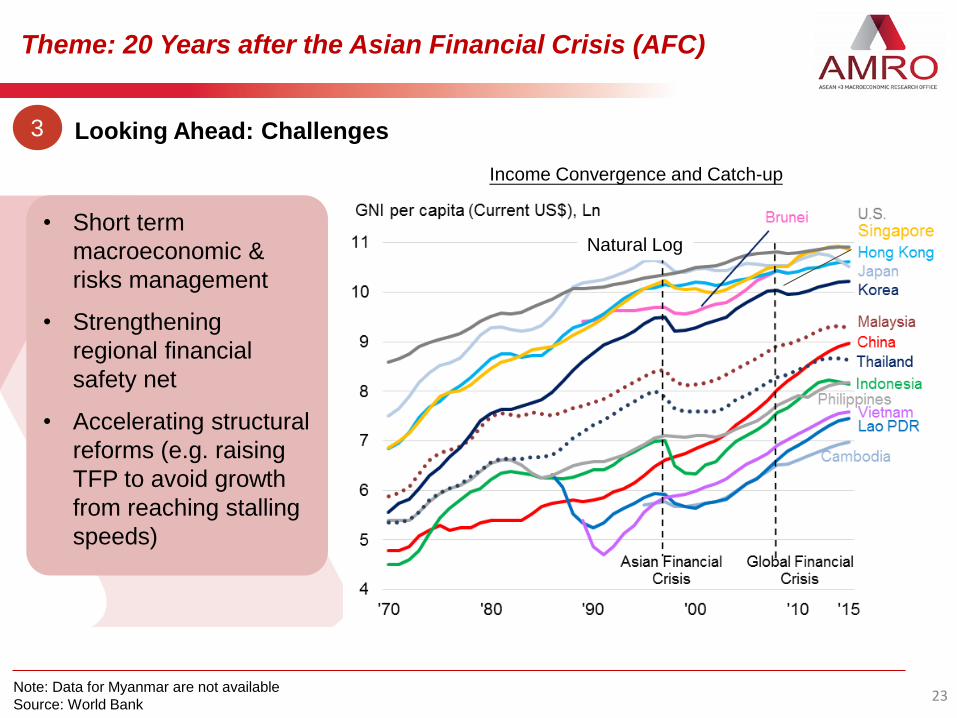
Looking Ahead: Challenges 3
Note: Data for Myanmar are not available
Source: World Bank
• Short term
macroeconomic &
risks management
• Strengthening
regional financial
safety net
• Accelerating structural
reforms (e.g. raising
TFP to avoid growth
from reaching stalling
speeds)
Income Convergence and Catch-up
Natural Log

Singapore’s Experience
27
• Singapore weathered the AFC relatively well. The economic fundamentals
were sound with large current account and fiscal account surplus.
• However, Singapore did not escape the fallout from the regional crisis,
and GDP declined during AFC.
Source: CEIC
Current account GDP by expenditure

27
• SGD fell against the USD but rose against regional currencies. SGD’s
appreciation against the regional currency posed a challenge in cost
competiveness.
• Asset price fell, hurting corporate, households and the financial
institutions.
Source: CEIC
Asset price fell Exchange rate (against USD)
Singapore’s Experience
27
• Singapore’s policy response to the crisis is not to reject
globalization and liberalizations, but to undertake further reforms
and restructuring to ensure international competitiveness.
• Managed exchange rate system: Following the outbreak of the crisis, the MAS
took steps to ease its monetary policy somewhat to cushion the rapidly
decelerating Singapore economy.
• Fiscal and cost-cutting measures: Singapore adopted a more expansionary
fiscal policy in FY 1998, including a number of off-budget packages of cost cutting
and stimulus measures, such as substantial wage cuts, CPF cuts, cuts in land and
rental costs and in government user charges. There was also more public
investment expenditures and tax rebates. It is pragmatic and kept Singapore
competitive and kept jobs.
• Stick to openness and long term economic restructuring: Singapore’s
fundamental approach towards economic development remained unchanged, with
continuing reliance on market forces, allowing free capital flows and foreign
investments. At the same time, it continued to promote education and training,
encouraging new investments and liberalization of the financial sector in the long
term.
Singapore’s Experience

Recap: Key Messages
24
1. Regional growth to be sustained about 5% in 2017-18.
2. Near term outlook for the region turned somewhat brighter, although risks
are tilted to the downside, from tightening global financial conditions, trade protectionism and global policy uncertainties.
5. AFC shaped policymakers’ perspectives on crisis management and
resolution – AMRO and CMIM established. Post-AFC, policy attention
shifted to capital flows and contagion risks – the need for flexible policy
framework.
3. In China, growth is expected to moderate in 2017-18, projected at 6.5% and
6.3%, respectively. Private investment activities have notably picked up
recently, alongside improvement in corporate profits.
6. Enhanced financial cooperation in ASEAN+3 will improve the resilience
against shocks, allowing the region to sustain relatively strong growth.
4. Some policymakers will face a sharper trade-off between growth and
financial stability objectives, at a time when policy space has
narrowed/constrained.

25
Thank You
Contact Us:
ASEAN+3 Macroeconomic Research Office (AMRO)
Address: 10 Shenton Way, #15-08/9 MAS Building,
Singapore 079117
Tel : +65 6323 9844
Fax : +65 6323 9827
Email : [email protected]
Website : www.amro-asia.org