Embed Size (px)
Citation preview

Jamaluddin Nor Mohamad
Director, Islamic & Alternative Markets
ASEAN Capital Market CEO Summit
Country Breakout Session:
Malaysia, the Centre of Islamic Capital Market
Bursa Malaysia Islamic Market
12 February 2015

OVERVIEW OF MALAYSIAN
ISLAMIC CAPITAL MARKET
Multinational
Fuelling Growth
Building Capital
Sustainable
Diverse
Harmonisation of
Islamic Market

Bursa Malaysia: An Integrated Exchange
3
How Bursa Malaysia plays its role in the Islamic Capital Market
SECURITIES
Main Market: 799 companies
ACE Market: 107 companies
Market Capitalisation
(as at 31 Jan 2015):
RM1.67 trillion
Products: Shares, ETFs,
REITs, Warrants, CBBCs, Loan
Stocks & Bonds
Commodity Derivatives:
Gold Futures, CPO
Futures, Crude Palm
Kernel Oil Futures
Equity Derivatives:
FBMKLCI Futures,
FBMKLCI Options
Financial Derivatives
DERIVATIVES
Shariah-compliant
equities, i-ETFs, i-REITs
Bursa Suq Al-Sila’
Sukuk
ISLAMIC
Bonds Reporting on
Electronic Trading
Platform
Bonds & Sukuk listing
Exchange Traded Bonds
& Sukuk (ETBS)
Labuan International
Financial Exchange (LFX):
Non-Ringgit Securities
OTHERS
Listing Trading Depository Settlement Clearing
Islamic
Capital Market Takaful
Islamic Financial
Institutions
Sukuk/ ETBS Shariah-compliant
Securities i-Stocks
i-Indices
i-ETFs
i-REITs
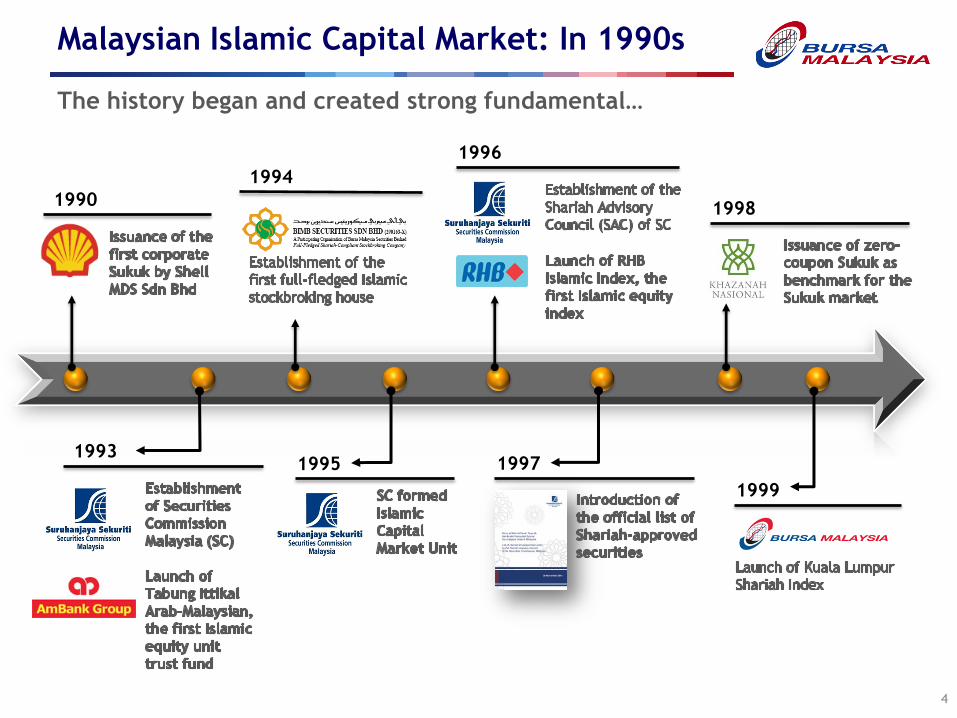
Malaysian Islamic Capital Market: In 1990s
4
1990
The history began and created strong fundamental…
1993
1994
1995
1996
1997
1998
1999

Malaysian Islamic Capital Market: In 2000s
5
2001
The history evolved…
2000 2002
2007
2009
2005
2006
2008

Malaysian Islamic Capital Market: In 2010s
6
2011
And the achievement continues…
2012
2013
2014

SHARIAH-COMPLIANT
PRODUCT OFFERINGS
Multinational
Fuelling Growth
Building Capital
Sustainable
Diverse
Harmonisation of
Islamic Market

Shariah-compliant Product Offerings
8
Equities
Indices
ETFs
REITs
Warrants
Loans/
Debenture
Bonds/ Sukuk
i-Stocks
i- Indices
i-ETFs
i-REITs
Sukuk
S
H
A
R
I
A
H
S
C
R
E
E
N
I
N
G
Products Shariah-compliant
products
Islamic
Stock-
broking
Intermediaries
Stock-
broking
(Participant
Organisations)
Creating supply of Shariah-compliant products for the market
Securities Screening Methodology
9
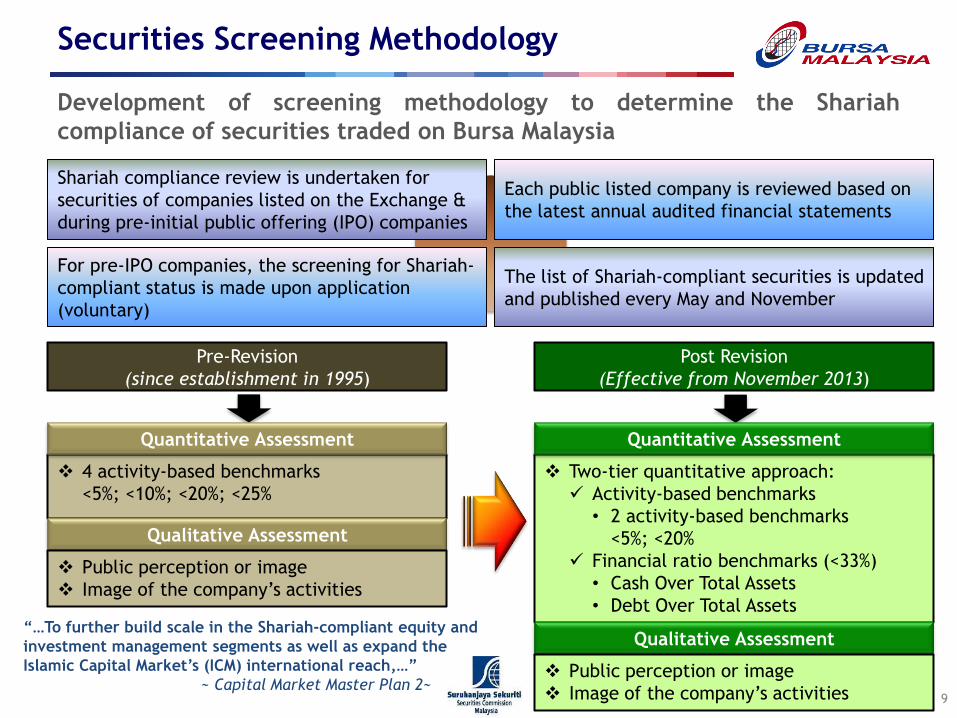
Development of screening methodology to determine the Shariah
compliance of securities traded on Bursa Malaysia
Shariah compliance review is undertaken for
securities of companies listed on the Exchange &
during pre-initial public offering (IPO) companies
Each public listed company is reviewed based on
the latest annual audited financial statements
Pre-Revision
(since establishment in 1995)
For pre-IPO companies, the screening for Shariah-
compliant status is made upon application
(voluntary)
The list of Shariah-compliant securities is updated
and published every May and November
Post Revision
(Effective from November 2013)
4 activity-based benchmarks
<5%; <10%; <20%; <25%
Quantitative Assessment
Qualitative Assessment
Public perception or image
Image of the company’s activities
Two-tier quantitative approach:
Activity-based benchmarks
• 2 activity-based benchmarks
<5%; <20%
Financial ratio benchmarks (<33%)
• Cash Over Total Assets
• Debt Over Total Assets
Quantitative Assessment
Qualitative Assessment
Public perception or image
Image of the company’s activities
“…To further build scale in the Shariah-compliant equity and
investment management segments as well as expand the
Islamic Capital Market’s (ICM) international reach,…”
~ Capital Market Master Plan 2~

Revised Shariah Screening Methodology
10
In view of the current development and sophistication of the industry in
support of internationalisation of Islamic Finance
Pre-Revision
(28 November 2013)
Pre-Revision Post-Revision 31 Jan 2015
Shariah Non-Compliant PLCs Shariah Compliant PLCs
Market Capitalisation:
RM1,077 mil
115 262
674 (74.4%)
231
Market Capitalisation:
RM1,011 mil
Post-Revision
(29 November 2013)
Market Capitalisation:
RM1,060 mil
As at
31 January 2015
Source: Securities Commission Malaysia; Bursa Malaysia
652 (71.3%) 799
(87.4%)
Note: PLCs = Public Listed Companies
There is a scarcity premium for Shariah-compliant stocks
as the pool of such stocks is now more limited than before… ~ “2014 Outlook & Lookouts”, Maybank IB Research, 23 December 2013 ~

Shariah-compliant ETFs and REITs
11
Efficient Way to Diversify
Source: Bursa Malaysia
The Easiest Way to Invest in Large-scale
Real Estate MyETF Dow Jones Islamic Market
Malaysia Titans 25 (MyETF-DJIM 25)
MyETF MSCI Malaysia Islamic
Dividend (MyETF-MMID)
NAV (Dec 2014) RM289.79 mil
NAV (Dec 2014) RM21.46 mil
Launched by KPJ Healthcare Bhd in 2006
World’s first i-REIT and hospital i-REIT
Converted into Islamic in 2008
Office and industrial properties
World’s first Shariah-compliant stapled
securities
ASEAN’s 3rd largest REIT

Global Sukuk Issuances
12
Sukuk has played pivotal role in infrastructure financing for both public
and private projects. Overall, the sukuk market is expected to reach
greater heights.
Malaysia’s sukuk market is recognised as the most
vibrant and active in the world. In 2013, Malaysia
maintained its top position as the largest sukuk
issuer with a 69% share of the total issuances in
2013 amounting to almost USD82.4 billion.
By currency, Malaysian Ringgit sustained its
domination representing 67% of total sukuk
issuances for the year 2013 worth USD80.4 billion.
By structure, Murabahah is the most popular
instrument in Malaysia representing 75% or USD61.8
billion of total Malaysian sukuk issuances.
Listing of Sukuk on Bursa Malaysia
13
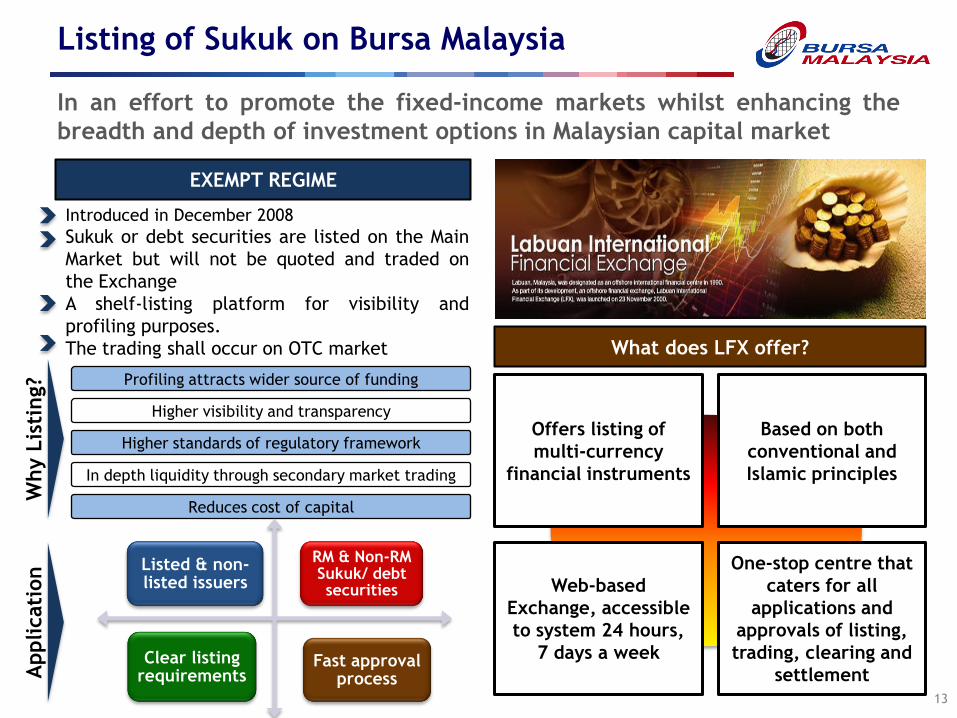
In an effort to promote the fixed-income markets whilst enhancing the
breadth and depth of investment options in Malaysian capital market
EXEMPT REGIME
Introduced in December 2008
Sukuk or debt securities are listed on the Main
Market but will not be quoted and traded on
the Exchange
A shelf-listing platform for visibility and
profiling purposes.
The trading shall occur on OTC market
Profiling attracts wider source of funding
Higher visibility and transparency
Higher standards of regulatory framework
In depth liquidity through secondary market trading
Why L
isti
ng?
Reduces cost of capital
Listed & non-listed issuers
RM & Non-RM Sukuk/ debt securities
Clear listing requirements
Fast approval process A
pplicati
on
Offers listing of
multi-currency
financial instruments
Based on both
conventional and
Islamic principles
Web-based
Exchange, accessible
to system 24 hours,
7 days a week
One-stop centre that
caters for all
applications and
approvals of listing,
trading, clearing and
settlement
What does LFX offer?

Sukuk as a Source of Infrastructure Financing
14
To-date, Malaysia has been a major issuer of infrastructure sukuk.
Issuers include government-related entities, as well as construction and
real estate players for the purpose of building highways, public
transportation structures, offices, hospitals and universities.
12
19 19 20 20 20 17.63
27.73 28.46
33.70 32.88 34.16
2009 2010 2011 2012 2013 2014
Number of Sukuk Listing Value of Sukuk Listing
Sukuk Listing on Exempt Regime
from 2002 to 2014 (USD billion)
Sukuk Listing on LFX
from 2002 to 2014 (USD billion)
3 3
9 9 9
0.75
4.20
6.84 6.85
6.00
2010 2011 2012 2013 2014
Number of Sukuk Listing Value of Sukuk Listing
Source: Bursa Malaysia
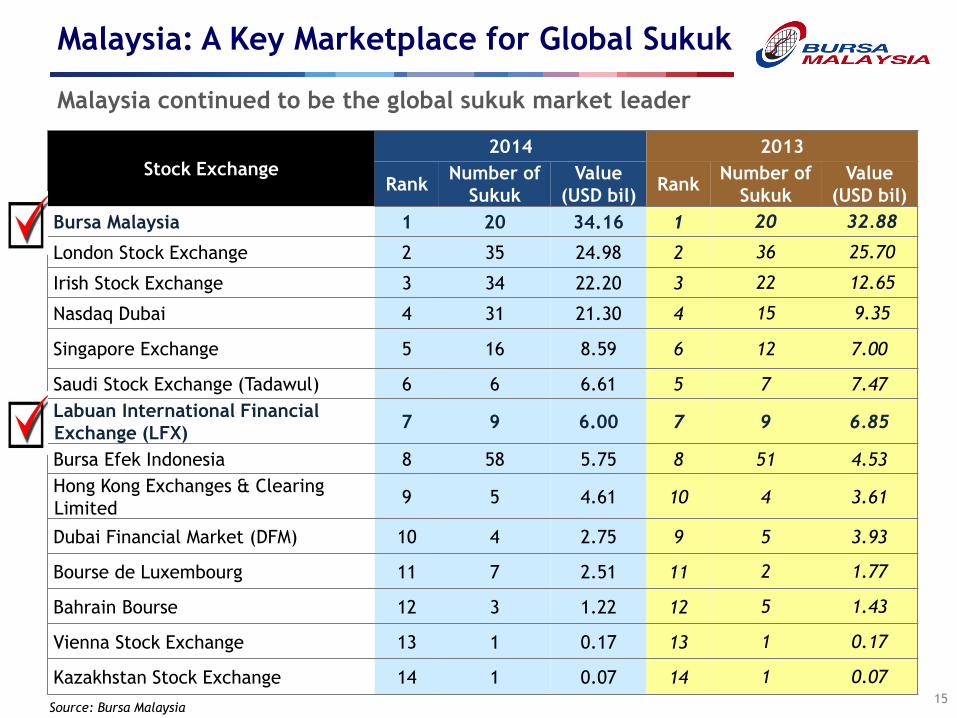
Malaysia: A Key Marketplace for Global Sukuk
15
Malaysia continued to be the global sukuk market leader
Source: Bursa Malaysia
Stock Exchange
2014 2013
Rank Number of
Sukuk
Value
(USD bil) Rank
Number of
Sukuk
Value
(USD bil)
Bursa Malaysia 1 20 34.16 1 20 32.88
London Stock Exchange 2 35 24.98 2 36 25.70
Irish Stock Exchange 3 34 22.20 3 22 12.65
Nasdaq Dubai 4 31 21.30 4 15 9.35
Singapore Exchange 5 16 8.59 6 12 7.00
Saudi Stock Exchange (Tadawul) 6 6 6.61 5 7 7.47
Labuan International Financial
Exchange (LFX) 7 9 6.00 7 9 6.85
Bursa Efek Indonesia 8 58 5.75 8 51 4.53
Hong Kong Exchanges & Clearing
Limited 9 5 4.61 10 4 3.61
Dubai Financial Market (DFM) 10 4 2.75 9 5 3.93
Bourse de Luxembourg 11 7 2.51 11 2 1.77
Bahrain Bourse 12 3 1.22 12 5 1.43
Vienna Stock Exchange 13 1 0.17 13 1 0.17
Kazakhstan Stock Exchange 14 1 0.07 14 1 0.07
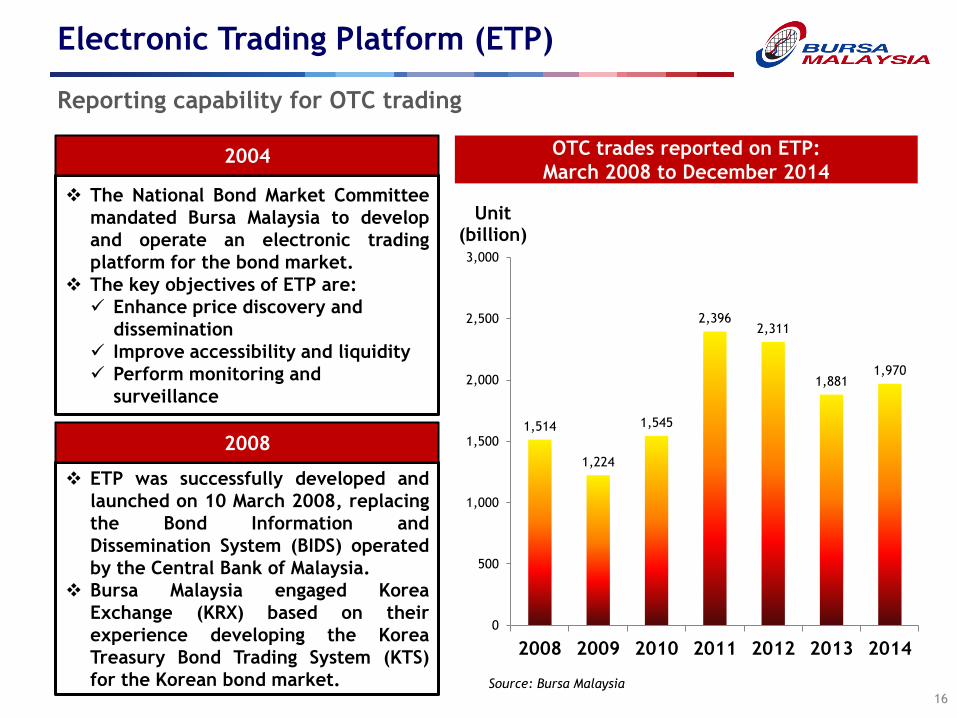
Electronic Trading Platform (ETP)
16
Reporting capability for OTC trading
The National Bond Market Committee
mandated Bursa Malaysia to develop
and operate an electronic trading
platform for the bond market.
The key objectives of ETP are:
Enhance price discovery and
dissemination
Improve accessibility and liquidity
Perform monitoring and
surveillance
2004
ETP was successfully developed and
launched on 10 March 2008, replacing
the Bond Information and
Dissemination System (BIDS) operated
by the Central Bank of Malaysia.
Bursa Malaysia engaged Korea
Exchange (KRX) based on their
experience developing the Korea
Treasury Bond Trading System (KTS)
for the Korean bond market.
2008
1,514
1,224
1,545
2,396 2,311
1,881 1,970
0
500
1,000
1,500
2,000
2,500
3,000
2008 2009 2010 2011 2012 2013 2014
Unit (billion)
OTC trades reported on ETP:
March 2008 to December 2014
Source: Bursa Malaysia

Exchange Traded Bonds and Sukuk (ETBS)
17
Bringing Sukuk trading capability in the secondary market
… a need to increase transparency and
liquidity in the secondary market to
match the growth in primary issuance.
This will be achieved through
strengthening the environment for
electronic trading and infrastructure in
the areas of bond lending, market-
making, trading, clearing, settlement
and custodian services.
…the traditionally strong bank deposit
base will increasingly be complemented
by higher direct participation of savers
and investors in the financial markets
through the growing suite of investment-
related savings accounts and products,
such as provident and pension funds,
insurance and takaful, as well as retail
bonds.
ETBS
Wider Market Offering
Accessibility & Broader
Investors Base Framework with Market
Transparency & Formed
Governance Structure
Market Protection to
Encourage Participation
Retail Access to Bonds/
Sukuk Market
Greater Choice of
Investment in Fixed Income
Products
Efficient Price
Discovery for Issuers & Market A platform that enables the retail market to
tap the growing capital market
Create vibrancy and more liquidity in the
Malaysian capital market
Provide price discovery & transparency to
the market and confidence to investors
Wider investor accessibility & increase
issuer’s profiling ability
1
2
3
4

What is ETBS? Eligibility? Mechanism?
18
Promote and strengthen retail participation in the fixed income market
Fixed income securities that are
listed and traded on the Exchange.
The product enables retail to access Investment grade instruments which aim at
tapping investors whose risk appetite tend
to be more conservative and/or seeking
diversity in the stock market.
Utilizes the same mechanism as that of
buying and selling shares
What is ETBS?
Bonds/
Sukuk
Issuance:
Process
Flow
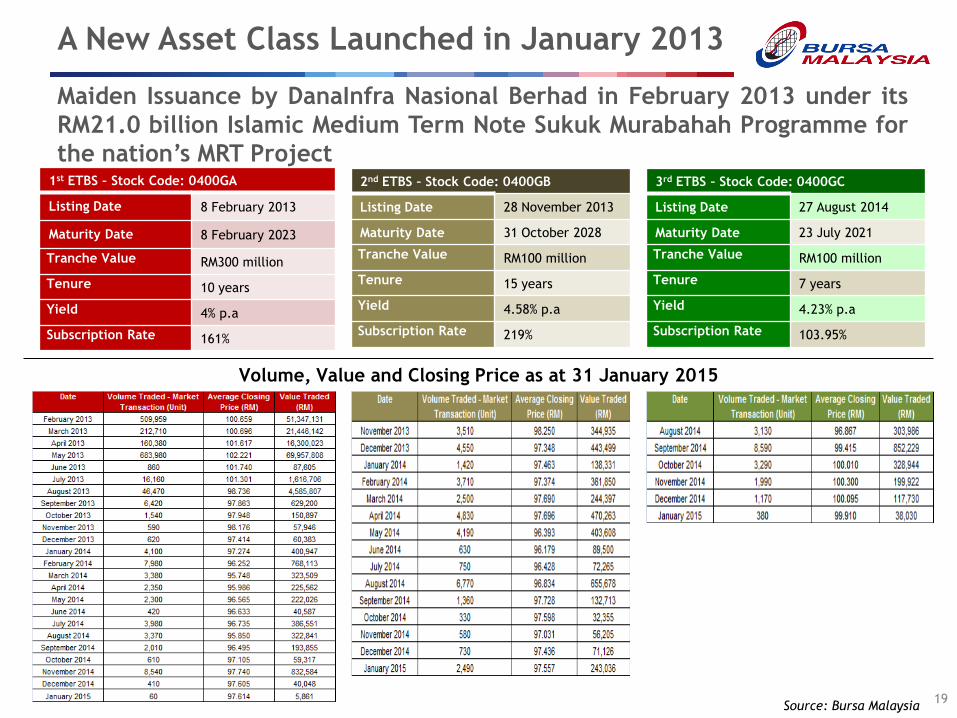
A New Asset Class Launched in January 2013
19
Maiden Issuance by DanaInfra Nasional Berhad in February 2013 under its
RM21.0 billion Islamic Medium Term Note Sukuk Murabahah Programme for
the nation’s MRT Project
1st ETBS – Stock Code: 0400GA
Listing Date 8 February 2013
Maturity Date 8 February 2023
Tranche Value RM300 million
Tenure 10 years
Yield 4% p.a
Subscription Rate 161%
2nd ETBS – Stock Code: 0400GB
Listing Date 28 November 2013
Maturity Date 31 October 2028
Tranche Value RM100 million
Tenure 15 years
Yield 4.58% p.a
Subscription Rate 219%
3rd ETBS – Stock Code: 0400GC
Listing Date 27 August 2014
Maturity Date 23 July 2021
Tranche Value RM100 million
Tenure 7 years
Yield 4.23% p.a
Subscription Rate 103.95%
Volume, Value and Closing Price as at 31 January 2015
Source: Bursa Malaysia

SHARIAH-COMPLIANT
PRODUCT PERFORMANCE
Multinational
Fuelling Growth
Building Capital
Sustainable
Diverse
Harmonisation of
Islamic Market

How did Shariah-compliant Securities Perform
21
The Shariah-compliant regime getting stronger
2010 2011 2012 2013 2014 Jan 2015
Total Market Capitalisation – Shariah
(RM bil)
803.2
(63.8%)
809.6
(63.7%)
945.9
(65.2%)
1,044
(62.1%)
1,028
(63.0%) 1,060
(63.5%)
Total ADV OMT – Shariah
(RM mil)
918
(66.7%)
1,088
(68.0%)
1,042
(69.8%)
1,269
(69.7%)
1,331
(68.6%) 1,236
(62.8%)
Total ADV OMT+DBT – Shariah (RM mil) 994
(66.6%)
1,134
(67.3%)
1,106
(69.9%)
1,453
(71.2%)
1,396
(68.3%) 1,336
(63.9%)
Total Number of Shariah-compliant
PLCs
849
(88.1%)
837
(88.7%)
819
(88.3%)
652
(71.3%)
685
(75.6%) 674
(74.5%)
Total Number of Shariah-compliant
Counters (PLCs + REITS + ETBS + ETFs)
846
(86.7%)
837
(87.1%)
817
(86.7%)
657
(70.2%)
693
(73.3%) 682
(73.1%)
918
1,0
88
1,0
42
1,2
69
1,3
31
1,2
36
ADV (RM mil)
Yearly Trend
10,457 11,023
12,675 14,324 14,469 14,937
803 810
946
1,044 1,028 1,061
-
200
400
600
800
1,000
1,200
-
2,000
4,000
6,000
8,000
10,000
12,000
14,000
16,000
2010 2011 2012 2013 2014 YTD 2015
FBM Hijrah Shariah
Shariah Market Cap (RM bil)
849 (88.1%)
837 (88.7%)
819 (88.3%)
652 (71.3%)
685 (75.6%)
674 (74.5%)
2010 2011 2012 2013 2014 YTD Jan 2015
Number of Shariah PLCs
No. of Shariah PLCs No. of PLCs
964
964 964
944 927 915 906 905
Source: Bursa Malaysia

Top 10 Active Stocks in 2014
22
Key point to note: All of them are Shariah-compliant
Source: Bursa Malaysia
Stock
Code Counter Market Sector
Traded Volume
(unit)
Market Capitalisation
(RM)
Shariah-
Compliant
1. 1201 Sumatec Resources Bhd Main Market Trading/Services 17,475,608,701 713,952,541.63 Yes
2. 6254 PDZ Holdings Bhd Main Market Trading/Services 13,697,273,471 121,704,979.20 Yes
3. 3786* Malaysian Airline System Bhd Main Market Trading/Services 13,653,529,897 4,428,357,018.00 Yes
4. 7013 Hubline Bhd Main Market Trading/Services 7,010,537,415 130,189,227.76 Yes
5. 0010 Iris Corporation Bhd ACE Market Technology 6,258,793,331 510,041,938.50 Yes
6. 7164 KNM Group Bhd Main Market Industrial Products 6,196,260,238 803,127,469.48 Yes
7. 5220 Globaltec Formation Berhad Main Market Industrial Products 6,166,905,936 376,721,653.77 Yes
8. 7219 Minetech Resources Bhd Main Market Industrial Products 5,959,872,385 79,811,280.00 Yes
9. 0150 Asia Bioenergy Tech Bhd ACE Market Trading/Services 4,845,133,113 105,050,000.00 Yes
10. 0096 Nexgram Holdings Berhad ACE Market Technology 4,712,127,962 131,819,413.60 Yes
TOTAL 85,976,042,449 7,400,775,521.94
* Stock Code 3786 MALAYSIAN AIRLINE SYSTEM BHD was delisted on 31 December 2014.
The market capitalization disclosed is market capitalization on the last trading day of the stock on 30 December 2014 .

23
-10%
-5%
0%
5%
10%
15%
20%
25%
Jan-14 Feb-14 Mar-14 Apr-14 May-14 Jun-14 Jul-14 Aug-14 Sep-14 Oct-14 Nov-14 Dec-14
Growth Percentage (%)
FBM KLCI FBM Emas Shariah FBM Hijrah Shariah FBM Small Cap Shariah FBM Palm Oil Plantation
2014: 12-month Index Performance & Growth
Index Jan-14 Feb-14 Mar-14 Apr-14 May-14 Jun-14 Jul-14 Aug-14 Sep-14 Oct-14 Nov-14 Dec-14
FBM KLCI 1,804.02 1,835.65 1,849.21 1,871.52 1,873.38 1,882.71 1,871.35 1,866.1 1,846.31 1,855.14 1,820.89 1,761.25
FBM Emas Shariah 12,604.02 12,895.61 13,146.17 13,214.49 13,136.04 13,387.34 13,383.98 13,219.73 13,185.84 13,346.36 13,036.26 12,507.02
FBM Hijrah Shariah 13,823.34 14,139.28 14,388.30 14,510.93 14,446.10 14,718.65 14,604.52 14,485.51 14,460.59 14,923.94 14,942.25 14,468.70
FBM Small Cap Shariah 14,653.15 15,510.91 14,146.52 16,419.97 16,462.12 16,939.69 17,856.21 17,397.7 17,407.24 16,561.32 15,194.18 13,870.23
FBM Palm Oil Plantation 18,123.28 18,888.74 19,421.45 19,857.63 20,029.47 20,060.35 19,496.08 18,629.78 18,510.73 18,968.93 18,336.86 16,977.01
Source: Bursa Malaysia
Both the FBM EMAS Shariah Index and the FBM Hijrah Shariah Index have
consistently outperformed the FBM KLCI ~ “2014 Outlook & Lookouts”, Maybank IB Research, 23 December 2013 ~

24
Index Performance & Growth
0%
10%
20%
30%
40%
50%
60%
70%
2010 2011 2012 2013 2014 YTD 2015
Growth Percentage (%)
FBM KLCI FBM Emas Shariah FBM Hijrah Shariah FBM Small Cap Shariah FBM Palm Oil Plantation
Index Year-end
2010 2011 2012 2013 2014 YTD Jan 2015
FBM KLCI 1,518.91 1,530.73 (0.78%) 1,688.95 (10.34%) 1,866.96 (10.54%) 1,761.25 (-5.66%) 1781.26 (1.14%)
FBM Emas
Shariah 10,058.15 10,300.29 (2.41%) 11,520.73 (11.85%) 13,051.59 13.29%) 12,507.02 (-4.17%) 12,851.97 (2.76%)
FBM Hijrah
Shariah 10,456.86 11,022.63 (5.41%) 12,674.93 (14.99%) 14,323.63 (13.01%) 14,468.70 (1.01%) 14,937.28 (3.24%)
FBM Small
Cap Shariah - - 10,482.56 14,645.47 (39.71%) 13,870.23 (-5.29%) 14,758.93 (6.41%)
FBM Palm Oil
Plantation 15,481.09 16,519.75 (6.71%) 16,768.74 (1.51%) 18,464.55 (10.11%) 16,977.01 (-8.06%) 17,125.47 (0.87%)
Amid a gloomy outlook worldwide in 2014, FBM Hijrah Shariah Index
remained sturdy and outperformed other indices.
Source: Bursa Malaysia
ISLAMIC FINANCE
IS NOT A CHOICE;
IT IS THE WAY FORWARD
Multinational
Fuelling Growth
Building Capital
Sustainable
Diverse
Harmonisation of
Islamic Market

Supply & Demand for Shariah-compliant
Products
26
Equities
Indices
ETFs
REITs
Warrants
Loans/
Debenture
Bonds/
Sukuk
i-Stocks
i- Indices
i-ETFs
i-REITs
Sukuk
S
H
A
R
I
A
H
S
C
R
E
E
N
I
N
G
Products Shariah-compliant
products
IFMCs
Islamic
UTFs
Investors
with
Islamic
mandates
Domestic & Foreign
Investors
Retail
HNWI
FMCs
UTFs
Wealth
Managers
Institutions
Greater foreign participation is envisaged, especially with the recent
streamlining of the revised screening methodology to better reflect
international practices
PLCs/
Non-PLCs
Investment
Banks
Fund
Arrangers
GLICs
SPV
Companies
Government
Issuers
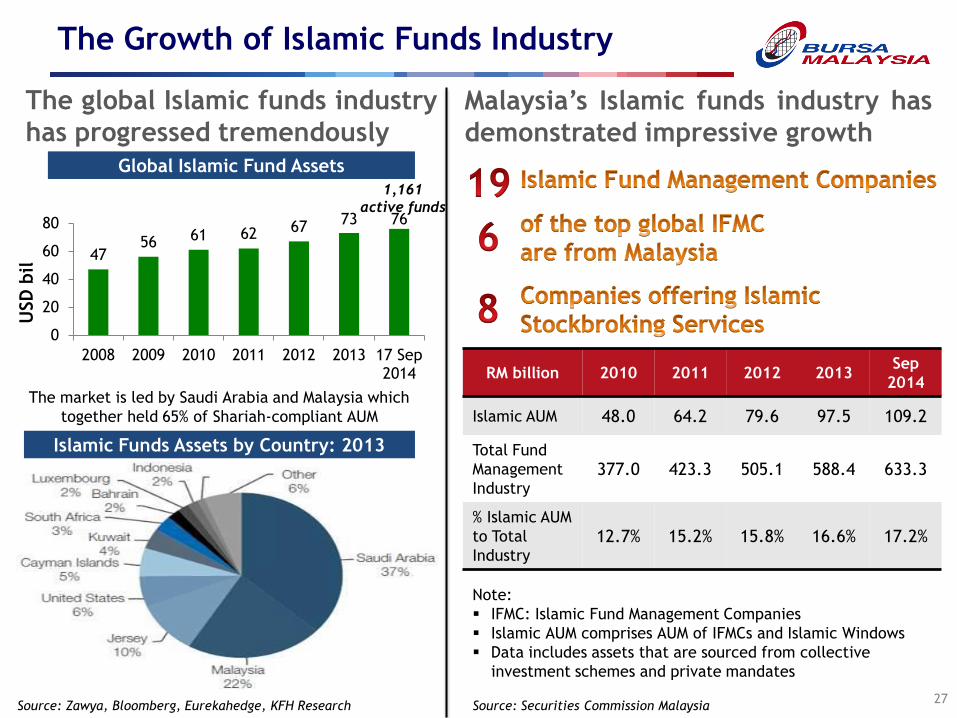
The Growth of Islamic Funds Industry
27
The global Islamic funds industry
has progressed tremendously
Malaysia’s Islamic funds industry has
demonstrated impressive growth
RM billion 2010 2011 2012 2013 Sep
2014
Islamic AUM 48.0 64.2 79.6 97.5 109.2
Total Fund
Management
Industry 377.0 423.3 505.1 588.4 633.3
% Islamic AUM
to Total
Industry 12.7% 15.2% 15.8% 16.6% 17.2%
Source: Securities Commission Malaysia
Note:
IFMC: Islamic Fund Management Companies
Islamic AUM comprises AUM of IFMCs and Islamic Windows
Data includes assets that are sourced from collective
investment schemes and private mandates
47 56 61 62 67
73 76
0
20
40
60
80
2008 2009 2010 2011 2012 2013 17 Sep 2014
USD
bil
Source: Zawya, Bloomberg, Eurekahedge, KFH Research
Global Islamic Fund Assets
1,161
active funds
The market is led by Saudi Arabia and Malaysia which
together held 65% of Shariah-compliant AUM
Islamic Funds Assets by Country: 2013
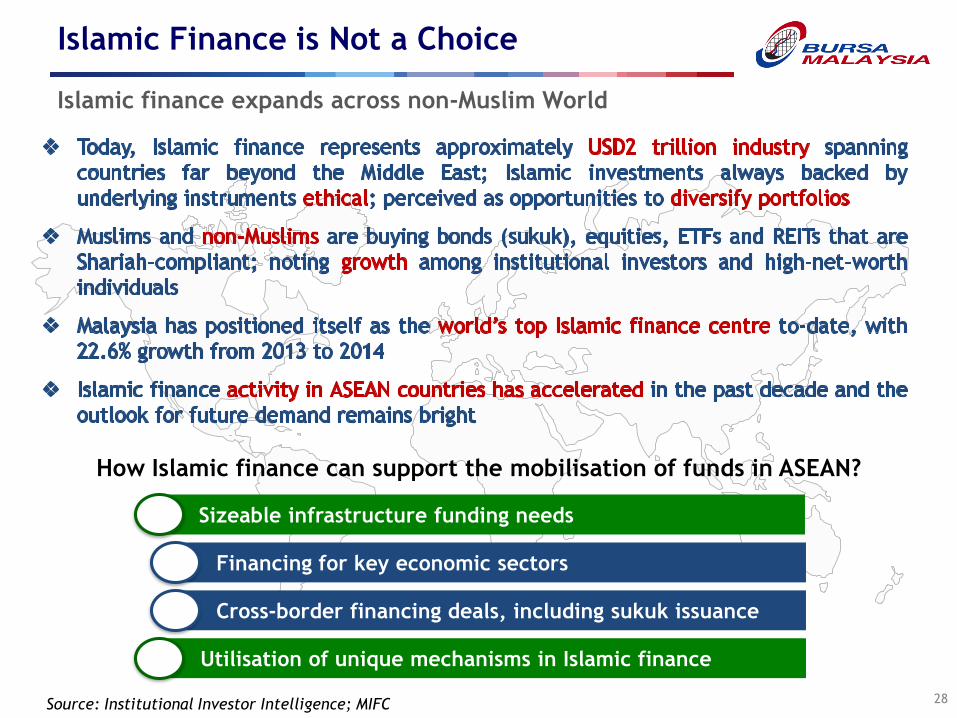
Islamic Finance is Not a Choice
28
Islamic finance expands across non-Muslim World
Source: Institutional Investor Intelligence; MIFC
How Islamic finance can support the mobilisation of funds in ASEAN?
Sizeable infrastructure funding needs
Financing for key economic sectors
Cross-border financing deals, including sukuk issuance
Utilisation of unique mechanisms in Islamic finance
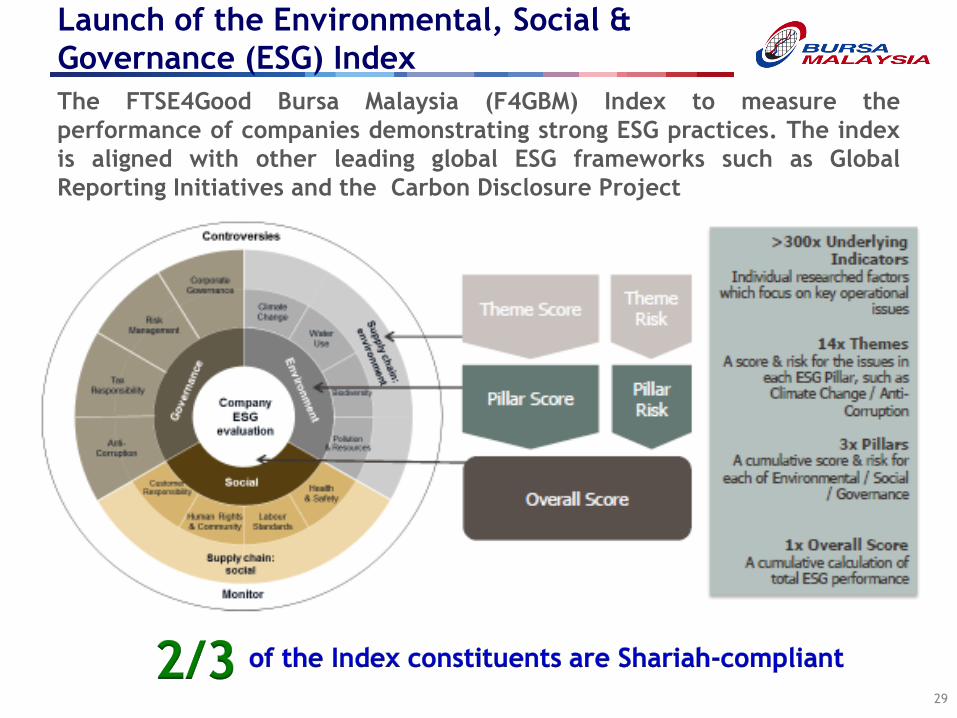
Launch of the Environmental, Social &
Governance (ESG) Index
29
The FTSE4Good Bursa Malaysia (F4GBM) Index to measure the
performance of companies demonstrating strong ESG practices. The index
is aligned with other leading global ESG frameworks such as Global
Reporting Initiatives and the Carbon Disclosure Project
LIQUIDITY MANAGEMENT
Multinational
Fuelling Growth
Building Capital
Sustainable
Diverse
Harmonisation of
Islamic Market

The Notable Bursa Suq Al-Sila’
31
World’s first Shariah-compliant commodity trading platform
Wider Market Offering
Accessibility & Broader
Investors Base
Facilitate Islamic
financing by
applying the concept
of Murabahah and
Tawarruq
Multi-commodity and
multi-currency
Operates in a 15-
hour 6-day market
Members are
governed by a set of
trading rules
encompassing best
market practices
and Shariah
principles
Five (5) approved
commodities:
Crude Palm Oil (CPO)
Refined, Bleached
and Deodorised Palm
Olein (RDB Palm
Olein)
Plastic Resin
(Polyethylene)
Hardwood Timber
Softwood Timber
25 currencies
Bids and Offers are
placed daily and
trades are matched
electronically
Commodities are
deliverable upon
election of the
purchaser
28 42
51 60
73 75 5
13
18 18
20 20
2010 2011 2012 2013 2014 YTD 2015
Foreign Institution Domestic Institution
No. of Participants: 95 (YTD Jan 2015)
Source: Bursa Malaysia Islamic Services Sdn Bhd
Domestic Foreign Total
CTPs 52 18 70
CEPs 4 - 4
CSPs 19 2 21
Total Participants 95
Demography of BSAS Registered Participants

BSAS Growth Driven by Better Recognition
32
Higher ADV of BSAS trades and the growing acceptance of Murabahah and
BSAS by domestic banks and sukuk issuers
Source: Bursa Malaysia Islamic Services Sdn Bhd
YTD 2015 ADV: RM10.8bil (2014: RM6.9bil)
YTD 2015 Commodity Trading Value: RM226.7bil
(Total 2014: RM1,687.9bil)
YTD 2015 ADC Trading Volume: 805,419 MT
YTD 2015 Trading Volume: 50,533,942 MT
YTD 2015 Trading Revenue: RM1.3mil (2014: RM9.9mil)
Largest Monthly ADV: RM10.9bil (Dec 2014)
Largest Trade in a Day: RM19.5bil (29 Jan 2015)
Largest Deal in a Day: RM6.9bil (29 Jan 2015)
BSAS Market Highlights
91 79 68
70
79
89
9 21
32
30
21
11
2010 2011 2012 2013 2014 YTD 2015
Total Foreign Trading Value (%)
Total Domestic Trading Value (%)
Total Commodity Trading Value: RM1,688 bil (2014)
YTD January 2015: RM227 bil
Market Demography of BSAS Trading Value
2.3 3.9
6.9
10.8
0
2
4
6
8
10
12
2012 2013 2014 Jan 2015
RM bil
BSAS Average Daily Value (ADV)

BSAS: Tenure-based Pricing Structure
33
The new pricing structure introduced..
Tenure-based Pricing
Short
(1 - 4 days)
Mid
(5 – 22 days)
Normal
(>22 days)
RM3.00 per
RM million
RM10.00 per
RM million
RM15.00 per
RM million
To facilitate regulatory changes
To support the development of
short-term Murabahah products
To improve yields of liquidity
products

To the ASEAN Community…
34
#ynotIF
Bursa Malaysia aims to be the Preferred Partner in Asia for fund raising,
trading and investment

DISCLAIMER :
Bursa Malaysia and its Group of Companies (the Company) reserve all proprietary rights to the contents of this presentation. Whilst
the Company endeavours to ensure that the contents in this presentation are accurate, complete or have been obtained from sources
believed by the Company to be accurate and reliable, neither the Company nor the presenter make any warranty, express or implied,
nor assume any legal liability or responsibility for the accuracy, completeness or currency of the contents of this presentation. In no
event shall the Company be liable for any claim, howsoever arising, out of or in relation to this presentation."
© Bursa Malaysia 2013
Thank You
#ynotIF
#aseanCAP10
#beASEAN http://www.bursamalaysia.com/market/islamic-markets/