Embed Size (px)
Citation preview

ASCAT wind validation report
Global OSI SAF 25 km wind product (OSI-102 and OSI-102-b)
Global OSI SAF coastal wind product (OSI-104 and OSI-104-b)
Version: 1.0
Date: 16/05/2018
Anton Verhoef and Ad Stoffelen

ASCAT wind validation report SAF/OSI/CDOP3/KNMI/TEC/RP/326 16/05/2018 Version 1.0 2/12
Document Change record Document version
Software version
Date Author Change description
1.0 16/5/2018 AV First version
Table of contents 1. Introduction ............................................................................................................................................. 3
1.1. Acknowledgement............................................................................................................................ 3 2. Comparison with NWP model wind data ................................................................................................ 4 3. Buoy validations ..................................................................................................................................... 8 4. Conclusions .......................................................................................................................................... 10 5. References ............................................................................................................................................ 11 6. Abbreviations and acronyms ................................................................................................................ 12

ASCAT wind validation report SAF/OSI/CDOP3/KNMI/TEC/RP/326 16/05/2018 Version 1.0 3/12
1. Introduction The EUMETSAT Ocean and Sea Ice Satellite Application Facility (OSI SAF) produces a range of air-sea interface products, namely: wind, sea ice characteristics, Sea Surface Temperatures (SST) and radiative fluxes, Surface Solar Irradiance (SSI) and Downward Long wave Irradiance (DLI). The Product Requirements Document [1] provides an overview of the committed products and their characteristics in the current OSI SAF project phase, the Service Specification Document [2] provides specifications and detailed information on the services committed towards the users by the OSI SAF in a given stage of the project.
The Advanced SCATterometer (ASCAT) is one of the instruments carried on-board the Meteorological Operational (Metop) polar satellites launched by the European Space Agency (ESA) and operated by the EUropean organisation for the exploitation of METeorological SATellites (EUMETSAT). Metop-A, the first in a series of three satellites, was launched on 19 October 2006, Metop B was launched on 17 September 2012. Metop C is planned to be launched in autumn 2018.
The OSI SAF delivers operational level 2 wind products with 25 and 12.5 km Wind Vector Cell (WVC) spacing in near-real time [3], based on the ASCAT level 1b products. See the EUMETSAT documentation [4] for more information on the level 1b product characteristics. The 12.5 km products (also referred to as ‘coastal products’) use the so-called box-car spatial filtering, contrary to the 25 km products which use a Hamming spatial filtering [3].
Currently (spring 2018) an upgrade of the ASCAT wind products is being prepared. The current winds are still produced using the previous CMOD5.n Geophysical Model Function (GMF), it is planned to start using the CMOD7 GMF [5]. Moreover, the current products contain real 10m ECMWF model winds as auxiliary information, these will be replaced by stress-equivalent ECMWF winds, which are known to better resemble the scatterometer winds [6] and hence provide a better reference for comparison.
In this report, we assess the quality of the existing (old) and the new OSI SAF wind products and we will mainly focus on the differences between old and new products. We compare the scatterometer wind data with ECMWF model data in section 2 and with in situ wind data from moored buoys in section 3. Section 4 summarises the main conclusions. We will only present results based on Metop-B ASCAT. The results from Metop-A are very similar to those from Metop-B.
The results presented in this report are encouraging and warrant the release of the new wind products.
1.1. Acknowledgement We are grateful to Jean Bidlot of ECMWF for helping us with the buoy data retrieval and quality control.

ASCAT wind validation report SAF/OSI/CDOP3/KNMI/TEC/RP/326 16/05/2018 Version 1.0 4/12
2. Comparison with NWP model wind data Figure 1 shows two-dimensional histograms of the retrieved winds versus background ECMWF real 10 m winds for the 25 km CMOD5.n wind product, after rejection of Quality Controlled (KNMI QC flagged) wind vectors. The data for these plots are from 42 consecutive orbits from 1 to 3 March 2017. Due to the large daily number of collocations with the model data, three days is sufficient to obtain reliable statistics. The seasonal oscillations are also known to be quite small for these type of comparisons. The top left plot corresponds to wind speed (bins of 0.5 m/s) and the top right plot to wind direction (bins of 2.5°). The latter are computed only for ECMWF winds larger than 4 m/s. The bottom contour plots show the u and v wind component statistics (bins of 0.5 m/s). The contour lines are in logarithmic scale. Figure 2 shows the comparisons of the new 25 km CMOD7 winds with ECMWF stress equivalent winds in the same way as in Figure 1.
Figure 1: Two-dimensional histograms of wind speed, direction (w.r.t. wind coming from the North), u and v components of 25 km ASCAT-B CMOD5.n wind product versus the ECMWF model forecast winds (real 10m winds) from 1-3 March 2017 (top panels). The corresponding biases (red) and standard deviations (blue) as a function of the average scatterometer and model winds are shown in the bottom.

ASCAT wind validation report SAF/OSI/CDOP3/KNMI/TEC/RP/326 16/05/2018 Version 1.0 5/12
Figure 2: Two-dimensional histograms of wind speed, direction (w.r.t. wind coming from the North), u and v components of 25 km ASCAT-B CMOD7 wind product versus the ECMWF model forecast winds (stress-equivalent 10m winds) from 1-3 March 2017 (top panels). The corresponding biases (red) and standard deviations (blue) as a function of the average scatterometer and model winds are shown in the bottom.
The results of old and new products are quite comparable when looking at the general statistics (Table 1), but some details differ. The change of ECMWF 10m winds to stress equivalent winds leads to a reduction of the general wind speed bias from 0.21 m/s to 0.00 m/s. This is not due to a change in the average ASCAT wind speeds, but it is caused by the different characteristics of neutral model winds which are known to be on average 0.2 m/s higher than the real model winds. Moreover, the wind speed bias curve is flatter for the CMOD7 winds than in the CMOD5.n winds, notably below 5 m/s, see the ‘Statistics – speed’ plots in Figure 1 and Figure 2. This improvement is due to the better scatterometer wind speed Probability Density Functions obtained by CMOD7 [5].

ASCAT wind validation report SAF/OSI/CDOP3/KNMI/TEC/RP/326 16/05/2018 Version 1.0 6/12
Figure 3: Two-dimensional histograms of wind speed, direction (w.r.t. wind coming from the North), u and v components of 12.5 km ASCAT-B CMOD5.n wind product versus the ECMWF model forecast winds (real 10m winds) from 1 March 2017 (top panels). The corresponding biases (red) and standard deviations (blue) as a function of the average scatterometer and model winds are shown in the bottom.
Figure 3 and Figure 4 show the ECMWF comparisons of the old and new 12.5 km products. The differences between old and new are comparable to those of the 25 km products: a reduction of the wind speed bias and a flattening of the wind speed bias curve.
# of wind
vectors speed
bias stdev u stdev v
25 km CMOD5.n 1,571,228 0.21 1.37 1.42
25 km CMOD7 1,570,313 0.00 1.37 1.42
12.5 km CMOD5.n 2,127,388 0.25 1.45 1.54
12.5 km CMOD7 2,128,053 0.02 1.44 1.55
Table 1: ECMWF comparison results of ASCAT-B 25 km and 12.5 km wind products.

ASCAT wind validation report SAF/OSI/CDOP3/KNMI/TEC/RP/326 16/05/2018 Version 1.0 7/12
Figure 4: Two-dimensional histograms of wind speed, direction (w.r.t. wind coming from the North), u and v components of 12.5 km ASCAT-B CMOD7 wind product versus the ECMWF model forecast winds (stress-equivalent 10m winds) from 1 March 2017 (top panels). The corresponding biases (red) and standard deviations (blue) as a function of the average scatterometer and model winds are shown in the bottom.
The 25 km ASCAT wind components compare slightly better to ECMWF than the 12.5 km ASCAT wind components. This is in line with the relatively coarse effective resolution of the ECMWF model data [9].
The ASCAT wind speed biases and wind component standard deviations are all well within the OSI SAF requirements: better than 2 m/s in wind component standard deviation with a bias of less than 0.5 m/s in wind speed.
ASCAT wind validation report SAF/OSI/CDOP3/KNMI/TEC/RP/326 16/05/2018 Version 1.0 8/12
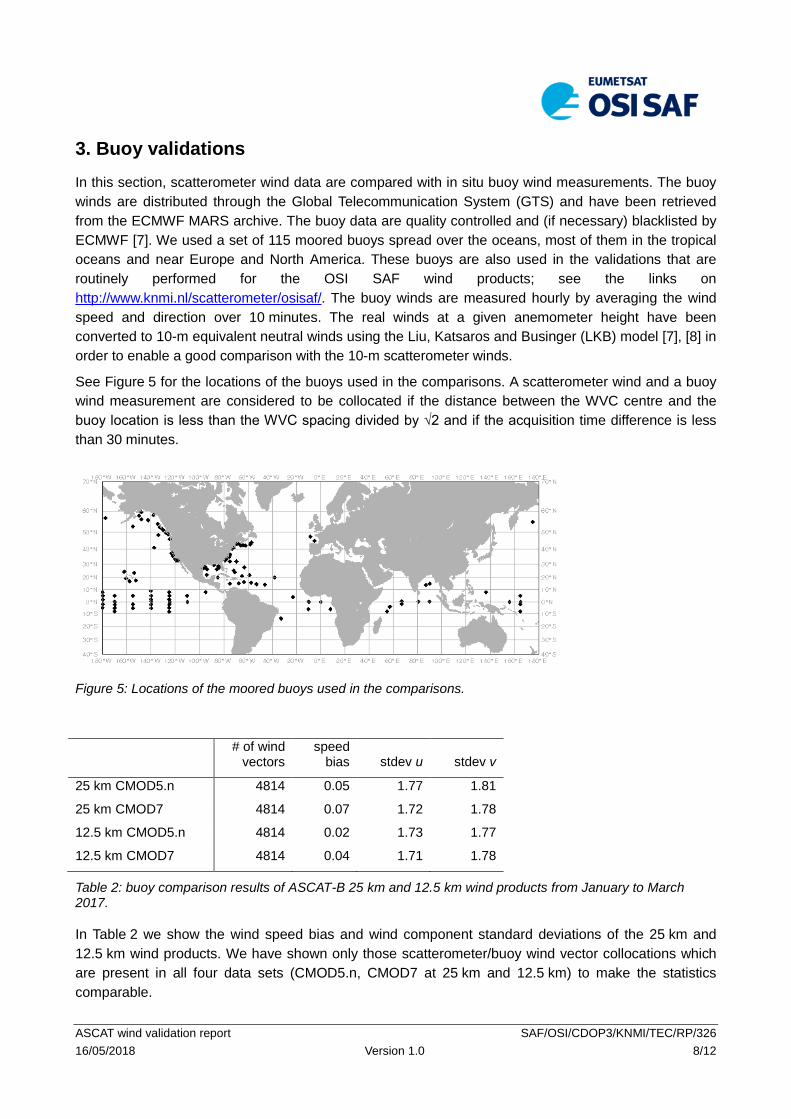
3. Buoy validations In this section, scatterometer wind data are compared with in situ buoy wind measurements. The buoy winds are distributed through the Global Telecommunication System (GTS) and have been retrieved from the ECMWF MARS archive. The buoy data are quality controlled and (if necessary) blacklisted by ECMWF [7]. We used a set of 115 moored buoys spread over the oceans, most of them in the tropical oceans and near Europe and North America. These buoys are also used in the validations that are routinely performed for the OSI SAF wind products; see the links on http://www.knmi.nl/scatterometer/osisaf/. The buoy winds are measured hourly by averaging the wind speed and direction over 10 minutes. The real winds at a given anemometer height have been converted to 10-m equivalent neutral winds using the Liu, Katsaros and Businger (LKB) model [7], [8] in order to enable a good comparison with the 10-m scatterometer winds.
See Figure 5 for the locations of the buoys used in the comparisons. A scatterometer wind and a buoy wind measurement are considered to be collocated if the distance between the WVC centre and the buoy location is less than the WVC spacing divided by √2 and if the acquisition time difference is less than 30 minutes.
Figure 5: Locations of the moored buoys used in the comparisons.
# of wind
vectors speed
bias stdev u stdev v
25 km CMOD5.n 4814 0.05 1.77 1.81
25 km CMOD7 4814 0.07 1.72 1.78
12.5 km CMOD5.n 4814 0.02 1.73 1.77
12.5 km CMOD7 4814 0.04 1.71 1.78
Table 2: buoy comparison results of ASCAT-B 25 km and 12.5 km wind products from January to March 2017.
In Table 2 we show the wind speed bias and wind component standard deviations of the 25 km and 12.5 km wind products. We have shown only those scatterometer/buoy wind vector collocations which are present in all four data sets (CMOD5.n, CMOD7 at 25 km and 12.5 km) to make the statistics comparable.

ASCAT wind validation report SAF/OSI/CDOP3/KNMI/TEC/RP/326 16/05/2018 Version 1.0 9/12
The table confirms that the wind speed biases of CMOD5.n and CMOD7 winds are very close to each other, the differences are only 0.02 m/s. The wind component standard deviations for 25 km slightly improve when we compare CMOD7 to CMOD5.n, for 12.5 km the differences are negligible. Generally, the 12.5 km winds show slightly lower wind component standard deviations as compared to 25 km winds. This is due to the finer resolution which is better capable to resolve the small scale wind variability that is observed by the buoys.

ASCAT wind validation report SAF/OSI/CDOP3/KNMI/TEC/RP/326 16/05/2018 Version 1.0 10/12
4. Conclusions The OSI SAF ASCAT-B 25 km and 12.5 km wind products have been validated, mainly focussing on the differences between the existing products using CMOD5.n and real 10m ECMWF winds, and the new products using CMOD7 and stress-equivalent 10m ECMWF winds. All products provide wind quality well within the OSI SAF product requirements [2]: better than 2 m/s in wind component standard deviation with a bias of less than 0.5 m/s in wind speed on a monthly basis.
Looking at the global bulk statistics as obtained from comparisons with ECMWF model winds an buoy winds, the new products show a slight improvement as compared to the old ones. However, the improvements when looking at specific regions, colder and warmer areas, and certain wind speed domains are more distinct and they are described extensively in literature [5], [6]. This is the main motivation for upgrading the OSI SAF operational ASCAT wind products.

ASCAT wind validation report SAF/OSI/CDOP3/KNMI/TEC/RP/326 16/05/2018 Version 1.0 11/12
5. References [1] OSI SAF,
Product Requirements Document, SAF/OSI/CDOP3/MF/MGT/PL/2-001, 2018
[2] OSI SAF, Service Specification Document, SAF/OSI/CDOP3/MF/MGT/PL/003, 2018
[3] OSI SAF, ASCAT Wind Product User Manual, SAF/OSI/CDOP/KNMI/TEC/MA/126, 2018
[4] EUMETSAT, ASCAT Level 1 Product Generation Function Specification EUM.EPS.SYS.SPE.990009
[5] Stoffelen, A., J. Verspeek, J. Vogelzang and A. Verhoef, The CMOD7 Geophysical Model Function for ASCAT and ERS Wind Retrievals, IEEE Journal of Selected Topics in Applied Earth O, 2017, 10, 5, 2123-2134, doi:10.1109/JSTARS.2017.2681806
[6] De Kloe, J., A. Stoffelen and A. Verhoef, Improved Use of Scatterometer Measurements by using Stress-Equivalent Reference Winds, IEEE Journal of Selected Topics in Applied Earth O, 2017, 10, 5, 2340-2347, doi:10.1109/JSTARS.2017.2685242
[7] Bidlot J., D. Holmes, P. Wittmann, R. Lalbeharry, and H. Chen Intercomparison of the performance of operational ocean wave forecasting systems with buoy data Wea. Forecasting, vol. 17, 287-310, 2002
[8] Liu, W.T., K.B. Katsaros, and J.A. Businger Bulk parameterization of air-sea exchanges of heat and water vapor including the molecular constraints in the interface J. Atmos. Sci., vol. 36, 1979
[9] Vogelzang, J., A. Stoffelen, A. Verhoef and J. Figa-Saldana On the quality of high-resolution scatterometer winds J. Geophys. Res., 116, C10033, 2011, doi:10.1029/2010JC006640

ASCAT wind validation report SAF/OSI/CDOP3/KNMI/TEC/RP/326 16/05/2018 Version 1.0 12/12
6. Abbreviations and acronyms
ASCAT Advanced Scatterometer
ECMWF European Centre for Medium-Range Weather Forecasts
EUMETSAT European Organisation for the Exploitation of Meteorological Satellites
GMF Geophysical Model Function
GTS Global Telecommunication System
KNMI Royal Netherlands Meteorological Institute
Metop Meteorological operational satellite
LKB Liu, Katsaros and Businger
NASA National Aeronautics and Space Administration
NWP Numerical Weather Prediction
OSI Ocean and Sea Ice
QC Quality Control
SAF Satellite Application Facility
u West-to-east (zonal) wind component
v South-to-north (meridional) wind component
WVC Wind Vector Cell


![On the characteristics of ASCAT wind direction …...1 1 On the characteristics of ASCAT wind direction ambiguities 2 3 W. Lin1, M. Portabella1, A. Stoffelen2, A. Verhoef2 4 [1]{Institut](https://img.dokumen.tips/doc/110x75/5ea833cf66737e5085395aa1/on-the-characteristics-of-ascat-wind-direction-1-1-on-the-characteristics-of.jpg)