Embed Size (px)
Citation preview
ASCA AND GRO OBSERVATIONS OF GX301-2Steven H. Pravdo’)2>3Charles S. R. Day3$4Lorella Angelini3’4Alan B. Harmon5
A. Yoshidaband
P. Saraswat$
submitted to the Astrophysical Journal April 1, 1995
lThe research described in this paper was carried out in part by the Jet PropulsionLaboratory, California Institute of Technology, under contract with the National Aeronautics andSpace Administration.
2Jet Propulsion Laboratory, Mail Stop 306-431, California Institute of Technology,Pasadena, CA 91109
3xlSCzl guest investigator
4University Space Research Association, Laboratory for High Elnergy Astrophysics,NASA/Goddard Space Flight Center, Code 668, Greembclt, MD 20771
‘Marshall Space Flight Center, ES84, Alabama 35812
b The Institute of Physical and Chemical Research (RIKIIN), Hirosawa, 2-1, Wako-shi,Saitama35 1-01, Japan

. .:
1. INTRODUCTIONGX301-2is mX-raypulsw inabina~system with thesupergiant WM977(Bl.5 la). The
orbit has a period of 41 .508+0.007 days and an eccentricity, e = 0.472 (Sato et al. 1986). The X-rayspectrum has episodes of enhanced low-energy absorption (Ricker et a/. 1973), an iron absorptionedge (Swank et al. 1976), pulse-phase dependence (1.eahy & Matsuoka 1990), orbital-phasedependence (Haberl 1991), and iron-line emission (Leahy et al. 1989).
The eccentric orbit results in periodic extended flares which are centered about 1.4 daysbefore periastron passage. The flares occur when the mass accretion rate onto GX301 -2 suddenlyincreases. Variations in the accretion from the WRA 977 stellar wind alone do not account for theintensity variations, even considering the eccentric orbit (e.g. White and Swank 1984). Rather,following Stevens (1988), Haberl (1991) andLeahy(1991 ) proposed that a gas stream flowing fromWRA 977 to the neutron star is the main source of accreted material. The initially puzzling resultthat the flares preceded periastron by 0.034 orbital phase was explained by a spiral-shaped gas streamwhich GX301 -2 intercepted on its approach to periastron. This model can account for the binaryphase dependence of the X-ray intensity but does not explain the highest observed hydrogen columndensity, N}l (Haberl 199 1) .
The source was identified as a pulsar by White et al. (1976). Between 1973 and 1984 thepulse period behavior with time was stochastic (Nagase 1989) leading to an explanation based uponangular momentum transferred via a stellar wind (e.g. White & Swank 1984). Since 1984 a secularspin-up has occurred which, according to the theory of Ghosh & lamb (1 979), indicates that anaccretion disk has formed.
This paper reports the results of an observation of (X301-2 with AS’CA and GRO in the 4-60keV range. These observations allow us to re-examine many of the previously reported results withthe higher spectral resolution afforded by the ASCA detectors and the high energy range ofBA TSE’GXO. In addition, the spatial resolution of the ASCA telescope allowed us to separateGX301 -2 from the X-ray contribution of previously undetected soft X-ray sources. A related paperdiscusses the analysis and results of this ASCA observation ofGX301 -2 X-ray spectrum <4 keV(Saraswat et al. 1995).
2. OBSERVATIONSASCzl observed GX301 -2 on 13-14 February 1994. The ASCA telescope and detectors are
described by Tunics et al. (1994). We use both Solid-state Imaging Spectrometer (S1S) and GasImaging Spectrometer (GIS) data in the 0.3-10 keV range: the S1S for its superior energy resolution(about a factor of 4 compared to the GIS) and the GIS for its enhanced high-energy response (E >5 keV) and field-of-view (50 arcrnin diameter).
lMXSFJGRCI provides nearly continuous coverag,e of GX301 -2 except for periods of Earthoccultation of the source or detector shutdown (e.g. during passages of the South Atlantic Anornal y).We use intensity and spectral data in the energy range 20-60 keV obtained with occultation analysisfrom the Large-Area Detectors, LAD I and LAD5. These are two of the eight uncollimated NaIscintillation crystal detectors that comprise BA ZSE (Fishman et al. 1989). In particular we takeBzl ZS’E data straddling the ASCA observation to construct the long-term light curve of the source,and data during the ASCA observation for the combined broadband spectroscopy.
3
3. RESULTS3.1 New Soft X-ray Source sNearGX301-2
GX301-2isso intense that itsbroadband image spills over into adjacent pixels and precludesthedetection ofnewsources inthesumounding fewarcntinutes. However ifwerestrict the X-rayimages to energies less than 2 keV we find two sources within 8’. Figure 1a shows the GEi’2 imageof the sky in X-rays from 0.8-2.0 keV, Source 1 near the center of the field is GX301-2. Source 2is located about 8’ NE of GX301-2 and is a new scmrce called AX] 227-6239 (GXS). Sources 3 and4 are weak, unidentified sources, and source 5 is probably a Cru. The higher spatial resolution inthe SLSO image (Figure lb; 0.5-2.0 kev) shows GX301-2 and another source, AX] 226-6249 (SXS),which is about 3’ southeast of GX3 01-2. This source is so weak compared to GX3 01-2 that it cannot be resolved with the automatic analysis program. Bc~th sources are near enough that previousobservations of GX3 01-2 would have been contaminated in this band.
GXS is fit by a thermal spectrum with kT -- 0.4 keV. . The GXS intensity based on thespectral fit is -9 x 10-13 erg cm-2 S-l in the 0.5-1.5 keV band, The images of GXS and GX301 -2 havethe same 0.5- 1.5 keV band intensity to within 100/o. Clearly GXS is a significant contaminant toGX30 1-2 in this soft band fbr detectors with low spatial resolution, SXS is a considerably weakerthan GXS, at about 4°/0 the GX301 -2 intensity.
GXS was also detected in an Einstein HRl observation on August 23, 1980. At that timeassuming the same spectral form, the intensity was about three times higher, 3.5+ 1.5 x 10⁻¹² erg cnl-2S-l. A number of IIX0SA7’CMA observations in the period 1983-1985 had GXS in the field of view.Only the 20 April 1984 observation had sufficient sensitivity to detect the source although theintensity is uncertain due to the low eftlciency of the A1/P filter that was used. The HRI positionyielded the finding chart shown in Figure 2. GXS is identified with a V= 10.77 mag star from theGuide Star Caialog (1 989). Figure 3 shows the blue spectrum of this star. The spectral shape andprominent emission lines at Ca II H and K and Ile suggest that this is a dMe star (Robinson et al.1990). Table 1 shows the equivalent widths of the detected lines.
The SXS position is known with less accuracy that GXS since we do not have a higherresolution detection elsewhere. We show in Figure 2 the position of the luminous, unidentified starMO- 16 (Marraco & Orsatti 1982), which is 14” from the SXS position.
3.2 GX301-2 Light Curve and FlaresFigure 4 shows the GX301-2 light curve obtained with the BA ME experiment in 1993-4.
Seven pre-periastron flares are evident. A predicted flare centered around day 132 in the figureoccurred during a gap in the data. The ASCA observation occurred during days 146-7 (Figure 4),GX301 orbital phase 0.27-0.29. The Haberl (1 991) model for a gas stream from the primary toGX301 -2 has an intensity maximum near phase 0.9 corresponding to the pre-periastron flare and abroad secondary intensity maximum near the phase of the ASCA obsewation, 0.3. This secondarymaximum is not seen in the 13A7SE data (see below). The light curve of the ASCzl data showsintensity variability y by a factor of -3, much of that attributable to the pulsations,
The flares are periodic and last several days. To determine the best flare period we folded thelight curve data over trial periods near the GX301 -2 orbital period determined by Sato et al. (1986).The highest X2 value for a constant model occurred for a flare period of 41.507 + 0.008 days. Thisperiod is consistent with the Sato et al, orbital and flare periods. We modeled the folded light curve
4

-z
with a polynomial function and Lorentzian andlor Gaussian components. Figure 5 shows a) thefolded data and b) the best-fit model. Note that if the width of a feature in a model was smaller thanthe temporal resolution in the data, we averaged the model over several steps smaller than the widthof the feature. The best-fit model contains a constant which describes the non-flaring intensity, twoLorentzians which describe the leading edge and fatling edges of the pre-periastron (PP) flare, anda third Lorentzian that describes a near-apastron (NA) flare. Table 1 lists the properties of thesemodeled components.
The NA flare is very significant: %2 per degree of freedom, Z2 ~,0~,, is reduced from 5.5 to1.0 with the inclusion of this component; it also occurs with similar significance in both the first andsecond halves of the data. A Gaussian fit to the NA flare is not ruled out: X2 ~,0,~, increases from 1.0to 1.1.
The PP flare is significantly asymmetric. Neither a single Gaussian ( Xz ~,0,~, =4. 5) nor a singleLorentzian component ( X2 ,0,~, == 5. 1) fits. The rise is three times slower than the fall (Table 1 ). ALorentzian component is a somewhat better description of the rise since a Gaussian rise gives X2
d,o,f,
= 1.6. A Gaussian fdl is not ruled out. We can not determine a lower limit for the width of the falldue to the effective temporal resolution of the data.
The phase of the PP flare peak is determined by the peak in the falling component which ismore intense than the rising component. In Table 1 the central phase measurements of thecomponents are in terms of the orbital phase using the Sato et al. elements. The measured PP peakphase is consistent with the result of Sato et al., 0,966+0.007, and is about 130 orbital cycles later.
3.3 GX301-2 Puke PeriodX-ray pulsations are evident in the ASCA data. A narrow peak in the fast-Fourier transform
of the data corresponds to a barycentric period of 675.8 + 0.1 s afler corrections for the GX301 -2orbital period. This value and the 1-u error were calculated by folding the data over the period,fitting a template to a narrow feature in the average pulse, and determining the phase of that narrowfeature as a function of time in pulses across the ASCA data set. The simultaneous BA IW data givesthe same value for the period @oh 1.995). Figure 6 shows the time history of the GX301 -2 pulse(Nagase 1989; Alekandrovich et al. 1994a,b; Lutovinov et al. 1994) with the ASCA point added, thelowest value observed to date. We also did a linear fit to the spin-up region that is shown as astraight line in the figure. The spin-up is -8.3 x 10-* s s-l.
3.4 GX30]-2 PuLse-Phase A veraged SpectrumThe phase-averaged GIS2 spectrum is shown in Figure 7 together with the “simultaneous”
BA XW data, where “simultaneous” means taken over the same day with different operational datagaps. The spectrum is fit by a power law model with low energy absorption, a narrow iron emissionline, an iron absorption edge, and a high-energy cutoff, The low energy absorption is not well-determined herein because we do not extend our analysis below - 4 keV because of the complicatingnature of a soft excess (but see Saraswat et al, 1995) . I’or the absorption we use standard elementalabundances relative to hydrogen except for iron for which we separately fit an absorption edge near7 keV. We obtain a X2 = 124 for 133 degrees of freedom, Table 3 lists the parameters derived fromthis spectrum where the parameter limits are ~ven for 90°A confidence. For the case of the iron linefeatures near 6-7 keV we used the values derived frotn the higher resolution S1S detectors.
5

Many pulsar spectra exhibit high energy cutoffs with cutoff energies, E=, above which thespectrum falls exponentially with a folding energy, Ey (e.g. White et al. 1983). Leahy & Matsuoka(1990) found EC= 18 keV and Ej= 10 keV in GX301-2. Because of the gap in our spectral coveragebetween 10 and 20 keV and our lack of sensitivity above -60 keV we have chosen to keep KY= 10keV fixed in our model--its best-fit value. This results in EC = 26*7 keV, roughly consistent with theprevious results. We also attempted to fit a model like that described inMakishima&Mihara(1992)for a cyclotron feature near 40 keV. The data do not require such a feature; its inclusion leads to anincrease in X2.
We measured the SLSOAISCA iron line energy to be 6.41*0.02 keV, the energy for neutral ironor with an ionization state no higher than Fe XVIIC. The line is narrow, 43 eV < width <74 eV. Theiron edge energy is at 7.19+0.03 keV. The line energy implies that the iron ionization state is less thanXVII, while the edge energy requires an ionization state less than V (Makishima 1986; c.J Leahy etal. 1989). These are consistent with nearly neutral iron. The strength of the iron absorption edgeimplies that iron is more abundant relative to hydrogen by about 50°/0 compared to the standard ratio.
3.5 GX301-2 Pulse-Phase ,Vpectroscoj~ySpectral data were folded over the observed pulse period, divided into five pulse-phase bins,
and analyzed with a model of the form described above. There is variability in the continuumspectrum with pulse phase. Figure 8 shows the pulse intensity profile (bottom panel) and the spectralindex from the fout detectors (upper panels). Table 4 lists the spectral parameters in the differentpulse phase bins. We do not detect any variability in the iron line intensity or energy with pulse phase.
4. DISCUSSION4,1 The Pulse Period
The ASCAZM7SE determination of the GX301-2 pulse period demonstrates that the spin-upthat started in 1984 (-day 6000) continues. This is the longest lasting secular spin-up of the knownpulsars. According to Ghosh & Lamb (1979) this trend indicates that an accretion disk is nowdominating the mass transfer. In contrast, stellar wind domination of the mass transfer caused thestochastic period behavior in the pre-1984 period. It is interesting to note that there has been nolong-term change in the X-ray luminosity ofGX301 -2 despite the change in period behavior. Sinceat least 1973 (Forman et al. 1978) the X-ray intensity has been near 1-2 x 10⁻⁹ erg cm-2 s-], dependingon the energy range of the detectcxs.
The spin-up corresponds to a dPldt P’ = -3.9x 10⁻³ yr‘l. From Ghosh & Lamb dP/dt Fl -7 x 10⁻⁵P L3TW for a “slow rotator” where L37 is the x-ray luminosity in units of 1037 erg s-l. In thisobservation the 4-60 keV intensity is 1.9 x 10⁹ erg cm-2 s-l which corresponds to 7.8 x 1035 erg s-lat a distance of 1.8 kpc (Nagase 1989). Inserting this value into the equation, dP/dt 1>1 = -5.3 x 10⁻³yr-l, close to the measured value. In a recent report (Kaper et al. 1995) WRAY 977 is reclassifiedas a B 1 Ia+ hypergiant and its distance is estimated to be 5.3 kpc. This would increase the X-rayluminosity to 6.8 x 1036 erg S-l and dP/dt Pl = -3.4x 10“2 yr-l, a value that is 10 times larger thanthe observed.
6
. .
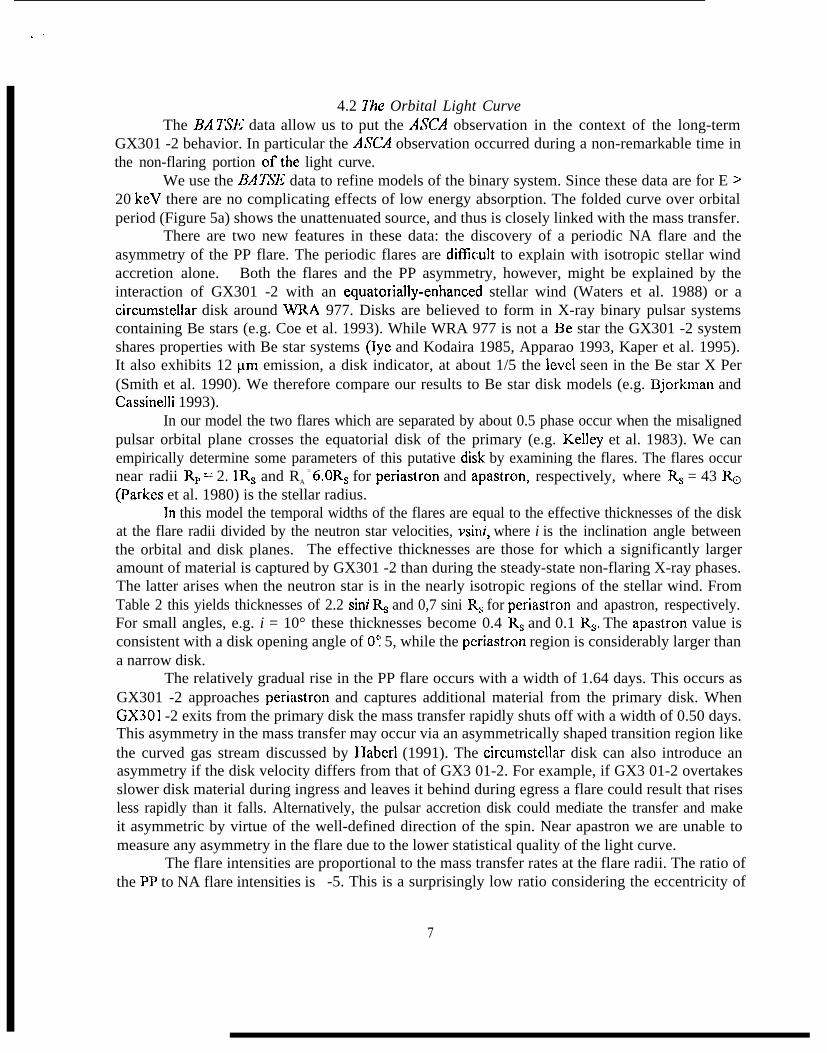
4.2 Zhe Orbital Light CurveThe BA TSE data allow us to put the ASCA observation in the context of the long-term
GX301 -2 behavior. In particular the ASCA observation occurred during a non-remarkable time inthe non-flaring portion of the light curve.
We use the BATSE data to refine models of the binary system. Since these data are for E >20 keV there are no complicating effects of low energy absorption. The folded curve over orbitalperiod (Figure 5a) shows the unattenuated source, and thus is closely linked with the mass transfer.
There are two new features in these data: the discovery of a periodic NA flare and theasymmetry of the PP flare. The periodic flares are difllcuh to explain with isotropic stellar windaccretion alone. Both the flares and the PP asymmetry, however, might be explained by theinteraction of GX301 -2 with an equatorially-enhanced stellar wind (Waters et al. 1988) or acircumstellar disk around WRA 977. Disks are believed to form in X-ray binary pulsar systemscontaining Be stars (e.g. Coe et al. 1993). While WRA 977 is not a Be star the GX301 -2 systemshares properties with Be star systems (Iye and Kodaira 1985, Apparao 1993, Kaper et al. 1995).It also exhibits 12 pm emission, a disk indicator, at about 1/5 the level seen in the Be star X Per(Smith et al. 1990). We therefore compare our results to Be star disk models (e.g. Bjorkman andCassinelli 1993).
In our model the two flares which are separated by about 0.5 phase occur when the misalignedpulsar orbital plane crosses the equatorial disk of the primary (e.g. Kelley et al. 1983). We canempirically determine some parameters of this putative dkk by examining the flares. The flares occurnear radii RP = 2. lR~ and RA
= 6.OR~ for periastron and apastron, respectively, where R~ = 43 ~(Parkes et al. 1980) is the stellar radius.
In this model the temporal widths of the flares are equal to the effective thicknesses of the diskat the flare radii divided by the neutron star velocities, vsini, where i is the inclination angle betweenthe orbital and disk planes. The effective thicknesses are those for which a significantly largeramount of material is captured by GX301 -2 than during the steady-state non-flaring X-ray phases.The latter arises when the neutron star is in the nearly isotropic regions of the stellar wind. FromTable 2 this yields thicknesses of 2.2 sini Rs and 0,7 sini RS for periastron and apastron, respectively.For small angles, e.g. i = 10° these thicknesses become 0.4 R~ and 0.1 R~. The apastron value isconsistent with a disk opening angle of Oc~ 5, while the pcriastron region is considerably larger thana narrow disk.
The relatively gradual rise in the PP flare occurs with a width of 1.64 days. This occurs asGX301 -2 approaches per-iastron and captures additional material from the primary disk. WhenGX301 -2 exits from the primary disk the mass transfer rapidly shuts off with a width of 0.50 days.This asymmetry in the mass transfer may occur via an asymmetrically shaped transition region likethe curved gas stream discussed by Haberl (1991). The circumstellar disk can also introduce anasymmetry if the disk velocity differs from that of GX3 01-2. For example, if GX3 01-2 overtakesslower disk material during ingress and leaves it behind during egress a flare could result that risesless rapidly than it falls. Alternatively, the pulsar accretion disk could mediate the transfer and makeit asymmetric by virtue of the well-defined direction of the spin. Near apastron we are unable tomeasure any asymmetry in the flare due to the lower statistical quality of the light curve.
The flare intensities are proportional to the mass transfer rates at the flare radii. The ratio ofthe PP to NA flare intensities is -5. This is a surprisingly low ratio considering the eccentricity of
7

the orbit. Bjorkman & Cassinelli (1993) find a density ratio of -100 for disk material and -10 forwind material at this pwiastron to apastron ratio. If these density ratios are correct then the materialcapture cross section onto the neutron star favors accretion at apastron.
We can pull together some of the observed phenomena in the following way. We suggest thatthe NA flare has appeared in coincidence with the secular spin-up behavior. This points to a changein the system--the growth or enhancement of a circumstellar disk--that both defines a plane whereboth sets of flares occur and steadily adds angular momentum to the neutron star. During the pre-1984 era of period behavior this disk was so small that only the PP flare occurred, i.e. the disk didnot significantly extend to the apastron radius, and the angular momentum transfer was stochastic.
4.2 The Pulse-Phase-Averaged Broadband X-ray $pectrurnThe pulse-phase-averaged 4-60 keV spectrum measured simultaneously with ASCA and
BA TSE is similar to that seen previously (Leahy & Matsuoka 1990; Aleksandrovich et al. 1994a).Below 4 keV the presence of unrelated sources 3’ and 8’ fi om GX301 -2 indicates that at least someof the previously detected soft excess did not cxiginate in GX301 -2 ( e.g. Haberl 1991; but seeSaraswat et al. 1995). White& Swank (1 984) discuss other properties of the sofl component thatsuggest it originates in a source other than GX301 -2.
The iron line and edge energies are consistent in these observations with neutral or nearlyneutral iron. The line is the result of fluorescence in circumstellar material that is considerably coolerthan the X-ray emission region (e.g. Kallman & McCray 1982). The same material when directly inthe line of sight absorbs X-rays and forms the iron absorption edge. The depth of the edge that wedetect implies that iron is over-abundant relative to hydrogen by about 50V0 when compared to cosmicabundances. We do not observe the inconsistent ionization states bet wecn the line and edge thatLeahy et al. (1989) saw.
4.3 Spectral Variability with Pulse PhaseOur results confirm those of Leahy&Matsuoka(1990) in that the continuum hardens in the
interpulse region. The hardest spectrum is in our second phase bin, Other pulsars (e.g. Her X- 1 ) alsoshow a harder spectrum in the “interPulse” region, This has been associated with a view deeper intothe polar cap along magnetic field lines (R-avdo et al. 1977, Harding et al. 1984).
There was no significant variability in the iron line intensity with pulse phase, This contrastswith Leahy & Matsuoka (1990) in which they saw variability during the PP flare. We checked forbut did not find iron line energy variability with pulse phase.
5. CONCLUSIONSThese observations with ASCA and BA LWGM lead to the following conclusions:
1. The X-ray light curve with orbital phase shows that GX301 -2 interacts twice per orbit with anequatorially-enhanced stellar wind or a circumstellar disk around WRAY 977. This disk may alsoprovide a steady source of angular momentum to the neutron star causing the secular spin-up.2. At least two soft X-ray sources are located within 8’ ofGX301 -2. and probably contributed toprevious observations of a soft X-ray excess.3. The iron line and edge energies are consistent with a single ionizat ion state less than Fe V. Thereis no apparent iron line intensity or energy variation with pulse phase in these data.
8

l “ ’ ”
. .
We thank S. Ryan for providing the GXS optical spectrum and usefi.d comments on the analysisthereof We also thank D. Koh and D. Chakrabaty for sharing the BATSE pulse period data priorto publication. This research has made use of the Simbad database, operated at CDS, Strasbourg,France.
9
. .
I
REFERENCESAleksandrovich, N. L.et al. 1994a, COSPAR in HamburgAleksandrovich, N.L. et al. 1994b, Astr, Letters, 20, 565Apparao, K. M. V. 1994, A Ap, 291, 775Bjorkman, J. E. & Cassinelli, J, P. 1993, Ap J., 409,429Coe, M. J. et al. 1993, A Ap Suppl., 97,245Fishman, G. J. et al. 1989, in Proc. GRO Science Workshop, ed. W. N. Johnson (Greenbelt:
NASA/GSFC), 2-39Forman, W. et al. 1978, Ap J Suppl, 38, 357Ghosh, P. & Lamb, F. K. 1979, Ap J, 234, 296Guide Star Ca/slog, 1989 (Baltimore: Space Telescope Science Jnstitute)Haberl, F. 1991, Ap J, 376, 245Harding, A. K. et al. 1984, Ap J, 278, 369Iye, M. & Kodaira, K. 1985, PASP, 97, 1186Kalhnan, T. & McCray, R. 1982, Ap J Suppl, 50, 263Kelley, R. L, et al. 1983, Ap J, 274,765Koh, D. 1995, private communicationLeahy, D. A. 1991, MN RAS, 250, 310Leahy, D. A. et al. 1989, M N R A S, 237,269Leahy, D. A. & Matsuoka, M. 1990, Ap J, 355, 627Lutovinov, A. A. et al. 1994, Astr. I.etters, 20, 538Makishima, K. 1986, Lecture Notes in Phys., 266, 249Makishimz K. & Mihara, T. 1992, in Frontiers of X-ray As[ronomy, p. 23 (Universal Academy Press
Inc.)Marraco, H.G. & Orsatti, A.M. 1982, Rev Mex A Ap, 5, 183Nagase, F. 1989, P A S J, 41, 1Parkes et al. 1980, MNRAS, 191, 547Pravdo, S. H. et al. 1977, Ap J, 216, L23Ricker, G, R. et al. 1973, Ap J, 184, 237Robinson, R. D. 1990, Ap J Suppl, 74, 891Saraswat, P. et al. 1995, preprintSate, N. et al. 1986, Ap J, 304,241Smith, H. A. et al. 1990, A J, 99, 273Stevens, I. R. 1988, M N R AS, 232, 199Swank, J. H. et al. 1976, Ap J (Letters), 209, L57Tunics, Y. et al. 1994, P A S J, 46, L37Waters, L. B. F. M. et al. 1988, A Ap, 198,200White, N. E. et al. 1976, Ap J, 209, L] 19White, N. E. et al. 1983, Ap J, 270, 711White, N. E. & Swank, J. H. 1984, Ap J, 287, 856
10

1 “
Component
Constant
Prc-pcriaston rise
Pre-periastron fall
Near-apastron
Table 1. GXS Optical Lines
.— ————
Line EquivalentWidth (~)
P’” J-=””8P’rH -k==L“c I 2.02*0.04
Table 2. GX 301-2 Orbital 1.ight Curve
Intensity (photon s-l) Central Phase Width (Days)—~~
‘– –--k=d--
0.023&0.005
0 . 1 4 (+0.05,-0.03)
‘– –--l%-:l”*0 . 3 3 (+..., - 0 . 0 8 )
0.053* (+0.015,-0.022)
Table 3. GX301 -2 Average Spectrum from GIS and 13ATSE
I Photon index I 1.28N.16 IIN. I 5.3+03x 1022 cm”’ I
lRH7-E--Y-I Fcedgc e n e r g y ] 7.19*0.03 keV I
1 0.76*0.05 II Cutoff energy I 26*7 kcV I[ Cutoff folding e ~ 10 keV (fixed) ]— . . — — . ——-. —


. .
Figure lb. GX301-2 field taken with SISO/ASCA.

–62 30 00
–62 35 00
–62 40 00
–62 45 00
–62 3
–62 3
–62 3
1229 40 12 29 00 12 27 20 12 26 40 1 2 2 6 0 0
Figure 2. AX1227-6239 (GXS) finding chart.is a candidate star for AX1226-6249 (SXS).
GX301-2 is to the southwest. Near the edge of the frame to the southeast of GX301-2

-“-k!e
—.—
‘?!!F-t%
.’
.’
— —.
.
~
— —
-
— —.
.
-u--k
..— —
—
—
—
●
m
~—,
Ooc)oooo 0000(300000
Somou)ou) o zsm-c9@30lml~-
-
0#“cCRa

0.5
0.4
0.3
0.2
0.1
0
-0.1
0
, , ! ,
I , I
.
t
iii
i
ASCA
50 100 150 200 250
JD-2449250.5
Figure 4. GX301 -2 BA TSE/GRO 20-60 keV light curve.
300 350

. .
0“25 T—--1 -—l—————l—————Ty
[W SIU) 0 . 2 0 – - — - — -—– - . — - —
(y
E 0.15 –-— -= --–-– .-.-E..o
s 0“ 10 ‘-—-.———.
z& s
s 0 . 0 5 ——-L *.
b–- --—-
‘%ii? : ‘“”0.00 -—
0.00 0.50 1.00 1.50 200
Phase
Figure 5a. GX301 -2 BA TSE light curve folded over the orbitalor flare period (two cycles).
0’25 TT T-—l-l
0.00 -L-———————l— I I-—_ —0.00 0.50 1.03 1.50 2.00
Phase
Figure 5b, Model of folded light curve.

#i
(s) po!ulad
o0007
000CQ
o00m
o00*
o00CN
o000d“d’N
I
n7
2

●
1 . .
l “ ’ ” r f~~Tl--
3F“~-”—l———=—
— —.
-f
—
—
f
—
-.
.—
+ .—. — .—. —.- .-. . 4 ---- .— .-” --------- ------- .-”
*— .,_._. _,. _ ._. —. s. —. —..- .—. -. —.-. .— -—-—-

<. .,
GX301–2: ASCA2 ~1——~——1—————--7
0
#.5
gl
L 0.5
0
&.5
:1
L 0.5
L J
L -+-4-+-+ / .+ -+-++ ++-+-l+++--+ --t-+--t-
L -1
Q
-1.5
L 0.5
l-+——k—++t-l-+-t-t-t-t-t++++
l-- r-L
‘L.J_’__ ‘1tu_LLdA——~——~———~
0.5 1 1.5
Pulse Phase ( two cycles)
Figure 8. Pulse-phase variability of the GX301-2 spectI al index seen with ASCA. The top fourpanels show the spectral index with pulse phase for the four detectors. The bottom panel showsthe pulse intensity profile from the S1S0 detector.