Embed Size (px)
Citation preview

15 The Authoritative Source for Current US Statistics on Cosmetic Surgery
Expanded data for 2011: Multi-year comparisons, 35 Cosmetic Procedures
Multi-specialty Data
The American Society forAesthetic Plastic Surgery
COSMETIC SURGERY NATIONAL DATA BANK STATISTICS
th annual

ASAPS Spokesperson Network
• Thought and opinion leaders in all types of cosmetic procedures, surgical
and nonsurgical are available for interviews and information
• Spokespersons are available nationwide in urban and rural settings
• ASAPS leadership is available for information and interviews in all major
cosmetic surgery markets
• All Aesthetic Society® spokespersons are working clinicians in direct patient care
The Media Center at http://www.surgery.org/media
• Downloadable statistics and full color graphs
• Aesthetic Society® “procedures at a glance”
• Complete library of press releases ranging from 1998 to the most recent
releases are also indexed by subject
• Frequent posting of new information, position statements and news releases
• Automatic email notifi cation of new postings available on request
(please contact [email protected])
Other Resources for the Media
• Before and after patient photos
• Video –B roll, news packages and video news releases
• Invited media attendance at ASAPS Scientifi c Meetings
Contact the Aesthetic Society® Communications Offi ce at 212-921-0500 or
e-mail [email protected] for prompt assistance. If you are a reporter on deadline
and working after hours, please call our California Offi ce at 800-364-2147.
1
2
3
4
5
6
7
8
9
10
12
13
14
16
17
Introduction to Aesthetic Society® Statistics
Plastic Surgery Timelines
2011 Statistics Quick Facts
Top 5 Procedures: Surgical & Nonsurgical
National Totals
Surgical Procedures: Fifteen-Year Comparisons
Percent Change: 1997–2011
Top Procedures by Gender
Gender Distribution
Age Distribution
National Average Fees
Economic, Regional and Ethnic Information
Procedure Quick Facts
RealSelf’s Worth It Ratings
ASAPS Quick Facts
Table of contents
Please credit the American Society for Aesthetic Plastic Surgery when citing statistical data. Contact: ASAPS Communications • 212.921.0500 • [email protected] • www.surgery.org • fax: 212.921.0011
Resources for the Media

he American Society for Aesthetic Plastic Surgery (ASAPS) was
founded in 1967 when cosmetic surgery was only beginning to
be recognized as the important subspecialty it is today.
Founded on a mission of education, we are now widely recognized as the
leader in cosmetic surgery research, education, and procedural advances.
United States membership to the Aesthetic Society® is restricted to American
Board of Plastic Surgery certifi ed physicians who meet a minimum number of
surgical procedures performed and commit to a signifi cant number of continuing
medical education hours. New members must be sponsored by a current
Society member.
Other health care providers may also provide some of these services, therefore
cosmetic procedures surgical and nonsurgical are performed by a variety of
physicians. For that reason, we rely on physicians from many different specialties
when we compile our annual statistics. We thank these clinicians for their
contributions to our survey.
ASAPS, working with an independent research fi rm, compiled the 15-year national data for procedures performed 1997-2011. A paper-based questionnaire was mailed to 22,700 Board-Certifi ed physicians (8,900 Dermatologists, 8,100 Otolaryngologists, and 5,700 Plastic Surgeons). A second request was mailed to 4,000 Dermatologists and 4,000 Otolaryngologists. An online version of the questionnaire was also available. A total of 1,107 physicians returned questionnaires, of which 92 were retired or otherwise inactive during 2011. Of the 1,015 active respondents, the sample consisted of 420 Plastic Surgeons, 384 Dermatologists, and 211 Otolaryngologists.
Final fi gures have been projected to refl ect nationwide statistics and are based exclusively on the Board-Certifi ed Plastic Surgeons; Otolaryngologists; and Dermatologists. The fi ndings have been aggregated and extrapolated to the known population of 24,650 active physicians who are Board Certifi ed in these specialties. Though the confi dence intervals change by procedure, depending on the grouping’s sample size and the response variance, the overall survey portion of this research has a standard error of +/- 3.01% at a 95% level of confi dence.
The Survey on Cosmetic Procedures Performed in 2011 was compiled, tabulated and analyzed by Industry Insights Inc. (www.industryinsights.com), an independent research fi rm based in Columbus, OH.
Please credit the American Society for Aesthetic Plastic Surgery when citing statistical data. Contact: ASAPS Communications • 212.921.0500 • [email protected] • www.surgery.org • fax: 212.921.0011
For additional information on survey methodology, click here.
about the aesthetic Society
T
1
about the aSaPS cosmeticSurgery National Data Bank

Source: American Society for Aesthetic Plastic SurgerySource: American Society for Aesthetic Plastic Surgery Source: American Society for Aesthetic Plastic Surgery
Surgical Cosmetic Procedures
Nonsurgical Cosmetic Procedures
Plastic Surgery Timelines
Surgical and Nonsurgical Cosmetic Procedures: Totals
9,194,510
2011
9,183,176
2010
1,679,943
1997
10
8
6
4
2
740,751
7,558,856 7,555,986
939,192
1997 1997
1,624,320
2010 2010
1,638,524
2011 2011
1.5
1.25
1.0
.75
.50
8
6
4
2
2
Please credit the American Society for Aesthetic Plastic Surgery when citing statistical data. Contact: ASAPS Communications • 212.921.0500 • [email protected] • www.surgery.org • fax: 212.921.0011

u There were over 9 million surgical and nonsurgical cosmetic procedures performed in the United States in 2011. Surgical procedures accounted for 18% of the total number of procedures and 63% of the total expenditures, with nonsurgical procedures making up 82% of the total number of procedures and 37% of total expenditures.
uFrom 2010-2011, there was almost a 1% increase in the total number of cosmetic surgical procedures, with over 1.6 million surgical procedures performed this past year.
uFrom 2010-2011, there was almost a 13% increase in the total number of liposuction procedures with over 300,000 procedures performed. For the first time in three years lipoplasty has surpassed breast augmentation as the most popular cosmetic surgical procedure in the United States. Until 2008 liposuction had been the most popular cosmetic surgery procedure, but from 2008-2010 breast augmentation held that title.
uSince 1997, there has been over 197% increase in the total number of cosmetic procedures. Surgical procedures increased by more than 73%, and nonsurgical procedures increased by 356%.
uThe top five cosmetic surgical procedures in 2011 were: liposuction (325,332 procedures); breast augmentation (316,848 procedures); abdominoplasty (149,410 procedures); blepharoplasty (147,540 procedures); breast lift (127,054 procedures).
uThe top five nonsurgical cosmetic procedures in 2011 were: Botulinum Toxin Type A (2,619,739 procedures); hyaluronic acid (1,206,186 procedures); laser hair removal (919,802 procedures); microdermabrasion (499,427 procedures); IPL laser treatment (439,161 procedures).
uFor the first time ever this survey asked the doctors for the total number of non-surgical procedures being performed in their practices by BOTH physicians and their physician assistants and nurse injectors. Below is the TOTAL number of procedures performed: Botulinum Toxin Type A (4,030,318); Hyaluronic Acid (1,662,480); Laser Hair Removal (1,452,880); Microdermabrasion (794,357); and IPL Laser Treatment: 726,125.
uWomen had almost 8.4 million cosmetic procedures, 91% of the total. The number of cosmetic procedures for women increased over 208% from 1997.
uThe top five surgical procedures for women were: breast augmentation, liposuction, tummy tuck, breast lift, and eyelid surgery.
uMen had almost 800,000 cosmetic procedures, 9% of the total. The number of cosmetic procedures for men increased over 121% from 1997.
uThe top five surgical procedures for men were: liposuction, rhinoplasty, eyelid surgery, breast reduction to treat enlarged male breast, and facelift.
uAmericans spent nearly $10 billion on cosmetic procedures in 2011. Of that total $6.2 billion was spent on surgical procedures; $1.7 billion was spent on injectable procedures; $1.6 billion was spent on skin rejuvenation procedures; and over $360 million was spent on other nonsurgical procedures, including laser hair removal and laser treatment of leg veins.
uPeople age 35-50 had the most procedures – almost 4 million and 43% of the total. People age 19-34 had 20% of procedures; age 51-64 had 28%; age 65 and over had 8 %; and age 18 and younger had 1.4%.
uThe most common procedures for age 35-50 were: Botulinum Toxin Type A, Hyaluronic Acid, laser hair removal, IPL Laser Treatment, and Microdermabrasion.
uRacial and ethnic minorities, as of last year, had approximately 21% of all cosmetic procedures: Hispanics, 8%; African-Americans, 7%; Asians, 5%; and other non-Caucasians, 1%.
uWhere cosmetic surgeries were performed: office facility, 60%; free-standing surgicenter, 22%; and hospital, 18%.
Figures may not add exactly to totals
and percentages may not equal 100%
due to rounding.
Quick FacTS:Highlights of the aSaPS 2011 Statistics on cosmetic Surgery:
3
Please credit the American Society for Aesthetic Plastic Surgery when citing statistical data. Contact: ASAPS Communications • 212.921.0500 • [email protected] • www.surgery.org • fax: 212.921.0011

Top 5 Surgical Procedures in 2011
Top 5 Nonsurgical Procedures in 2011
Lipoplasty (liposuction)
Breast Augmentation
Abdominoplasty(tummy tuck)
Blepharoplasty(cosmetic eyelid surgery)
Breast Lift
Botulinum Toxin Type A (including Botox and Dysport)
Hyaluronic Acid(including Hylaform, Juvederm, Perlane/Restylane)
Laser Hair Removal
Microdermabrasion
IPL Laser Treatment
Source: American Society for Aesthetic Plastic Surgery
Source: American Society for Aesthetic Plastic Surgery
50 100 150 200 250 300
.5 1 1.5 2 2.5 3
325,332
2,619,739
316,848
1,206,186
149,410
919,802
147,540
499,427
127,054
439,161
uIn 2006 the FDA announced their
decision to reintroduce silicone gel
breast implants to the market.
uSince 2000 Botox has been the
most popular cosmetic nonsurgical
procedure. Botox gained FDA approval
for cosmetic use in 2002.
uHyaluronic Acid injectables (including
Hyalform, Juvederm, Perlane/
Restylane) have quickly been gaining
in popularity. ASAPS added Hyaluronic
Acid to the survey in 2004, and in
2011 these procedures are only 2nd in
popularity to Botox.
uFor the fi rst time ever this survey asked
the doctors for the total number of non-
surgical procedures being performed
in their practices by BOTH physicians
and their physician assistants and
nurse injectors. Below is the TOTAL
number of procedures performed:
1. Botulinum Toxin Type A: 4,030,318
2. Hyaluronic Acid: 1,662,480
3. Laser Hair Removal: 1,452,880
4. Microdermabrasion: 794,357
5. IPL Laser Treatment: 726,125
Quick FactsTOP 5 PROcEDuRES: Surgical & Nonsurgical
4
Please credit the American Society for Aesthetic Plastic Surgery when citing statistical data. Contact: ASAPS Communications • 212.921.0500 • [email protected] • www.surgery.org • fax: 212.921.0011

ProcedureNumber of Procedures
Rank within Category (Surgical/Nonsurgical)
Rank in 2006
Rank in 2001
Abdominoplasty (tummy tuck) 149,410C 3 4 8Autologous fat 69,877 9 na naBlepharoplasty (cosmetic eyelid surgery) 147,540D 4 3 2Breast augmentation* 316,848B 2 2 3Breast lift 127,054E 5 8 10Breast reduction (women)** 112,964 8 5 6Buttock augmentation 7,382 18 19 naButtock lift 3,762 19 18 19Chin augmentation 11,171 15 14 12Facelift 116,086 7 7 5Forehead lift 28,200 10 10 7Gynecomastia, treatment of (male breast reduction) 17,645 13 11 14Lip augmentation (other than injectable materials) 8,459 17 17 11Lipoplasty (liposuction) *** 325,332A 1 1 1Lower body lift 9,175 16 16 17Otoplasty (cosmetic ear surgery) 26,783 11 12 13Rhinoplasty (nose reshaping) 126,107 6 6 4Thigh lift 13,878 14 13 15Upper arm lift 18,709 12 15 16Vaginal Rejuvenation 2,142 20 na naTotals - Surgical Procedures 1,638,524Injectables: Botulinum Toxin Type A (including Botox and Dysport) 2,619,7391 1 Calcium hydroxylapatite (Radiesse) 174,593 10 Hyaluronic Acid (including Hylaform, Juvederm, Perlane/Restylane) 1,206,1862 2 Poly-L-Latic Acid (Sculptra) 60,924 13 Totals - Injectables 4,061,442Skin Rejuvenation: Chemical Peel 384,222 6 Dermabrasion 25,129 15 Fraxel 100,433 11 IPL Laser Treatment 439,1615 5 Laser Skin Resurfacing**** 345,587 8 Microdermabrasion 499,4274 4 Noninvasive Tightening 297,795 9 Totals - Skin Rejuvenation 2,091,754Other: Laser Hair Removal 919,8023 3 Tattoo Laser Treatment 40,801 14 Laser Treatment of Leg Veins 87,456 12 Sclerotherapy 354,731 7 Totals - Other Nonsurgical Procedures 1,402,790Totals - Nonsurgical Procedures 7,55,986TOTALS ALL PROCEDURES 9,194,510
Non
surg
ical
Su
rgic
al
* 31.0% of these procedures used saline implants and 69.0% used silicone implants.
** Breast reduction may be covered by insurance, depending on terms of the policy and individual patient factors.
*** 37.0% of the fractional resurfacing procedures were performed with ablative lasers and 63.0% were performed with nonablative lasers.
**** 51.0% of the laser skin resurfacing procedures were performed with ablative lasers and 49.0% were performed with nonablative lasers.
Hair transplantation was excluded from the results, due to an insuffi cient sample of physicians who perform the procedure.
na = Rankings for this procedure in prior years is not available. Prior year rankings have been adjusted for equal comparison.
2011 National Totals for cosmetic Procedures
Please credit the American Society for Aesthetic Plastic Surgery when citing statistical data. Contact: ASAPS Communications • 212.921.0500 • [email protected] • www.surgery.org • fax: 212.921.0011
5
Notes
The following list includes both surgical and nonsurgical cosmetic procedures. The top 5 surgical procedures are indicated in bold superscript letters in the column headed Number of Procedures, while the top 5 nonsurgical procedures are indicated by bold superscript numbers.
* 31% of these procedures used saline implants and 69% used silicone implants.**Breast reduction may be covered by insurance, depending on terms of the policy and individual patient factors.***37% of these procedures were ablative and 63% were nonablative.****51% of these procedures were ablative and 49% were nonablative.Hair transplantation was excluded from the results, due to an insuffi cient sample of physicians who perform the procedure.

uFor the fi rst time in three years lipoplasty
has surpassed Breast augmentation
as the most popular cosmetic surgical
procedure in the United States. Until
2008 liposuction had been the most
popular cosmetic surgery procedure, but
from 2008-2010 breast augmentation
held that title.
uIn the past 15 years, there was almost a 340% increase in the number of tummy tucks performed in the United States.
uFrom 1997 – 2011, there was almost a 540% increase in the number of breast lift procedures.
Please credit the American Society for Aesthetic Plastic Surgery when citing statistical data. Contact: ASAPS Communications • 212.921.0500 • [email protected] • www.surgery.org • fax: 212.921.0011
6
NotesSurgical and Nonsurgical Procedures: 15-Year comparison, 1997-2011
For additional information on survey methodology, click here.
Source: American Society for Aesthetic Plastic Surgery
50 100 150 200 250 300 350
101,176
316,848
176,863
325,332
159,232
147,540
34,002
149,410
19,882
127,054
1997
2011
Lipoplasty (liposuction)
Breast Augmentation
Blepharoplasty(cosmetic eyelid surgery)
Abdominoplasty(tummy tuck)
Breast Lift (women)
Procedure 2011 2010 1997Percent Change
2011 vs 2010 Percent Change
2011 vs 1997
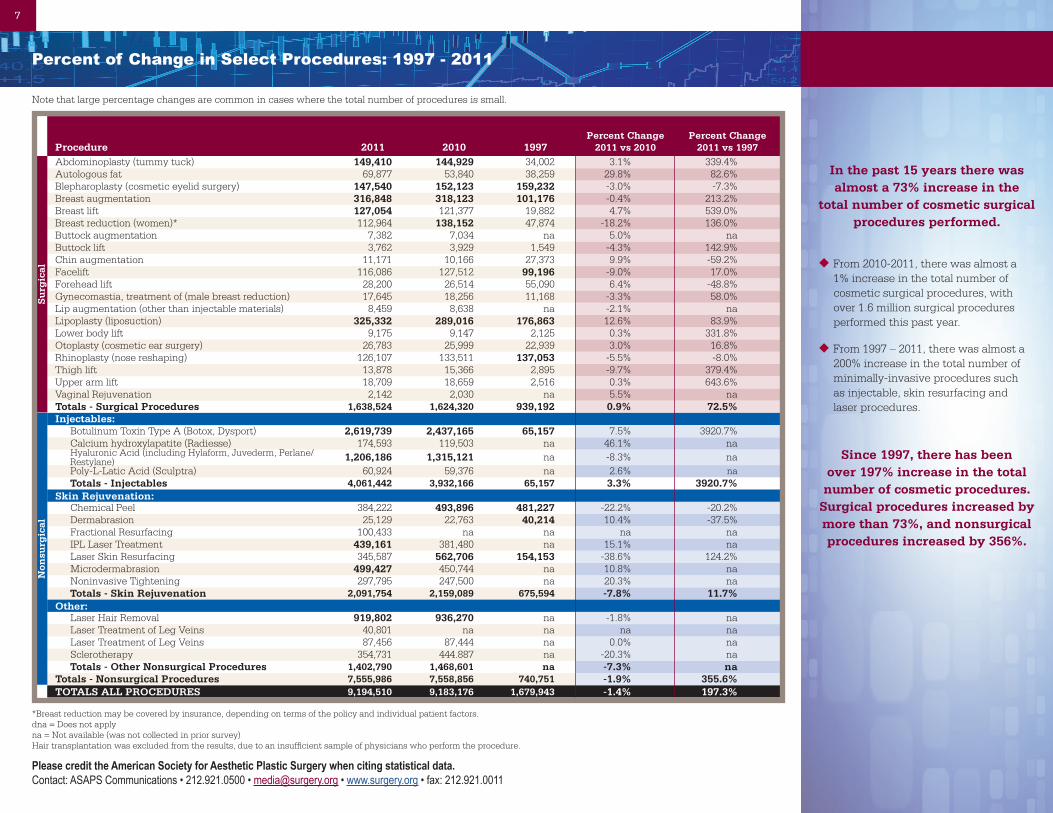
Abdominoplasty (tummy tuck) 149,410 144,929 34,002 3.1% 339.4%Autologous fat 69,877 53,840 38,259 29.8% 82.6%Blepharoplasty (cosmetic eyelid surgery) 147,540 152,123 159,232 -3.0% -7.3%Breast augmentation 316,848 318,123 101,176 -0.4% 213.2%Breast lift 127,054 121,377 19,882 4.7% 539.0%Breast reduction (women)* 112,964 138,152 47,874 -18.2% 136.0%Buttock augmentation 7,382 7,034 na 5.0% naButtock lift 3,762 3,929 1,549 -4.3% 142.9%Chin augmentation 11,171 10,166 27,373 9.9% -59.2%Facelift 116,086 127,512 99,196 -9.0% 17.0%Forehead lift 28,200 26,514 55,090 6.4% -48.8%Gynecomastia, treatment of (male breast reduction) 17,645 18,256 11,168 -3.3% 58.0%Lip augmentation (other than injectable materials) 8,459 8,638 na -2.1% naLipoplasty (liposuction) 325,332 289,016 176,863 12.6% 83.9%Lower body lift 9,175 9,147 2,125 0.3% 331.8%Otoplasty (cosmetic ear surgery) 26,783 25,999 22,939 3.0% 16.8%Rhinoplasty (nose reshaping) 126,107 133,511 137,053 -5.5% -8.0%Thigh lift 13,878 15,366 2,895 -9.7% 379.4%Upper arm lift 18,709 18,659 2,516 0.3% 643.6%Vaginal Rejuvenation 2,142 2,030 na 5.5% naTotals - Surgical Procedures 1,638,524 1,624,320 939,192 0.9% 72.5%Injectables: Botulinum Toxin Type A (Botox, Dysport) 2,619,739 2,437,165 65,157 7.5% 3920.7% Calcium hydroxylapatite (Radiesse) 174,593 119,503 na 46.1% na Hyaluronic Acid (including Hylaform, Juvederm, Perlane/ ......Restylane) 1,206,186 1,315,121 na -8.3% na Poly-L-Latic Acid (Sculptra) 60,924 59,376 na 2.6% na Totals - Injectables 4,061,442 3,932,166 65,157 3.3% 3920.7%Skin Rejuvenation: Chemical Peel 384,222 493,896 481,227 -22.2% -20.2% Dermabrasion 25,129 22,763 40,214 10.4% -37.5% Fractional Resurfacing 100,433 na na na na IPL Laser Treatment 439,161 381,480 na 15.1% na Laser Skin Resurfacing 345,587 562,706 154,153 -38.6% 124.2% Microdermabrasion 499,427 450,744 na 10.8% na Noninvasive Tightening 297,795 247,500 na 20.3% na Totals - Skin Rejuvenation 2,091,754 2,159,089 675,594 -7.8% 11.7%Other: Laser Hair Removal 919,802 936,270 na -1.8% na Laser Treatment of Leg Veins 40,801 na na na na Laser Treatment of Leg Veins 87,456 87,444 na 0.0% na Sclerotherapy 354,731 444.887 na -20.3% na Totals - Other Nonsurgical Procedures 1,402,790 1,468,601 na -7.3% naTotals - Nonsurgical Procedures 7,555,986 7,558,856 740,751 -1.9% 355.6%TOTALS ALL PROCEDURES 9,194,510 9,183,176 1,679,943 -1.4% 197.3%
Non
surg
ical
Su
rgic
al
7
Percent of change in Select Procedures: 1997 - 2011
Note that large percentage changes are common in cases where the total number of procedures is small.
*Breast reduction may be covered by insurance, depending on terms of the policy and individual patient factors.dna = Does not apply na = Not available (was not collected in prior survey)Hair transplantation was excluded from the results, due to an insuffi cient sample of physicians who perform the procedure.
In the past 15 years there was almost a 73% increase in the
total number of cosmetic surgical procedures performed.
uFrom 2010-2011, there was almost a 1% increase in the total number of cosmetic surgical procedures, with over 1.6 million surgical procedures performed this past year.
uFrom 1997 – 2011, there was almost a 200% increase in the total number of minimally-invasive procedures such as injectable, skin resurfacing and laser procedures.
Since 1997, there has been over 197% increase in the total number of cosmetic procedures.
Surgical procedures increased by more than 73%, and nonsurgical procedures increased by 356%.
Please credit the American Society for Aesthetic Plastic Surgery when citing statistical data. Contact: ASAPS Communications • 212.921.0500 • [email protected] • www.surgery.org • fax: 212.921.0011

uWomen had almost 8.4 million cosmetic procedures, 91% of the total
uThe number of cosmetic procedures for women increased over 208% from 1997
uMen had almost 800,000 cosmetic procedures, 9% of the total
uThe number of cosmetic procedures for men increased over 121% from 1997
8
Top 5 cosmetic Surgeries by Gender
Top 5 Cosmetic Surgeries for Women in 2011
Top 5 Cosmetic Surgeries for Men in 2011
Breast Augmentation
Lipoplasty (liposuction)
Abdominoplasty(tummy tuck)
Blepharoplasty(cosmetic eyelid surgery)
Breast Lift
Lipoplasty (liposuction)
Rhinoplasty
Blepharoplasty(cosmetic eyelid surgery)
Gynecomastia
Facelift
Source: American Society for Aesthetic Plastic Surgery
Source: American Society for Aesthetic Plastic Surgery
50 100 150 200 250 300
.5 1 1.5 2 2.5 3
316,848
41,663
283,669
24,533
142,657
22,905
124,635
17,645
127,054
10,400
Please credit the American Society for Aesthetic Plastic Surgery when citing statistical data. Contact: ASAPS Communications • 212.921.0500 • [email protected] • www.surgery.org • fax: 212.921.0011

2011 Gender Distribution for cosmetic Procedures
Please credit the American Society for Aesthetic Plastic Surgery when citing statistical data. Contact: ASAPS Communications • 212.921.0500 • [email protected] • www.surgery.org • fax: 212.921.0011
9
FEMALE MALE
ProcedureNumber
of ProceduresPercent of
Total
Rank within Category
(Surgical/Nonsurgical)Number
of ProceduresPercent of
Total
Rank within Category
(Surgical/Nonsurgical)Abdominoplasty (tummy tuck) 142,657 95.5% 3 6,753 4.5% 7Autologous fat 66,395 95.0% 9 3,482 5.0% 8Blepharoplasty (cosmetic eyelid surgery) 124,635 84.5% 5 22,905 15.5% 3Breast augmentation 316,848 100.0% 1 dna dna dnaBreast lift 127,054 100.0% 4 dna dna dnaBreast reduction (women)* 112,964 100.0% 6 dna dna dnaButtock augmentation 7,240 98.1% 17 142 1.9% 16Buttock lift 3,442 91.5% 18 320 8.5% 13Chin augmentation 8,605 77.0% 14 2,566 23.0% 10Facelift 105,686 91.0% 7 10,400 9.0% 5Forehead lift 25,037 88.8% 10 3,163 11.2% 9Gynecomastia, treatment of (male breast reduction) dna dna dna 17,645 100.0% 4Lip augmentation (other than injectable materials) 8,285 97.9% 15 174 2.1% 15Lipoplasty (liposuction) 283,669 87.2% 2 41,663 12.8% 1Lower body lift 8,113 88.4% 16 1,062 11.6% 11Otoplasty (cosmetic ear surgery) 17,474 65.2% 12 9,309 34.8% 6Rhinoplasty (nose reshaping) 101,574 80.5% 8 24,533 19.5% 2Thigh lift 13,373 96.4% 13 505 3.6% 12Upper arm lift 18,423 98.5% 11 286 1.5% 14Vaginal Rejuvenation 2,142 100.00% 19 dna dna dna Totals - Surgical Procedures 1,493,615 91.2% 144,909 8.8%Injectables: Botulinum Toxin Type A (Botox, Dysport) 2,355,455 89.9% 1 264,284 10.1% 1 Calcium hydroxylapatite (Radiesse) 158,000 90.5% 10 16,593 9.5% 9 Hyaluronic Acid (including Hylaform, Juvederm, Perlane/Restylane) 1,127,224 93.5% 2 78,962 6.5% 3 Poly-L-Latic Acid (Sculptra) 51,122 83.9% 13 9,802 16.1% 11 Totals - Injectables 3,691,802 90.9% 369,640 9.1%Skin Rejuvenation: Chemical Peel 360,313 93.8% 6 23,909 6.2% 7 Dermabrasion 21,600 86.0% 15 3,529 14.0% 14 Fractional Resurfacing 92,719 92.3% 11 7,7,14 7.7% 12 IPL Laser Treatment 396,866 90.4% 5 42,295 9.6% 4 Laser Skin Resurfacing 319,810 92.5% 8 25,777 7.5% 6 Microdermabrasion 468,466 93.8% 4 30,961 6.2% 5 Noninvasive Tightening 279,549 93.9% 9 18,246 6.1% 8 Totals - Skin Rejuvenation 1,939,322 92.7% 152,432 7.3%Other: Laser Hair Removal 812,352 88.3% 3 107,450 11.7% 2 Tattoo Laser Treatment 27,283 66.9% 14 13,518 33.1% 10 Laser Treatment of Leg Veins 85,550 97.8% 12 1,906 2.2% 15 Sclerotherapy 348,501 98.2% 7 6,230 1.8% 13 Totals - Other Nonsurgical Procedures 1,273,686 90.8% 129,104 9.2%Totals - Nonsurgical Procedures 6,904,810 91.4% 651,176 8.6%TOTALS ALL PROCEDURES 8,398,424 91.3% 796,086 8.7%
Non
surg
ical
Su
rgic
al
The following list includes both surgical and nonsurgical cosmetic procedures. The rankings of procedures within their surgical and nonsurgical categories are indicated in the column Rank within each Category.
*Breast reduction may be covered by insurance, depending on terms of the policy and individual patient factors.DNA = Does not applyHair transplantation was excluded from the results, due to an insufficient sample of physicians who perform the procedure.

2011 age Distribution for cosmetic Procedures
Please credit the American Society for Aesthetic Plastic Surgery when citing statistical data. Contact: ASAPS Communications • 212.921.0500 • [email protected] • www.surgery.org • fax: 212.921.0011
10
The top 3 surgical and nonsurgical procedures in each age category are indicated in bold and with bold superscript letters (surgical) and numbers (nonsurgical).
*Breast reduction may be covered by insurance, depending on terms of the policy and individual patient factors.Hair transplantation was excluded from the results, due to an insufficient sample of physicians who perform the procedure.
18 and Under 19-34 35-50 51-64 65+
Procedure
Number of
Procedures
Percent of Procedural
Total
Number of
Procedures
Percent of Procedural
Total
Number of
Procedures
Percent of Procedural
Total
Number of
Procedures
Percent of Procedural
Total
Number of
Procedures
Percent of Procedural
TotalAbdominoplasty (tummy tuck) 233 0.2% 30,115 20.2% 84,756C 56.7% 28,951 19.4% 5,355 3.6%Autologous fat 303 0.4% 8,328 11.9% 28,238 40.4% 24,832 35.5% 8,176 11.7%Blepharoplasty (cosmetic eyelid surgery) 0 0.0% 4,363 3.0% 47,338 32.1% 71,043A 48.2% 24,796B 16.8%Breast augmentation 4,830C 1.5% 155,256A 49.0% 125,710B 39.7% 27,852 8.8% 3,199 1.0%Breast lift 605 0.5% 31,064 24.4% 68,251 53.7% 23,506 18.5% 3,628 2.9%Breast reduction (women)* 2,944 2.6% 33,467 29.6% 47,993 42.5% 24,438 21.6% 4,122 3.6%Buttock augmentation 0 0.0% 2,768 37.5% 3,833 51.9% 710 9.6% 71 1.0%Buttock lift 0 0.0% 880 23.4% 2,001 53.2% 800 21.3% 80 2.1%Chin augmentation 75 0.7% 4,151 37.2% 3,699 33.1% 2,793 25.0% 453 4.1%Facelift 0 0.0% 656 0.6% 18,364 15.8% 68,865B 59.3% 28,202A 24.3%Forehead lift 0 0.0% 471 1.7% 7,067 25.1% 15,682 55.6% 4,980 17.7%Gynecomastia, treatment of (male breast reduction) 1,363 7.7% 9,693 54.9% 4,998 28.3% 1,363 7.7% 227 1.3%Lip augmentation (other than injectable materials) 0 0.0% 2,093 24.7% 3,314 39.2% 2,529 29.9% 523 6.2%Lipoplasty (liposuction) 3,515 1.1% 96,099B 29.5% 152,507A 46.9% 61,895C 19.0% 11,316C 3.5%Lower body lift 0 0.0% 1,545 16.8% 5,408 58.9% 2,028 22.1% 193 2.1%Otoplasty (cosmetic ear surgery) 11,268A 42.1% 9,472 35.4% 4,083 15.2% 1,796 6.7% 163 0.6%Rhinoplasty (nose reshaping) 9,469B 7.5% 60,973C 48.4% 40,601 32.2% 12,625 10.0% 2,439 1.9%Thigh lift 0 0.0% 1,766 12.7% 7,570 54.5% 3,911 28.2% 631 4.5%Upper arm lift 0 0.0% 2,195 11.7% 8,782 46.9% 6,586 35.2% 1,145 6.1%Vaginal Rejuvenation 58 2.7% 1,042 48.6% 868 40.5% 174 8.1% 0 0.0%Totals - Surgical Procedures 34,663 2.1% 456,400 27.9% 665,381 40.6% 382,378 23.3% 99,701 6.1%Injectables: Botulinum Toxin Type A (Botox, Dysport) 6,160 0.2% 375,1621 14.3% 1,257,9251 48.0% 762,1711 29.1% 218,3211 8.3% Calcium hydroxylapatite (Radiance) 0 0.0% 15,694 9.0% 73,483 42.1% 63,838 36.6% 21,579 12.4% Hyaluronic Acid (Hylaform, Juvederm, Perlane/Restylane) 2,190 0.2% 153,5443 12.7% 508,3942 42.1% 404,1152 33.5% 137,9442 11.4% Poly-L-Latic Acid (Sculptra) 0 0.0% 2,366 3.9% 25,096 41.2% 25,519 41.9% 7,943 13.0% Totals - Injectables 8,349 0.2% 546,766 13.5% 1,864,897 45.9% 1,255,642 30.9% 385,787 9.5%Skin Rejuvenation: Chemical Peel 8,5293 2.2% 63,478 16.5% 141,916 36.9% 123,180 32.1% 47,119 12.3% Dermabrasion 424 1.7% 2,965 11.8% 6,918 27.5% 10,023 39.9% 4,800 19.1% Fractional Rejuvenation 449 0.4% 10,710 10.7% 41,791 41.6% 36,174 36.0% 11,309 11.3% IPL Laser Treatment 5,747 1.3% 84,001 19.1% 191,433 43.6% 121,580 27.7% 36,400 8.3% Laser Skin Resurfacing 874 0.3% 34,515 10.0% 134,565 38.9% 118,836 34.4% 56,7973 16.4% Microdermabrasion 22,8642 4.6% 137,420 27.5% 187,077 37.5% 115,747 23.2% 36,320 7.3% Noninvasive Tightening 1,721 0.6% 20,312 6.8% 125,315 42.1% 118,774 39.9% 31,673 10.6% Totals - Skin Rejuvenation 40,608 1.9% 353,400 16.9% 829,014 39.6% 644,315 30.8% 224,418 10.7%Other: Laser Hair Removal 44,5601 4.8% 346,8422 37.7% 369,1223 40.1% 133,6803 14.5% 25,598 2.8% Tatoo Laser Treatment 2,540 6.2% 24,825 60.8% 10,333 25.3% 2,704 6.6% 410 1.0% Laser Treatment of Leg Veins 424 0.5% 13,976 16.0% 41,293 47.2% 26,681 30.5% 5,082 5.8% Sclerotherapy 733 0.2% 52,403 14.8% 167,105 47.1% 113,968 32.1% 20,522 5.8% Totals - Other Nonsurgical Procedures 48,256 3.4% 438,046 31.2% 587,842 41.9% 277,034 19.7% 51,612 3.7%Totals - Nonsurgical Procedures 97,214 1.3% 1,338,212 17.7% 3,281,754 43.4% 2,176,990 28.8% 661,817 8.8%TOTALS ALL PROCEDURES 131,877 1.4% 1,794,612 19.5% 3,947,135 42.9% 2,559,368 27.8% 761,518 8.3%
Non
surg
ical
Su
rgic
al

2011 age Distribution for cosmetic Procedures
Please credit the American Society for Aesthetic Plastic Surgery when citing statistical data. Contact: ASAPS Communications • 212.921.0500 • [email protected] • www.surgery.org • fax: 212.921.0011
11
Source: American Society for Aesthetic Plastic Surgery
44% Purely cosmetic bilateral breast augmentation**
17% Severe asymmetry
9% Congenital micromastia (severe underdevelopment)
22% Tubular breast deformity
5% Poland’s syndrome (congenital absent breast)
4% Other
*In 2011, there were 4,830 procedures performed on women
18 and under, less than 2% of the total number of breast
augmentations.
**The FDA recommends that cosmetic breast augmentation
be restricted to women age 18 and above.
Breast Augmentation Procedures Performed
in Women 18 and Under* According to
Reason for Surgery
Source: American Society for Aesthetic Plastic Surgery
1.5% Ages 18 and under
49.0% Ages 19-34
40.0% Ages 35-50
9.0% Ages 51-64
1.0% Ages 65+
Total population (rounded) = 100%
Source: American Society for Aesthetic Plastic Surgery
1.4% Ages 18 and under
19.5% Ages 19-34
42.9% Ages 35-50
27.8% Ages 51-64
8.3% Ages 65+
Total population (rounded) = 100%
Breast Augmentation Procedures
by Age:
Percent of Total All Surgical and
Non Surgical Procedures by Age

Source: The American Society for Aesthetic Plastic Surgery for statistical data.
* Breast reduction may be covered by insurance, depending on terms of the policy and individual patient factors. Fees may vary.
** Figures are for physician/surgeon fees only and do not include fees for the surgical facility, anesthesia, medical tests, prescriptions, surgical garments, or other miscellaneous costs related to surgery. Figures for procedures often performed on more than one site in the same session refl ect typical fees forone site
“Americans spent nearly $10 billion on cosmetic
procedures in 2011; of that, approximately 63% was on
surgical procedures, 17% was on injectables, 16% was on skin
rejuvenation, and 4% was on other treatment options.”
2011 National average for Physician/Surgeon Fees Per Procedure
Please credit the American Society for Aesthetic Plastic Surgery when citing statistical data. Contact: ASAPS Communications • 212.921.0500 • [email protected] • www.surgery.org • fax: 212.921.0011
12
Procedure National Average Total ExpendituresAbdominoplasty (tummy tuck) $5,278 $788,575,521Autologous fat grafting $1,781 $124,475,394Blepharoplasty (cosmetic eyelid surgery) $2,630 $388,006,594Breast augmentation - silicone gel implants $3,694 $807,620,426Breast augmentation - saline implants $3,308 $324,914,808Breast lift $4,233 $537,764,949Breast reduction (women)* $5,317 $600,643,144Buttock augmentation $3,878 $28,630,792Buttock lift $4,498 $16,920,799Chin augmentation $2,259 $25,235,066Facelift $6,408 $743,889,536Forehead lift $3,099 $87,394,620Gynecomastia, treatment of (male breast reduction) $3,277 $57,826,547Lip augmentation (other than injectable materials) $1,827 $15,457,977Lipoplasty $2,773 $902,031,770Lower body lift $7,311 $67,081,269Otoplasty (cosmetic ear surgery) $2,987 $79,990,108Rhinoplasty (nose reshaping) $4,246 $535,430,145Thigh lift $4,736 $65,722,045Upper arm lift $3,790 $70,901,497Vaginal Rejuvenation $2,342 $5,017,399Total - Surgical Procedures $6,273,530,404Injectables: Botulinum Toxin Type A (Botox, Dysport) $328 $858,095,509 Calcium hydroxylapatite (Radiesse) $654 $114,154,141 Hyaluronic Acid (including Hylaform, Juvederm, Perlane/Restylane) $560 $675,560,655 Poly-L-Latic Acid (Sculptra) $847 $51,578,868 Totals - Injectables $1,699,389,173Skin Rejuvenation: Chemical Peel $588 $225,799,585 Dermabrasion $1,555 $39,072,831 Fractional Resurfacing - ablative $2,039 $75,759,635 Fractional Resurfacing - nonablative $1,161 $73,476,160 IPL Laser Treatment $366 $160,838,325 Laser Skin Resurfacing - ablative $2,322 $409,182,300 Laser Skin Resurfacing - nonablative $1,229 $208,121,027 Microdermabrasion $114 $56,964,644 Noninvasive Tightening $1,342 $399,572,397 Totals - Skin Rejuvenation $1,648,786,904Other: Laser Hair Removal $235 $215,960,312 Tattoo Laser Treatment $327 $13,339,071 Laser Treatment of Leg Veins $290 $25,329,881 Sclerotherapy $301 $106,621,497 Totals - Other Nonsurgical Procedures $361,250,760Totals - Nonsurgical Procedures $3,709,426,837TOTALS ALL PROCEDURES $9,982,957,241
Notes from the 2011National average
Please credit the American Society for Aesthetic Plastic Surgery for statistical data.
Hair transplantation was excluded from the results, due to an insuffi cient sample of physicians who perform the procedure.

Economic, Regional and Ethnic information
Please credit the American Society for Aesthetic Plastic Surgery when citing statistical data. Contact: ASAPS Communications • 212.921.0500 • [email protected] • www.surgery.org • fax: 212.921.0011
13
Source: American Society for Aesthetic Plastic Surgery
79% Caucasian
8% Hispanics
7% African-American
5% Asians
1% Other
Total ethnic minority population (rounded) = 21%
Source: American Society for Aesthetic Plastic Surgery
$6.3 Surgical Procedures
$1.7 Injectable Procedures
$1.7 Skin Rejuvenation Procedures
$.4 Other nonsurgical Procedures
$ in billions
Americans Spent Nearly $10 Billion on
Cosmetic Procedures in 2011. Percentage
of Procedure based on Expenditures.
Percent of Total Procedures
According to Race/Ethnicity
CT, ME, MA, NH, RI, VT
MD, NJ, NY, PA, DC
DE, FL, GA, NC, SC, VA, WV
IL, IN, MI, OH, WI
AL, KY, MS, TN
IA, KS, MN, MO, NE, ND, SD
AR, LA, OK, TX
AZ, CO, ID, MT, NV, NM, UT, WY
AK, CA, HI, OR, WA
OTHER
Practice Locations by Region %
New England (CT, ME, MA, NH, RI, VT) 6.3%
Middle Atlantic (MD, NJ, NY, PA, DC) 16.2%
South Atlantic (DE, FL, GA, NC, SC, VA, WV) 18.8%
East North Central (IL, IN, MI, OH, WI) 12.8%
East South Central (AL, KY, MS, TN) 5.2%
West North Central (IA, KS, MN, MO, NE, ND, SD) 8.0%
West South Central (AR, LA, OK, TX) 10.0%
Mountain (AZ, CO, ID, MT, NV, NM, UT, WY) 8.3%
Pacific (AK, CA, HI, OR, WA) 13.9%
Other 0.5%
6.3%6.3%
16.2%16.2%
18.8%18.8%
12.8%12.8%
5.2%5.2%
8.0%8.0%
10.0%10.0%
8.3%8.3%
13.9%13.9%
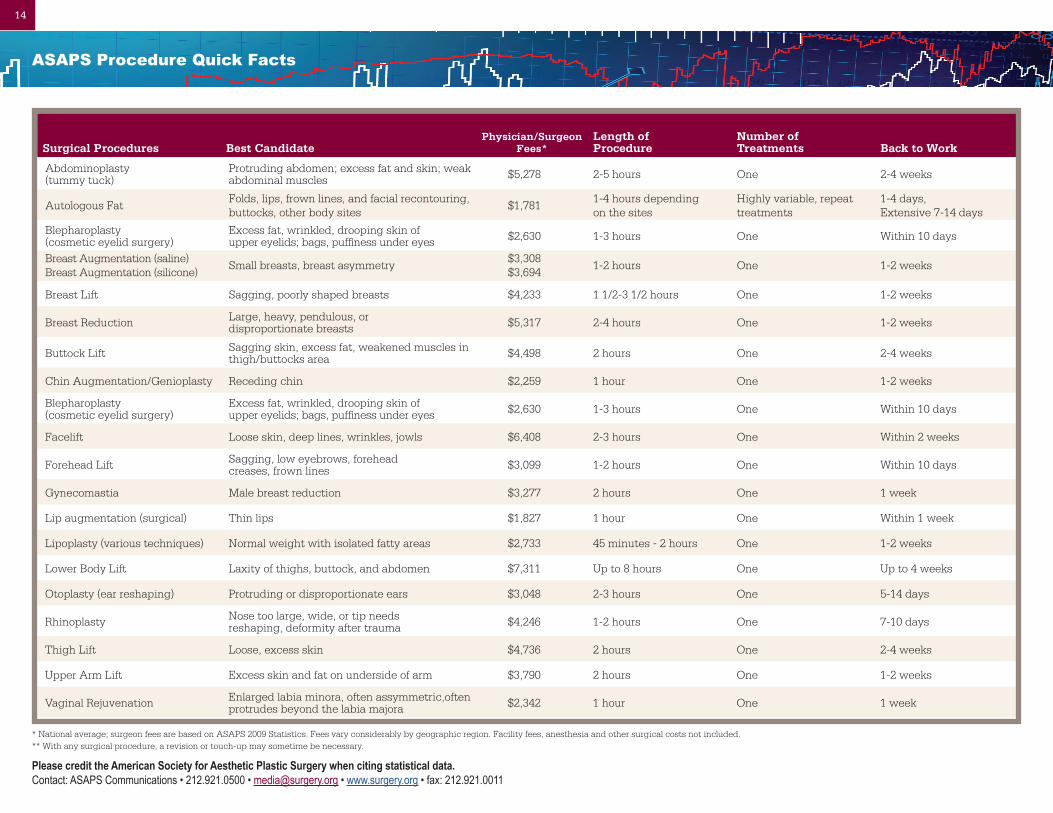
aSaPS Procedure Quick Facts
Please credit the American Society for Aesthetic Plastic Surgery when citing statistical data. Contact: ASAPS Communications • 212.921.0500 • [email protected] • www.surgery.org • fax: 212.921.0011
14
Surgical Procedures Best CandidatePhysician/Surgeon
Fees*Length of Procedure
Number of Treatments Back to Work
Abdominoplasty (tummy tuck)
Protruding abdomen; excess fat and skin; weak abdominal muscles $5,278 2-5 hours One 2-4 weeks
Autologous Fat Folds, lips, frown lines, and facial recontouring, buttocks, other body sites
$1,781 1-4 hours depending on the sites
Highly variable, repeat treatments
1-4 days, Extensive 7-14 days
Blepharoplasty (cosmetic eyelid surgery)
Excess fat, wrinkled, drooping skin of upper eyelids; bags, puffiness under eyes $2,630 1-3 hours One Within 10 days
Breast Augmentation (saline)Breast Augmentation (silicone)
Small breasts, breast asymmetry$3,308 $3,694
1-2 hours One 1-2 weeks
Breast Lift Sagging, poorly shaped breasts $4,233 1 1/2-3 1/2 hours One 1-2 weeks
Breast Reduction Large, heavy, pendulous, or disproportionate breasts $5,317 2-4 hours One 1-2 weeks
Buttock Lift Sagging skin, excess fat, weakened muscles in thigh/buttocks area $4,498 2 hours One 2-4 weeks
Chin Augmentation/Genioplasty Receding chin $2,259 1 hour One 1-2 weeks
Blepharoplasty (cosmetic eyelid surgery)
Excess fat, wrinkled, drooping skin of upper eyelids; bags, puffiness under eyes $2,630 1-3 hours One Within 10 days
Facelift Loose skin, deep lines, wrinkles, jowls $6,408 2-3 hours One Within 2 weeks
Forehead Lift Sagging, low eyebrows, forehead creases, frown lines $3,099 1-2 hours One Within 10 days
Gynecomastia Male breast reduction $3,277 2 hours One 1 week
Lip augmentation (surgical) Thin lips $1,827 1 hour One Within 1 week
Lipoplasty (various techniques) Normal weight with isolated fatty areas $2,733 45 minutes - 2 hours One 1-2 weeks
Lower Body Lift Laxity of thighs, buttock, and abdomen $7,311 Up to 8 hours One Up to 4 weeks
Otoplasty (ear reshaping) Protruding or disproportionate ears $3,048 2-3 hours One 5-14 days
Rhinoplasty Nose too large, wide, or tip needs reshaping, deformity after trauma $4,246 1-2 hours One 7-10 days
Thigh Lift Loose, excess skin $4,736 2 hours One 2-4 weeks
Upper Arm Lift Excess skin and fat on underside of arm $3,790 2 hours One 1-2 weeks
Vaginal Rejuvenation Enlarged labia minora, often assymmetric,often protrudes beyond the labia majora $2,342 1 hour One 1 week
* National average; surgeon fees are based on ASAPS 2009 Statistics. Fees vary considerably by geographic region. Facility fees, anesthesia and other surgical costs not included. ** With any surgical procedure, a revision or touch-up may sometime be necessary.

Please credit the American Society for Aesthetic Plastic Surgery when citing statistical data. Contact: ASAPS Communications • 212.921.0500 • [email protected] • www.surgery.org • fax: 212.921.0011
15
Non-surgical Procedures Best Candidate
Physician/Surgeon Fees
Per Procedure* Length of Procedure Number of Treatments Back to Work
Botulinum Toxin Type A (Botox, Dysport)
Frown lines and crow’s feet $328 30 minutesRepeat treatments 4-6 months (onset ofactions in 1-5 days)
No downtime
Chemical Peel (ranges from light to deep)
Sun-damaged or unevenly pigmented skin
$588 1/2 hour - 3 hours Depends on type of peel
One or multiple Depends on type of peel
Depends on type of peel
DermabrasionAcne, wrinkles around mouth, sun-damaged skin
$1,555 A few minutes - 1 1/2 hours
Multiple sessions 7-10 days
Laser Hair Removal Unwanted hair on face or body $235 1-2 hours Depends on area
Multiple sessions No downtime
Laser Skin ResurfacingFair, non-oily skin; sun-damaged facial skin, wrinkles around mouth and eyes, acne scars
$2,322 $1,229
Variable, up to 1 1/2 hoursOne or multiple depending on laser and skin condition
Variable, up to 14 days
Laser Treatment of Leg Veins
Very small spider veins $290 30 minutes - 1 hour Multiple sessions No downtime
MicrodermabrasionFine lines, crow’s feet, age spots, acne scars
$114 30 minutes - 1 hourMultiple sessions 2-3 week intervals
No downtime
Sclerotherapy Spider veins $301 30 minutes - 1 hour3-4 Treatments Injections
No downtime
Tattoo Laser Treatment Unwanted tattoo $327 10 minutes - 1 hour Multiple sessions No downtime
Soft Tissue Fillers
Calcium hydroxylapatite (Radiesse)
Nasolabial folds, frown lines, crow’s feet, and lips
$654 Less than 1 hour Repeat treatments 2 years or longer
No downtime
Collagen (Human)Frown lines, crow’s feet, nasolabial folds
$673 Less than 1 hourRepeat treatments 3-6 months
No downtime
Hyaluronic acid (Hylaform, Juvederm, Perlane/Restylane)
Nasolabial folds, forehead wrinkles, smile lines, and lips
$558 Less than 1 hour Repeat treatments 4 months – 1 year
No downtime
aSaPS Procedure Quick Facts continued
* National average; surgeon fees are based on ASAPS 2009 Statistics. Fees vary considerably by geographic region. Facility fees, anesthesia and other surgical costs not included.** With any surgical procedure, a revision or touch-up may sometime be necessary.
16
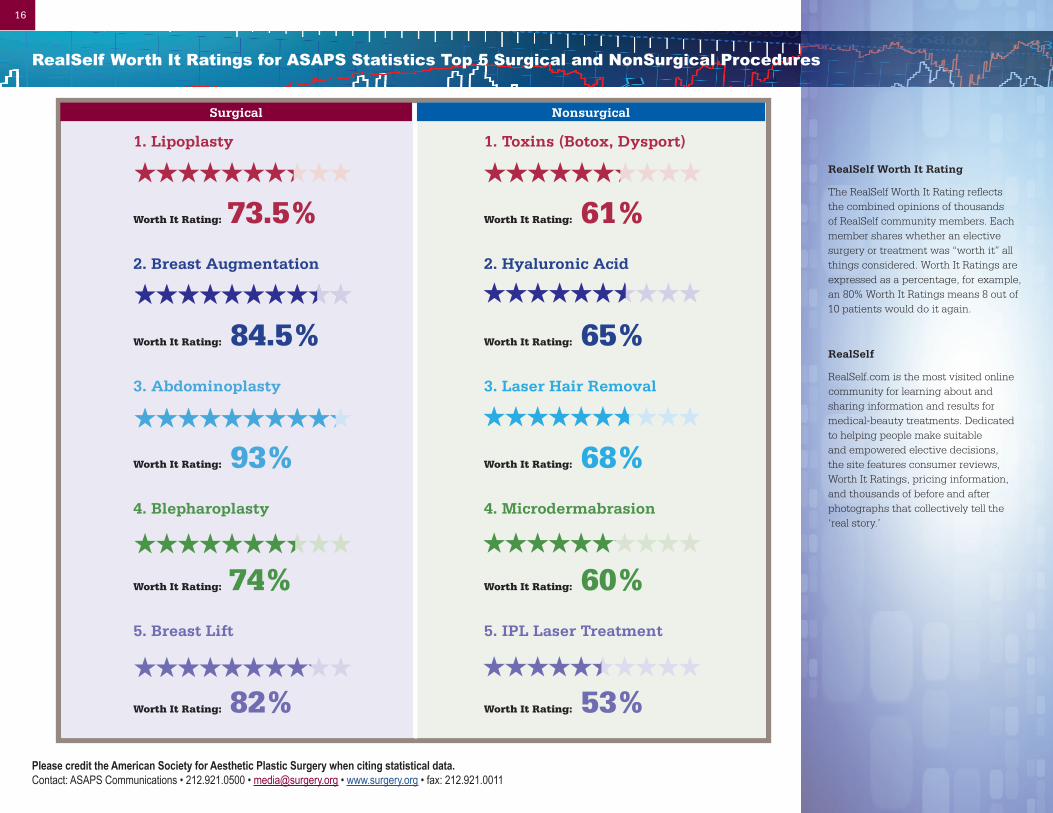
RealSelf Worth It Rating
The RealSelf Worth It Rating refl ects the combined opinions of thousands of RealSelf community members. Each member shares whether an elective surgery or treatment was “worth it” all things considered. Worth It Ratings are expressed as a percentage, for example, an 80% Worth It Ratings means 8 out of 10 patients would do it again.
RealSelf
RealSelf.com is the most visited online community for learning about and sharing information and results for medical-beauty treatments. Dedicated to helping people make suitable and empowered elective decisions, the site features consumer reviews, Worth It Ratings, pricing information, and thousands of before and after photographs that collectively tell the ‘real story.’
Please credit the American Society for Aesthetic Plastic Surgery when citing statistical data. Contact: ASAPS Communications • 212.921.0500 • [email protected] • www.surgery.org • fax: 212.921.0011
RealSelf Worth it Ratings for aSaPS Statistics Top 5 Surgical and NonSurgical Procedures
1. Lipoplasty
Worth It Rating: 73.5%
2. Breast Augmentation
Worth It Rating: 84.5%
3. Abdominoplasty
Worth It Rating: 93%
4. Blepharoplasty
Worth It Rating: 74%
5. Breast Lift
Worth It Rating: 82%
1. Toxins (Botox, Dysport)
Worth It Rating: 61%
2. Hyaluronic Acid
Worth It Rating: 65%
3. Laser Hair Removal
Worth It Rating: 68%
4. Microdermabrasion
Worth It Rating: 60%
5. IPL Laser Treatment
Worth It Rating: 53%
NonsurgicalSurgical

u The Aesthetic Society has a number of websites to help consumers make informed choices.
Among them are:
www.surgery.org,
www.projectbeauty.com,
www.breastimplantsafety.org
(with ASPS) and www.
injectablesafety.org, the web
presence of the Physicians
Coalition for Injectable safety
aSaPS Quick Facts
Please credit the American Society for Aesthetic Plastic Surgery when citing statistical data. Contact: ASAPS Communications • 212.921.0500 • [email protected] • www.surgery.org • fax: 212.921.0011
17
websites
u The American Society for Aesthetic Plastic Surgery (ASAPS)
u Founded in 1967
u Primary mission: education and research in cosmetic plastic surgery
u Over 2600 members, mostly in the U.S. and Canada
u International members in 38 countries
u U.S. members are plastic surgeons certifi ed by the American Board of Plastic Surgery (in Canada, by the Royal College of Physicians and Surgeons of Canada) and specializing in cosmetic surgery of the face and body
u Accredited sponsor of cosmetic surgery Continuing Medical Education (CME) for qualifi ed plastic surgeons since 1974
u Sponsor of the Cosmetic Surgery National Data Bank since 1997
u Peer-reviewed publication: Aesthetic Surgery Journal, the world’s most widely read clinical journal of cosmetic surgery
u Members must perform a minimum number of aesthetic cases to be eligible for membership and perform all surgical procedures in an accredited facility
u All members, due to their extensive training in anatomy of the face and body, are uniquely qualifi ed to perform both surgical and non-invasive procedures
u The Aesthetic meeting has long been considered the premier educational event for board-certifi ed plastic surgeons – its attendance is restricted to this physician group
ASAPS Communications Offi ce36 West 44th Street, Suite 630New York, New York 10036
phone: 212.921.0500 fax: 212.921.0011
www.surgery.org [email protected]
The American Society forAesthetic Plastic Surgery