Embed Size (px)
Citation preview

arX
iv:a
stro
-ph/
0102
147v
1 8
Feb
200
1
Preprint typeset using LATEX style emulateapj v. 26/01/00
DISTANCES AND METALLICITIES OF HIGH- AND INTERMEDIATE-VELOCITY CLOUDS
B.P. Wakker
Department of Astronomy, University of Wisconsin475 N Charter St, Madison, WI 53706, USA
ABSTRACT
A table is presented that summarizes published absorption line measurements for the high- and inter-mediate velocity clouds (HVCs and IVCs). New values are derived for N(H I) in the direction of observedprobes, in order to arrive at reliable abundances and abundance limits (the H I data are described inPaper II). Distances to stellar probes are revisited and calculated consistently, in order to derive dis-tance brackets or limits for many of the clouds, taking care to properly interpret non-detections. Themain conclusions are the following. 1) Absolute abundances have been measured using lines of S II, N Iand O I, with the following resulting values: ∼0.1 solar for one HVC (complex C), ∼0.3 solar for theMagellanic Stream, ∼0.5 solar for a southern IVC, and ∼ solar for two northern IVCs (the IV Arch andLLIV Arch). Finally, approximate values in the range 0.5−2 solar are found for three more IVCs. 2)Depletion patterns in IVCs are like those in warm disk or halo gas. 3) Most distance limits are basedon strong UV lines of C II, Si II and Mg II, a few on Ca II. Distance limits for major HVCs are >5 kpc,while distance brackets for several IVCs are in the range 0.5−2kpc. 4) Mass limits for major IVCs are0.5−8×10⁵M⊙, but for major HVCs they are >106M⊙. 5) The Ca II/H I ratio varies by up to a factor2−5 within a single cloud, somewhat more between clouds. 6) The NaI/H I ratio varies by a factor >10within a cloud, and even more between clouds. Thus, Ca II can be useful for determining both lowerand upper distance limits, but Na I only yields upper limits.
Subject headings: ISM: clouds, ISM: structure, Galaxy: halo, radio lines: ISM, ultraviolet: ISM,
1

2 Ion Abundances in HVCs and IVCs
1. INTRODUCTION
The high- and intermediate-velocity clouds (HVCs andIVCs) consist of gas moving at velocities incompatible witha simple model of differential galactic rotation (Wakker1991). An operational definition has been that HVCs havevelocities larger than ∼90km s−1 (positive or negative) rel-ative to the LSR. The definition of IVCs has been lessstrict. In this paper they are defined as clouds with veloc-ities relative to the LSR between ∼40 and 90 km s−1. In afew directions slightly lower velocities are included, if thereis a clear connection with gas at higher velocities. This def-inition excludes many clouds with |vLSR|<40 km s−1 thatwere considered an IVC by other authors, but in mostcases these have ill-defined borders and often such veloci-ties can be understood within the framework of differentialgalactic rotation, after allowing for turbulent velocities ofup to 30 kms−1.The HVCs and IVCs are still poorly understood, al-
though much progress has been made in the most recentdecade. They appear to serve as tracers of energetic pro-cesses in the Galactic Disk and Halo (as part of a “Galac-tic Fountain”), but also as an ingredient in the continuingformation of the Galaxy (some are examples of accretinggas). Finally, some may be tidal remnants (most promi-nently the Magellanic Stream), or isolated clouds in theLocal Group. A review of our understanding as of a fewyears ago was presented byWakker & van Woerden (1997);an update has already proven necessary (Wakker et al.1999a). Ever since the discovery of the HVCs (Muller etal. 1963), it has been clear that the key to a proper under-standing lies in using interstellar absorption lines to deter-mine distances (and metallicities) for this class of clouds.Thus, some of the recent progress has come from new mod-els and improved mapping, but most has come from newobservations of interstellar absorption lines.Mapping − The published HVC all-sky maps (Huls-
bosch &Wakker 1988, Bajaja et al. 1985) have proven veryuseful to understand the properties and statistics of theHVCs. However, both these surveys suffer from low veloc-ity resolution (16 km s−1) and incomplete mapping. TheHulsbosch & Wakker (1988) survey covered the sky northof declination −18◦ on a 1◦ grid with a 0.◦5 beam, but thesouthern survey of Bajaja et al. (1985) suffered from lack ofcoverage (2◦ grid with a 0.◦5 beam) (although Bajaja et al.(1989) mapped selected areas on a 0.◦5 grid). IVC mapshave only been presented for the “Intermediate-VelocityArch”, a large structure crossing the northern Galacticsky at latitudes >30◦ (Kuntz & Danly 1996). This paperwas based on the data in the “Bell Labs Survey” (Starket al. 1992), which has a 3◦ beam and 1 kms−1 velocityresolution).New datasets allow great improvements in mapping, es-
pecially for IVCs and southern HVCs. a) The Leiden-Dwingeloo Survey (LDS) (Hartmann & Burton 1997), cov-ers the sky north of declination −35◦ on a 0.◦5 grid with1 km s−1 velocity resolution. b) The HVC survey madeat the “Instituto Argentina de Radioastronomia” (IAR)(Morras et al. 2000) provides a list of H I componentswith |vLSR|>80km s−1 for declinations south of −23◦ ona 0.◦5 grid, extracted from spectra with 16 km s−1 velocityresolution. c) The H I Parkes All-Sky Survey (HIPASS)(Staveley-Smith 1997) covers the sky south of declination
0◦ on a 14.′4 grid with 26 kms−1 velocity resolution. d)The Parkes Narrow Band Survey (Haynes et al. 1999,Bruns et al. 2001) covers the Magellanic Stream (bothtrailing and leading parts) on a 14.′4 grid with 1 kms−1
velocity resolution. This paper presents new IVC mapsbased on the LDS, and new maps for southern HVCs basedon the IAR list. The LDS and both Parkes surveys are fur-ther used to construct H I spectra toward HVC and IVCprobes.Models − Gardiner & Noguchi (1996) presented a mod-
ern version of the model in which the Magellanic Streamis formed by tidal stripping. Combined with the obser-vational identification of the predicted leading arm by Luet al. (1998) and Putman et al. (1998), this has led toa better understanding of the Stream and of which otherHVCs could be part of the same tidal feature. Blitz et al.(1999) suggested that the majority of the HVCs are rem-nants of the formation of the Local Group, and are similarto the original building blocks of the Milky Way and theAndromeda Nebula. Braun & Burton (1999) presenteda variant of this interpretation, in which only some smallHVCs are Local Group clouds. These models contrast withprevious ones in which the HVCs/IVCs are generated in aGalactic Fountain (Bregman 1980) or are remnants of theformation of the Milky Way (Oort 1970). It now appearsthat examples of at least three (and possibly all four) ofthe proposed origins can be found (see e.g. Wakker et al.1999a).Absorption-line studies −Metallicities and distances are
best determined using absorption-line studies, both in theoptical and the ultra-violet. In the future, the optical emis-sion lines of [S II] and Hα may prove useful (Tufte et al.1998; Bland-Hawthorn & Maloney 1999), but their poten-tial has not yet been realized. Most HVC/IVC metallicityand distance estimates are fairly recent, with half of therelevant papers published since 1994. This is partly due tothe availability of the “Goddard High Resolution Spectro-graph” (GHRS), the “Space Telescope Imaging Spectro-graph” (STIS), and the “Far Ultra-Violet SpectroscopicExplorer” (FUSE), and partly to an increase in sensitivityof ground-based telescopes. A table of detections of ab-sorptions associated with HVCs was presented by Wakker& van Woerden (1997). Several major discoveries havebeen made since. This paper aims at summarizing all rele-vant literature pertaining to deriving distances and metal-licities for HVCs and IVCs.Many of the papers in the literature discuss the implica-
tions of absorption-line detections and non-detections forderiving distance brackets or limits. Here, a consistent setof criteria was applied to (re)derive these distance bracketsand limits. In general, the conclusions agree with the orig-inal papers, but some new limits are found, and some areshown to have been in error. For this re-analysis, consis-tent distances were determined for the stellar probes (seedescription of Col. 5 in Appendix A), and all publishedequivalent widths and logarithmic column densities wereconverted to column densities (see description of Col. 13).Further, improved H I data were obtained for almost allsightlines, superseding the published value for directionsto probes (see description of Cols. 8−10). For about 50%of the probes new Effelsberg H I data were obtained, whichare presented in a companion paper (Wakker et al. 2001,

3
Paper II, this issue). For about 25% of the probes, N(H I)is based on the LDS. The remainder are based on (refitted)published spectra, either of the two new Parkes surveysor (in a small number of cases) on published numbers.These H I column densities were used to rederive abso-lute and relative (to solar) abundances (see description ofCols. 15−17). Finally, a consistent set of criteria was ap-plied to determine the significance of non-detections usedto derive lower distance limits (see description of Col. 18).This paper is organized as follows: first, a general
overview is given of the format of the main Table 2(Sect. 2). In Sect. 3 a short discussion is given of the abun-dance results for the individual ions. Section 4 summarizesthe derived distance limits, metallicities and abundancepatterns for each of the clouds for which relevant informa-tion is known, and Sect. 5 presents a final analysis. Thevalues in each column of the main table are described indetail in Appendix A.
2. GENERAL DESCRIPTION OF THE TABLE
Table 1 provides an index to the main table (Table 2),to help find particular clouds or probes. The first partof this table lists the HVC and IVC names and the tablepage on which results for each cloud can be found. For anumber of clouds an abbreviation is given in parentheses(e.g. “(=CHS)”). This is used in the second part of theindex, which lists the clouds seen toward each individualstellar or extra-galactic target.Table 2 lists the published results for all probes of each
HVC/IVC, sorted by cloud. Results are given for 7 HVCcomplexes, 7 IVC complexes, and 21 smaller HVCs/IVCs.In the complexes a total of 47 cores have been observed.In addition there are 21 unnamed clouds, which often areonly seen in absorption. Data are given for 326 differenttargets (stars and AGNs), with 1078 entries, one for eachobservation of an ion. Stars less distant than ∼0.2 kpcwere excluded to avoid including many nearby stars thatprovide little distance information (i.e. neither upper norlower limits).The classical HVCs (A, M, C, H, Anti-Center − see
Wakker & van Woerden 1991) are listed first, followed bythe GCN and GCP complexes, the Outer Arm, the Magel-lanic Stream and the smaller HVC complexes. A new HVCcomplex (complex WE) is introduced here (see Sect. 4.19).Next follow results for the +165, +120 and +65km s−1
clouds projected onto the LMC. Then the classical IVCs(IV Arch, LLIV Arch − see Kuntz & Danly 1996) arelisted, followed by other IVC complexes, including threenamed ones that are introduced in this paper: “K”, the“PP Arch” and “gp”, see Sects. 4.27, 4.28 and 4.29.For most clouds the table first gives a summary of mea-
sured and expected abundances for each of the ions ob-served in the cloud. Also, on the first two lines for eachcloud, the derived metallicity and upper/lower distancelimit are summarized, if known. Details of the methodused to derive these limits can be found in Appendix Aunder the description of Cols. 4 and 18.If an abundance was actually measured for a particular
ion, that value is listed in Col. 15 in the cloud summarylines. For the few cases where multiple determinations forone ion were made in the same cloud, the average valueis listed (using only the higher quality measurements). Adiscussion of these abundances is provided in Sects. 3 and
4.Column 16 lists the expected ion abundances in square
brackets, but only for ions that are the dominant ioniza-tion stage in the diffuse ISM. These values are used todetermine whether non-detections are significant and canbe used to set a lower distance limit. Expected abundancesare derived by assuming an overall abundance level com-bined with a halo depletion pattern, as given by Savage& Sembach (1996a); see Sect. 3 for a more detailed de-scription. For the highly-ionized ions (C IV, N V, O VI,Si IV) a “typical” value is shown within square brackets inCol. 13; this serves as a point of comparison for the valueobserved in the HVC.The overall abundance is assumed to be near solar, un-
less shown otherwise in the notes column (Col. 20), on thefirst line pertaining to the cloud. A number followed byZ⊙ in the notes column indicates that the abundance hasactually been measured. This is the case for complex MI(0.8 solar), complex CI (0.1 solar), the Magellanic Stream(0.25 solar), the PP Arch (0.5 solar), IV6, IV9, IV19 (1 so-lar), and the LLIV Arch (1 solar). Parentheses around theabundance indicates clouds where an abundance differentfrom solar is suspected, but not directly proven.After the cloud summary, the table lists the individ-
ual observations relevant for that cloud. In many casesthe sightline to a probe intersects more than one cloud, sothat one probe may be listed under two, three or even fourdifferent clouds (see Table 1).
3. NOTES ON ION ABUNDANCES
3.1. General remarks
3.1.1. Organization
In this section, some general remarks are given to ac-company the discussion of results for most of the observedions below. The symbol A refers to the abundance of theelement, while δ is used to refer the ratio (observed abun-dance in the gas)/(solar abundance). Savage & Sembach(1996a, Sect. 7) define δ in this way, but call it “deple-tion”, implying that the gaseous abundances appear lowerthan solar because most of the element’s atoms sit in dustgrains. However, with this definition δ really refers to thecombination of depletion and ionization, as both depletiononto dust grains and the presence of different ionizationstages can make the elemental abundance in the gas ap-pear lower than the intrinsic abundance. Here, we will useδ to stand for the observed relative abundance in the gas,i.e. the product of depletion onto dust and ionization.Below, some general remarks are given concerning ref-
erence abundances, oscillator strengths, complications dueto ionization, and comparisons of different measurementsof the same ion in the same cloud. A correlation betweenion abundances and H I column density was found, whichis summarized. Then, a summary is given of absorptionby H I, which yields the kinetic (spin) temperature. Earlyresults on molecular hydrogen are listed. Next, dominantions of undepleted ions are discussed, which yield intrin-sic abundances. This is followed by a discussion of domi-nant ions of depleted elements, which yield depletion pat-terns and insight into the presence (and composition) ofthe dust, Then, results for non-dominant ions are summa-rized. Finally, the highly-ionized ions are described. A

4 Ion Abundances in HVCs and IVCs
more detailed discussion of the numerical results for eachcloud is presented in Sect. 4.
3.1.2. Reference abundances
Reference abundances are summarized in Table 3, fol-lowing Savage & Sembach (1996a). This table lists theSolar System (meteoritic) abundances of the element, asgiven by Anders & Grevesse (1989) (with photospheric up-dates for C, N and O from Grevesse & Noels 1993), thedepletion × ionization (assuming a halo-like pattern, asgiven by Savage & Sembach 1996a), the resulting expectedhalo abundance (in parts per billion, ppb), and the ioniza-tion potential of the previous and next ionization stage(i.e. the energy required to produce and destroy the ion).Solar System abundances are used as a reference be-
cause these are comparatively well-determined. However,as Savage & Sembach (1996a) point out, abundances innearby B stars tend to be 0.15−0.25 dex lower. Since Bstars have formed recently, they may be a better referencefor the local ISM. ISM abundances may also show inho-mogeneities between individual open clusters. Such dif-ferences mostly influence the interpretation of depletionpatterns and the composition of dust.Meyer et al. (1998) determined from a set of high-quality
measurements that the typical gaseous abundance of oxy-gen in nearby low-velocity gas is about 320000 ppb, or 0.4solar. They also argued that dust contains at most 180000ppb of oxygen, so that the total oxygen abundance in thenearby ISM is about 0.66 solar. This is similar to the valuederived for nearby B-stars. The suggested explanations arethat a) the early solar system was enriched by a supernova,b) the ISM has recently been diluted by metal-poor gas,or c) the Sun has moved outward from the Galactic cen-ter since it formed. This abundance difference is mostlyimportant when using a depletion pattern to derive thecomposition of dust particles. Further, if the local ISM in-deed has intrinsic abundances below solar, this has somebearing on understanding the origin of relatively nearbyintermediate-velocity halo gas, which appears to have so-lar abundance (as derived from sulphur, see Sects. 4.24,4.26, 4.27 and 4.28).For non-dominant ions, the results listed in Table 2 were
used to derive fiducial values for HVCs/IVCs. This per-tains to C I, N II, Na I, Mg I, S III, K I, Ca I, Ca II,and Fe III. Table 3 shows the range of abundances foundin the HVCs and IVCs for these elements (in the columnlabeled A(halo)). An average value is given for δ. Theseabundances clearly can vary by a large amount, which isnot unexpected considering that they depend on the de-tailed physical conditions in a cloud (temperature, density,radiation field).Rarely are there complementary data for other ion-
ization stages for clouds where non-dominant ions weremeasured. And in cases where both kinds of ions havebeen measured, usually no analysis of physical conditionshas been done − the exceptions being HD93521 (Spitzer& Fitzpatrick 1993), HD215733 (Fitzpatrick & Spitzer1997), SN 1987A (Welty et al. 1999) and PG0804+761(Richter et al. 2001a).
3.1.3. Oscillator strength issues
To convert the observed amount of absorption into a col-umn density, it is necessary to know the oscillator strength
or f -value of the line. For papers published since 1990,most authors take f -values from the list of Morton (1991).No attempt was made to correct column densities in olderpapers or papers where a different source was used forthe f -values. In general, differences tend to be relativelysmall (<20%), although there are exceptions. Still, this isan extra source of systematic uncertainty in the tabulatedcolumn densities. If a paper gave the column density, thiswas used in Table 2, independent of the actual f -value andmethod used to derive this column density.If a paper gave an equivalent width, this was converted
to a column density as described in Appendix A underCol. 13. The f -value was then taken from the compilationof Verner et al. (1994), which claims to be a digitized up-date of the Morton (1991) list. For Si II-1260, Si II-1304,Si II-1526, Ar I-1048, 1066, Cr II-2056, 2062, 2066 andZn II-2026, 2062 updated values were taken from Savage& Sembach (1996a), while for Mg II-1239, 1240 updatedvalues were found by Fitzpatrick & Spitzer (1997). Fur-
ther, for the Fe II lines between 1121 and 1144◦
A, new f -values were determined experimentally from FUSE spectraby Howk (priv. comm.).However, for some lines the f -values that Verner et al.
(1994) give are rather different than those given by Mor-ton (1991). In particular, the ratio Verner/Morton is 0.95for S II-1250, 1253, 1259, 2.88 for N I-1134.16, 1134.41,1134.98 and 1.22 for N I-1199.54, 1200.22, 1200.71. Thesedifferences are unexplained. However, for the case of N Ithe Morton values appear more reliable. This conclusionis based on comparing the relative equivalents widths pre-dicted for the N I-1134 and N I-1200 triplets with thehigh-quality measurements made by Howk et al. (1999)for the sightline to µCol.Morton et al. (2001) present a new compilation of f -
values. These may differ from the previously publishedvalues, sometimes by as much as a factor 2. However,such differences mostly pertain to far-UV lines in the wave-length range observed by FUSE. In the publications usingsuch data, the new f -values have been used.
3.1.4. Ionization issues
Note that the numbers in the table give the ratioN(ion)/N(H I). That is, they do not include a correctionfor hydrogen ionization. In fact, only for a few sight-lines was a study of ionization possible. Toward HD93521(Spitzer & Fitzpatrick 1993) and HD215733 (Fitzpatrick& Spitzer 1997) N(H+)/N(H I) does not seem to be high inthe IVCs studied. However, toward Mrk 509 Sembach etal. (1999) find that N(C IV)>N(C II), which suggests al-most completely ionized gas. Also, toward Mrk 876 (Mur-phy et al. 2000) N(H+) appears to dominate in the com-plex C component. In contrast, toward Mrk 290 (com-plex C, Wakker et al. 1999) and PG0804+761 (LLIV Arch,Richter et al. 2001a) N(H+)/N(H I)∼0.2, while towardHD215733 hydrogen ionization appears negligible (Fitz-patrick & Spitzer 1997). Clearly, ionization issues are im-portant in general, but usually they cannot be addressedwith the existing data.
3.1.5. Multiple measurements in one cloud

5
For a few ions multiple determinations were made withinthe same cloud. This is the case for both Na I and Ca IIin the IV Arch (Sect. 4.24), complex gp (Sect. 4.29) andthe +65 kms IVC toward the LMC (Sect. 4.23). Further,Ca II is seen in several sightlines on complex A (Sect. 4.1),complex C (Sect. 4.3), the LLIV Arch (Sect. 4.26) and theHVCs toward the LMC.These values are compared later in this section (Sect. 3.5
and 3.6). There it is shown that in general Na I can varyby a factor >10 within a single cloud and by a factor upto 100 for any given H I column density. Ca II is moreconstant, varying by a factor 2−5 within a single cloud,and a factor <10 at any given N(H I).Multiple measurements were also made for S II in com-
plex C, for Mg II in the Magellanic Stream, and for O I,Mg II, S II and Fe II in the +120km s−1 HVC toward theLMC. These are discussed under the subsection pertainingto each cloud (Sects. 4.3, 4.14 and 4.23).Figure 1 presents scatter plots of the H I column den-
sity vs the ion column density for the clouds with multipledeterminations.
3.2. A correlation between ion abundances and N(H I)
Previous studies of the depletion in the ISM have foundthat the abundance of elements such as Mg II, P II, Cl II,Mn II, Fe II, Ca II and Ti II correlates with the averagedensity of H I in the sightline (calculated as N(H I) dividedby the distance to the background star) (e.g. Jenkins et al.1986, Crinklaw et al. 1994).In these studies of nearby, low-velocity gas the lowest
observed H I column density is ∼1020 cm−2. As HVC andIVC components stand out in velocity, it is possible tomeasure abundances in clouds with much lower columndensity, down to 1018 cm−2. However, it is not possibleto derive an average volume density since the cloud’s dis-tances and depths are not known. Instead, the gaseousabundances of Mg II, Mn II, Ca II, Ti II and Fe II inHVCs/IVCs (from this paper) and low-velocity gas (fromJenkins et al. 1986 and Crinklaw et al. 1994) were plottedagainst H I column density (rather than against averageH I volume density).Unexpectedly, significant correlations were found. The
high column density low-velocity gas and the low columndensity high-velocity gas lie on the same curves. Least-squares fits yield a rms scatter of 0.3−0.4 dex around themean, for N(H I) between 1018 and 1022 cm−2. These re-sults are presented in detail in a separate paper (Wakker &Mathis 2000) and have implications for the density struc-ture of the ISM and for understanding the formation anddestruction of dust. Here, the fit results are used to pre-dict abundances at a given N(H I); these predictions arecompared to the actual observed values to help understandthe observed abundance patterns.
3.3. H I 21-cm absorption
21-cm H I absorption is seen in only four HVCs/IVCs.The radio continuum source showing absorption incomplex H is unidentified, but is probably extra-galactic (Wakker et al. 1991). The derived spintemperature of 50K is typical for cold gas. AsN(H I,absorption)∼N(H I,emission), there appears to beno warm H I in the very core of complex H.
Three H I absorption components associated with theAnti-Center shell are seen in the spectrum of 3C 123(Payne et al. 1980, Kulkarni et al. 1985), although onlyone emission component can be discerned. The columndensity of the broad (30 km s−1) absorption component issimilar to that of the emission column density, suggestingthe presence of mostly warm (T>200K) gas. One mightargue that the feature sampled by 3C123 is unconnectedwith the main AC Shell feature that runs at b∼7◦ froml=170◦ to l=200◦ (see Fig. 8), so a separate measurementof Ts in the main feature would be useful.Relatively many radio continuum sources lie projected
onto the Outer Arm, and H I absorption is seen towardtwo of those (3C395 and QSO2005+403 − Payne et al.1980, Akeson & Blitz 1999), yielding a spin temperatureof ∼50K and ∼150K, respectively, i.e. typical values forGalactic H I. In several other background sources the lackof H I absorption sets lower limits of 300−1000K, althougha few of these may be Galactic sources in front of the OuterArm. This deserves a more thorough study.Payne et al. (1980) reported H I absorption associated
with cloud R in the spectrum of 4C33.48, which is proba-bly an extra-galactic radio source. The derived spin tem-perature is 69K. The ratio of absorption to emission H Icolumn density is only ∼0.2, suggesting that most of theH I is warm.In all other cases where observations have been made,
21-cm H I absorption was not found. This often implieslower limits to the temperature of >20K, which is nota very interesting limit. However, lower limits of 70Kor more have been found for complex C (Akeson & Blitz1999), the Cohen Stream (Colgan et al. 1990), the Magel-lanic Stream (Payne et al. 1980, Colgan et al. 1990, Meboldet al. 1991, Akeson & Blitz 1999) and complex K (Colganet al. 1990).
3.4. Molecular hydrogen
The study of H2 in HVCs and IVCs is in its infancy. At-tempts to detect molecular gas in HVCs using CO emissionhave always been unsuccessful (see Wakker et al. 1997).However, H2 is easy to detect in ultra-violet absorption,as is shown by the recent ORFEUS (Orbiting and Re-trievable Far and Extreme Ultraviolet Spectrometer) andFUSE instruments. H2 has now been found in two HVCsand three IVCs.The first detection was that in the ORFEUS spectrum
of Sk−68 82 for the +120km s−1 cloud projected on theLMC (Richter et al. 1999). This was also measured byBluhm et al. (2001) and yields a ratio for N(H2)/N(H I) of3.0±0.6×10⁻⁵, with N(H I)=12×1018 cm−2. However, to-ward the star Sk−68 80 (less than an arcmin away) Richter(priv. comm.) finds no H2, showing large variations onsmall scales in this cloud. The +60km s−1 cloud towardthe LMC also contains H2, with a fraction of 5×10⁻³, al-though N(H I) is only ∼1018 cm−2.Murphy et al. (2000) reported a limit of N(H2)/N(H I)
<10−5, for complex C, where N(H I)=19×1018 cm−2.H2 in the IV arch was found in the OR-FEUS spectrum of HD93521 (Gringel et al. 2000),where N(H I)=37×1018 cm−2 and N(H2)/N(H I)=0.8±0.5×10⁻⁵. H2 in the LLIV arch was detectedby Richter et al. (2001a), in the FUSE spectrum of

6 Ion Abundances in HVCs and IVCs
PG0804+761. The N(H2)/N(H I) ratio there is 1.5×10⁻⁵,with N(H I)=35×1018 cm−2. H2 is also found in the+240km s−1 HVC seen in the spectrum of NGC3783(cloud WW187), where N(H I)=83×1018 cm−2 andN(H2)/N(H I)=0.8±0.2×10⁻³ (Sembach et al. 2001).Thus, high- and intermediate-velocity molecular hydro-
gen has been found, with molecular fractions that are notatypical for the amount of hydrogen in the sight line. Thisrequires the presence of dust in the detected IVCs/HVCs,which is also suggested by the depletion pattern of theseparticular clouds. The only non-detection is toward com-plex C, where a smaller absolute amount of dust is ex-pected because this cloud has low metallicity. However, itis unclear whether the sensitivity was sufficiently high todetect H2 at the low H I column density.
3.5. Dominant ions of lightly depleted elements
Intrinsic abundances can be determined or estimatedusing lines of N I, O I, P II, S II and Zn II. That these ele-ments are (almost) completely in the gas phase is an expec-tation based on measurements of low-velocity gas (Savage& Sembach 1996a). Results have been reported for sevenclouds, as summarized below.First, for HVC complex A an abundance of about 0.1
solar is suggested by the O I-1302 absorption seen towardI Zw 18 (Kunth et al. 1994). However, this measurementis based on a strong line, the error in the equivalent widthis large and the component structure complicates mattersfurther (see also Sect. 4.1).For complex C abundances were measured in two
sightlines with high N(H I) (∼90×1018 cm−2 − Mrk290and PG1259+593), two with intermediate N(H I)(∼30×1018 cm−2 − Mrk817 and Mrk 279) and one withrelatively low N(H I) (∼20×1019 cm−2 − Mrk876).A value of 0.09±0.02 solar was measured for sulphur
toward Mrk 290 (Wakker et al. 1999), which was cor-rected for 20% H ionization (based on a measurement ofHα emission) and for H I small-scale structure. Richteret al. (2001b) find O I/H I=0.11+0.13
−0.08 solar towardPG1259+593. O I is a particularly useful ion as it hasan ionization potential similar to that of H I and its ion-ization is strongly coupled to that of hydrogen through acharge-exchange reaction (Sofia & Jenkins 1998).Toward Mrk 876 Murphy et al. (2000) found
N(N I)/N(H I)∼0.08 solar and N(Ar I)/N(H I)<0.1 so-lar. N I and H I have similar ionization potential and thenitrogen ionization also tends to couple to that of hydro-gen, although not as strongly as that of oxygen. Argonis a noble gas, and therefore probably undepleted. How-ever, Ar I has a larger photo-ionization cross section thanH I and is not coupled to H I. It is therefore more easilyionized than H I and in a situation where neutral and(photo-)ionized gas are mixed, Ar I can appear deficient.In the sightline toward Mrk 876 Murphy et al. (2000) fur-ther find that N(Fe II)/N(H I)∼0.5 solar. To reconcile thiswith the N I abundance requires a large H+/H I ratio.For two other complex C probes (Mrk 817, Mrk 279)
Gibson et al. (2001) found N(S II)/N(H I)=0.3−0.4 solar.However, in neither of these directions has H I small-scalestructure or ionization been taken into account. Ionizationprobably is important, since if photo-ionization is respon-sible for the H+, N(H+) should not vary by more than a
factor ∼2 across the face of the cloud. Since, in the sight-line toward Mrk 290 N(H+) is ∼2×1019 cm−2, and towardMrk 817 and Mrk 279 N(H I) is ∼3×1019 cm−2, the ioniza-tion correction could easily be a factor 2, bringing the S+
abundances in line with those found toward Mrk 290.Two sulphur abundance measurements exist for the
Magellanic Stream: 0.33 solar (Fairall 9, Gibson et al.2000) and 0.25 solar (NGC 3783, Lu et al. 1998). Ion-ization corrections have not yet been addressed, but theyare expected to be minimal as N(H I) is high and the gasis far from both the Galaxy and the LMC. Note that to-ward NGC3783 a 1′ resolution map of the H I small-scalestructure resulted in a 50% correction of N(H I) (and thusthe S+ abundance) relative to a measurement with a largebeam (Lu et al. 1998).For three sightlines through the IV Arch S II/H I ra-
tios have been derived, resulting in values of 0.78 solarfor IV9/IV19 (HD121800, Howk et al. 2001), 0.8 and1.2 solar for off-core components at −58 and −51 kms−1
(HD 93521, Spitzer & Fitzpatrick 1993), and 1.1 solar to-ward PG0953+414 (Fabian et al. 2001). Further, O I/H Iis found to be 0.9±0.7 solar toward PG1259+593.PG0804+761 gives the best estimate of abundances in
the LLIV Arch (Richter et al. 2001a). N(O I)/N(H I) is∼1 solar, while N(N I)/N(H I) is ∼0.6 solar. The fact thatN(P II)/N(H I)∼1.3 solar is interpreted as evidence that20% of the H is in the form of H+, as P+ can co-existwith H+ as well as with H I, whereas O I becomes ion-ized when H I gets ionized. This is supported by the valueof 1.6±0.4 solar for Zn+ (which behaves like P+) foundfrom SN 1993J. The lower N I/H I ratio may be inter-preted as evidence for partial ionization (following Sofia &Jenkins 1998), which is further supported by the low ratioN(Ar I)/N(H I)∼0.3.Toward HD215733 Fitzpatrick & Spitzer (1997) de-
composed the H I spectrum based on the absorptioncomponents. This results in components at −92 kms−1
with N(S II)/N(H I)=0.17 solar, at −56 km s−1 withN(S II)/N(H I)=0.32 solar and at −43 km s−1 withN(S II)/N(H I)=1.2 solar. The latter two are part of whatis defined in this paper as the “PP Arch” (see Sect. 4.28).The combined abundance is 0.5 solar. In both componentsZn II absorption is also seen, yielding abundances of 0.23and 0.95 solar, 0.37 solar when combined. Ionization ap-pears to be unimportant as Fitzpatrick & Spitzer (1997)derive a low electron column density, but the complex com-ponent structure hampers the interpretation. Still, themeasurements are consistent with an intrinsic abundanceof ∼0.5 solar for the PP Arch.Penton et al. (2000) fitted three components to the S II-
1250, 1253 and 1259 lines in a GHRS spectrum of Mrk 509.One of these is at +60km s−1 and is associated with com-plex gp. This spectrum is also shown (but not measured)by Sembach et al. (1999). Penton et al. (2000) give equiva-
lent widths of 58, 85 and 30m◦
A for the three sulphur lines.The S II-1259 line is strongly blended with Si II-1260, andthus unreliable. The better view of the spectrum presentedby Sembach et al. (1999) shows that the equivalent widthmust be about half the value given by Penton et al. (2000).Therefore, to calculate the S II column density, values of 29
and 42m◦
A were used. Using the H I linewidth of 29 kms−1
seen in this direction, these equivalent widths imply an

7
average S II/H I ratio of 0.8 solar. Since N(H I) is small(24.5×1018 cm−2), a large correction for H+ is quite pos-sible, and the intrinsic abundance of complex gp remainsunknown. However, this result strongly suggests that theabundance of complex gp is within a factor 2 of solar.
3.6. Dominant ions of depleted elements
C II, Mg II, Si II − Several depleted ions have verystrong lines, reaching an optical depth of 3 for cloudswith standard depletion patterns and solar abundances atquite low column densities (∼2×1018 cm−2 for C II-1334,∼1018 cm−2 for Mg II-2796 and Si II-1260). These lines aretherefore very useful for determining distance limits, butin general they are less useful for determining depletionpatterns.C II-1334 is clearly detected in many clouds, and has
been used to derive a lower distance limit for complex H.Unresolved Mg II-2796, 2803 absorption has been seen inmany AGNs observed with the FOS, as described by Sav-age et al. (2000a). Mg II-2796 is the main line used to de-rive lower distance limits for complexes A (Wakker et al.1996b), C (de Boer et al. 1994), H (Wakker et al. 1998),the Cohen Stream and WW507 (Kemp et al. 1994), andthe LLIV Arch (Wakker et al. 1996b), while Si II is themain ion used to derive limits for IV4, IV6, IV9, IV11,IV17, IV19, IV24, IV26 and the IV spur (Kuntz & Danly1996)For a few sightlines with low N(H I), Mg II-2796 has
been used to derive the Mg II abundance: for complex Cand cloud WW84 using Mrk 205 (Bowen et al. 1995b),and for 11 sightlines through the Magellanic Stream (seeSect. 4.14). Mg II-1239, 1240 has been measured towardSN 1987A (Welty et al. 1999), HD 93521 (Spitzer & Fitz-patrick 1993) and HD215733 (Fitzpatrick & Spitzer 1997).
Al II, Al III, Cl I − These ions are difficult to observe andthus data exist only for three sightlines: 4 Lac (Bates etal. 1990), SN1993J (de Boer et al. 1993) and SN1987A(Welty et al. 1999).
Ti II, Cr II, Mn II, Ni II − These elements have weak lines,and are rarely seen. In fact, Cr II and Ni II have onlybeen found toward the IVC toward the LMC and in thePP Arch (Welty et al. 1999, Fitzpatrick & Spitzer 1997),while Ti II and Mn II are also seen in the IVC toward theLMC (Caulet & Newell 1996) and several IV Arch cores(Albert 1983, Albert et al. 1993, Spitzer & Fitzpatrick1993, Lipman & Pettini 1995, Fitzpatrick & Spitzer 1997,Lehner et al. 1999a, Bowen et al. 2000).
Fe II − This is the most useful ion for obtaining an indica-tion of the presence and amount of dust in HVCs/IVCs, asit has many strong lines in the UV, with a large range ofoscillator strengths. Sembach & Savage (1996) found thatthe depletion of Fe is maximal in cold disk gas (typicallyδ∼0.01, less in warm disk gas (δ∼0.1), and least in halo gas(δ∼0.2). Higher gaseous abundances were not observed inthe sightlines studied, which was interpreted by Sembach& Savage (1996) as evidence for a hard-to-destroy iron coreof the dust particles.High- and intermediate velocity Fe II absorption has
been seen in many clouds: complex C (Murphy et al. 2000,Richter et al. 2001b), the Magellanic Stream (Jannuzi et
al. 1998, Savage et al. 2000a), WW187 (Lu et al. 1998),HVC100−7+100 (Bates et al. 1990), the HVCs/IVCs to-ward the LMC (Savage & de Boer 1979, 1981, Welty et al.1999, Richter et al. 1999), IV4 (Bowen et al. 2000), IV6(Spitzer & Fitzpatrick 1993), the LLIV Arch (de Boer etal. 1993, Richter et al. 2001a), and the PP Arch (Fitz-patrick & Spitzer 1997).For clouds where an undepleted element was also mea-
sured the ratio with Fe II can be derived and the deple-tion of Fe can be derived. This results in (Fe/N)>5 so-lar for complex C (Mrk 876 − Murphy et al. 2000; ion-ization corrections are likely to be large in this sight-line, however); (Fe/N)<1 solar and (Fe/O)=0.37±0.26 so-lar in complex C (PG1259+593 − Richter et al. 2001b);(Fe/S)=0.19±0.07 solar in the Magellanic Stream proper(PKS0637−75 combined with Fairall 9 − Jannuzi et al.1998, Gibson et al. 2000). (Fe/S)=0.13±0.05 solar in theleading arm (NGC3783 − Lu et al. 1998); (Fe/O)∼0.4 so-lar in the IV Arch (PG1259+593 −Richter et al. 2001b);(Fe/S)∼0.2 solar in the IV Arch (HD93521 − Spitzer& Fitzpatrick 1993); (Fe/O)∼0.27 solar and (Fe/P)∼0.2solar in the LLIV Arch (PG0804+762 − Richter et al.2001a), and (Fe/S)∼0.2 solar in the PP Arch (HD215733− Fitzpatrick & Spitzer 1997).Thus, the Magellanic Stream and three of the major
IVCs appear to have Fe depletions of about a factor 5,which is similar to the typical halo value derived by Sav-age & Sembach (1996a). Note, however, that the IVCresults for HD93521 and HD215733 were used to arriveat this typical value. Note also that Wakker & Mathis(2000) show that the apparent depletion of Fe II dependson N(H I). It is thus unclear whether the high Fe/S ra-tios in HVCs/IVCs are due to environmental conditionsor to the fact that the HVC/IVC H I column densities arerelatively low.
3.7. Non-dominant ions
Several non-dominant ions have been seen. These arediscussed individually below, in order to derive a referencevalue for incorporation in Table 3.
C I − For this ion an abundance has been found for cloudsWW187 (NGC3783, 280±180 ppb − Lu et al. 1994a) andthe PP Arch (HD215733, 240±30 ppb − Fitzpatrick &Spitzer 1997). Both values are about 0.2% of the refer-ence C II abundance. C I was also seen in the +65 kms−1
IVC in the SN 1987A sightline (Welty et al. 1999), withan abundance of 340±130 ppb (however, N(H I) is com-paratively uncertain).
N II − The FUSE bandpass contains the N II-1083 line,which is a good complement to the N I triplets at 1134 and
1199◦
A. An analysis of the PG0804+761 sightline yields anN II/N I ratio ∼0.15 (Richter et al. 2001a). Only a lowerlimit to N II is found for complex C toward Mrk 876 (Mur-phy et al. 2000).
Mg I − This ion has been measured towardHVC100−7+110 (4Lac, 100±20 ppb − Bates et al. 1990),IV4 (SN 1998S, 6.6±1.4 ppb − Bowen et al. 2000), the+120 and +60km s−1 clouds toward the LMC (Bluhm etal. 2001, with large errors but showing large variations),IV17 (SN1998S, 36 ppb − Bowen et al. 2000), LLIV1(SN1993J, 44 ppb − de Boer et al. 1993), and the PP

8 Ion Abundances in HVCs and IVCs
Arch (HD215733, 30±14 ppb − Fitzpatrick & Spitzer1997). These values are 0.04−0.7% of the reference forA(Mg II). The approximate values for the clouds in theSN 1987A sightline are slightly higher (110, 110 and 390ppb, Welty et al. 1999). Since each of the listed cloudshas near-solar abundance (see Sects. 4.23 and 4.24), thereclearly are large variations in the relative Mg I abundance.Only for the +165 and +122km s−1 LMC clouds and
the PP Arch has an Mg II abundance also been measureddirectly. The resulting Mg I/Mg II ratios are 0.5%, 0.5%and 0.3%, respectively.
Si III − The 1206◦
A line of Si III is very strong, so thatall six detections only give lower limits to the Si+2 abun-dance: in complex C (Mrk 876 − Gibson et al. 2001),WW487 (NGC 1705 − Sahu & Blades 1997), complexGCN (Mrk 509 − Sembach et al. 1995, 1999), complex WE(HD156359 − Sembach et al. 1991), the −150km s−1
and +130km s−1 clouds against PG0953+414 (Fabianet al. 2001), and the +65km s−1 IVC toward the LMC(Sk−67 104 − Savage & Jeske 1981).
S III − This ion has only been seen in the three IVCs to-ward HD93521, where the S III/ S II ratios are 0.11, 0.04and 0.15 (Spitzer & Fitzpatrick 1993).
K I − This ion has weak optical lines. It was detectedtoward SN1993J at +122 and +140km s−1 with abun-dances >9.2 and >5.8 ppb (Vladilo et al. 1993, 1994). Itwas also detected in complex gp in the spectrum of M15 K144, with an abundance of 4.9 ppb (Kennedy et al.1998), which is about 5% of the solar K abundance. How-ever, Kennedy et al. (1998) did not detect K I toward thestar M 15 IV-38, with a limit of 0.82 ppb, suggesting largevariations in the K I abundance on small scales.
Ca I − Like K I, Ca I has weak optical lines, and was foundtoward SN1993J at +122 and +140km s−1 (Vladilo et al.1993, 1994). The abundance is >1.7 ppb for both clouds.For the +165 and +65 km s−1 clouds toward SN1987Aapproximate abundances of 0.87 and 0.31 ppb were found,whereas for the +120km s−1 cloud an upper limit of 0.05ppb was set (Magain 1987, Vidal-Madjar 1987, Welty etal. 1999).
Fe III − The FUSE bandpass contains the Fe III-1122 line,which is a good complement to the many Fe II lines. Theanalysis of the PG0804+761 sightline gives an Fe III/Fe IIratio ∼0.03 for the LLIV Arch.
3.8. Na I
3.8.1. Na I detections
In low-velocity gas, an average Na I abundance of ∼5ppb is seen, although the range is large (more than afactor 10 either way). Only one catalogued HVC hasbeen detected in Na I absorption: cloud WW219 towardSN 1986G (d’Odorico et al. 1989) yields A(Na I)=50±10ppb. High-velocity Na I has been searched for in onlytwo stars known to be sufficiently distant. Yet, it wasnot detected toward BD+382182 (MIII − Keenan et al.1995) and HD83206 (WW63 − Lehner et al. 1999a). Fourextra-galactic probes give upper limits: <4 ppb (Mrk 595,Cohen Stream − Kemp & Bates 1998), <55 ppb (Mrk 205,WW84 − Bowen et al. 1995a), <2.5 ppb (Fairall 9, Mag-ellanic Stream − Songaila & York 1981) and <3.7 ppb
(NGC3783, cloud WW187 − West et al. 1985). Consid-ering the large observed range for N(Na I) in low-velocitygas, these limits clearly are not very significant.Detections of Na I at high velocity have been reported
for some extreme-positive velocity gas, in all but onecase for directions where no H I was detected: SN1993J(Vladilo et al. 1993, 1994), SN1994D and SN1994 I (Ho &Filippenko 1995, 1996) give A(Na I)>20 to>800 ppb. Inall these cases the rather large abundances and low valueof N(H I) suggest that the gas is mostly ionized.For the +65 kms−1 IVC toward the LMC, Na I abun-
dances in directions with N(H I)>5×1018 cm−2 vary bya factor >10 (<7 to 70 ppb; see Fig. 1f). The highestabundances (>70 ppb) occur for two directions with lowN(H I) (Sk−68 82 and Sk−71 03 − Songaila & York 1981,Songaila et al. 1981).In the IV Arch Na I detections exist for cores IV6, IV21
and IV26, as well as in some off-core probes (Benjamin etal. 1996, Ryans et al. 1997a, Lehner et al. 1999a). Abun-dances range from 0.57 ppb to 6.1 ppb, i.e., inside therange typical for low-velocity gas (Fig. 1h). One highervalue (>50 ppb for BD+38 2182, Ryans et al. 1997a) isassociated with a low value for N(H I), in which case ion-ization issues may be important.The two measurements in the LLIV Arch yield normal
abundances of 2.4 and 4.2 ppb (SN 1993J − Vladilo et al.1993, 1994, HD 77770 −Welsh et al. 1996).Toward several stars in M13 that probe complex K,
Shaw et al. (1996) determined N(H I) at 1′ resolution, andfound that Na I was not always detected toward stars withsimilar N(H I), giving limits A<5 ppb, while the detectionsrange from 13 ppb to 45 ppb.Detections associated with complex gp toward 8 stars
in M15 yield abundances between 10 and 40 ppb (Morton& Blades 1986, Langer et al. 1990, Kennedy et al. 1998;Fig. 1j). Meyer & Lauroesch (1999) found a change from10 to >160 ppb over several arcminutes in M15. Thesevalues were derived using N(H I) as measured at 9.′1 reso-lution and interpolated between 9 beams placed at 5′ in-tervals. When probed in the sightline toward HD203664,this IVC shows three absorption components with an av-erage abundance of 77 ppb (Ryans et al. 1996). Finally,toward Mrk 509 A(Na I)=10 ppb (York et al. 1982).Thus, for the IV and LLIV Arch, A(Na I) tends to be
similar to that in low-velocity gas, whereas for the IVCtoward the LMC and complex gp it is higher. Further,within a single cloud the measured abundance can varyby a factor >10.
3.8.2. Correlation between A(Na I) and N(H I)
Figure 2 a shows the correlation between A(Na I) andN(H I) for the high- and intermediate-velocity detections.The mostly-horizontal straight line is the relation claimedby Ferlet et al. (1985b) for low-velocity H I (log N(Na I) =1.04 log N(H I) − 9.09), while the dotted lines show the 1σspread in that relation (0.5 in the log). Note that this re-lation is supposed to correlate N(Na I) with the combinedatomic and molecular column density, not just the neutralhydrogen column density. For HVCs and IVCs, N(H2) isrelatively low, so N(H)∼N(H I). This correlation is oftenused to infer N(H I) from a measurement of N(Na I). Forinstance, Ho & Filippenko (1995) stated that the Na I

9
column density for the +243km s−1 component seen inthe spectrum of SN1994D implies that N(H I) should be∼6×1019 cm−2.However, the N(Na I) vs N(H I) relation is not as well de-
fined as it has been made out to be, and here it is shown tobe invalid for the HVC/IVC gas. Also, Welty et al. (1994,Sect. 4.3) pointed out that below N(H I)=1019 cm−2 therelation was defined from five points, three of which theyshowed to be inaccurate. Welty et al. (1994) also pointout that Ferlet et al. 1985b) mixed Na I/H I ratios de-rived for individual components with velocity-integratedvalues, which is invalid if the abundance vs N(H) relationis not linear. Finally, the spread in the nominal relation islarge: for any given value of N(Na I), the predicted valueof N(H I) has a range of at least a factor 100.In the case of the HVCs/IVCs, a direct ob-
servation of N(H I) toward SN1994D shows thatN(H I)<2.5×1018 cm−2 (Paper II), a factor 25 lower thanwould be inferred from N(Na I). For the HVC/IVC pointsin Fig. 2a the formal fit shows a non-linear correlation,but the 1σ range of log N(Na I) at any given value of logN(H I) is ±1, even larger than the ±0.5 shown by Ferletet al. (1985b) for low-velocity gas. Thus, for any givenN(H I) there is a range of about a factor 100 in the Na Icolumn density, rather than the factor 10 for low-velocitygas. In conclusion, for high- and intermediate-velocity gasN(Na I) is an even worse predictor of N(H I) than it is forlow-velocity gas.
3.9. Ca II
3.9.1. Ca II abundances in HVCs
The most important non-dominant ion is Ca II. HVCsand IVCs have H I column densities in the range a few 1018
to 1020 cm−2, and the Ca II abundance then tends to be10−100 ppb, which corresponds to a logarithmic value forthe product depletion × ionization (log δ) of −1.3 to −2.3.Ca II has been detected in many different clouds, HVCs aswell as IVCs, often in multiple sightlines through the samecloud. It is therefore possible to check the constancy of itsabundance across a cloud. So far, assuming constant Ca IIabundance appears to be reasonable, although it may beeven better to calculate a predicted value for A(Ca II) us-ing the observed correlation between A(Ca II) and N(H I)(see Wakker & Mathis 2000). This correlation can also beseen in Fig. 2b, which shows N(Ca II) vs N(H I).Ca II is detected in the following HVCs: complex A
(Mrk 106 − Schwarz et al. 1995, ADUMa − van Woer-den et al. 1999a, complex C (Mrk 290 and PG1351+640− Wakker et al. 1996a), cloud MIII (BD+38 2182 −Ryans et al. 1997a), cloud IV4 (SN1998S − Bowen etal. 2000), complex WB (PKS0837−12 − Robertson etal. 1991), the Magellanic Stream (Fairall 9 − Songaila1981, NGC 3783 − West et al. 1985), and cloud WW219(SN 1986G − d’Odorico et al. 1989). For 8 componentswith N(H I)=30−90×1018 cm−2 six Ca II abundances arein the range 12−27 ppb, while a high value of 69 ppb isfound toward NGC3783 and a low value of 3.3±0.9 ppbis found toward SN 1998S in IV4. The latter may be lowbecause IV4 shows a disk-like (i.e. more depleted) pattern,rather than the halo-like pattern seen in other HVCs (seeSect. 4.2). The A(Ca II)-N(H I) correlation (Wakker &Mathis 2000) predicts a range of 8−18 ppb for the H I
column densities in these components.In five lower column density components
(N(H I)<8×1018 cm−2) the values are higher, 110−>290pbb, where the A(Ca II)-N(H I) correlation predicts arange of 53−440 ppb for the observed H I column densi-ties.Within a single complex multiple determinations are
within a factor 2.5 of each other (18/21 ppb in complex A,21/12/18 ppb in complex C, 27/69 ppb in the MagellanicStream). However, the H I column densities in these di-rections are also within a factor 2 of each other, so thatthe abundances are expected to be similar.Ca II absorption without associated high-velocity H I
was seen toward four extra-galactic supernovae (SN1983N− d’Odorico et al. 1985, SN1991T − Meyer & Roth 1991,SN1993J − Vladilo et al. 1993, 1994, and SN1994D −King et al. 1995) and two stars (BD+38 2182 − Keenanet al. 1995 and HD83206 − Lehner et al. 1999a). Thissets lower limits to A(Ca II) of >27 to >500 ppb. Inall cases, the H I column density must be very low (< afew 1018 cm−2), so the limit on the abundance is below(and thus consistent with) the value predicted from theA(Ca II)-N(H I) relation that is discussed by Wakker &Mathis (2000).
3.9.2. Ca II abundances in HVCs/IVCs toward the LMC
Many detections exist toward the HVCs/IVC toward theLMC. If the H I column densities toward the backgroundstars were more reliable, this cloud would provide an idealtesting ground to look for abundance variations. How-ever, many H I column densities are interpolated betweenthree directions (see item PI in the description of Col. 10),or based on using a ruler on the plots of Wayte (1990)(item PR). Still, some patterns do emerge, see Fig. 1g,h, i). Excluding two discrepant values from Songaila etal. (1981), in the two HVCs (at +165, and +120km s−1)the abundance range is about a factor 5 (26−110 ppb and20−100 ppb, respectively), when N(H I)>4.5×1018 cm−2,while for sightlines with lower N(H I) the typical abun-dances are higher (180−370 ppb and 160−1300 ppb, re-spectively). The pattern in the IVC is similar, but withhigher values. A(Ca II) ranges from 31 to 230 ppb forN(H I)>4.5×1018 cm−2, with two outliers at 400 and 480ppb (both have interpolated N(H I)), and from 80 to 430ppb at lower N(H I). This cloud shows an unusual deple-tion pattern for all the other elements (see Welty et al.1999), which may indicate that unusual processes are go-ing on.
3.9.3. Ca II abundances in IVCs
Many detections exist in the IV Arch (Fig. 1c) (Wes-selius & Fejes 1973, Albert 1983, Songaila et al. 1985, 1988,Spitzer & Fitzpatrick 1993, Albert et al. 1993, Schwarz etal. 1995, Wakker et al. 1996a, Ryans et al. 1997a, Lehneret al. 1999a, Ryans et al. 1999, van Woerden et al. 1999b,Bowen et al. 2000).Within a single core some variations exist: 16/26 ppb
in IV17, 13/37 ppb in IV19, 4.6/11 ppb in IV26. Betweencores the variations are larger: 30 ppb in IV6, 23 ppb inIV7, 7.5 ppb in IV9. Outside cores the range is 8−55ppb. Clearly, variations are about a factor 5. However,this relatively small range may be an artifact of the small

10 Ion Abundances in HVCs and IVCs
range in N(H I), as for 15 out of 19 cases the observedvalue is within a factor 3 of the value predicted by theA(Ca II)-N(H I) relation discussed by Wakker & Mathis(2000). One of the exceptions is BD+492137 where twoCa II components are seen, but only one H I componentcan be measured.Abundances in the LLIV Arch have been measured to-
ward 8 different background probes (Fig. 1b) (Vladilo et al.1993, 1994, Welsh et al. 1996, Ryans et al. 1997b, Lehneret al. 1999a), and tend to lie in the narrow range of 12 to17 ppb (with two outliers at 9 and 2.5 ppb; for the lat-ter the derived H I column density is probably affected bythe spectral decomposition). Thus, variations appear tobe very small, and on average the value is lower than inother clouds. This is consistent with the warm-disk-likedepletion pattern for this object (Sect. 4.26). The valuespredicted from the A(Ca II)-N(H I) relation discussed inSect. 3.6 lie in the range 9−26 ppb, i.e. the low Ca II abun-dance may also be due to the relatively high H I columndensities seen in the LLIV Arch.A cloud where future work will allow a study of small-
scale variations in A(Ca II) is complex gp (see Sect. 4.29),which is probed by the globular cluster M15 (Fig. 1e).Meyer & Lauroesch (1999) found that toward M15 theNa I abundance varies from 10 to 160 ppb (i.e. a factor16) on a scale of a few arcsec. Lehner et al. (1999b) mea-sured N(Ca II) toward 12 stars, but did not provide adetailed H I map. N(H I) was measured at 9 positionswith Effelsberg, and interpolated to the stellar positions.This results in abundances of 20−55 ppb. The same IVCis also seen toward Mrk 509 (A(Ca II)=74 ppb, York etal. 1982) and toward HD203664, where N(H I) is very low(2.2×1018 cm−2), and the Ca II abundance is correspond-ingly high (440 ppb, Ryans et al. 1996). The A(Ca II)-N(H I) relation (Wakker & Mathis 2000) predicts valuesthat are a factor ∼3 lower, i.e. the Ca II abundance incomplex gp is relatively high compared to expectations.
3.9.4. Correlations between N(Na I), N(Ca II) andvelocity
For the IVCs and HVCs no evidence exists for a correla-tion between velocity and Na I (or Ca II) column density(Fig. 2c, d). For low-velocity gas, Routly & Spitzer (1952)found that the column density ratio N(Ca II)/N(Na I) in-creases with LSR velocity. Vallerga et al. (1993) show thatthe effect occurs when studying nearby (<100pc), low-velocity (<20 km s−1) gas, while Sembach & Danks (1994)find a correlation of this ratio with the deviation velocity(the difference between the observed LSR velocity and themaximum velocity that is expected from a simple modelof galactic rotation), but only for gas with LSR velocitiesbelow 50 km s−1. This effect is usually interpreted as show-ing that Ca is less depleted at higher peculiar velocities.Fig. 2e and f show that the Ca II/Na I column density ra-tio does not depend on velocity for sightlines through IVCsand HVCs. This is not entirely unexpected since for theHVCs/IVCs the LSR velocity is not a good measure of thepeculiar velocity relative to their surroundings. Further, itshould be noted that components at higher velocity tendto have lower column density. Wakker & Mathis (2000)showed that on average the abundance of Na I is indepen-dent of N(H I), whereas A(Ca II) is larger at lower N(H I).
Thus the Ca II/Na I ratio depends on N(H I), which tendsto be lower at higher velocity.
3.9.5. Implications of the Na I and Ca II results
Na I varies by a factor >10 within clouds and by aneven larger factor between clouds. Ca II also shows a largerange (a factor >100), although at any given H I columndensity the range is more like a factor 10), and within anygiven cloud the range is a factor up to ∼5.These results can be used to derive a safety factor for
interpreting the significance of a non-detection of Na I orCa II. This is discussed in more detail in Appendix A, un-der the description of Col. 18. In summary, H I small-scalestructure requires a safety factor ∼2. For both Na I andCa II the depletion is uncertain by a factor ∼2.5. Theionization is uncertain by a factor ∼2 for Ca II, ∼5 forNa I. Finally, if the ion abundance in the cloud has tobe assumed (rather than being measured toward anotherprobe), a final factor ∼2 is needed.Thus, in practice non-detections of Na I never result
in a lower limit to a cloud distance, as the combinedsafety factor needs to be 25−50. Since at an abundanceof 4.6 ppb τ(Na I D2) is 0.022 (N(H I)/1019), a significantnon-detection requires a spectrum with S/N>1000−2000(1019/N(H I)). Thus, although Na I tends to be the easiestinterstellar line to observe, it is hard to determine upperlimits to HVC/IVC distances and not useful for determin-ing lower limits. None of the published non-detections canbe considered to give a significant lower distance limit.Ca II gives much stronger absorption than Na I (τ(Ca II
K) is 0.13 (N(H I)/1019) for a standard abundance of 22ppb). Thus a spectrum with S/N>75−100 (1019/N(H I))can yield a lower distance limit. However, it remains neces-sary to deriveA(Ca II) for any given cloud. Also, such S/Nratios are difficult to achieve for the more distant, fainterstars that will be needed to derive distances to HVCs.
3.10. Highly-ionized species
For the high ionization ions (C IV, N V, Si IV), the re-sults of Sembach & Savage (1992) were used to providefiducial values for the column density. They found that,on average, N(C IV)=1.6×1014 cm−2 toward the Galacticpole. Averages for the other ions follow from the aver-age ratios they give, yielding 3.5×1013 cm−2 for N V, and4.4×1013 cm−2 for Si IV.Preliminary results for halo O VI were presented by Sav-
age et al. (2000b), showing column densities in the range1−7×1014 cm−2. The polar value (the average of N sin b)is about 2×1014 cm−2.
C IV − High-velocity C IV is observed in the OuterArm (H1821+643 − Savage et al. 1995), complex GCN(Mrk 509 and PKS2155−304 − Bruhweiler et al. 1993,Sembach et al. 1999), in the +65 and +120km s−1 IVCstoward the LMC (Savage & Jeske 1981, Savage et al.1989, Bomans et al. 1996), IV6 (HD93521 − Spitzer &Fitzpatrick 1992), IV9/IV19 (HD121800 − Howk et al.2001), LLIV1 (SN 1993J − de Boer et al. 1993), andthe PP Arch (HD215733 − Fitzpatrick & Spitzer 1997).The more reliable determinations have column densitiesin the range 2.4−6.0×1013 cm−2, i.e. a factor 3−6 belowthe typical value though the Galactic halo. Higher val-
11
ues exist toward Mrk 509 (>1.6×1014 cm−2) and SN1993J(>2×1014 cm−2).
N V − N V was observed but not detected toward 5 AGNswith high-velocity gas in the sightline (H 1821+643− Sav-age et al. 1995, Fairall 9 − Lu et al. 1994b, NGC 3783 − Luet al. 1994a, Mrk 509 and PKS2155−304− Sembach et al.1999), although the upper limits are only 1−5×1013 cm−2,i.e. comparable to the total amount through the Galactichalo. A small amount of high-velocity N V was found incomplex WE, toward HD156359, with a column densityof 5.8×1012 cm−2 (Sembach et al. 1995).
O VI − Sembach et al. (2000) found high-velocity O VIabsorption associated with complex C (Mrk 876), com-plex GCN (toward Mrk 509 and PKS2155−304), theMagellanic Stream (three sightlines) and the Outer Arm(H 1821+643), with column densities that are a significantfraction of the total O VI column density in these direc-tions. High-velocity O VI absorption has not been foundin other AGNs that are not projected on or close to apreviously-known H I HVC.
Si IV − High-velocity Si IV was found toward Mrk 509(Sembach et al. 1999) and SN1993J (de Boer et al. 1993)with column densities of ∼2.5×1013 cm−2. Intermediate-velocity Si IV has been detected toward IV6 (HD93521− Spitzer & Fitzpatrick 1992), LLIV1 (SN 1993J − deBoer et al. 1993), the PP Arch (HD215733 − Fitzpatrick& Spitzer 1997), and the +65 and +120km s−1 HVCtoward the LMC (Savage & Jeske 1981, Savage et al.1989). The measured column densities range from 5.9 to82×1012 cm−2, where for low-velocity gas values between50 and 100×1012 cm−2 are typical for the galactic latituderange of the probes.
4. NOTES ON INDIVIDUAL CLOUDS
In this section, some remarks are made concerning themetallicity and distance determinations for each listedcloud. For about half the clouds a map is presented thatshows the positions of the probes relative to the H I. Fur-ther, for 18 clouds the pattern of abundances is plotted inFig. 3, where it is compared to the standard patterns forcool disk, warm disk and halo gas.An estimated mass range is given for most of the clouds,
using the observed distance range. For the HVCs the massis based on the integrated flux measured by Hulsbosch& Wakker (1988). The flux, S, is converted to an H Imass (MHI = 0.236 (S/Jy km s−1) (D/1 kpc)2 M⊙. Inthe case of IVCs, a column density map is made using theLDS survey, and this is summed over an irregular regionoutlining the cloud. Since each beam represents an areaA=7.25×1038 cm2 at a distance of 1 kpc, the sum is mul-tiplied by A*mH
M⊙to obtain the cloud mass at a distance
of 1 kpc. In both cases, a (hopefully typical) factor 1.2is included to account for ionized hydrogen, and a factor1.39 is included to account for helium.
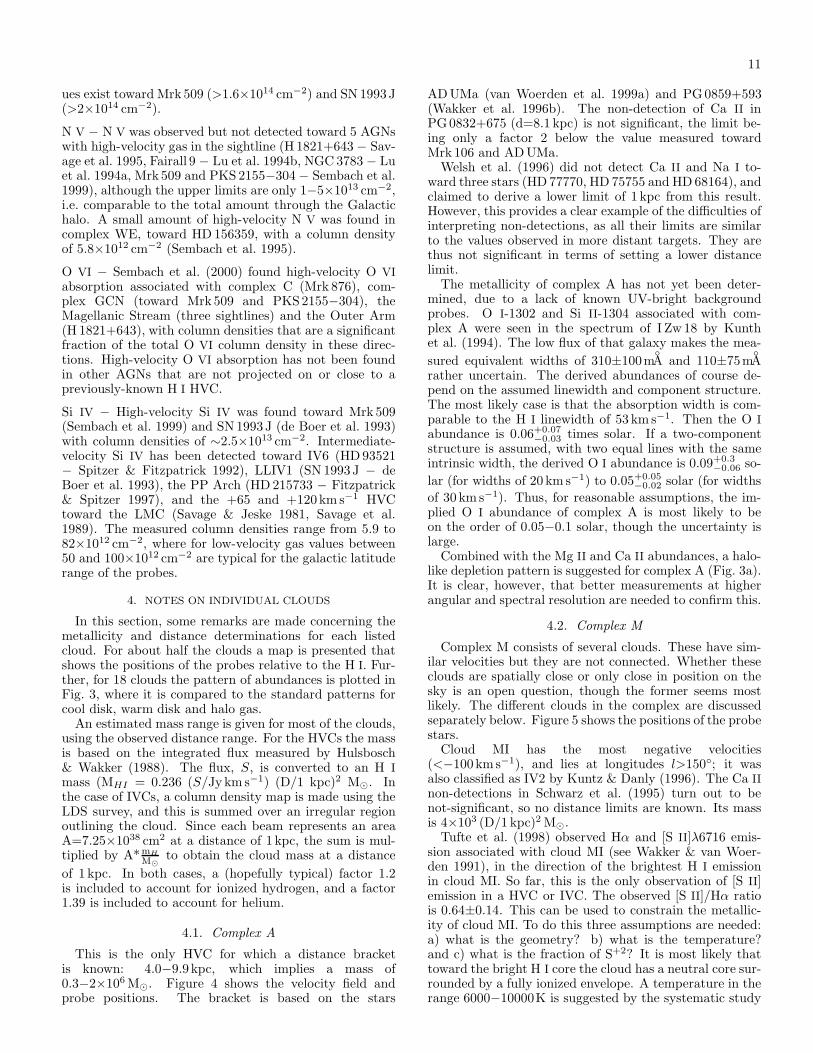
4.1. Complex A
This is the only HVC for which a distance bracketis known: 4.0−9.9 kpc, which implies a mass of0.3−2×10⁶M⊙. Figure 4 shows the velocity field andprobe positions. The bracket is based on the stars
ADUMa (van Woerden et al. 1999a) and PG0859+593(Wakker et al. 1996b). The non-detection of Ca II inPG0832+675 (d=8.1 kpc) is not significant, the limit be-ing only a factor 2 below the value measured towardMrk 106 and ADUMa.Welsh et al. (1996) did not detect Ca II and Na I to-
ward three stars (HD 77770, HD 75755 and HD68164), andclaimed to derive a lower limit of 1 kpc from this result.However, this provides a clear example of the difficulties ofinterpreting non-detections, as all their limits are similarto the values observed in more distant targets. They arethus not significant in terms of setting a lower distancelimit.The metallicity of complex A has not yet been deter-
mined, due to a lack of known UV-bright backgroundprobes. O I-1302 and Si II-1304 associated with com-plex A were seen in the spectrum of I Zw18 by Kunthet al. (1994). The low flux of that galaxy makes the mea-
sured equivalent widths of 310±100m◦
A and 110±75m◦
Arather uncertain. The derived abundances of course de-pend on the assumed linewidth and component structure.The most likely case is that the absorption width is com-parable to the H I linewidth of 53 km s−1. Then the O Iabundance is 0.06+0.07
−0.03 times solar. If a two-componentstructure is assumed, with two equal lines with the sameintrinsic width, the derived O I abundance is 0.09+0.3
−0.06 so-
lar (for widths of 20 km s−1) to 0.05+0.05−0.02 solar (for widths
of 30 km s−1). Thus, for reasonable assumptions, the im-plied O I abundance of complex A is most likely to beon the order of 0.05−0.1 solar, though the uncertainty islarge.Combined with the Mg II and Ca II abundances, a halo-
like depletion pattern is suggested for complex A (Fig. 3a).It is clear, however, that better measurements at higherangular and spectral resolution are needed to confirm this.
4.2. Complex M
Complex M consists of several clouds. These have sim-ilar velocities but they are not connected. Whether theseclouds are spatially close or only close in position on thesky is an open question, though the former seems mostlikely. The different clouds in the complex are discussedseparately below. Figure 5 shows the positions of the probestars.Cloud MI has the most negative velocities
(<−100kms−1), and lies at longitudes l>150◦; it wasalso classified as IV2 by Kuntz & Danly (1996). The Ca IInon-detections in Schwarz et al. (1995) turn out to benot-significant, so no distance limits are known. Its massis 4×10³ (D/1 kpc)2 M⊙.Tufte et al. (1998) observed Hα and [S II]λ6716 emis-
sion associated with cloud MI (see Wakker & van Woer-den 1991), in the direction of the brightest H I emissionin cloud MI. So far, this is the only observation of [S II]emission in a HVC or IVC. The observed [S II]/Hα ratiois 0.64±0.14. This can be used to constrain the metallic-ity of cloud MI. To do this three assumptions are needed:a) what is the geometry? b) what is the temperature?and c) what is the fraction of S+2? It is most likely thattoward the bright H I core the cloud has a neutral core sur-rounded by a fully ionized envelope. A temperature in therange 6000−10000K is suggested by the systematic study

12 Ion Abundances in HVCs and IVCs
of Hα and [S II] emission at heights up to 1 kpc abovethe Perseus arm (Haffner et al. 1999). They also find thatN(S+2)/N(S+) lies in the range 0.3−0.7. With this rangeof parameters, the S+ abundance of cloud MI has a mostlikely value of ∼0.8 solar, but is only restricted to lie in therange 0.4−1.8 times solar. That is, a metallicity of ∼0.1solar such as that found for complex C (see Sect. 4.3) isexcluded, and the most likely value is consistent with theidea that complex M is part of the IV Arch, for which nearsolar metallicity has been found (see Sect. 4.24).Toward lower longitudes, the velocity of MI changes to
∼−80km s−1. This part was classified as IV4 by Kuntz& Danly (1996) and is probably part of the IV Arch (seeSect. 4.24). Behind IV4 lies SN1998S, which was observedby Bowen et al. (2000). The Ca II, Mn II and Fe II abun-dances (3.3, 44 and 1600 ppb) are more like those in warmdisk gas (6.9, 42 and 1800 ppb) than like in halo gas (69,87 and 7800 ppb) (see also Fig. 3e). The same can be saidfor the abundance ratios (e.g. Ca II/Mn II=0.08 in IV4,0.16 in warm gas and 0.79 in halo gas). Such abundancesare consistent with the small distance of 0.6−0.8 kpc(z=0.5−0.7kpc) that can be derived by combining the de-tection of Si II toward BD+49 2137 with the non-detectionof Si II toward HD106420 (Kuntz & Danly 1996). Ryanset al. (1997a) did not detect Ca II toward BD+49 2137 nortoward PG1213+456 (at 2.9 kpc), but the limits of <2.1and <50 ppb are not inconsistent with the value of 3.3±0.9ppb found toward SN1998S. Note also that the distanceof BD+492137 was revised from 1.8 kpc (Kuntz & Danly1996) to 0.8 kpc by Ryans et al. (1997a). It remains to beseen whether this distance bracket applies to the higher-velocity part of cloud MI. The mass of IV4 is constrainedto the range 1.5−2.5×10³M⊙.In the gap between clouds MII and MIII lie BD+38 2182
and HD93521, which are just 3′ apart, C II, O I, Si II andCa II absorption at the velocity of MIII are clearly seentoward BD+382182, and clearly absent toward HD93521(Danly et al. 1993). Taking the distance to BD+38 2182from Ryans et al. (1997a), this sets an upper limit on thedistance of MII/MIII of 4.0 kpc and an upper limit on themass of 6×10⁴M⊙. However, no strong lower limit canbe derived from HD93521, as a 12′ beam H I spectrumshows no emission at the velocity of the absorption to-ward either star, down to a 5-σ limit of 0.5×1018 cm−2
(Ryans et al. 1997a). If H+ were present, no O I absorp-tion is expected, but C II and Si II should still be seen. Itremains unclear whether the high-velocity absorption to-ward HD93521 is absent because the cloud is behind thestar or because there is no high-velocity material in thesightline. The position in the sky of MII/MIII and theirvelocity strongly suggest that these clouds are part of theIV Arch. A lower distance limit of 1.9 kpc would then beat odds with the other distance brackets derived for theIV Arch (see Sect. 4.24).Ryans et al. (1997b) and Lehner et al. (1999a) reported
Ca II absorption at a velocity of −108km s−1 in the spec-trum of HD83206. No H I is seen at this velocity down toa limit of 2×1018 cm−2. The nearest H I cloud with similarvelocity in the HVC survey of Hulsbosch & Wakker (1988)is 1.◦5 away (cloud WW63; vLSR=−112km s−1; l=166◦,b=46◦), although this faint cloud can not be discerned inthe Leiden-Dwingeloo Survey. Just north of this position
are the southernmost clouds of complex M (specificallyWW51 and WW39, as well as some uncatalogued clouds,all with velocities ∼−120 to ∼−100km s−1). Quite possi-bly the weak Ca II absorption is associated with these faintH I clouds that line the edge of complex M. The impliedhigh Ca II abundance is consistent with the abundance vsH I column density relation found by Wakker & Mathis(2000).
4.3. Complex C
Since complex C covers a large area of the sky (1600square degrees), and since it contains a number of well-defined cores, it was split into 5 parts in Table 2. CI-A,B,C and CIII-A,B,C were defined by Giovanelli et al.(1973). “C-south” refers to the lower-latitude part of C atlongitudes >80◦ (for a precise specification see Note 30).The core at l=68◦, b=38◦ (“CeI”) was previously named“C-extension” by Giovanelli et al. (1973). Here, cores CeIthrough CeV are defined by analogy. Complex D was de-fined by Wakker & van Woerden (1991); core “CD” withincomplex C is defined here as the core at l=90◦, b=34◦,vLSR<−150kms−1, which is close to complex D and hassimilarly high-negative velocities. Finally, core C/K isdefined as the core at l=75◦, b=37◦, vLSR∼−90kms−1,which lies close in angle and velocity to IVC complex K,and may be part of that complex, rather than a core ofcomplex C. A detailed analysis of the spectra in this re-gion is called for.The distance to HVC complex C is not well known.
Ca II absorption was measured toward Mrk 290 andPG1351+640, so that good abundance comparisons canbe made for distance-determination purposes. However,toward both of these the component structure is slightlycomplicated. A best-guess fit yields two components to-ward Mrk 290 with Ca II abundances of 12±3 and 22±1ppb, while toward PG1351+640 abundances of 18±2 and110±50 ppb are found. The last value is for a low-columndensity component with uncertain N(H I), and thus thefact that it differs from the other three is probably notsignificant.Figure 6 shows the positions of the probes. Most obser-
vations of stellar probes lead to a non-detection, but donot give significant distance information, usually becauseN(H I) is small. Most of the few significant non-detectionsare toward rather nearby stars, giving a strong lower dis-tance limit of 1.2 kpc. Limits were set on A(Ca II) forseven distant (>3 kpc) stars. However, only one of theseis significant (BS 16034-0114 at 6.1 kpc), although a betteranalysis of these spectra is still needed. For BS 16034-0114the ratio (expected)/(observed) is ∼10, which thus yieldsa (weak) lower limit of 6.1 kpc to the distance of core CIA.The strong lower distance limit gives a mass for complex Cof >105M⊙, but the probable lower limit of 6.1 kpc yieldsM>3×10⁶M⊙.Complex C is the only cloud for which several different
metallicity measurements have been made, although in allcases there are some special considerations or special prob-lems to be solved. S II-1250 and/or 1253 and/or 1259 havebeen measured toward 3 AGNs projected onto complex C:Mrk 290 (Wakker et al. 1999b) and Mrk 817, Mrk 279 (Gib-son et al. 2001). N I was measured toward Mrk 876 (Gib-son et al. 2001, Murphy et al. 2000) and PG1259+593

13
(Richter et al. 2001b), while O I/H I has been measuredtoward PG1259+593 (Richter et al. 2001b).The best determination is the one using Mrk 290, where
N(H I) is measured at 2′ resolution and Hα was de-tected. The result is N(S)/N(H)=0.09±0.02 times so-lar, with a small dependence on the assumed distanceand geometry. The measurement toward Mrk 817 yieldsN(S II)/N(H I)=0.33±0.02 solar, while that towardMrk 279 gives 0.43±0.10 solar. In both cases the (un-known) ionization correction may be high, as N(H I)in these directions is much lower than toward Mrk 290,whereas N(H+) is expected to be more or less constant ifthe hydrogen is photoionized. High-resolution H I mapsare also imperative to understand the difference betweenthe Mrk 290 and Mrk 817/279 sightlines.One other sightline with high N(H I) has been
studied: PG1259+593 (Richter et al. 2001b). HereO I/H I=0.11+0.13
−0.08 solar. Richter et al. (2001b) also findthat N I/HI=<0.046 solar, as well as Si II/O I∼1, butFe II/O I∼0.4. No H2 was detected (fraction <10−5), butthis is not unexpected considering the relatively low totalhydrogen column density and the relatively small amountof dust expected to go with the low metallicity. If thereis no or little dust, the N I, O I, Si II and Fe II abun-dances are consistent with an enhancement in the α ele-ments (Si/O>1), combined with a relatively low amountin the iron peak elements (Fe/O<1) and no secondary ni-trogen (N/O<0.5). This is consistent with the idea thatthat the heavy elements in complex C were created in typeII supernovae, and that there has been no subsequent starformation.The sightline toward Mrk 876 was analyzed by Murphy
et al. (2000). It shows unusual abundances. Nominallyundepleted elements have low abundances relative to H I(A(N I)∼0.08 solar, A(P II)<0.8, A(Ar I)<0.1 solar), con-sistent with the values found using the other probes. How-ever, the usually depleted Fe II has a high abundance(A(Fe II)=0.5). The probable interpretation in this caseis that in the region around the sightline toward Mrk 876the gas is partially photo-ionized throughout by a soft ra-diation field, so that H I is a ∼25% contaminant. ThenAr and N can become overionized relative to H, unlike Fe,which remains in the form of Fe II (Sofia & Jenkins 1998).Nevertheless, the maximum ionization correction consis-
tent with the absorption line and Hα data in the directionof Mrk 876 seems to be on the order of a factor 3−5. SinceS/H=0.1, this implies Fe/S∼1−2. Such a ratio is veryunlike the typical ratio of 0.2 seen in halo gas (Sembach& Savage 1996) or in other HVCs and IVCs (this paper).The implication is that complex C appears to have lowdust content. This is further supported by the Si II/O Iand Fe II/O I ratio toward PG1259+593 (Richter et al.2001b).From the results described above, it has become clear
that in order to derive reliable abundances and abundanceratios, it will be necessary to observe Hα emission for ev-ery probe, to pay close attention to ionization correctionsand unusual circumstances, and to combine the absorptionand emission data with modeling.
4.4. Complex G
This HVC has velocities that deviate only slightly fromthose allowed by differential galactic rotation, especiallyat the lowest latitudes. A better definition is needed. Thenon-detections of several elements with strong lines in thespectrum of 4Lac are not commented upon by Bates et al.(1990), but they do set a (not unsurprising) lower limit of1.3 kpc, and thus a mass limit >5×10⁴M⊙.
4.5. Complex H
This HVC complex lies in the Galactic plane, which al-lows the use of luminous O and B stars as probes. So far,only a lower distance limit has been set, using the non-detection of Mg II, C II and O I in IUE spectra (Wakkeret al. 1998). Centurion et al. (1994) did not see Ca IIabsorption in seven stars projected onto complex H, butonly one of the non-detections can be considered signifi-cant (assuming complex H has a Ca II abundance similarto that seen in other HVCs).Figure 7 shows the positions of the probes. The HVC
can be subdivided into several parts, although these areprobably all spatially connected, as there are no clearboundaries. The distance limit for the brightest, central,core is d>5 kpc, which implies a mass for the whole com-plex of >106M⊙.
4.6. Anti-Center Shell
The Anti-Center Shell (Fig. 8) was first delineated byHeiles (1984). Tamanaha (1997) made a detailed studyof the region and argued that the Shell as such does notexist, but is an artifact of the data display being based onchannels at constant vLSR. He rather sees it as the pointof impact of a stream of HVCs falling toward the plane −the Anti-Center HVCs (Sects. 4.8, 4.9) being the rest ofthat stream.Kulkarni & Mathieu (1986) failed to find Ca II absorp-
tion toward 6 OB stars in the direction of the Shell. Theyput the most distant star (HDE248894) at 2.7 kpc (recal-culated here as 3.0 kpc). The abundance of Ca II has notyet been measured, so although A(Ca II) is <15% of the“normal” value, the non-detection is not considered signif-icant.Kulkarni & Mathieu (1986) also observed HDE256725,
classified as an O-star at d<2.5 kpc. The non-detectionof Ca II is not significant (a factor 5 below the expectedvalue, rather than a factor >20). According to SIMBAD,this is a B-star, but Garmany et al. (1987) classified it asO5V and gave a distance of 8.0 kpc. If confirmed and reob-served with higher S/N, this star might set an upper/lowerdistance limit of 8.0 kpc.
4.7. Cloud AC0
Cloud AC0 was defined by Tamanaha (1997), by anal-ogy with the chain of cores ACIII, ACII, ACI (see Fig. 9).It is embedded in the Anti-Center Shell, but stands out invelocity space. Tamanaha (1996) failed to find Ca II andNa I absorption toward 4 stars. None of the Na I non-detections are significant, however (the best being only afactor 9 below the average expected value), but the Ca IInon-detection sets a weak lower limit of just 0.3 kpc. Notethat Tamanaha (1996) includes LS V+30 31 as a probe ofAC0, but the Effelsberg H I spectrum shows that this starlies just off the core.

14 Ion Abundances in HVCs and IVCs
4.8. Clouds ACI and ACII
Two studies of Na I and Ca II absorption were madefor these two clouds, using bright (V<10) B and A stars(Songaila et al. 1988, Tamanaha 1996). See Fig. 9 forthe positions of the probes. Again, none of the Na Inon-detections contains distance information, whereas theCa II non-detections toward ACI are mostly significant,setting a lower limit of 0.4 kpc to the distance. This is anot very interesting limit, as the expected distance is onthe order of several to tens of kpc, if indeed the AC cloudsare infalling intergalactic clouds, as proposed by Mirabel(1982) and Tamanaha (1995, 1997).The same set of stars probes H I components assigned
to ACII, which partly overlaps with ACI. However, sincethe column densities associated with ACII are lower, mostnon-detections are not considered significant.
4.9. Cohen Stream and HVC168−43+280 (cloudWW507)
Two studies of absorption were made for these twoclouds, using bright (V<10) B and A stars (Kemp et al.1994, Tamanaha 1996, see Fig. 9). None of the Na I non-detections and only one of the Ca II non-detections aresignificant. However, from Mg II non-detections a lowerdistance limit of 0.3 kpc is set. Weiner et al. (2001) de-tect Hα emission from three directions in cloud WW507,with intensities of 50−250mR (1 Rayleigh is 10/4π pho-tons cm−2 s−1 sr−1). Applying a model for the distributionof ionizing radiation (Bland-Hawthorn & Maloney 1999)then suggests distances on the order of 10−20kpc.Kemp & Bates (1998) searched for, but did not detect
Na I absorption toward the Seyfert galaxy Mrk 595. They
calculated an expected value for EW(Na I) of ∼30m◦
A(1.3×1011 cm−2), assuming that the Na I abundance issimilar to that seen in low-velocity gas. Since their detec-
tion limit is 21m◦
A, and considering the large observed vari-ations in A(Na I) (see Sect. 3), this non-detection containsno information about the conditions in the Anti-Centerclouds.
4.10. Complex GCN
These widely scattered, faint clouds have high negativevelocities. High-ionization C IV and Si IV absorption wasseen in the spectra of Mrk 509 and PKS2155−304 by Sem-bach et al. (1995, 1999), as was O VI (Sembach et al. 2001).Sembach et al. (1999) proposed that a) the gas is photo-ionized by the extra-galactic background radiation and b)the thermal pressure in the sightlines is ∼1−5K cm−3, c)the distance of the gas is 10−100kpc (depending on themetallicity, which was assumed to lie between 0.1 and 1times solar). If it is assumed that the H I clouds in com-plex GCN are the denser and cooler tips of the iceberg ofa large, coherent, mostly ionized cloud, then the impliedcloud size is 8−80kpc. These parameters are consistentwith this (group of) clouds being a low-metallicity, tenu-ous, extra-galactic cloud.If the metallicity is eventually found to be ∼0.1 solar,
complex GCN may represent an early stage in the processproposed by Oort (1970), in which hot gas at the outskirtsof the sphere of influence of the Milky Way condenses andthen accretes. Complex C may be a late stage.
4.11. Complex GCP
Although there are many bright stars as well as distantRRLyrae stars projected on this cloud, the only publisheddata are from the first-ever paper concerning HVC absorp-tion lines (Prata & Wallerstein 1967). The non-detectiontoward HD187350 sets a lower distance limit of 0.3 kpc(and thus a lower mass limit of 103M⊙). Bland-Hawthornet al. (1998) detected Hα emission associated with com-plex GCP, and argued that it is related to the Sagittariusdwarf, at a distance of ∼25kpc. However, if this cloud isrelated to lower velocity gas that seems connected to it,its distance can be no more than a few kpc (see Sect. 4.29for further discussion).
4.12. Outer Arm
The Outer Arm was first recognized as a separate, dis-tant spiral arm by Habing (1966). It was further analyzedby Kepner (1970) and Haud (1992). The velocities are only20−30kms higher than expected from a flat rotation curvefor gas at galactocentric radii of 15−25kpc. Toward l∼90◦
a large kinematical leverage is provided, allowing one tostudy the outer Galaxy. In the direction to H1821+643,high-ionization C IV absorption was found by Savage et al.(1995), while O VI was reported by Oegerle et al. (2000)and Sembach et al. (2000).
4.13. Cloud R
This feature was defined by Kepner (1970), and may beassociated with the Outer Arm, or it may be a separate,distant HVC.
4.14. Magellanic Stream
The Magellanic Stream is most likely a tidal tail tornout of the SMC during the tidal interaction between theMilky Way, LMC and SMC one orbit (2Gyr) ago (Gar-diner & Noguchi 1996). Some of the gas has been deceler-ated, forming the well-known Stream, and some of it hasbeen accelerated ahead of the SMC system. Most of thelatter fell on the LMC, but some has gotten past, forminga scattered leading arm. Lu et al. (1998) identified theextreme-positive-velocity clouds of Wakker & van Woer-den (1991) as part of this leading arm. Fig. 10 shows theStream and these clouds in a projection that has galacticlongitude 270◦ along the equator. Overlaid is the modelof Gardiner & Noguchi (1996).This projection was chosen as the simplest way to make
the Magellanic Stream lie as near the equator as possible.This is basically done by turning the great circle l=90◦
and l=270◦ into the equator. Formally, the pole lies atgalactic longitude l=180◦, galactic latitude b=0◦, and itis further rotated by 33.42779 degrees so that the currentposition of the LMC has new longitude L=0.The distances to the trailing and leading parts of the
stream are not well known. If 50 kpc is assumed, the massof the trailing part of the stream is about 1.5108M⊙ (notcounting the gas in the Magellanic Bridge, at galactic lat-itudes >−45◦). For the leading part, all clouds in com-plex EP of Wakker & van Woerden (1991) add up to about5×107M⊙ at an assumed distance of 50 kpc. The modelpredicts distances ranging from 50 to 100kpc for this gas.

15
Also added in Fig. 10 are some small positive-velocityclouds in the northern Galactic hemisphere that werenot considered part of HVC complexes WA and WB byWakker & van Woerden (1991). These appear to line upahead of the curve defined by the SMC orbit and the EPclouds near l=290, b=+20 (60,−20 in Fig. 10), althoughthey are not in the orbital plane of the Magellanic Clouds.For further discussion of these small clouds, see Sect. 4.22.The tidal model predicts a metallicity similar to that
of the SMC. For sulphur that means S/H∼0.2−0.3 solar(Russel & Dopita 1992). Indeed, such values are foundtoward Fairall 9 in the tail (0.33±0.05 solar, Gibson et al.2000) and NGC3783 in the leading arm (0.25±0.08 solar,Lu et al. 1998). For NGC3783 N(H I) was measured at1′ resolution by combining ATCA and Parkes data. Nohigh-resolution H I map has yet been made for the fieldaround Fairall 9; a 25% correction is easily possible. Inboth directions a measurement of Hα will be needed toaccount for H+, although N(H I) is high enough and theradiation field is expected to be low enough that only asmall correction is expected.Although the distance to different parts of the Stream
is expected to be 30−80kpc, no formal limit can be set,as only non-significant non-detections have been found to-ward a few nearby stars. Considering the large sky areacovered by the Magellanic Stream, it is possible that morenon-detections lie hidden in the literature, in papers notaimed at studying the ISM, and therefore not noted.Several AGNs behind the Magellanic Stream were ob-
served with the FOS. Savage et al. (2000a) report equiv-alent widths for detections of Mg II; Jannuzi et al. (1998)give the wavelength offsets, from which velocities are calcu-lated. Although the velocity resolution is only 220km s−1,this is sufficient to separate absorption by the MagellanicStream from that by disk gas. As the H I profiles arebroad (30−50km s−1; see Paper II), the estimated Mg IIoptical depths are 0.2−3, allowing to convert the equiv-alent widths to column densities. Figure 1a shows theresulting correlation between N(H I) and A(Mg II). ForN(H I)>2×1018 cm−2, A(Mg II) is nearly constant (av-erage 3600 ppb, or 0.10 times solar). At lower N(H I)much higher values and lower limits are found. The mostlikely explanation for this change is that the hydrogen be-comes mostly ionized, as the ionization potential of Mg IIis higher than that of hydrogen, while its depletion seemsto be independent of N(H I) (Wakker & Mathis 2000). Theaverage abundance of 0.10 times solar implies an Mg II de-pletion of 0.3−0.4 for the Magellanic Stream, i.e., similarto the value in halo gas.Abundances in the Stream can also be derived for Ca II,
Fe II and Si II, see Fig. 3c. The table in Jannuziet al. (1998) gives Fe II toward PKS0637−75 near theSMC, which yields A(Fe II)=0.062±0.025 times solar. Inthe leading arm, NGC 3783 gives A(Fe II)=0.033±0.006times solar. The implied ratios of Fe/S=0.18±0.06 and0.13±0.05 times solar are similar to the typical ratio inhalo-like gas (0.23). The Mg II and Fe II abundances bothimply that there is dust in the Magellanic Stream, andthat it has properties similar to the dust in the GalacticHalo.
4.15. Population EP
Several of the extreme-positive velocity clouds have beenstudied. Cloud WW187 was discussed above, in the con-text of it being part of the leading arm of the MagellanicStream.Sahu & Blades (1997) and Sahu (1998) observed
NGC1705 with a velocity resolution of 140km s−1 andfound absorption at vLSR∼+260km s−1 in several Si IIlines. This was interpreted as being associated with HVCWW487, which has vLSR=+240km s−1 and is 2 degreesaway from NGC1705; it is probably a shred of the Magel-lanic Stream (see Fig. 10). A map of this area was madeby Putman (priv. comm.) using HIPASS data, after re-processing in order to extract extended structure. Thisclearly shows WW487, but no other HVCs in the area.Faint (1.7×1018 cm−2) high-velocity H I is detected di-rectly in the sightline toward NGC1705 (Paper II). Si II-1190, Si II-1304 and Si II-1526 absorption are clearly seen,but the listed equivalent widths are inconsistent. The de-rived abundances are 0.48±0.14, 2.9±1.5 and 2.9±1.5, re-spectively. This poses an unsolved problem. However, theresult does suggest that most of the gas in this directionis in the form of H+.Sahu (1998) also lists an equivalent width for N I-1199,
but at 140 km s−1 resolution this absorption is a hope-less blend of λ1199.55 and λ1200.22 absorption due to theGalaxy, the HVC and NGC1705.The only cloud in population EP for which a formal dis-
tance limit exists is cloud WW187. HD 101274 is a fewarcmin from NGC3783 and sets a lower limit of 0.4 kpc.Wakker & van Woerden (1997) listed a lower limit of6.2 kpc to the distance of the extreme-positive velocitycloud WW211, based on the non-detection of Si II towardHD86248 by Danly et al. (1993). The revised distance ofthis star is 7.6±3.0 kpc. Since WW211 is part of the lead-ing arm of the Magellanic Stream, the expected Si II abun-dance is a factor 4 below the standard halo value of 19000ppb, i.e. ∼5000 ppb. The observed limit of 3300 ppb maytherefore not be significant, and the non-detection doesnot set a lower limit to the distance of cloud WW211 afterall.
4.16. Very-high-velocity clouds
The sightline to Mrk 205 passes through HVC WW84,which has vLSR=−202km s−1. Bowen et al. (1991a, 1991b)detected weak Mg II absorption from this cloud. The H Icolumn density has not yet been properly measured to-ward this object. In the 9.′1 Effelsberg beam it appearsto be 15×1018 cm−2. However, as the high-resolution (1′)WSRT map presented by Braun & Burton (2000) shows,such a beam picks up some of the very bright small-scalestructure that lies nearby. A proper correction requires tocombine the WSRT map with a grid of single-dish data toproduce a fully-sampled interferometer map. This has notyet been done. In the meantime, the best guess for N(H I)is 8±5×1018 cm−2. This yields an Mg II abundance of0.020±0.014 times solar.This value is much lower than usual in halo gas (0.4 so-
lar is typical for gas with intrinsically solar abundance),and even lower than is found in cool disk gas with largeamounts of dust (0.03 times solar). A value near 0.02 so-lar can also be found in a low-metallicity cloud. If thereis some dust, the intrinsic metallicity could be ∼0.05−0.1

16 Ion Abundances in HVCs and IVCs
solar. Confirmation using other absorption lines is needed,as well as an improved value for the H I column densityand an assessment of the ionization correction.Combes & Charmandaris (2000) report a possible detec-
tion of HCO+ at −198kms−1 in the spectrum of the radiocontinuum source 1923+210 in a direction lying betweenthe VHVCs WW274 (vLSR=−200km s−1) and WW283(vLSR=−198kms−1). If the ratio of HCO+ to H2 weresimilar to that found in low-velocity gas (6×10⁻⁹, Lu-cas & Liszt 1996), this would imply N(H2)=7×1019 cm−2,whereas the observed limit to N(H I) is <2×1018 cm−2.Clearly, this cloud is unusual in that it either has largemolecular content, or relatively high HCO+ abundance.These VHVCs may be outliers of the GCN complex, out-liers of the Magellanic Stream, or genuine isolated VHVCs;their position in the sky does not allow an unambiguousidentification.
4.17. Complex L
Albert et al. (1993) reported Ca II absorption com-ponents at −98 and −127km s−1 in the spectrum ofHD135485, thought to be a B5IIp star at a distance of2.5 kpc. Van Woerden (1993) suggested that this absorp-tion is due to complex L, but Danly et al. (1995) showedthat interstellar C II, O I and Si II absorption are absentat these velocities, implying that the Ca II componentsare circumstellar. They also reclassified HD135485 andrevised the distance down to 0.8 kpc. According to Hip-parcos, the parallax is 5.52±1.13 mas, which gives an evenlower distance of 0.18±0.04kpc. Thus, in spite of ear-lier suggestions, all that is known for complex L throughHD135485 is a lower limit to its distance of 0.2 kpc.Weiner et al. (2001) find that complex L shines brightly
in Hα emission, with detections of 0.3−1.7Rayleigh(=106/4π photons cm−2 s−1 sr−1). [N II] λ6583 emission issimilarly strong, with [N II]/Hα= 1.1. Applying a modelfor the distribution of ionizing radiation (Bland-Hawthorn& Maloney 1999) then suggests that complex L lies ata distance of 8−15kpc, and 2−10kpc above the galac-tic plane, either near the Galactic Center or at the otherside of the Center. Of course, because of individual fea-tures such as spiral arms, the radiation model is least ac-curate close to the Galactic plane and close to the GalacticCenter. Nevertheless, the bright Hα emission associatedwith complex L shows that this HVC must lie in the lowerGalactic Halo.
4.18. Complex WB
Only one resolved detection is known for a previouslycatalogued HVC complex with positive velocities: Ca IIabsorption associated with cloud WW225 is seen in thespectrum of PKS0837−12 (Robertson et al. 1991). Thisgives the highest measured Ca II abundance for any HVC(280 ppb). The published value of 160 ppb was based onN(H I)=14×1018 cm−2 as measured with the Parkes tele-scope (15′ beam) whereas with the 9.′1 Effelsberg beamN(H I)=7.9×1018 cm−2. Since N(H I) is low, and noother measurements exist for cloud WW225, it is unclearwhether the high A(Ca II) is due to hydrogen ionization,to anomalously low calcium depletion or to low H I columndensity (the latter effect is discussed by Wakker & Mathis2000).
4.19. Complex WE
In the sightline to HD156359 Sembach et al. (1991)found C II, Mg II, Si II and Fe II absorption at a velocityof +110km s−1, while Sembach & Savage (1995) reportedN V at +128km s−1. Differential galactic rotation predictsvelocities between 0 and −100km s−1 in this direction.At the position of HD156359 no H I is found in the
list of Morras et al. (2000), but many small, faint HVCswith similar velocities exist nearby (Fig. 11). These in-clude some clouds previously catalogued on a 2◦×2◦ grid(WW356, WW364, WW373, WW412). With the betterview provided by the Morras et al. (2000) list, these cloudswere swept together into “complex WE”, by analogy withthe positive-velocity complexes WA through WD definedby Wakker & van Woerden (1991).It is now clear that HD156359 lies less than 1◦ away
from one of the brighter cores of this complex, which hasa velocity of +110kms−1. The star thus sets an upperlimit to the distance of the HVC of 12.8 kpc (z<3.2 kpc).Most likely, the star samples the faint outer envelope ofthis cloud. Assuming solar abundance and halo-like deple-tion, the implied value of N(H) is about 1017 cm−2. Themass of the collection of clouds forming complex WE islimited to be <2.5×10⁵M⊙.
4.20. Small positive-velocity clouds
The sightline to the star BD+10 2179 crosses a small (1square degree) cloud, WW29. Danly et al. (1993) give adistance for this star of 4.0 kpc, with spectral type “Bp”.SIMBAD does not provide a better type, so this distanceis rather uncertain. The non-detection of Si II is only afactor three below the expected value, so it may not besignificant.The presence of heavy elements in some of the small
positive-velocity clouds is suggested by wide Mg II linestoward 4C06.41 and PKS1136−13 (Savage et al. 2000a).
4.21. HVC100−7+110
In HVC100−7+110 (probed by 4Lac) several elementswere detected, giving an abundance pattern. Its velocityof +106km s−1 is opposite to that expected from differ-ential galactic rotation at a longitude of 100◦. The cloudappears to be small, and is within 200pc of the Galacticplane. It is not seen in the Leiden-Dwingeloo Survey, butit is clearly detected in spectra taken with the Jodrell Banktelescope (12′ beam) and in a high-angular resolution mapmade at Westerbork (Stoppelenburg et al. 1998). The up-per limit on its mass is 1M⊙, making it a very unusuallow-z solar-metallicity blob moving away from the plane.Bates et al. (1990) measured equivalent widths for sev-
eral elements and converted these to column densities. Forthis step they quoted a b-value of 6.5±0.5 kms−1, as de-rived from the Fe II lines. This b-value is then used toconvert the equivalent widths of the strongly saturated O IMg II and Al II lines to a column density. For a range of1 km s−1 in b, and using the listed equivalent width errors,this implies optical depths >10 for the O I and Mg II linesand >3 for Al II. Thus, all one can say is that A(O I) liesin the range 0.2−2.2 times solar, A(Mg II) in the range0.6−8.4 times solar, and A(Al II) in the range 0.3−0.8times solar, with a most likely value for Al II of 0.42 solar

17
(1300 ppb). The Fe II abundance is slightly more reliableand is 0.25±0.06 times solar (8000 ppb). The Al II andFe II abundances are comparable to the expected valuesfor a cloud with intrinsically solar abundance and halo-likedepletion (1600 and 7800 ppb, respectively).
4.22. HVCs with weak H I
In eight extra-galactic probes absorption is detected athigh velocities but without corresponding H I emission,even though the upper limits on N(H I) can be quitegood (3×1017 cm−2 in the case of SN1991T). Only towardSN 1986G is such high-velocity absorption accompaniedby a weak H I component. Below, possible explanationsare provided for all but two or three of these absorptioncomponents.An absorption that remains unexplained is the
+250km s−1 Na I component toward SN1994 I (Ho & Fil-ippenko 1995). No other positive-velocity IVCs are knownin the neighbourhood (l=104◦, b=68◦). Also mysteriousare the components at +125, +140 and +230km s−1 seentoward SN 1993J (l=142◦, b=41◦), if they are indeed unre-lated to the galaxy M81, as de Boer et al. (1993) argued.Finally, the +275km s−1 Mg II absorption seen towardPKS0232−04 (Savage et al. 2000a, l=174◦, b=−56◦) isstrange. No high-positive velocity gas is known in thispart of the sky (a few degrees from the edge of the Anti-Center HVCs, which have high-negative velocity). AsPKS0232−94 has a redshift of 1.434, it is possible thattwo Lyman-α absorbers at z=1.3 mimic the Mg II dou-blet.The C II, Si II, Si III and Al II absorption at
−150km s−1 seen toward PG0953+414 (Fabian et al.2001) may be related to an extended low-column densitytail of either HVC complex A or IV1. Both of these havevelocities of −120 to −150km s−1. However, IV1 is about8◦ distant, while the H I edge of complex A is about 10◦
away. The ionic column densities imply N(H)∼1018 cm−2
for gas with 0.1 solar abundance. However, consideringthat N(Si II)∼N(Si III), most of the hydrogen should beionized, so that N(H I) is much lower. A possible counter-argument is that toward PG0804+761 absorption associ-ated with complex A is not seen in any line (Richter et al.2001a), even though that probe lies just 0.◦5 off the H I edgeof complex A. That would suggest a rather sharp edge.However, PG0804+761 lies near the more constrained low-latitude part of complex A, rather than near the flared-outhigh-latitude end. This problem requires further observa-tions of AGNs in the region between PG0953+414 and theedge of complex A.Three of the remaining H I-less absorptions are seen
at a velocity >+200kms−1 in Na I and Ca II (SN 1994D,King et al. 1995, Ho & Filippenko 1995) SN1991T (Meyer& Roth 1991) and SN1983N (d’Odorico 1985). H I-less absorption is also seen at vLSR=+130km s−1 towardPG0953+414 (Fabian et al. 2001). Weak H I is detectedat vLSR>+200km s−1 toward SN1986G (d’Odorico et al.1989). Finally, +200km s−1 C II and Si II absorption isseen toward PG1116+215 (Tripp et al. 1998). In thesedirections the Na I/H I ratios are >57, >59, >20, 46±20and 60±18 ppb. All of these are much higher than theaverage value in neutral gas (4.6 ppb). Ca II/H I ratiosare >140, >500, >140, >250, >370, 150±70, 150±50 and
>27 ppb, again much higher than the reference value of22 ppb. These high values are consistent with the relationfound between A(Ca II) and N(H I), which is discussed byWakker & Mathis (2000), who show that high apparentabundances are correlated with low H I column density.These six sightlines all lie in the region l=180◦−320◦,
b=20◦−70◦. Many small positive-velocity clouds are alsopresent in this region. Figure 10 shows that this region fur-ther lies in the extension of the curve defined by the SMCorbit and the EP clouds near l=290, b=+20 (at 60,−20in Fig. 10). Thus, it is suggested that these high-positivevelocity absorptions and small positive-velocity clouds areassociated with the tenuous leading edge of the leadingarm of the Magellanic Stream.A possible problem with this model is that it requires
that the leading-arm gas no longer follows the SMC’s or-bit, deviating more as it gets farther ahead. However, sincethe gas had to pass the LMC first, it seems not unreason-able to suggest that it was given an additional nudge atthat time. A more complete model is required to test thishypothesis.In the Gardiner & Noguchi (1996) model, the tip of
the leading arm gas is supposed to be at a distance of30−80kpc. As the clouds in the leading arm’s tip coverabout 20◦ on the sky, this corresponds to pathlengthsof >10kpc. Then column densities of ∼1018 cm−2 cor-respond to a volume density of ∼5×10⁻⁵ cm−3, which im-plies Hα emission intensities <0.01R, which is below thecurrent detection limit (Reynolds et al. 1998). Not detect-ing Hα emission from the small positive-velocity HVCswould therefore not conclusively favor a Local Group overa Magellanic origin.A further check would be to determine whether high-
velocity absorption is not seen toward extra-galactic su-pernovae that lie away from the orbits of the MagellanicClouds.
4.23. HVCs/IVC toward the LMC
In the spectrum of many stars in the LMC absorptionis seen at velocities of +165, +120 and +65 kms−1. Ca IIand Na I are the most-observed elements (Blades 1980,Songaila & York 1981, Songaila et al. 1981, Blades et al.1982, Songaila et al. 1986, Magain 1987, Vidal-Madjar etal. 1987, Molaro et al. 1989, Wayte 1990, Molaro et al.1993, Caulet & Newell 1996, Welty et al. 1999). Otherstudies concentrate on dominant elements (Welty et al.1999, Bluhm et al. 2001). In principle these results couldbe used to study abundance variations in the HVCs andIVC. However, in practice there are many problems: a) theearlier spectra suffer from low signal-to-noise ratios andthe measured equivalent widths are not very reliable; b)in almost all cases only equivalent widths were publishedand linewidths need to be assumed to convert to columndensities; c) toward all but a few stars N(H I) must bebased on an interpolation between nearby observations,often with barely sufficient sensitivity; d) the clouds havenot been mapped in H I, as they are have rather low col-umn density (the Parkes Narrow Band Survey should makethis possible, eventually). Section 3.6 presents a summaryof the conclusions achievable with these caveats in mind.From the spectrum of SN1987A in the LMC, a large set
of accurate ion column densities was derived by Welty et

18 Ion Abundances in HVCs and IVCs
al. (1999) for all three H I components. However, a good,directly measured, value for N(H I) was not obtained, andinstead N(H I) was inferred from the abundance patterns(see item “AB” in description of Col. 10). The absoluteabundance therefore remains uncertain. However, for thetwo HVCs the abundance pattern is similar to the halopattern (Sembach & Savage 1995). The pattern for theIVC would suggest zero depletion. These matters are dis-cussed in more detail by Welty et al. (1999).For the +120km s−1 HVC a notable detection is that
of H2 toward Sk−68 82 by Richter et al. (1999), show-ing the presence of molecular hydrogen. Bluhm et al.(2001) also find H2 toward Sk−68 82 in the IVC withvLSR=+60km s−1.Fe II absorption in the +120km s−1 HVC has
been seen in five probes, but with uncertain results.A(Fe II)=0.28±0.07 solar toward SN 1987A (Welty etal. 1999), 0.8±0.6 solar toward Sk−67 104 (Bluhm etal. 2001), 1.3±0.9 solar toward Sk−67 166 (Bluhm et al.2001), 0.6±0.4 solar Sk−68 82 (Bluhm et al. 2001) and 0.16solar toward Sk−69 246 (Savage & de Boer 1981). N(H I)is uncertain toward SN1987A (based on the depletion pat-tern), Sk−67 104, Sk−67 166 and Sk−69 246 (based on aninterpolation) and better measurements are needed to rec-oncile the factor 8 range. On the other hand, Bluhm et al.(2001) argue that the high S II, Si II and Fe II abundancesin this cloud combined with the low O I abundance (∼0.5solar) argues in favor of substantial ionization, possibly ashigh as 90%. In this case variations in N(Fe II)/N(H I) aredue to variations in the ionized fraction.
4.24. Intermediate-Velocity Arch
This structure was first studied by Wesselius & Fejes(1973). Kuntz & Danly (1996) presented a catalogueof cores. These designations were used here to sort themany observed probes. At many positions, a higher-(<−60 km s−1) and a lower- (>−60 kms−1) velocity com-ponent overlap, so the IV Arch is further divided into twoparts, one consisting of cores IV5 through IV17, the othercontaining cores IV18 through IV26 (IV1−4 are identicalwith HVC complex M). Within each part the cores aresorted along the Arch by decreasing galactic longitude.Figs. 12 and 13 show the structure, with the probe posi-tions overlaid.Kuntz & Danly (1996) derived a z-height of 0.8−1.5 kpc
for the IV Arch, and brackets for IV17 and IV26. The dis-tance limits derived here are consistent with their results,and they are graphically shown in Fig. 14. The horizontalaxis in this figures shows an approximate “angle along theArch”, with 0 degrees at the highest-longitude core. Asthe IV Arch lies at high galactic latitudes, it is more use-ful to discuss z-heights than distances. A fuller discussionnow follows.For the higher-velocity part of the IV Arch, z-height
brackets can be set for 3 cores: z=0.4−1.7kpc for IV6,z=0.5−0.7kpc for IV17 and z=0.2−1.6 kpc for IV9. Theseare consistent with the upper limit of 3.9 kpc for IV7 andthe lower limit of 0.7 kpc for IV11. The upper limit forIV17 is based on the HB star BD+492137, for which Kuntz& Danly (1996) gave a z-height of 1.7 kpc, which is correctfor the spectral type given in SIMBAD (B7V). Ryans etal. (1997a) did a more detailed spectroscopic analysis and
argue that it is a HB star at z=0.7kpc, although the fi-nal number is somewhat model-dependent. The distancebracket for IV17 is set by the same stars as those thatbracket IV4, suggesting that these two clouds are closetogether in space, even though they differ in velocity by30 kms−1.For the lower velocity part of the IV Arch, at an-
gles along the Arch <50◦ (l>150◦), a z-height bracket of0.4−2.6kpc can be set for IV26, as well as a lower limit forIV24 of 0.4 kpc. Off cores HD93521 is the only star withz<2.6 kpc, and it reduces the upper limit to 1.7 kpc.For the lower velocity part of the IV Arch, at angles
along the Arch >50◦ IV19 sets an upper limit to the z-height of 1.6 kpc. The limits toward HDE233791 andPG1255+546 are in apparent conflict. However, theclassification of HDE233791 is uncertain (Ryans et al.1997a) and instead of an HB star at 0.5 kpc distanceit could be a B9V star at 0.9 kpc distance (z=0.8 kpc).For PG1255+546 the 1-σ uncertainty in the distance is0.3 kpc, so that this star could be at z=0.4 kpc, rather thanz=0.7 kpc. If these uncertainties are taken into account,combining the lower limit for PG1255+456 with the up-per limit for HDE233791 yields a possible z-height bracketfor this part of the Arch of 0.4−0.8kpc. HDE233791 mayeven reduce the upper limit to 0.4 kpc.A final complication is the low upper limit of 0.3 kpc
derived from core IV21. This core is slightly off the mainaxis of the IV Arch, and is further unusual in that COand 100µm emission have been detected in it (Weiss et al.1999). These authors study the cloud as an example of ahigh-z molecular cloud. Benjamin et al. (1996) claimed adistance bracket of 0.3−0.4 kpc. However, the lower limitis based on Na I non-detections that are not significant, asthey are only a factor ∼6 below the measured Na I abun-dance. Therefore, the distance may be less than 0.3 kpc(z<0.2 kpc). More observations, preferably using Ca IIare required to settle this question.In summary, for the higher-velocity part of the IV Arch
a strong bracket of z=0.7−1.7kpc can be derived. The up-per limit depends mostly on the z-height of BD+492137,which may be as low as 0.7 kpc. For the lower-velocityIV Arch the strong bracket is z=0.4−1.6kpc for the partwith l>150◦. At lower longitudes the situation is slightlyconfusing, but a possible z-height is 0.4 kpc, although thestrong bracket is 0.4−1.6kpc.Using these distance brackets, the mass of the IV
Arch was estimated from the Leiden-Dwingeloo Surveyto be 1−4.5×10⁵M⊙ for velocities <−60km s−1, and1−8×10⁵M⊙ for lower velocities. If the lower distancesare used for BD+49 2137 and HDE233791, the impliedtotal mass of the IV Arch is about 2×10⁵M⊙.The metallicity of the IV Arch has not yet been well-
determined. Sulphur was observed to have near so-lar abundance toward HD93521 (Fitzpatrick & Spitzer1993); PG0953+414 (Fabian et al. 2001) and HD121800(IV9/IV19 − Howk et al. 2001). Similarly, oxygen is foundto have an abundance of ∼1 solar toward PG1259+593(Richter et al. 2001b).Toward HD93521 absorption components are seen at
several velocities (−65, −57, −51 and −36 km s−1), eventhough the H I profile just shows a 20.8 kms−1 widecomponent centered at −56 km s−1. The component at

19
−65 km s−1 is probably related to IV6. Applying a compo-nent analysis to the H I spectrum observed at Green Bank(21′ beam), Fitzpatrick & Spitzer (1993) derived S II/H Iratios of 2.1±2, 0.78±0.12, 1.2±0.25 and 0.74±0.31 timessolar (0.97±0.06 when summing all components). Theyfurther determine ne and use the result to argue thathydrogen ionization is unimportant. Toward HD121800two H I and two S II components occur, which are notwell-separated. The average S II/H I ratio is 0.8 so-lar. In the sightline to PG0953+414 Fabian et al. (2001)find S II/H I=1.1±0.2 times solar, but N(H I) is low(23×1018 cm−2), so the ionization correction is potentiallylarge. In general, these results suggest near-solar abun-dance for the IV Arch although more work is needed oncomponent structure, H I small-scale structure and ioniza-tion corrections.The abundance patterns toward HD93521 were used by
Savage & Sembach (1996a) to define the reference for halogas. These patterns are shown in Fig. 3f and k.
4.25. Intermediate-Velocity Spur
These cores form an extension to the IV Arch, at some-what lower velocities and higher longitudes and latitudes,and were defined by Kuntz & Danly (1996). These authorsalso derived the distance bracket of 0.3−2.1kpc based onthe Si II lines in IUE spectra. The implied mass bracketis 0.2−8×10⁵M⊙. The positions of the probes are shownin Fig. 15.
4.26. Low-Latitude Intermediate-Velocity Arch
This structure was named by Kuntz & Danly (1996).It crosses over complex A, resulting in a relatively largenumber of observed probes (see Fig. 16). The distancecan be constrained to lie in the range 0.9 to 1.8 kpc(z=0.6−1.2kpc). The implied mass is 1.5−6×10⁵M⊙.In the Galactic plane at these longitudes lies the PerseusArm, a spiral arm that is 2.5 kpc distant (Reynolds et al.1995). The LLIV Arch thus appears to be high-z interarmgas.Several probes lie off the main structure, and are col-
lected under the heading “LLIV Arch extension”. Thisgas has velocities similar to that in the LLIV Arch proper,and most likely is spatially close to it. If so, an upperdistance limit of 0.9 kpc is set by HD83206, equal to thelower distance limit for the main part of the LLIV Arch.The metallicity and depletion pattern can be de-
termined from the spectra of SN 1993J (de Boer etal. 1993), PG0804+761 (Richter et al. 2001a) andHDE233622 (Ryans et al. 1997b). The metallic-ity follows from N(O I)/N(H I)=1.0±0.5 solar andN(N I)/N(H I)=0.55±0.14 solar, as O and N are unde-pleted, and (especially O I) tied to H I. If hydrogen ion-ization were ignored, this would be inconsistent with theapparently supersolar abundance of P II (1.3±0.6 solar)and Zn II (1.6±0.4 solar). However, both these elementscan co-exist with both H I and H+. The degree of ioniza-tion can be estimated by assuming that O I and H I go to-gether. Then N(P II)/N(O I) ∼ (N(H I)+N(H+))/N(H I).This yields an ionization fraction of ∼20%.The depletions of some refractory elements are typi-
cal for warm disk gas: δ(Si II)∼0.3 (typical is 0.15),δ(Al II)=0.09 (typical is 0.15), δ(Ti II)=0.11 (typical is
0.05), and δ(Fe II)=0.1−0.3 (typical is 0.1). See Fig. 3dfor a graphical representation. CaII in LLIV probes (seeline 950)Ca II abundances in the LLIV Arch are remarkable for
their constancy. Out of 10 determinations 7 are in therange 12−14 ppb, while “outliers” are 17 and 9.1 ppb.The only really deviating value is 2.5 ppb for the weakercomponent in the spectrum of PG0833+698. However,for this probe the decomposition of the H I spectrum issomewhat suspect.Intermediate-velocity O VI and C IV are also found to-
ward PG0804+762 and SN 1993J, respectively (Richteret al. 2001a, de Boer et al. 1993). Thus, the LLIV Archappears to be a near-solar metallicity cloud, with a sub-stantial H+ fraction, disk-like dust, embedded in hot gas,and located in the interarm region between the Local andPerseus spiral arms. Its velocity is 20−30km s−1 morenegative than expected from differential galactic rotation.All these characteristics are typically those expected for
a cloud that is part of the return flow of the Galactic Foun-tain. That is, gas that was ejected into the Galactic Halofrom inside the solar radius is expected to have a metal-licity slightly above that in the local ISM, the dust is ex-pected to survive in the hot phase, the rotational velocityis expected to decrease as the gas rises and moves outward(because of conservation of angular momentum, Bregman1980), and after condensations grow they will remain em-bedded in the as-yet uncooled part of the gas.
4.27. Complex K
This object was first seen in 21-cm emission by Kerr &Knapp (1972) in the direction of M13. De Boer & Savage(1983) detected Mg II toward the star Barnard29 in M13.Figure 17 shows the gas between velocities of −95 and−60km s−1 in this region of the sky, based on the Leiden-Dwingeloo Survey (Hartmann & Burton 1997). Below lat-itudes of 45◦, the velocity of the peak is <−70km s−1, andthose components were included in the survey of Hulsbosch& Wakker (1988), and considered part of complex C. How-ever, they stand out from the main body of C, althoughnear l∼80◦ the components merge and it is difficult to as-sign them to either C or K. Here, complex K is defined asthe intermediate-velocity gas with −95<vLSR<−60kms−1
in this region of the sky. A better definition requires de-tailed component fitting.From differential galactic rotation, velocities in the
range 0 to +30km s−1 are expected, whereas complex Khas vLSR∼−80kms−1. Thus, it rotates too slowly byabout 100km s−1. A metallicity measurement is requiredto determine whether this is an infalling cloud, such ascomplex C, or whether it is a Galactic Fountain-type cloud.Haffner (2000) detects faint Hα emission (0.1−0.2R) as-
sociated with complex K. The Hα emission map correlatesvery well with the H I column density map for the fainterextended part and for the minor cores. However, in thebrightest core (near l=55◦, b=38◦) the Hα peaks east ofthe H I.Shaw et al. (1996) mapped the H I at high angular
resolution (3′×2′) in the direction of the globular clus-ter M13, using a combination of Jodrell Bank and DRAOdata. They found variations of a factor 2 on arcminutescales. They also observed Na I toward several stars, giv-

20 Ion Abundances in HVCs and IVCs
ing 3 detections (at 45, 14 and 13 ppb) and 6 upper limits(<5 ppb). Clearly, there are large variations in the Na Iabundance on arcminute scales.The Mg II and Na I, detections toward stars in M13 set
an upper limit to the distance of K of 6.8 kpc, and a masslimit of <7.5×10⁵M⊙.Toward Mrk 501 the abundance of Ca II is found to be
89 ppb, although with large errors. There are 31 PG starswith a range of distances that lie projected onto the maincore of complex K at l=55◦, b=35◦, but for none of thesehas a Ca II spectrum yet been taken. Clearly, a good dis-tance determination is possible. However, since N(H I) islow, spectra with high signal-to-noise ratio will be neces-sary.For the star M3vz1128 (l=42◦, b=79◦, shown on
Fig. 17) de Boer & Savage (1984) claimed strong C II ab-sorption at a velocity of −70km s−1, although no associ-ated H I is seen. Recent data from FUSE do not show thisabsorption in the C II-1036 and other strong lines (Howk,priv. comm.). Thus, the claim by de Boer & Savage (1984)turns out to have been spurious.
4.28. Southern Intermediate-Velocity Clouds
At velocities between −85 and −45km s−1 the south-ern Galactic sky contains a number of IVCs in the re-gion between galactic longitudes 60◦ and 150◦, as shown inFig. 18. Note that by placing the gas in the outer Galaxy,velocities up to −40km s−1 can still be understood withinthe framework of differential galactic rotation for latitudes>−40◦, and longitudes 90−150◦. High-velocity gas withvLSR<−100km s−1 also occurs in this area, as shown bythe thick solid outlines (see figure caption for details).These southern IVCs have not been studied, with the ex-
ception of the HD215733 sightline, which was analyzed ingreat detail by Fitzpatrick & Spitzer (1997). This sight-line shows intermediate-velocity absorption at −92, −56and −43 km s−1. The first of these is very weak in H I.The H I spectrum shows a single component centered at−44 km s−1. Fitzpatrick & Spitzer (1997) decomposed itbased on the UV absorption lines. The components canbe associated with an Arch running through the constel-lations Pegasus and Pisces (l=90◦, b=−40◦ to l=130◦,b=−60◦). Here, and elsewhere in the paper this struc-ture is referred to as the Pegasus-Pisces Arch, or the PPArch. Although much weaker, this is the closest southerncounterpart to the IV Arch in the north.Individually, the absorption components toward
HD215733 have S II/H I ratios of 0.17, 0.32 and 1.2times solar, but when combined this is 0.54±0.04 timessolar. As Fitzpatrick & Spitzer exclude a large ioniza-tion correction, this is clearly subsolar. Together withHD93521, the depletion pattern in these two components(see Fig. 3n, p, r) defines the halo pattern.From HD215733 an upper distance limit of 2.7 kpc can
be set to the northern knot of the Pegasus-Pisces Arch, orz<1.6 kpc. For the southern part, PG0039+048 seems toset an upper limit of 1.1 kpc, as Na I absorption is seen inits spectrum (Centurion et al. 1994). However, this com-ponent is only seen in the line wing and a more accuratemeasurement is needed.Using the distance limit implied by PG0039+048 and
integrating the LDS data in the velocity range between
−85 and −45 km s−1 sets an upper mass limit of about0.5×105M⊙.
4.29. Complex gp
The IVC centered on l=65◦, b=−27◦ was the first IVCdetected in absorption, against the globular cluster M15(Cohen 1979). A Leiden-Dwingeloo Survey map of theintermediate-velocity gas in this area shows a large num-ber of scattered, faint IVCs (see Fig. 19). These seem to bean extension toward lower velocities of HVC 40−15+100,which is also known as the Smith cloud (Smith 1963), oras the main cloud in complex GP (Wakker & van Woerden1991). This shows up prominently at l=35−50◦, b>−25◦.The IVCs between +60 and +90 kms−1 seem to extendcomplex GP toward more negative latitudes and veloci-ties. Hence, these IVCs will be collectively referred to as“complex gp”. Here it is worthwhile to note that at veloc-ities between +30 and +60km s−1 there are no coherentstructures in this region of the sky. Differential galactic ro-tation can account for about 20−40km s−1 of the observedradial velocity.The detection of the IVC toward HD203664 sets an up-
per distance limit of 4.3 kpc (z<2.0 kpc), while the non-detection of the IVC toward HD203699 sets a lower limitof 0.8 kpc (z>0.3 kpc) (Albert et al. 1993, Little et al. 1994,Ryans et al. 1996, Kennedy et al. 1998). A rough integra-tion of the LDS data in the velocity range between +55 and+100km s−1 then gives a mass range of 0.1−3×10⁵M⊙ forthe intermediate-velocity gas. Compare this to the massof the higher-velocity gas (i.e. complex GP, Sect. 4.11),which for the same distance limits would have a mass of0.3−8×10⁵M⊙. Thus, if they are related, the high-velocitygas has about twice the mass of the intermediate-velocitygas.An detailed study of the metallicity of this cloud has
not yet been made. However, Penton et al. (2000) listequivalent widths for S II-1250, 1253 in the direction to-ward Mrk 509. These imply an S II/H I ratio of 2.0 so-lar. Sembach et al. (1999) show the spectrum in moredetail, and from this it is clear that the numbers given byPenton et al. (2000) are a factor 2 too high, and that abetter abundance estimate is 0.8 solar. Since N(H I) forthe +60km s−1 component toward Mrk 509 is only about24.5×1018 cm−2, it seems likely that a substantial ioniza-tion correction is needed. However, even if that is a factortwo, a near-solar metallicity is implied. As Mrk 509 is oneof the brightest AGNs in the UV, a good study of abun-dances and ionization will be possible with FUSE. Na ISi II and Ca II toward Mrk 509 were already measured byYork et al. (1982), Blades & Morton (1983) and Morton& Blades (1986).Bland-Hawthorn et al. (1998) detected Hα emission
from two positions within the Smith cloud, and they pro-posed that complex GP is a tidal stream related to theSagittarius dwarf galaxy, at a distance on the order of25 kpc. This is difficult to reconcile with the upper dis-tance limit of 4.3 kpc for the IVC, unless the apparentspatial relation between complex GP and the IVCs is ac-cidental.The intermediate-velocity gas is seen in the spectrum
of many stars in the globular cluster M15, the sightlineto which intersects one of the four cores of complex gp.

21
Lehner et al. (1999b) measure Ca II toward 12 stars (seeSect. 3.6), finding values in the range 14−79 ppb. Na I wasmeasured by Langer et al. (1990) toward 7 stars, and foundto be in the range 6−21 ppb. However, Meyer & Lauroesch(1999) find that Na I varies by a factor 15 across the faceof M15. Toward HD203664 (a few degrees from M15),the Ca II/H I ratio is much higher (440 ppb). However, atthe very low N(H I) seen in that direction (2.2×1018 cm−2)high Ca II/H I ratios are to be expected (see Wakker &Mathis 2000).
4.30. Other IVCs
In 23 sightlines, observations of a probe of an identifiedHVC or IVC also show absorption and/or H I emissionassociated with another IVC, usually small and/or faintclouds. These are collected under the heading “OtherNegative- (Positive-) velocity IVCs”. The data are usu-ally too sparse to learn useful things about these IVCs,except that the abundances tend to be normal.
5. SUMMARY
Table 4 summarizes the distances, masses, metallicitiesand depletion patterns discussed in the previous section.The main new conclusions that can be drawn from thistable are:1) HVC complex A is the only HVC for which a distancebracket is known, which is 4.0−9.9 kpc (z=2.6−6.8kpc).It may have a metallicity of about 0.1 solar.2) Complex M is a grab bag collection of clouds, whichmay or may not be physically related. The most likelymetallicity of cloud MI is near-solar. Cloud IV4 (or MI-extension) lies at z=0.5−0.7kpc and has a warm-disk-likedepletion pattern. Cloud MII/MIII lies at z<3.5 kpc; apossible lower limit of 1.7 kpc remains controversial.3) Complex C appears to have a metallicity of ∼0.1 solar,based on S II absorption toward Mrk 290 and N I towardMrk 876. Richter et al. (2001b) report O I/H I=0.1 so-lar toward PG1259+593. S II/H I ratios of 0.3−0.4 so-lar that have been reported toward two other probes areuncorrected for ionization and H I small-scale structure.The Mrk 876 sightline gives some anomalous abundances,which are most likely due to high partial ionization. How-ever, N I/H I is consistent with S II/H I. There seems tobe little dust in complex C. In that case, the N I, O I,Si II and Fe II abundance pattern toward PG1259+593is consistent with the idea that the heavy elements wereproduced in type II supernovae, with no subsequent starformation. Finally, complex C shows the importance andnecessity of corrections for ionization and H I fine struc-ture.4) The strong limit to the distance to complex C is>1.2 kpc, but the distance is probably >6 kpc. 5) For thetrailing and leading part of the Magellanic Stream S IIabundances of 0.33±0.05 and 0.25±0.08 solar are foundtoward Fairall 9 (Gibson et al. 2000) and NGC3783 (Luet al. 1998), consistent with the idea that the Stream is atidal feature extracted from the SMC (Gardiner & Noguchi1996).6) Using the FOS, Savage et al. (2000a) found Mg II ab-sorptions associated with the Magellanic Stream, show-ing a nearly constant abundance of 0.1 solar whenN(H I)>2×1018 cm−2, but showing larger Mg II/H I ra-tios at lower N(H I), suggesting increasing ionization.
7) Fe/S was determined for the trailing and leading partsof the Stream, giving values of 0.18±0.06 and 0.13±0.05times solar. This is comparable to the value in SMC gas,and indicates the presence of dust in the Stream.8) Mg II absorption due to cloudWW84 is seen in the spec-trum of Mrk 205. The Mg II abundance remains uncertain,however, due to H I small-scale structure. A(Mg II) couldpossibly be as low as 0.02 solar.9) A second upper limit was set to the distance of a HVC:complex WE (which is identified and named in this pa-per) has d<12.8 kpc, z<3.2 kpc, based on the detection ofabsorption in the star HD156359.10) It is suggested that many small positive-velocity HVCsand the high-positive velocity absorptions without associ-ated H I in the region l=180◦−320◦, b=20◦−70◦ are due toa spread-out leading edge to the leading arm of the Mag-ellanic Stream. These occur in the extension of the curvedefined by the SMC orbit and the EP clouds (Fig. 10).11) For the higher-velocity part of the IV Arch a strongbracket of z=0.7−1.7kpc can be derived. The upper limitdepends mostly on the distance to BD+492137, whichmay be as low as 0.7 kpc. For the lower-velocity IV Archthe strong bracket is z=0.4−1.7kpc for the part withl>150◦. At lower longitudes the situation is confusing,but a possible z-height is 0.4 kpc.12) The IV Arch appears to have near solar abundances,based on S II/H I ratios of 0.97±0.06, 0.8±0.1 and 1.1±0.2found toward HD93521, HD121800 and PG0953+414, re-spectively.13) A metallicity of ∼0.7 solar and a distance of 0.9 kpc(z=0.6kpc) are known for the LLIV Arch. This objectappears to be a prime example of the return flow of aGalactic Fountain: it lies at high-z in an interarm region,it is rotating somewhat slower than expected from differ-ential galactic rotation, it has a metallicity similar to thatin the local ISM, the depletion pattern is similar to thatin warm disk gas, and it is embedded in hot gas.14) IVC complex K is newly defined in this paper, as IVCcomponents with vLSR∼−80km s−1 near l=50◦. It has adistance <6.8 kpc (z<4.5 kpc), and many potentially use-ful targets exist. It is notable for a strong correlation be-tween Hα emission and H I column density (Haffner et al.2000).15) The PP Arch is the best southern counterpart to theIV Arch in the northern Galactic hemisphere. An upperdistance limit of 2.7 kpc (z<1.6 kpc) can be set for thenorthern part, and of 1.1 kpc (z<0.9 kpc) for the southernpart. A metallicity of 0.5 solar is derived. This objectdeserves further study.16) Positive-velocity IVCs near l=50◦, b=−25◦ maybe related to HVC complex GP (also known asHVC40−15+100 or as the “Smith cloud”). Some of theIVCs lie in the distance range 0.8−4.3 kpc (z=0.3−2.0kpc)If the IVCs and complex GP are related, this excludesthe suggestion by Bland-Hawthorn et al. (1998) that com-plex GP is a tidal stream connected to the Sagittariusdwarf. Complex gp is probed by the bright UV probeMrk 509, towards which S II absorption suggests an abun-dance of 1−2 times solar.17) The metallicity of HVCs and IVCs ranges from 0.1to 1 solar. The most accurate value (0.089 times solar)is for complex C. For complex A ∼0.1 solar is suggested.

22 Ion Abundances in HVCs and IVCs
The Magellanic Stream (both the trailing and the leadingarms) has Magellanic-like abundances (0.25 solar for sul-phur). IVCs tends to have higher metallicities: the PPArch has Z∼0.5 solar, the LLIV Arch has Z∼0.8 solar,while the IV Arch has Z∼1 solar. Thus, the classical HVCsA and C most likely represent material that has never be-fore been part of the Milky Way and is now being accreted(see Wakker et al. 1999 for more discussion). The IVCs,on the other hand consist of Galactic gas. It is an openquestion which clouds are previously-hot halo gas com-pressed by infalling material, and which are part of thereturn flow of a Galactic Fountain. For the LLIV Archthe second possibility is preferred.18) Very little information exists on dust in HVCs. TheMagellanic Stream shows the pattern typical for halo gas.In complex C there are indications for a lack of dust,based on the ratio Fe II/H I=0.5 solar toward Mrk 876.Since S/H=0.1, a halo-like ratio of Fe/S=0.25 would re-quire N(H+)/N(H I)>20, which is incompatible with theother absorption lines and the non-detection of Hα emis-sion (Murphy et al. 2000).19) The IVC depletion pattern varies from that typical forwarm disk gas (IV4, LLIV Arch) to that typical of halogas (IV Arch, PP Arch).20) Only one HVC distance bracket is known (4−10kpc forcomplex A). An upper limit of <12.8 kpc was set for com-plex WE, and lower limits of >6 and >5 kpc exist for com-plexes C and H. In contrast, several IVC distance bracketswere set. Expressed as z-heights, these tend to be about0.5−1.5 kpc. Thus, the major IVCs appear to be a ratherlocal phenomenon, whereas the major HVCs appear to belarge clouds away from the Galactic plane.21) For the large IVCs (IV Arch, LLIV Arch, PP Arch),mass limits typically are 0.1−8×10⁵M⊙, whereas for thelarger HVCs mass limits typically are >106M⊙ (with anupper limit of 2×10⁶M⊙ for complex A). The Magel-lanic Stream is the most massive HVC, having M>108M⊙.Thus, the major HVCs (A, C, H, MS) appear to be moremassive than the major IVCs.22) The abundance of Ca II tends to vary by a factor 2−5within clouds and by a factor 5−10 between clouds. Atany given value of N(H I), N(Ca II) can vary by a factor10. Nevertheless, a strong correlation is found between theCa II abundance and N(H I), which is discussed in moredetail by Wakker & Mathis (2000).23) The abundance of Na I varies by a factor 100 for agiven N(H I), and by a factor >10 within a single cloud.No correlation is seen between log N(Na I) and log N(H I),showing that for HVCs and IVCs N(Na I) is an even worsepredictor of N(H I) than it is for low-velocity gas.24) It is possible to use Ca II to set lower limits to clouddistances, but this requires a) knowledge of the Ca II abun-dance in the cloud and b) sightlines with sufficiently highN(H I) (>5×1018 cm−2) and c) sufficiently sensitive ob-servations of the Ca II lines. For Na I the safety factorrequired to interpret a non-detection as a lower limit isprohibitively large and in practice non-detection of Na Ishould not be considered significant.
This research has made extensive use of the SIMBADdatabase, operated at CDS, Strasbourg, France.

23
REFERENCES
Akeson R.L., Blitz L., 1999, ApJ 523, 163Albert C.E., 1983, ApJ 272, 509Albert C.E., Blades J.C., Morton D.C., Lockman F.J., Proulx M.,
Ferrarese L., 1993, ApJS 88, 81Anders E., Grevesse N., 1989, Geochim. Cosmochim. Acta 53, 197Andreani P., Ferlet R., Vidal-Madjar A., 1987, Nature 326, 770Bajaja E., Cappa de Nicolau C.E., Cersosimo J.C., Martin M.C.,
Loiseau N., Morras R., Olano C.A., Poppel W.G.L., 1985, ApJS58, 143
Bajaja E., Cappa de Nicolau C.E., Martin M.C., Morras R., OlanoC.A., 1989, A&AS 78, 345
Bates B., Catney M.G., Gilheany S., Keenan F.P., Davies R.D.,Hummel E., 1991, MNRAS 249, 282
Bates B., Catney M.G., Keenan F.P., 1990, MNRAS 242, 267Benjamin R.A., Venn K.A., Hiltgen D.D., Sneden C., 1996, ApJ 464,
836Blades J.C., 1980, MNRAS 190, 33Blades J.C., Elliot K.H., Meaburn J.C., 1982, MNRAS 192, 101Blades J.C., Meaburn J., 1980, MNRAS 190, 59PBlades J.C., Morton D.C., 1983, MNRAS 204, 317Blades J.C., Wheatley J.M., Panagia N., Grewing M., Pettini M.,
Wamsteker W., 1988, ApJ 332, L75Bland-Hawthorn J., Maloney P.R., 1999, ApJ 510, L33Bland-Hawthorn J., Veilleux S., Cecil G.N., Putman M.E., Gibson
B.K., Maloney P.R., 1998, MNRAS 299, 611Blitz L., Spergel D., Teuben P., Hartmann D., Burton W.B., 1999,
ApJ 514, 818Bluhm H., de Boer K.S., Marggraf O., Richter P., 2001, A&A, in
pressBomans D.J., de Boer K.S., Koornneef J., Grebel E.K., 1996, A&A
313, 101Bowen D.V., Blades J.C., 1993, ApJ 403, L55Bowen D.V., Blades J.C., Pettini M., 1995a, ApJ 448, 634Bowen D.V., Blades J.C., Pettini M., 1995b, ApJ 448, 662Bowen D.V., Pettini M., Penston M.V., Blades J.C., 1991a, MNRAS
248, 153Bowen D.V., Pettini M., Penston M.V., Blades J.C., 1991b, MNRAS
249, 145Bowen D.V., Roth K.C., Blades J.C., Meyer D.M., 1994, ApJ 420,
L71Bowen D.V., Roth K.C., Meyer D.M., Blades J.C., 2000, ApJ 536,
225Braun R., Burton W.B., 1999, A&A 351, 437Braun R., Burton W.B., 2000, A&A 354, 853Bregman J.N., 1980, ApJ 237, 280Brown P.J.F., Dufton P.L., Keenan F.P., Boksenberg A., King D.L.,
Pettini M., 1989, ApJ 339, 397Bruhweiler F.C., Boggess A., Norman D.J., Grady C.A., Urry C.M.,
Kondo Y., 1993, ApJ 409, 199Bruns C., Kerp J., Staveley-Smith L., 2001, in “Mapping the Hidden
Universe”, ASP Conf. Ser., in pressBurks G.S., Bartko F., Shull J.M., Stocke J.T., Sachs E.R., Burbidge
E.M., Cohen R.D., Junkkarinen V.T., Harms R.J., Massa D.,1994, ApJ 437, 630
Caulet A., Newell R., 1996, ApJ 465, 205Centurion M., Vladilo G., de Boer K.S., Herbstmeier U., Schwarz
U.J., 1994, A&A 292, 261Cohen J.G., 1979, ApJ 231, 751Colgan S.W.J., Salpeter E.E., Terzian Y., 1990, ApJ 351, 503Combes F., Charmandaris V., 2000, A&A 357, 75Conlon E.S., Brown P.J.F., Dufton P.L., Keenan F.P. 1988, A&A
200, 168d’Odorico S., di Serego Alighieri S., Pettini M., Magain P., Nissen
P.E., Panagia N., 1989, A&A 215, 21d’Odorico S., Pettini M., Ponz D., 1985, ApJ 299, 852Danly L., Albert C.E., Kuntz K.D., 1993, ApJ 416, L29Danly L., Lee Y.P., Albert C.E., 1995, BAAS 27, 860 + preprintDanly L., Lockman F.J., Meade M.R., Savage B.D., 1992, ApJS 81,
125de Boer K.S. Rodriguez Pascual P., Wamsteker W., Sonneborn G.,
Fransson C., Bomans D.J., Kirshner R.P., 1993, A&A 280, L15de Boer K.S., Altan A., Bomans D., Lilienthal D., Moehler S., van
Woerden H., Wakker B., Bregman J., 1994, A&A 286, 925de Boer K.S., Grewing M., Richtler T., Wamsteker W., Gry C.,
Panagia N., 1987, A&A 177, L37de Boer K.S., Savage B.D., 1983, ApJ 265, 210de Boer K.S., Savage B.D., 1984, A&A 136, L7Diplas A., Savage B.D., 1994, ApJS 93, 211Dupree A.K., Kirshner R.P., Nassiopoulos G.E., Raymond J.C.,
Sonneborn G., 1987, ApJ 320, 597Fabian D., Tripp T.M., Savage B.D., Wakker B.P., 2001, ApJ
submittedFerlet R., Dennefeld M., Maurice E., 1985a, A&A 152, 151
Ferlet R., Vidal-Madjar A., Gry C., 1985b, ApJ 298, 838Fernley I., et al., 1998, A&A 330, 515Fitzpatrick E.L., Spitzer L., 1997, ApJ 475, 623Gardiner L.T., Noguchi M., 1996, MNRAS 278, 191Garmany C.D., Conti P.S., Massey P., 1987, AJ 93, 1070Gibson B.K., Giroux M.L., Penton S.V., Putman M.E., Stocke J.T.,
Shull M.J., 2000, AJ 120, 1830Gibson B.K., Penton S.V., Giroux M.L., Stocke J.T., Shull M.J.,
Putman M.E., 2001, ApJ, submittedGiovanelli R., Verschuur G.L., Cram T.R., 1973, A&AS 12, 209Grevesse N., Noels A., 1993, in “Origin of the Elements”, eds. N.
Prantzos, E. Vangioni-Flam, M. Casse, p15, Cambridge Univ.Press
Gringel W., Barnstedt J., de Boer K.S., Grewing M., KappelmannN., Richter P., 2000, A&A 358, L37
Habing H.J., 1966, BAN 18, 323Haffner L.M., Reynolds R.J., Tufte S.L., 1999, ApJ 523, 223Haffner L.M.,, 2000, in “Fourth Tetons Summer Conference”, ASP
Conf. Ser., eds. M.D. Bicay, C.D. WoodwardHambly N.C., Keenan F.P., Dufton P.L., Brown P.J.F., Saffer R.A.,
Peterson R.C. 1996, ApJ 466, 1018Harris W.E., 1996, AJ 112, 1487Hartmann D., Burton W.B., 1997, “Atlas of Galactic Neutral
HYdrogen”, Cambridge University PressHaud U., 1992, MNRAS 257, 707Haynes R., Staveley-Smith L., Mebold U., Kalberla P.M.W., Jones
K., White G., Jones P., Filipovic M., Dickey J., Green A., 1999,IAU Symp. 190, 108
Heiles C., 1984, ApJS 55, 585Ho L.C., Filippenko A.V., 1995, ApJ 444, 165Ho L.C., Filippenko A.V., 1996, ApJ 463, 818Howk J.C, Savage B.D., Fabian D., 1999, ApJ 525, 253Howk J.C., et al., 2001, in preparationHulsbosch A.N.M., Wakker B.P., 1988, A&AS 75, 191Jannuzi B.T., et al., 1998, ApJS 118, 1Kaper H.G., Smits D.W., Schwarz U.J., Takakubo K., van Woerden
H., 1966, BAN 18, 465Keenan F.P., Conlon E.S., Brown P.J.F., Dufton P.L., 1988, A&A
192, 295Keenan F.P., Shaw C.R., Bates B., Dufton P.L., Kemp S.N., 1995,
MNRAS 272, 599Kemp S.N., Bates B., 1998, MNRAS 301, 1095Kemp S.N., Bates B., Dufton P.L., Keenan F.P., Montgomery A.S.,
1994, MNRAS 270, 597Kennedy D.C., Bates B., Keenan F.P., Kemp S.N., Ryans R.S.I.,
Davies R.D., Sembach K.R., 1998, MNRAS 297, 849Kepner M.E., 1970, A&A 5, 444Kerr F.J., Knapp G.R., 1972, AJ 77, 354King D.L., Vladilo G., Lipman K., de Boer K.S., Centurion M.,
Moritz P., Walton N.A., 1995, A&A 300, 881Kulkarni S.R., Dickey J.M., Heiles C., 1985, ApJ 291, 716Kulkarni S.R., Mathieu R., 1986, ApSpSc 118, 531Kunth D., Lequeux J., Sargent W.L.W., Viallefond F., 1994, A&A
282, 709Kuntz K.D., Danly L., 1996, ApJ 457, 703Langer G.E., Prosser C.F., Sneden C., 1990, AJ 100, 216Lehner N., Rolleston W.R.J., Ryans R.S.I., Keenan F.P., Bates B.,
Pollacco D.L., Sembach K.R., 1999b, A&AS 134, 257Lehner N., Sembach K.R., Lambert D.L., Ryans R.S.I., Keenan F.P.,
1999a, A&A 352, 257Lilienthal D., Meyerdierks H., de Boer K.S., 1990, A&A 240, 487Lipman K., Pettini M., 1995, ApJ 442, 628Little J.E., Dufton P.L., Keenan F.P., Conlon E.S., 1994, ApJ 427,
267Lockman F.J., Savage B.D., 1995, ApJS 97, 1Lu L., Savage B.D., Sembach K.R., 1994a, ApJ 426, 563Lu L., Savage B.D., Sembach K.R., 1994b, ApJ 437, L119Lu L., Savage B.D., Sembach K.R., Wakker B.P., Sargent W.L.W.,
Oosterloo T.A., 1998, AJ 115, 162Lucas R., Liszt H.S., 1996, A&A 282, 237Lucke P.B., 1978, A&A 64, 367Magain P., 1987, Nature 329, 606McGee R.X., Newton L.M., 1986, Proc. Astron. Soc. Australia 6, 358Meaburn J., Blades J.C., 1980, MNRAS 190, 403Meaburn J., Solomos N., Laspias V., Goudis C., 1989, A&A 225, 497Mebold U., Greisen E.W., Wilson W., Haynes R.F., Herbstmeier U.,
Kalberla P.M.W., 1991, A&A 251, L1Meyer D.M., Jura M., Cardelli J.A., 1998, ApJ 493, 222Meyer D.M., Lauroesch J.T., 1999, ApJ 520, L103Meyer D.M., Roth K.C., 1991, ApJ 383, L41Mirabel I.F., 1982, ApJ 256, 112Moehler S., Heber U., de Boer K.S., 1990, A&A , 239, 265Molaro P., Vladilo G., Avila G., d’Odorico S., 1989, ApJ 339, L63

24 Ion Abundances in HVCs and IVCs
Molaro P., Vladilo G., Monai S., d’Odorico S., Ferlet R., Vidal-Madjar A., Dennefeld M. 1993, A&A 274, 505
Morras R., Bajaja E., Arnal E.M., Poppel W.G.L., 2000, A&AS 142,25
Morton D.C., 1991, ApJS 77, 119Morton D.C., Blades J.C., 1986, MNRAS 220, 927Morton D.C., et al. 2001, in preparationMuller C.A., Oort J.H., Raimond E., 1963, Comptes Rend. Acad.
Sci. Paris, 257, 1661Murphy E.M., Sembach K.R., Gibson B.K., Shull J.M., Savage B.D.,
Roth K.C., Moos H.W., Green J.C., York D.G., Wakker B.P.,2000, ApJ 538, L35
Oegerle W.R., Tripp T.M., Sembach K.R., Jenkins E.B., BowenD.V., Cowie L.L., Green R.F., Kruk J.W., Savage B.D., ShullJ.M., York D.G., 2000, ApJ 538, L23
Oort J.H., 1970, A&A 7, 381Osterbrock D.P., 1989, “Astrophysics of Gaseous Nebulae and Active
Galactic Nuclei, University Science Book, Mill Valley CAPayne H.E., Dickey J.M., Salpeter E.E., Terzian Y., 1978, ApJ 221,
L95Payne H.E., Salpeter E.E., Terzian Y., 1980, ApJ 240, 499Penton S.V., Stocke J.T., Shull J.M., 2000, ApJS 130, 121Prata S., Wallerstein G., 1967, PASP 79, 202Preston G.W., Shectman S.A., Beers T.C., 1991, ApJS 76, 1001Putman M.E., Gibson B.K., Staveley-Smith L., Banks G., Barnes
D.G., Bhatal R., Disney M.J., Ekers R.D., Freeman K.C., HaynesR.F., Henning P., Jerjen H., Kilborn V., Koribalski B., Knezek P.,Malin D.F., Mould J.R., Oosterloo T., Price R.M., Ryder S.D.,Sadler E.M., Stewart I., Stootman F., Vaile R.A., Webster R.L.,Wright A.E. 1998, Nature 394, 752
Quin D.A., Brown P.J.F., Conlon E.S., Dufton P.L., Keenan F.P.,1991, ApJ 375, 342
Reynolds R.J., Tufte S.L., Haffner L.M., Jaehnig K., Percival J.W.,1998, Proc. Astron. Soc. Australia 15, 14
Reynolds R.J., Tufte S.L., Kung D.T., McCullough P.R., Heiles C.,1995, ApJ 448, 715
Richter P., de Boer K.S., Widmann H., Kappelmann N., Gringel W.,Grewing M., Barnstedt J., 1999, Nature 400, 382
Richter P., Savage B.D., Wakker B.P., Kalberla P.M.W., 2001a, ApJ,in press
Richter P., Sembach K.R., Savage B.D., Murphy E.M., Wakker B.P.,2001b, ApJ, submitted
Robertson J.G., Schwarz U.J., van Woerden H., Murray J.D., MortonD.C., Hulsbosch A.N.M., 1991, MNRAS 248, 508
Routly P.M., Spitzer L., 1952, ApJ 115, 227Russel S.C., Dopita M.A., 1992, ApJ 384, 508Ryans R.S.I., Keenan F.P., Rolleston W.R.J., Sembach K.R., Davies
R.D., 1999, MNRAS 304, 947Ryans R.S.I., Keenan F.P., Sembach K.R., Davies R.D., 1997a,
MNRAS 289, 83Ryans R.S.I., Keenan F.P., Sembach K.R., Davies R.D., 1997b,
MNRAS 289, 986Ryans R.S.I., Sembach K.R., Keenan F.P., 1996, A&A 314, 609Sahu M.S, 1998, AJ 116, 1205Sahu M.S., Blades J.C., 1997, ApJ 484, L125Savage B.D., de Boer K.S., 1979, ApJ 230, L77Savage B.D., de Boer K.S., 1981, ApJ 243, 460Savage B.D., Jenkins E.B., Joseph C.L., de Boer K.S., 1989, ApJ
345, 393Savage B.D., Jeske N.A., 1981, ApJ 244, 768Savage B.D., Lu L., Bahcall J.N., Bergeron J., Boksenberg A., Hartig
G.F., Jannuzi B.T., Kirhakos S., Lockman F.J., Sargent W.L.W.,Schneider D.P., Turnshek D., Weymann R.J., Wolfe A.M., 1993,ApJ 413, 116
Savage B.D., Sembach K.R., 1996a, ARAA 34, 279Savage B.D., Sembach K.R., 1996b, ApJ 470, 893Savage B.D., Sembach K.R., Jenkins E.B., Shull J.M., York D.G.,
Sonneborn G., Moos H.W., Friedman S.D., Oegerle W.R., KrukJ.D., 2000b, ApJ 538, L27
Savage B.D., Sembach K.R., Lu L., 1995, ApJ 449, 145Savage B.D., Wakker B.P., Bahcall J.N., Bergeron J., Boksenberg A.,
Hartig G.F., Jannuzi B.T., Kirhakos S., Lockman F.J., MurphyE.M., Sargent W.L.W., Schneider D.P., Turnshek D., WeymannR.J., Wolfe A.M., 2000a, ApJS, 129, 563
Schwarz U.J., Wakker B.P., van Woerden H., 1995, A&A 302, 364Sembach K.R., Danks A.C., 1994, A&A 289, 539Sembach K.R., Danks A.C., Savage B.D., 1993, A&AS 100, 107Sembach K.R., Howk J.C., Savage B.D., Shull J.M., 2001, AJ,
accepted, astro-ph/0011173Sembach K.R., Savage B.D., 1992, ApJS 83, 147Sembach K.R., Savage B.D., 1996, ApJ 457, 211Sembach K.R., Savage B.D., Lu L., 1995, ApJ 439, 672Sembach K.R., Savage B.D., Lu L., Murphy E.M., 1995, ApJ 415,
616
Sembach K.R., Savage B.D., Lu L., Murphy E.M., 1999, ApJ 515,108
Sembach K.R., Savage B.D., Massa D., 1991, ApJ 372, 81Sembach K.R., Savage B.D., Shull J.M., Jenkins E.B., Murphy E.M.,
York D.G., Ake T., Blair W.P., Davidsen A.F., Friedman S.,Gibson B.K., Kruk J.W., Moos H.W., Oegerle W.R., Sahnow D.,Sonneborn G. 2000, ApJ 538, L31
Shaw C.R., Bates B., Kemp S.N., Keenan F.P., Davies R.D., RogerR.S., 1996, ApJ 473, 849
Smith G.P., 1963, BAN 17, 203Sofia U.J., Jenkins E.B., 1998, ApJ 499, 951Songaila A., 1981, ApJ 243, L19Songaila A., Blades J.C., Hu E.M., Cowie L.L., 1986, ApJ 303, 198Songaila A., Cowie L.L., Weaver H.F., 1988, ApJ 329, 580Songaila A., Cowie L.L., York D.G., 1981, ApJ 248, 956Songaila A., York D.G., 1981, ApJ 242, 976Songaila A., York D.G., Cowie L.L., Blades J.C., 1985, ApJ 293, L15Spitzer L., Fitzpatrick E.L., 1992, ApJ 391, L41Spitzer L., Fitzpatrick E.L., 1993, ApJ 409, 299Stark A.A., Gammse C.F., Wilson R.W., Bally J., Linke R.A., Heiles
C., Hurwitz M., 1992, ApJS 79, 77Staveley Smith L., 1997, Proc. Astron. Soc. Australia 14, 111Stoppelenburg P.S., Schwarz U.J., van Woerden H., 1998, A&A 338,
200Straizys V., Kurilene G., 1981, ApSpSc 80, 353Tamanaha C.M., 1995, ApJ 450, 638Tamanaha C.M., 1996, ApJS 104, 81Tamanaha C.M., 1997, ApJS 109, 139Theissen A., Moehler S., Heber U., Schmidt J.H.K., de Boer K.S.,
1995, A&A 298, 577Tripp T.M., Lu L., Savage B.D., 1998, ApJ 508, 200Tufte S.L., Reynolds R.J., Haffner L.M., 1998, ApJ 504, 773Vallerga J.V., Vedder, P.W., Craig, N., Welsh, B.Y., 1993, ApJ 411,
729van Woerden H., 1993, in “Luminous high-latitude stars”, ed. D.
Sasselov, ASP Conf. Ser. 45, 11van Woerden H., Peletier R.F., Schwarz U.J., Wakker B.P., Kalberla
P.M.W., 1999b, ASP Conf. Ser. 166, 1van Woerden H., Schwarz U.J., Peletier R.F., Wakker B.P., Kalberla
P.M.W., 1999a, Nature 400, 138Verner D.A., Barthel P.D., Tytler D., 1994, A&A 108, 287Vidal-Madjar A., Andreani P., Christiani S., Ferlet R., Lanz T.,
Vladilo G. 1987, A&A 177, L17Vladilo G., Centurion M., de Boer K.S., King D.L., Lipman K.,
Stegert J.S.W., Unger S.W., Walton N.A., 1993, A&A 280, L11Vladilo G., Centurion M., de Boer K.S., King D.L., Lipman K.,
Stegert J.S.W., Unger S.W., Walton N.A., 1994, A&A 291, 425Veron-Cetty M.P., Veron P., 1996, ESO Scientific Report #17, “A
Catalogue of Quasars and Active Nuclei (7th Edition)”.Wakker B.P., 1991, A&A 250, 499Wakker B.P., Howk C., Savage B.D., Tufte S.L. Reynolds R.J., van
Woerden H., Schwarz U.J., Peletier R.F., Kalberla P.M.W., 1999b,Nature 400, 388
Wakker B.P., Howk C., van Woerden H., Schwarz U.J., Beers T.C.,Wilhelm R., Kalberla P.M.W., Danly L., 1996b, ApJ 473, 834
Wakker B.P., Kalberla P.M.W., van Woerden H., de Boer K.S., 2001,Paper II, this volume
Wakker B.P., Mathis J.S., 2000, ApJL, 544, L107Wakker B.P., Oosterloo T.A., Putman M.E., 2001, AJ, submittedWakker B.P., Schwarz U.J., 1991, A&A , 250, 484Wakker B.P., van Woerden H., 1991, A&A 250, 509Wakker B.P., van Woerden H., 1997, ARAA 5, 217Wakker B.P., van Woerden H., de Boer K.S., Kalberla P.M.W., 1998,
ApJ 493, 762Wakker B.P., van Woerden H., Gibson B.K., 1999a, in “Stromlo
workshop on high-velocity clouds”, eds. B.K. Gibson & M.E.Putman, ASP Conf. Ser. 166, 311
Wakker B.P., van Woerden H., Schwarz U.J., Peletier R.F., DouglasN.G., 1996a, A&A 306, L25
Wakker B.P., Vijfschaft B., Schwarz U.J., 1991, A&A 249, 233Wayte S.R., 1990, ApJ 355, 473Weiner B.J., Vogel S.N., Williams T.B., 2001, in “Gas and Galaxy
Evolution”, ASP Conf. Ser., eds. J.E. Hibbard, M.P. Rupen, J.H.van Gorkom
Weiss A., Heithausen A., Herbstmeier U., Mebold U., 1999, A&A344, 955
Welsh B.Y., Craig N., Roberts B., 1996, A&A 308, 428Welty D.E., Frisch P.C., Sonneborn G., York D.G., 1999, ApJ 512,
636Welty D.E., Hobbs L.M., Kulkarni V.P., 1994, ApJ 436, 152Wesselius P.R., Fejes I., 1973, A&A 24, 15West K.A., Pettini M., Penston M.V., Blades J.C., Morton D.C.,
1985, MNRAS 215, 481York D.G., Songaila A., Blades J.C., Cowie L.L., Morton D.C., Wu
C.C., 1982, ApJ 255, 467

25
APPENDIX
DESCRIPTION OF THE COLUMNS
Column 1The name of the stellar or extra-galactic probe. In most cases this is the name given in the publication (see Col. 19).
In a few cases the HD, BD, or PG number is substituted, most notably for the SAO stars in Lilienthal et al. (1990)and Tamanaha (1997), for HZ 22 (=PG1212+369), HZ 25 (=BD+36 2268) and AG+53 783 (=HDE233791) in Ryanset al. (1997a), and for H.O.+23B (=PG1205+228) in Kuntz & Danly (1996) [a revised distance was also determinedfor the latter star by Quinn et al. (1991)]. In the case of extra-galactic objects, an effort was made to use the namesin the Veron-Cetty & Veron (1996) catalogue of QSOs and Seyfert galaxies, even if a different name was used in theabsorption-line publication.Column 2, 3The galactic longitude and latitude of the probe, rounded to 1/100th of a degree. For more accurate values, see SIMBAD
or the original publication.Column 4, 5Column 4 gives the distance to the star and the distance error, in kpc. This is followed by a flag that indicates the
method used to make the estimate. Column 5 shows the z-height in kpc, derived as d sin(b). The following flags are used.“p” − Distance is 1/parallax, as measured by Hipparcos, and as given in SIMBAD. This is used if the parallax is knownto better than about 30%. The distance error is calculated from the given parallax error, using ∆d/d=∆p/p. Usually,the resulting distance is consistent with the spectroscopic distance (see below, under flag “t”) to within 0.1 kpc. The mostnotable exception is HD135485 (type B5IIp), which was estimated to be at 2.5 kpc by Albert et al. (1993) and at 0.8 kpcby Danly et al. (1995), but whose parallax puts it at 0.18 kpc.“a” − Distance determined from a detailed atmospheric analysis based on intermediate-resolution spectroscopy. For 22PG stars, the distance values are taken from Moehler et al. (1990), Theissen et al. (1995), Wakker et al. (1996b), andRyans et al. (1997a, 1997b). In the latter paper 3 non-PG stars were also analyzed (BD+38 2182, BD+49 2137 andHDE233781). The nominal errors (as given in the publications above) are typically 0.3−0.4kpc. In some cases thespectral analysis is difficult because the star may be either a Horizontal-Branch or a post-AGB star. In this case, theactual uncertainty is much larger than the formal uncertainty. In particular, PG0832+675 was at some point thought tobe a main-sequence B1V star at 31 kpc (Brown et al. 1989), but Hambly et al. (1996) found it to be an evolved star at8.1 kpc, which is what is used here.“g” − For stars in globular clusters and in the LMC, the distance is the distance to the cluster or to the LMC. Globularcluster distances are taken from Harris (1996). The LMC is assumed to be at a distance of 50 kpc.“s” − Distance determined from the spectral type, which yields the absolute magnitude of the star. An extinctioncorrection is applied, using the map of Lucke (1978), which gives the average AV out to 2 kpc in mag/kpc for 5◦×5◦
regions on the sky. Except for stars on complex H and clouds AC0 and ACI, the extinction estimates always are below0.2 magnitudes. A distance calculation is done even if the original reference gives a spectroscopic distance, so that alldistances are calculated on the same absolute-magnitude system. The differences between published and re-calculatedvalues are usually less than 10%.For RRLyrae stars, MV =0.58 is assumed, based on recent calibrations of their absolute magnitude (Fernley et al. 1998).
A 10% error is assumed, which corresponds to 0.2 magnitudes.For confirmed Horizontal Branch stars that have not been subjected to a detailed analysis (PG1126+468, PG1510+635,
PG1008+689 and PG1343+577) it is assumed that MV is in the range 0.55 to 1.15 (Preston et al. 1991). The average ofthese two values gives the most likely distance. The distance error is found as half of the range implied by the range inMV . Five probes of complex C are probably also Horizontal Branch stars and the MV values above are also used; betterclassifications are needed to confirm their status.For stars with an MK classification the table of Straizys & Kurilene (1981) is used to convert from spectral type to
MV . The resulting distances are normally within 0.2 kpc of estimates made for the same star by other authors. The(1σ) distance error is estimated by also calculating the distance using a classification that differs by one subtype andone luminosity class. This gives a maximum range for the distance, which is assumed to be equivalent to ±3σ. Formain-sequence stars, as well as for all O-type stars, the typical error is less than 10%. Large relative errors (10−100%)occur for (super)giant A and B stars, where a difference of one luminosity class can make a difference of 2 magnitudes inthe estimated absolute magnitude.“t” − The spectroscopic distance is given, even though the parallax was measured by Hipparcos. However, the measuredparallax is more uncertain than the spectroscopic distance.“r” − Distance given is value quoted in reference, as the spectral type is not well-specified in SIMBAD or the reference,and thus the distance cannot be recalculated on the same system as for other stars. This is the case for BD+10 2179 andH.O.+41B.Column 6The classification of the probe. This can be an MK spectral type, “sd” for subdwarfs (sometimes with subtype), “HB”
for confirmed Horizontal Branch stars, “(HB)” for suspected Horizontal Branch stars, “PAGB” for Post Asymptotic GiantBranch, “SN” for extra-galactic supernovae, as well as the obvious “RR Lyr”, “QSO”, ‘BL Lac”, “Sey” or “Gal”. “radio”is used for 21-cm or 3-mm continuum sources where high-velocity H I absorption has been searched for.

26 Ion Abundances in HVCs and IVCs
Column 7The name or number of the HVC/IVC on which the probe is projected. For IVCs in the IV and LLIV Arch, the core
numbers in the catalogue of Kuntz & Danly (1996) are used. For stars that probe the IV Arch away from its cores “IVa” isgiven. The HVC names and numbers are from the catalogue of Wakker & Woerden (1991). For clouds outside complexesthe catalogue number is preceded by the acronym “WW”. One new HVC complex and three new IVC complexes areintroduced in this paper: “WE”, “K”, the “PP Arch” and “gp”, see Sects. 4.19, 4.27, 4.28 and 4.29.Column 8, 9The best value for the H I velocity and column density in the direction of the probe. The velocity is given in kms−1,
relative to the LSR. The column density and its error are given in units of 1018 cm−2. Upper limits are 5 σ. If there isabsorption, but no corresponding H I component was detected, the value within parentheses refers to the velocity at whichan upper limit to the H I column density is set. For all probes, the H I spectrum and gaussian fits to the components areshown in Paper II.For a few probes the Ca II and/or Na I absorption spectra show multiple components, although only one H I component
can be discerned, When these are closer together than half the FWHM of the H I spectrum, the H I column density issplit in two, assuming that the ion abundance in both components is the same. This results in two H I components listedat the same velocity, suffixed by “a” and “b” for BD+49 2137 (IV17), BD+38 2182 and BD+362268 (Lower IV Arch),PG1008+689 (LLIV Arch), HD 203664 (complex gp), as well as for seven stars in the LMC.Column 10A code that shows the telescope used to measure the H I column density. In general, the value determined at the
highest-available resolution is used, as (especially in cores) H I fine structure can produce variations of a factor of a fewat arcminute scales (Wakker & Schwarz 1991, Wakker et al. 1996b). The following codes are used:We − N(H I) from a combination of Westerbork and Effelsberg data (1 or 2 arcmin beam), derived as described by Wakkeret al. (1996b). This was done for 5 probes (Mrk 106, PG0832+675, PG0859+593, PG0906+597, Mrk 290).Ws − N(H I) from a Westerbork map only (0159+625 in complex H).AP − N(H I) from a combination of ATCA and Parkes data (1 arcmin beam). This was done for NGC 3783 and HD101274(Lu et al. 1998).WJ − N(H I) from a combination of Westerbork and Jodrell Bank data (2 arcmin beam). This was done for HD135485and 4Lac by Stoppelenburg et al. (1998).JD − N(H I) from a combination of Jodrell Bank and DRAO (2 arcmin) data. This was done for the stars in M13 (Shawet al. 1996).Ar − N(H I) from a spectrum taken at Arecibo (3 arcmin beam). This is the case for 20 probes in the H I absorptionstudies of Payne et al. (1980), Colgan et al. (1990) and Akeson & Blitz (1999).Ef, ef − N(H I) derived from a spectrum taken at Effelsberg (9.′1 beam). For 9 probes in complexes A, C, H, and K this isa published value (code “ef”) (Lilienthal et al. 1990, de Boer et al. 1994 and Centurion et al. 1994). For 113 other probesnew spectra were taken with Effelsberg (code “Ef”), see Paper II).JB − N(H I) derived from a published spectrum taken with the Jodrell Bank Mark III telescope (12 arcmin beam). Newgaussian fits were made to 6 of the probes in Ryans et al. (1997a, b), for which no Effelsberg spectrum was obtained (seePaper II). These usually agree with the published values, except when the intermediate-velocity H I component is in theline wing.Pk − N(H I) based on an observation at Parkes (15′ beam). This is the case for 112 stars.PN − N(H I) from a fit to a spectrum extracted from the Parkes Narrow Band Survey (Haynes et al. 1999, 10 sightlines)).These spectra are presented in Paper II.PK − N(H I) from a fit to a spectrum extracted from the Parkes Multi-Beam Survey (HIPASS) (Staveley-Smith 1997).These 4 spectra are presented in Paper II.GB − N(H I) derived from an observation with the Green Bank 140-ft telescope (21 arcmin beam). For 14 extra-galacticsources this is a deep observation done by Murphy (detection limit ∼3×1017 cm−2), see summary in Savage et al. (2000a).For three stars (HD 86248, HD137569 and HD100340) values were taken from Danly et al. (1992) and Albert et al. (1993).Finally for HD93521 and HD215733 the component fits of Spitzer & Fitzpatrick (1993) and Fitzpatrick & Spitzer (1997)were used.PI − For some LMC stars, N(H I) is found from an interpolation between the value toward SN 1987A (see code “AB”below) and Parkes observations toward Sk−69 246 and position JM43 in McGee & Newton (1986).PR − For some LMC stars, N(H I) in the +165, +120 and +65km s−1 clouds was found by using a ruler on the plot ofWayte (1990). These numbers are therefore not very reliable.HC − For SN1991T a special 24-hour integration was done at Hat Creek (see Paper II), in order to achieve a 5 σ upperlimit of 3×1017 cm−2.Dw − For 67 sightlines, N(H I) is based on an interpolation between gridpoints in the LDS (Hartmann & Burton 1997)(36 arcmin beam). That atlas gives the spectrum on every half degree in galactic longitude and latitude. Therefore, foreach velocity channel a weighted average was constructed using the four gridpoints surrounding the direction to the probe;the weights are given by max(0,0.5−R), where R is the distance to the nearest gridpoint in degrees.VE − For HD156359 the limit of 2×1018 cm−2 is based on the fact that Morras et al. (2000) do not list a component atthis position, as determined from observations with the IAR telescope at Villa Elisa.AB − No H I observation directly centered on SN1987A has been published. Welty et al. (1999) derived the value

27
of N(H I) for each spectral component from the abundance pattern of absorption, combined with the likely abundanceof undepleted elements. In particular, if solar abundance (from Anders & Grevesse 1989) and standard halo depletion(from Savage & Sembach 1996a) are assumed, an implied N(H I) can be derived from the column densities of Mg II,Al II, Si II, Mn II and Fe II. This yields column densities of 8.0±2.5 and 5.4±1.9×1018 cm−2 for the components at+120 and +165km s−1, respectively, which are consistent with the N(H I) measured half a degree away by McGee &Newton (1986) in the directions toward Sk−69 246 and their position “JM43”. Using this method for the IVC yieldsN(H I)=31±6×1018 cm−2, a factor 5 higher than the H I spectrum would suggest, indicating either no depletion, lowabundance or a high ionization fraction in this cloud. The analysis of Welty et al. (1999) does not definitively allow achoice between these three possibilities. Here, a column density of 6.5×1018 cm−2 will be used, which is the average ofthe 6.1 and 7.1×1018 cm−2 observed half a degree away.ab − In the H I spectrum of 3C 123 three absorption components are seen, but only one emission component. Except forthe main component, the absorption column density is therefore given in Col. 13.md − For Mrk 509 and PKS2155−304, Sembach et al. (1999) use the Green Bank 140-ft and find that N(H I) is<6×1017 cm−2. A photo-ionization model is used to convert the observed column densities of several ions (C IV, C II,Si III) to a most likely value for N(H) = N(H I) + N(H+). This depends on the assumed metallicity, which may be in therange 0.1−1 times solar. For these two exceptional sightlines, the value in Col. 9 therefore is the total hydrogen columndensity, with an “error” expressing the possible range.Column 11The ion observed in absorption. Some entries between “(” (in Col. 11) and ”)” (in Col. 19) refer to measurements
superseded by a more recent reference.Column 12The velocity (relative to the LSR) of the measured absorption line.
Column 13 This column gives the column density (and error or upper/lower limit) for the observed ion, in units of1011 cm−2.Column 14 A code showing how the column density was derived.“N” − Column density quoted in reference. This is sometimes derived from assuming a linear relation between equivalentwidth and column density, but in many cases from a fit to the apparent optical depth profile or a curve-of-growth.“L” − The logarithm of the column density was given in the reference. In this case the errors are usually given aslogarithmic errors. These are converted to a linear error by calculating (dexp(L+δ)−dexp(L−δ))/2, where L is thelogarithmic column density and δ the logarithmic error. E.g. log(N)=11.25±0.15 indicates a range of 1.3−2.5×10¹¹, andbecomes N=1.8±0.6×10¹¹.“W” − The equivalent width is given in the reference. This is converted to a column density by assuming that the gastemperature is 7000K and using this to calculate the turbulent width from the observed H I linewidth (W (H I)): vturb= sqrt(W (HI)2−W (T)2), where W (T) is given by sqrt(8 ln2 kT/m(H)). The width of the absorption line for the ion isthen found as W (ion) = sqrt(W (T,m(ion))2+v2turb). Then the formula for the equivalent width (EW =
∫
1−exp(−τ(v)))is inverted, assuming τ(v) is gaussian. If the H I linewidth is less than W (7000)=17.9km s−1, vturb=0 and a lowertemperature are assumed and a ’V’ is added to the notes column (this happens in 8 directions). If the H I linewidth wasnot measured (4 directions as well as all LMC sightlines), a value of 30 km s−1 is assumed, and a ’W’ is added to the notescolumn. Note that the derived column density is not very sensitive to the assumed temperature for weak lines.“E” − Detection inferred from large equivalent width. This is the case for 21 extra-galactic sources observed with theFOS (Burks et al. 1994, Savage et al. 2000a). I.e., when expressed as a velocity width, the equivalent width of the Mg IIor C II absorption line is as large or larger than the total width of the H I 21-cm line, including the HVC.“S” − Upper limit to column density derived from a quoted signal-to-noise (S/N) level, which is converted to an equivalent
error using the error formula for fitting a gaussian given by Kaper et al. (1963): σ(W ) = λc
√
3√
π8 ln 2
√W h 1
SN , where
the observed linewidth, W , and a grid spacing h=8km s−1 are used.“τ” − This happens for observations of 21-cm absorption, and the optical depth of the absorption is given. The ioncolumn density column then contains the column density of the absorbing cool H I (but in units of 1018 cm−2 rather than1011 cm−2).Note that for rows giving a summary of cloud parameters, this column may give, within square brackets a reference
value for the column density of highly-ionized atoms (C IV, N V, O VI and Si IV).Column 15The ratio N(ion)/N(H I), in units of 10−9 (i.e., parts per billion or ppb). In the case of H I absorption the ratio
N(H I,absorption)/N(H I,emission) is given. These values should be compared to the expected abundance of the ion,which is given in Col. 16 in the cloud overview (see Sect. 3).Column 16For rows giving an overview of abundances for a particular cloud, Col. 16 shows the expected abundance values (see
Sect. 3), in square brackets. In the case of complexes A and C all expected abundances are scaled down by a factor 10, asan abundance of 0.089 times solar was found for sulphur in complex C (Wakker et al. 1999), and an oxygen abundance of∼0.06 times solar was suggested for complex A (Kunth et al. 1994, Sect. 4.1. Both sulphur and oxygen are not or lightlydepleted onto dust. For directions toward the Magellanic Stream (both the trailing and leading arms), the expectedabundances are scaled down by a factor 4, as indicated by the sulphur abundances found toward NGC3783 and Fairall 9.

28 Ion Abundances in HVCs and IVCs
Column 17The derived abundance relative to the solar abundance, given by Anders & Grevesse (1989), with updates for C, N and
O from Grevesse & Noels (1993).Column 18A flag indicating whether the result gives an upper or lower distance limit. Detections toward stellar probes yield an
upper limit (flag “U”). Non-detections may set a lower limit (flags “l” and “L”, see below), but only if it can be shownthat the line should have been seen if the probe were behind the cloud. To get to that point, there are several effects toconsider.Fine structure in the H I distribution can lead to variations of up to a factor 5 on arcminute scales in HVC cores
(Wakker & Schwarz 1991, Wakker et al. 2001), although the variations may be less outside cores (Wakker et al. 1996b).For eight probes N(H I) has been observed at 35′, 9′ and 2′ resolution (see Paper II). As the covering factor of the verybright spots is low (∼10% of the surface area of the cloud), an observation with a 10−20′ beam will usually give a columndensity accurate to within 50%, i.e. a factor 2. This factor <2 is supported by the results of Savage et al. (2000a). Theycompared N(H I) measured using Lyα with the value measured in 21-cm emission toward 12 extra-galactic probes. TheLyα values are 60−90% of those measured at 21-cm. A more detailed discussion of the comparison between values ofN(H I) derived with different beams is presented in Paper II.The gaseous abundance of an ion may also vary within a cloud, as both the depletion and ionization can vary. For
dominant ions, variations are expected to be small if the H I column density is high, say above 1019 cm−2, while fornon-dominant ions (e.g. Ca II and especially Na I), ionization variations are expected to be large. As discussed in Sect. 3,multiple measurements in the same cloud exist for several ions (mainly Na I, Mg II, S II, Ca II, Fe II). As the quality ofthese measurements is not always the same, and the H I values are usually derived using different telescopes, no systematicstudy can be made. Yet, it is clear that for N(H I)>5×1018 cm−2 most ions show variations of at most a factor 3−5 withina single cloud, whereas Na I can vary by a factor 20 for different sightlines through the same cloud (Meyer & Lauroesch1999; Sect. 3.5).Thus, to determine whether a non-detection is significant and sets a lower limit to the distance of a cloud, the observed
limit is compared with an expected value. This is done in terms of optical depths, since the absorption has to be deepenough to be recognizable. The expected optical depth is calculated by combining the expected column density for theion in question with the measured H I line width. The expected column density is found as the product of the H I columndensity and either the measured or the reference abundance (see Sect. 3 and Col. 16).The expected optical depth is then divided by a safety factor, to account for possible H I small-scale structure and
depletion and/or ionization variations. H I small-scale structure introduces a safety factor of 2. For Na I and for stronglydepleted elements (atomic numbers >18, except Zn), the depletion safety factor is 2.5; for other elements it is 1.5. Theionization safety factor is 5 for Na I, 2 for other elements, except for C II, Mg II and O I, where it is 1. For C II this isbecause the ionization potential of the next ionization stage is high, and C III will only occur where H is (almost) fullyionized. In the case of O I, ionization is not a problem, as O I and H I are coupled through a strong charge-exchangereaction (Osterbrock 1989). A final safety factor of 2 is introduced if the ion abundance had to be assumed. The combinedsafety factor ranges from 3 for O I, C II, and Mg II for clouds where their abundance has been measured, to typical factorsof 10 for Ca II in clouds with known abundance, 12 for Si II and 20 for Fe II for clouds with assumed abundance and afactor of 50 for Na I if its abundance has not been measured in the cloud.If the safety-factor-multiplied expected optical depth is larger than the observed lower limit, the non-detection is
considered significant enough to set a lower limit to the cloud’s distance (flag “l”). If the expected value is more than 3times larger than the observed limit, the distance limit is considered strong (flag “L”).For HVC complex H and the Anti-Center clouds, no direct abundance measurement exists, but in the framework of the
“Local Group model” (Blitz et al. 1999) an abundance of 0.1 times solar is predicted. Therefore, the safety factor needsto be calculated as if the abundance were 1/10th solar.Column 19 − References 1: Prata & Wallerstein 1967; 2: Wesselius & Fejes 1973; 3: Savage & de Boer 1979; 4: Cohen1979; 5: Payne et al. 1978, 1980; 6: Blades 1980, Blades & Meaburn 1980; 7: Meaburn 1980; 8: Songaila & York 1981; 9:Songaila 1981; 10: Savage & de Boer 1981; 11: Savage & Jeske 1981; 12: Songaila et al. 1981; 13: York et al. 1982; 14:Blades et al. 1982; 15: de Boer & Savage 1983; 16: Albert 1983; 17: de Boer & Savage 1984; 18: Ferlet et al. 1985a; 19:Songaila et al. 1985; 20: d’Odorico et al. 1985; 21: Kulkarni et al. 1985; 22: West et al. 1985; 23: Songaila et al. 1986;24: Kulkarni & Mathieu 1986; 25: Morton & Blades 1986; 26: Magain 1987; 27: Vidal-Madjar et al. 1987, Andreani etal. 1987; 28: de Boer et al. 1987; 29: Dupree et al. 1987; 30: Keenan et al. 1988; 31: d’Odorico et al. 1989; 32: Conlonet al. 1988; 33: Songaila et al. 1988; 34: Blades et al. 1988; 35: Meaburn et al. 1989; 36: Molaro et al. 1989; 37: Savageet al. 1989; 38: Lilienthal et al. 1990; 39: Colgan et al. 1990; 40: Wayte 1990; 41: Langer et al. 1990; 42: Bates et al.1990, 1991; 43: Wakker et al. 1991; 44: Mebold et al. 1991; 45: Sembach et al. 1991; 46: Quin et al. 1991; 47: Meyer &Roth 1991; 48: Robertson et al. 1991; 49: Bowen et al. 1991a, 1991b; 50: Danly et al. 1992; 51: Spitzer & Fitzpatrick1992; 52: Molaro et al. 1993; 53: de Boer et al. 1993; 54: Sembach et al. 1993; 55: Bruhweiler et al. 1993; 56: Spitzer& Fitzpatrick 1993; 57: Danly et al. 1993; 58: Albert et al. 1993; 59: Kunth et al. 1994; 60: de Boer et al. 1994; 61:Vladilo et al. 1993, 1994; 62: Centurion et al. 1994; 63: Bowen et al. 1994; 64: Lu et al. 1994a; 65: Little et al. 1994;66: Lu et al. 1994b; 67: Burks et al. 1994; 68: Kemp et al. 1994; 69: King et al. 1995; 70: Schwarz et al. 1995; 71:Sembach et al. 1995; 72: Lipman & Pettini 1995; 73: Ho & Filippenko 1995, 1996; 74: Bowen et al. 1995a; 75: Bowen etal. 1995b; 76: Savage et al. 1995; 77: Keenan et al. 1995; 78: Danly et al. 1995; 79: Wakker et al. 1996a; 80: Welsh et al.

29
1996; 81: Bomans et al. 1996; 82: Ryans et al. 1996; 83: Kuntz & Danly 1996; 84: Benjamin et al. 1996; 85: Caulet &Newell 1996; 86: Savage & Sembach 1996b; 87: Wakker et al. 1996b; 88: Shaw et al. 1996; 89: Lockman & Savage 1995;90: Fitzpatrick & Spitzer 1997; 91: Sahu & Blades 1997; 92: Tamanaha 1997; 93: Ryans et al. 1997a; 94: Ryans et al.1997b; 95: Stoppelenburg et al. 1998; 96: Wakker et al. 1998; 97: Tufte et al. 1998; 98: Tripp et al. 1998; 99: Jannuzi etal. 1998; 100: Lu et al. 1998; 101: Sahu 1998; 102: Kennedy et al. 1998; 103: Kemp & Bates 1998; 104: van Woerdenet al. 1999a; 105: Richter et al. 1999; 106: Wakker et al. 1999b; 107: Lehner et al. 1999a; 108: Lehner et al. 1999b; 109:Welty et al. 1999; 110: Sembach et al. 1995, 1999; 111: Meyer & Lauroesch 1999; 112: Akeson & Blitz 1999; 113: Ryanset al. 1999; 114: van Woerden et al. 1999b; 115: Combes & Charmandaris 2000; 116: Gringel et al. 2000; 117: Bowen etal. 2000; 118: Sembach et al. 2000; 119: Murphy et al. 2000; 120: Penton et al. 2000; 121: Savage et al. 1993, 2000a;122: Gibson et al. 2000; 123: Richter et al. 2001a; 124: Bluhm et al. 2001; 125: Gibson et al. 2001; 126: Richter et al.2001b; 127: Sembach et al. 2001; 128: Fabian et al. 2001; 129: Howk et al. 2001;Column 20 − Notesτ : With the measured FWHM of the H I profile, the column density or equivalent width implies τ>10.W: For the conversion of equivalent width to column density, the H I linewidth is assumed to be 30 kms−1 .V: H I linewidth is <17.9 km s−1 , implying T<7000K; vturb=0 is assumed.T: Last two data columns give spin temperature and width of absorption feature; the N(ion) column gives N(H I) of thecold, absorbing gas, in units of 1018 cm−2 ; the abundance column is N(abs)/N(em).s: Approximate limit for N(Si II), assuming S/N=10 in the line; also: N(C II)<1013 cm−2 .S: Based on IUE spectra in which Si II is the strongest uncontaminated line; spectra for HD100600, HD 97991 andHD121800 in Danly et al. (1992), others unpublished.f: Low-velocity resolution (220 km s−1 ) FOS spectrum, HVC absorption implied by large equivalent width; H I spectrumin Lockman & Savage (1995).1: Also known as Mrk 116; the measurement has a very large error.2: Distance estimate of star has changed a lot. Brown et al. (1989) found it had type B1V, and z=18kpc. Hambly et al.(1996) find z=4.6 kpc.3: Error visually estimated from spectrum and quoted typical S/N.4: Parallax is 2.19±0.92 mas, or d=0.45kpc; 1.2 kpc is 1.5 σ off; d=0.45 kpc would imply type B6IV or B5V.5: Na limit not given, but estimated from S/N=50.6: Is SAO6225 in Lilienthal et al. (1990).7: Is SAO6253 in Lilienthal et al. (1990).8: Is SAO14733 in Songaila et al. (1988).9: Definitively shown to be stellar by Lilienthal et al. (1990).10: In NGC3877, which has vlsr=+910km s−1 .11: Kuntz & Danly (1996) give the distance to this star as 1.8 kpc.12: The Hipparcos parallax is 3.86±1.17 mas, which gives d=250pc, with 1.6 kpc at 2.5 σ; Lehner et al. (1999a) argue fora spectroscopic distance of 1.2 kpc.13: Cloud 63 is ∼1◦ away, while cloud 51, at the southern edge of complex M, is ∼2◦ away; Ryans et al. (1997a) do notlist this component in H I ; it could be in the IV Arch.14: 5 σ upper limits for N(H I) with 12′ beam, (Ryans et al. 1997); with a 20′ beam N(H I)=3.5·1018 cm−2 for BD+382182 and 4.1·1018 cm−2 for HD93521 (Danly et al. 1993).15: Limits for N(Na I) and for N(Ca II) toward HD93521 are implied but not actually given, the errors for BD+38 2182are used as estimate.16: Limit to N(C II), N(O I) and N(Si II) from assuming S/N=20 in the continuum.17: Complex C in region ℓ=80◦ −90◦, b=37◦ −43◦ , and vlsr >−140; distance limit assumes HB classifications are correctfor the BS stars.18: Corrected for S+2 and H+ (i.e. (N(S+)+N(S+2))/(N(H0)+N(H+))), the S abundance is 0.089 solar.19: The N I spectrum is noisy, and was fit by a single component; half of this was assigned to each H I component.20: Total O VI column density split evenly between the two H I components.21: Limit to N(CO) from non-detection of absorption (3-sigma significance), assuming excitation temperature of 10K.22: Danly et al. (1992) classify HD 146813 as B1.5 at d=2.4 kpc, Diplas & Savage (1994) give 2.6 kpc, I would find 3.3 kpc;the SIMBAD type B8V is consistent with the Hipparcos parallax of 2.41±0.78mas, implying d=0.4kpc.23: A non-existent Na I detection at −133km s−1 was also claimed.24: Disputed, very high probability that the line is stellar; moreover, there is no H I at −136kms−1 , the velocity of theclaimed absorption.25: Complex C at ℓ>109◦ and b>49◦.26: Detection not mentioned in paper (Burks et al. 1994), but equivalent widths are 280km s−1 for C II and 160 km s−1 forSi II.27: H I also has component at −118km s−1 (2.7±0.3×1018 cm−2 ).28: Is HD100971.29: Is Feige 87 in Schwarz et al. (1995).30: Complex C at ℓ>101◦, b<48◦ , and ℓ=80◦ −100◦ , b<43◦ , plus vlsr <−140 in region of overlap with C I.31: This is a very doubtful S II component; H I has two components of 19.1 and 11.6×1018 cm−2 at −137 and −102km s−1 .

30 Ion Abundances in HVCs and IVCs
32: Revised equivalent widths from Bowen et al. 1995b.33: Source name is 0959+68W1 in FOS Key Project; H I has tail to −175kms−1 .34: Complex C at ℓ<80◦.35: Is “1749+096” in Akeson & Blitz (1999).36: 4 Lac sets a distance limit on complex G, although this is not commented upon by Bates et al. (1991).37: Components with TB >0.5K in the region ℓ=123◦ to 133◦ , b=−3◦ to +5◦ .38: Continuum source in Westerbork map of core of complex H.39: Centurion et al. (1994) give a distance of 1.1 kpc for HD 10125 and 4.1 kpc for HD 13256.40: Is Hiltner 198 in Centurion et al. (1994).41: Is Hiltner 190 in Centurion et al. (1994).42: Components in the region ℓ=110◦ to 120◦ .43: Components within a few degrees of the core at ℓ=132◦, b=−5◦ .44: The spectral type would suggest a distance of 3.4 kpc, if the extinction is assumed to be 1.6 mag, it may be 5 mag.45: Complex H components outside the three cores.46: Is “0224+671” in Akeson & Blitz (1999).47: Is “0300+470” in Akeson & Blitz (1999).48: The spectral type would suggest a distance of 2.1 kpc, if the extinction is indeed 2.4 mag, it may be 5 mag.49: This star was erroneously called BD+61 2619 by Centurion et al.50: In the H I emission profile only a single, broad component at ∼−60km s−1 can be discerned, listed on the first line.The −73 and −58km s−1 components are only clearly seen in absorption; the listed H I column densities are those of theabsorption.51: Kulkarni & Mathieu (1986) classify this as an O star at 2.5 kpc. According to SIMBAD it is a B star. According toGarmany et al. (1987) it is O5V at 8.0 kpc.52: Error assumed from quoted S/N of 100, width 15 km s−1 and grid 6 km s−1 .53: Is SAO76016 in Songaila et al. (1988).54: Is SAO76994 in Songaila et al. (1988).55: Is SAO76980 in Songaila et al. (1988).56: Is SAO76954 in Songaila et al. (1988).57: Estimated S/N=20 for the IUE spectra.
58: A general 5m◦
A detection limit is given.59: Is “0239+108” in Akeson & Blitz (1999).60: Cloud 363 is the “Giovanelli Stream”, is “0428+20” in Akeson & Blitz (1999).61: Cloud 525 (v=−231) is 1 degree away in the Dwingeloo survey.62: Cloud 419 in pop. GCN ∼1 degree away.63: N(H,total) based on photo-ionization models; N(H I)<0.6×1018 cm−2 from Green Bank data.64: Total O VI column density split in ratio 1:2 between the two components.65: About 10◦ away from nearest GCN cloud; an unclassified H I HVC at −133km s−1 is detected 15 arcmin away.66: Is “1829+29” in Akeson & Blitz (1999).67: Is “1901+319” in Akeson & Blitz (1999).68: Is “1828+487” in Akeson & Blitz (1999).69: Is “2037+511” in Akeson & Blitz (1999).70: A deeper STIS spectrum suggests that the CIV component at −213 km/s may not be real.71: Lockman & Savage (1995) give a 72km s−1 wide component from −150km s−1 to −78km s−1 ; this was split in two.72: Is “1928+738” in Akeson & Blitz (1999); H I has tail to −161km s−1 .73: H I has tail to −128km s−1 .74: Is “0538+498” in Akeson & Blitz (1999).75: Average of values toward 5 probes with N(H I)>2.5×1018 cm−2 .76: Low-velocity resolution (220 kms−1 ) FOS spectrum, but HVC component is separately seen; the actual EW valuesand velocities are from Jannuzi et al. (1998).77: Is PG0007+106.78: N(H I) from single-component fit, although there are two H I components: at +194km s−1 , N(H I)=75.3±0.8×10¹⁸,width 45.0 km s−1 , and +140km s−1 , N(H I)=13.7±0.6km s−1 , width 27.7 km s−1 ; in absorption usually only one component can be discerned.
79: The Na I and Ca II absorptions toward Fairall 9 found by Songaila & York (1981) were published again by Songaila(1981).
80: Lu et al. (1994) give EW(Si II-1260)=368m◦
A, but this is for absorption from +160 to +300km s−1 , and is larger thanpossible for the observed H I linewidth of 37 km s−1 . Possibly there is an extra component at v∼+200km s−1 . The EWlisted here is the maximum possible given the observed W (H I).81: Lu et al. (1994) use a linear conversion from equivalent width.82: Parallax measured as 1.84±1.22mas; distance given as 6.2 kpc by Danly et al. (1992), as 6.6 kpc by Diplas & Savage(1994).83: Cloud WW84 is very centrally condensated, and a 10′ Effelsberg beam centered on Mrk 205 picks up some of the very

31
bright emission from the cloud center. WSRT observations have not yet been properly combined with single-dish data.The tabulated value is the current best guess.84: Parallax measured as 5.52±1.13mas, revising distance down from 0.8 kpc in Danly et al. (1995), or 2.5 kpc in Albertet al. (1993); N(H I) from Stoppelenburg et al. (1998).85: Probably circumstellar (Danly et al. 1996). Albert et al. (1993) do not actually claim this as a detection.86: Is 3C206.87: Nearest HVC (WW364, v=+120) is 6◦ away, but the region was only sampled on a 2×2◦ grid.88: In NGC4527, which has vlsr=+1733km s−1 .89: HVC100−7+100; N(H I) from Stoppelenburg et al. (1998); parallax is 1.54±0.52mas, giving d<1.0 kpc (1 σ).90: In NGC 5194, which has vlsr=+463kms−1 ; paper assumes a ratio N(Na I)/N(H I), but the implied N(H I) then ismuch larger than limit from the Dwingeloo profile.91: In M81, which has vlsr=−130km s−1 , −40km s−1 at position of SN1993J92: In NGC4526, which has vlsr=+625km s−1 , 880 km s−1 at position of SN 1994D; faint H I found at Arecibo; theerratum corrects the misconception that this originates inside NGC4526.93: In NGC5128, which has vlsr ∼+400km s−1 ; HVCs 219 and 208 are 1◦ and 3◦ away.94: In M83, which has vlsr=320−620kms−1 .95: Average of values toward SN 1987A and Sk−69 243. These are consistent with the values for other probes, for whichN(H I) is uncertain and low.96: IUE spectra without measurements are presented by de Boer et al. (1987) and Dupree et al. (1987).97: Ca II profile was published, but not the measurements; estimated equivalent widths.98: N(H I) from McGee & Newton (1986).99: Average of the values found toward Sk−67 104, Sk−67 166, and Sk−68 82.100: Average of the values found toward SN 1987A, Sk−67 104, Sk−67 166, and Sk−68 82.101: Average of the values found toward Sk−67 104, Sk−67 166, and Sk−68 82.102: Average of the best determinations, toward SN 1987A, Sk−69 243, Sk−69 246, Sk−69 247, Sk−71 41, Sk−71 42 andSk−71 45.103: Average of the values found toward SN 1987A, Sk−67 104, Sk−67 166, Sk−68 82 and Sk−69 246.104: Absorption occurs at all velocities between 0 and +300km s−1 ; results given for velocity range 120 to 190 km s−1 ;for AlIII the 1854 line gives logN=11.64, the 1862 line has logN=12.08.105: HDE268605.106: N(H I) from McGee & Newton (1986), position JM43; also has component at +182 (5.9×10¹⁸).107: Value toward SN1987A, which is the only reliable one; equivalent widths toward Sk−67 05, Sk−68 82 and Sk−71 3are only rough values; Molaro et al. (1993) find an upper limit of 5.2 ppb toward Sk−69 246.108: Average of the values toward Sk−67 05 and Sk−67 104; Blades et al. (1988) imply 2.6 solar toward SN1987A, butthat column density is very uncertain and was not measured by Welty et al. (1999).109: The three measurements are very discrepant: 0.08 solar toward Sk−69 246 (Savage & de Boer 1981), 0.85 solartoward Sk−67 104 (Savage & Jeske 1981) and 2.1 solar toward SN1987A (Welty et al. 1999).110: Average of values toward SN1987A, R 139, R 140, Sk−69 243, Sk−69 246, Sk−69 248, Sk−69 255, Sk−71 41, Sk−7142 and Sk−71 45. For other measurements N(H I) is based on interpolation or reading off plots.111: Value toward SN1987A; toward Sk−69 246 Savage & de Boer (1981) found 0.2 solar, but this is uncertain; the valuestoward Sk−67 05 and Sk−67 104 are for the combined +65 and +120km s−1 components.112: In absorption components are seen at −64, −45 and −30 km s−1 , but in the H I spectrum these are blended. Thefit was forced to have components at −65 and −45 km s−1 .113: At the edge of IV6, which is not separately visible in the H I emission spectrum.114: Mg II column densities determined from the 1239/1240 lines are corrected downward by 0.67 dex, see Savage &Sembach (1996a).115: In the paper, the fits to these components are shown, but no numbers are given − they were provided by Bowen.116: Mixture of IV17 & IV26; IVC absorption not listed in Schwarz et al. (1995).117: Ca absorption does not resolve IV9 (v=−73, TB=0.56 K) and IV19 (v=−48, TB=2.36 K); column densities arecombined values.118: In the GHRS absorption spectrum IV9 and IV19 are hard to separate, the combined S II column density wasproportionally divided between the two H I components.119: Spectrum analyzed by Conlon et al. (1988); coordinates differ from those quoted by Kuntz & Danly (1996), who alsoconfuse z and d.120: Is HZ 22 in Ryans et al. (1997a).121: The discrepancy between the “normal” value for the Ca II of IV15 abundance measured toward Mrk 290 and theunusually high (by a factor 10) value toward BTDra suggests that the −83km s−1 absorption toward BTDra may bestellar (its b-value is also unusually low).122: Is HZ 25 in ref.123: Ryans et al. (1997a) call this star AG+53 783 and give ℓ=154.◦4, b=56.◦6; is this the same star? Possibly it is a B9Vstar at 1.1 kpc; the identification of AG+53 783 with HDE233791 is based on SIMBAD.124: O I-1304, C II-1334, Si II are seen in the line wing.

32 Ion Abundances in HVCs and IVCs
125: Is HIP55461.126: In reference as H.O.+23B, to which SIMBAD has 11 references with coordinates differing by up to 5′′ ; z determinedby Quin et al. (1991).127: N(H I) fitted to a spectrum in which M81 was taken out by means of a third order polynomial fit; the uncertaintyreflects the uncertainty in the zero level at v=−50km s−1
128: Assuming S/N=30.129: BD names given in paper: HDE237844 = BD+56 1411, HDE233622 = BD+50 1631.130: Combined component groups 1−2, 3−5 and 6−9 to form −92, −56 and −43km s−1 components.131: For the −56 and −43 kms−1 components, the (logarithmic) ionization fraction has been determined to be −3.6 to−1.3 and −3.6 to −1.9, respectively.132: Penton et al. (2000) fit a component at +60 km s−1 to the S II-1250, 1253 and 1259 lines, with EWs of 58, 85 and
30 m◦
A; S II-1259 is blended with Si II-1260. The weaker lines are shown by Sembach et al. (1999), and this shows thatthey half as strong. The listed column density is based on the lower EWs.133: Originally found by York et al. (1982), analyzed by Blades & Morton (1983), and improved by Morton & Blades(1986).134: N(H I) determined by interpolating between the values on a 3×3 grid with 9′ spacing.135: M 15 NW/SE core refer to the positions with the highest and lowest Na I abundance measured using a 7x13(27′′ ×43′′ ) array of 3 arcsec fibers.136: In NGC1316, which has vlsr=+1521km s−1 .137: de Boer & Savage (1984) claimed to have found this C II absorption line; however recent FUSE data (Howk priv.comm.) do not show the absorption in the C II-1036 and other strong lines.

33
TABLE 1a
Index to main table
1 A, MI, IV4, WW63 15 LMC-HVC @+120 (=LMm)
2 MII, CI 16 LMC-IVC @+120 (=LMm), @+60 (=LMl)
3 CI, CIII, C-south 17 LMC-IVC @+60 (=LMl)
4 C-extension, C/K, G 18 LMC-IVC @+60 (=LMl)
5 H 19 LMC-IVC @+60 (=LMl)
6 AC shell (=ACS) AC0, ACI, ACII, Cohen Stream (=CHS) 20 IV7, IV6, IV17, IV11
7 CHS, WW507, Other AC, GCN 21 IV9, IV15, Upper IV-Arch (=IVupp), IV24, IV26, IV21, IV19
8 GCN, GCP, Outer Arm (=OA), R 22 Lower IV-Arch (=IVlow)
9 Magellanic Stream (=MS) 23 IV spur, LLIV
10 Pop. EP, Pop. EN 24 LLIV, K
11 L, WB, WE, positive-velocity HVCs (=wa/wb) 25 PP-Arch (=PP), southern IVCs (=IVsouth)
12 faint HVCs (=fHVC) 26 gp
13 LMC-HVC @+160 (=LMh) 27 Other neg-vel HVCs (=on), Other pos-vel HVCs (=op)
14 LMC-HVC @+160 (=LMh), @+120 (=LMm)
0159+625 H BRUMa MI HD100340 IV spur, op
0224+671 (4C 67.05) H BS 16034-0002 CI HD100600 IV spur
0239+108 (4C 10.08) WW507 BS 16034-0114 CI HD100971 (SUDra) CIII
0300+470 (4C 47.08) H BS 16079-0015 CI, IV15 HD101075 CIII, IV21
0428+20 (PKS0428+205) Other AC BS16079-0017 CI HD101274 WW187,on,op
0538+498 (3C 147.0) OA BS16086-0123 CI HD101714 IV21
0959+68W (FBS0959+685) C-south BTDra CI, IV15 HD102383 WW187
1749+096 (4C 09.57) C-extension Barnard 29 K HD103718 CIII, IV21
1828+487 (3C 380.0) OA CTA21 Other AC HD105058 IV4, IV17
1829+29 (4C 29.56) OA CTA102 MS HD106420 IV4, IV17
1901+319 (3C 395) OA FBS0959+685(0959+685) C-south HD121800 IV9, IV19
1928+738 (4C 73.18) OA Fairall 9 MS HD127557 CIII, IV9
2037+511 (3C 418) OA Feige40 IV spur HD135485 L
2331+073 MS Feige87 (PG1338+611) CIII, IV19 HD137569 on
3C 33 IV-south Hiltner 190 (LS I+62 200) H HD146813 CI
3C 41 IV-south Hiltner 198 (LS I+61 251) H HD156110 C-extension,op
3C 75 CHS HD108 H HD156359 WE
3C 78 CHS HD1383 H HD173011 GCN
3C 109 Other AC HD2619 H HD176502 OA
3C 123 ACS HD3175 MS HD178329 OA
3C 147.0 (0538+498) OA HD10125 H HD187350 GCN, GCP
3C 200 wa/wb HD12323 H HD188350 GCN, GCP
3C 206 (PKS0837{12) WB HD12567 H HD188859 GCP
3C 263.0 CIII HD12993 H HD189818 OA
3C 351.0 CI HD13256 H HD203664 gp
3C 380.0 (1828+487) OA HD14069 CHS HD203699 IV-south, gp
3C 382 OA HD14633 IV-south HD205021 OA
3C 386 OA HD14947 H HD205556 gp
3C 395 (1901+319) OA HD14951 CHS, WW507 HD212593 (4 Lac) G, fHVC
3C 418 (2037+511) OA HD15629 H HD215733 PP
3C 454.3 MS HD16581 IV-south HD219188 MS
4C 06.41 wa/wb HD16582 Other AC HD220172 MS
4C 09.57 (1749+096) C-extension HD17473 CHS, WW507 HD223987 H
4C 10.08 (0239+108) WW507 HD17481 CHS, WW507 HD225160 H
4C 29.56 (1829+29) OA HD17505 H HDE233622(BD+50 1631) LLIV
4C 33.48 OA, R HD17520 H HDE233791(AG+53 783) IVlow
4C 47.08 (0300+470) H HD17907 CHS, WW507 HDE236894 H
4C 67.05 (0224+671) H HD18059 CHS, WW507 HDE237844(BD+56 1411) LLIV
4C 73.18 (1928+738) OA HD18910 CHS, WW507 HDE241573 ACI, ACII
4 Lac (HD212593) G, fHVC HD32641 (SAO76954) ACI, ACII HDE241597 ACI, ACII
ADUMa A HD33090 (SAO76980) ACI, ACII HDE241882 ACI, ACII
AG+53 783 (HDE233791) IVlow HD33233 (SAO76994) ACI, ACII HDE248894 ACS
B2 1607+26 K HD33415 (SAO76016) ACI, ACII HDE252550 AC0
BA 90700003 IVupp HD36402 (Sk{67 104) LMm, LMl HDE252605 AC0
BD+10 2179 wa/wb HD38268 (Sk{69 243) LMh, LMm, Lml HDE253069 AC0
BD+36 2268 (HZ 25) IVlow HD38282 (Sk{69 246) LMm, LMl HDE255055 ACS
BD+38 2182 MII,IV6,IVlow,op HD42904 AC0 HDE256035 ACS
BD+49 2137 IV4, IV17 HD45314 ACS HDE256725 ACS
BD+50 1631 (HDE233622) LLIV HD68164 A, LLIV HDE269546 (Sk{68 82) LMm, LMl
BD+56 1411 (HDE237844) LLIV HD75855 A HS0624+6907 OA
BD+59 367 H HD76593 (SAO14733) A HZ22 (PG1212+369) IVupp, IV26
BD+62 338 H HD77770 A, LLIV HZ25 (BD+36 2268) IVlow
BD+63 253 H HD83206 WW63, LLIV, on H1821+643 OA
BD+63 985 CIII, IV21 HD86248 WW211 H.O.+23B (PG1205+228) IV spur
BD+67 598 LLIV HD87015 IV24 H.O.+41B IV26
BD+75 306 (SAO6225) A HD93521 MII,IV6,IVlow,op H.O.+43B (PG1205+228) IV spur
BD+75 310 (SAO6253) A HD98152 IV26 III Zw 2 (PG0007+106) MS
1

34 Ion Abundances in HVCs and IVCs
TABLE 1b
Index to main table - continued
IUCas G PKS0003+15 MS Sk{66 169 LMm
IZw 18 (Mrk 116) A PKS0103{453 MS Sk{67 05 LMm, LMl
LH10 3120 LMm, LMl PKS0202+14 CHS Sk{67 104 (HD36402) LMm, LMl
LS I+61 251 (Hiltner198) H PKS0202{76 MS Sk{67 120 LMm, LMl
LS I+62 200 (Hiltner190) H PKS0232{04 fHVC Sk{67 166 LMh, LMm, LMl
M13 stars K PKS0252{712 MS Sk{67 169 LMm, LMl
M15 stars gp PKS0407{658 MS Sk{67 174 LMl
Mrk 106 A, LLIV PKS0409{752 MS Sk{67 250 LMl
Mrk 116 (I Zw 18) A PKS0428+205 (0428+20) Other AC Sk{68 82 (HD269546) LMm, LMl
Mrk 205 C-south, EN PKS0637{75 MS Sk{68 114 (R 116) LMl
Mrk 279 C-south PKS0837{12 (3C 206) WB Sk{68 135 LMh, LMl
Mrk 290 CI PKS1136{13 wa/wb Sk{68 137 LMh
Mrk 501 C-extension, K PKS1739+17 C-extension Sk{69 51 LMh
Mrk 509 GCN, gp PKS1741{038 C-extension Sk{69 52 LMh
Mrk 595 CHS PKS1820+17 OA Sk{69 91 LMm, LMl
Mrk 817 CI PKS1923+210 EN Sk{69 103 LMl
Mrk 876 CI, C-south PKS2155{304 GCN Sk{69 104 LMl
NGC 1705 WW487 PKS2243{123 MS Sk{69 106 LMh, LMl
NGC 2808 op PKS2251+11 MS Sk{69 107 LMh, LMl
NGC 2841UB3 A PKS2340{036 MS Sk{69 195 LMm, LMl
NGC 3783 WW187, on, op PKS2344+09 MS Sk{69 203 LMm, LMl
NGC 7469 MS PKS2345{167 MS Sk{69 204 LMm, LMl
OWHer C-extension QSO1637+574 CI Sk{69 211 LMh, LMm, LMl
PG0007+106 (III Zw 2) MS QSO1732+389 C-extension Sk{69 213 LMm, LMl
PG0039+048 MS, PP QSO2005+403 OA Sk{69 215 LMm, LMl
PG0039+134 IV-south QSO2200+420 G Sk{69 216 LMh, LMm, LMl
PG0043+039 MS RSCas H Sk{69 220 (R 127) LMl
PG0229+064 op R 116 (Sk{68 114) LMl Sk{69 221 (R 128) LMl
PG0804+761 LLIV R 127 (Sk{69 220) LMl Sk{69 224 LMm, LMl
PG0832+675 A, LLIV R 128 (Sk{69 221) LMl Sk{69 225 LMm, LMl
PG0833+698 LLIV R 134 LMl Sk{69 239 LMm, LMl
PG0859+593 A, LLIV R 136 (Sk{69 243) LMh, LMm, LMl Sk{69 243 (HD38268) LMh, LMm, LMl
PG0906+597 A, LLIV R 137 LMl Sk{69 246 (HD38282) LMm, LMl
PG0953+414 fHVC, IVlow R 139 LMl Sk{69 247 LMm, LMl
PG0955+291 IV7, IVlow R 140 LMl Sk{69 248 LMl
PG1008+689 LLIV SA12 391 A, LLIV Sk{69 255 LMl
PG1116+215 fHVC SAO6225 (BD+75 306) A Sk{69 270 LMl
PG1126+468 MI, IV17 SAO6253 (BD+75 310) A Sk{69 274 LMm, LMl
PG1205+228 (H.O.+23B) IV spur SAO14733 (HD76593) A Sk{69 276 LMh, LMl
PG1212+369 (HZ 22) IVupp, IV26 SAO76016 (HD33415) ACI, ACII Sk{69 282 LMh, LMm, LMl
PG1213+456 IV4, IV17, IVlow, op SAO76954 (HD32641) ACI, ACII Sk{69 289 LMl
PG1255+546 IV11, IVlow SAO76980 (HD33090) ACI, ACII Sk{69 290 LMh, LMm, LMl
PG1259+593 CIII, IVlow SAO76994 (HD33233) ACI, ACII Sk{70 111 LMm, LMl
PG1338+611 (Feige87) CIII, IV19 SN1981D on Sk{70 115 LMl
PG1351+640 CI, CIII, IV9, IV19 SN1983N fHVC, op Sk{71 3 LMm, LMl
PG1510+635 CI SN1986G fHVC, op Sk{71 33a LMm, LMl
PG1519+640 CI SN1987A LMh, LMm, LMl Sk{71 41 LMm, LMl
PG1619+522 C/K SN1991T wa/wb, fHVC Sk{71 42 LMm, LMl
PG1648+536 CI, C-south SN1993 J fHVC, LLIV Sk{71 45 LMm, LMl
PG1700+518 C-extension SN1994D fHVC TonS180 MS
PG1708+602 C-south SN1994 I fHVC TonS210 MS
PG1710+490 C-extension, C/K,op SN1998 S IV4, IV17, op V421Her C-extension, op
PG1718+481 C-extension SUDra (HD100971) CIII vZ 1128 on
PG1722+286 C-extension, K SWDra C-south
PG1743+477 C-extension, C/K Sk{65 40 LMl
PG2302+029 MS Sk{66 28 LMl
PG2337+070 MS Sk{66 118 LMm, LMl
1

35
iProbe l b d z type Cld vHI NHI tel ion vion Nion code Aion Aref A/A
�
D? Ref Note
� � kpc kpc km=s 1018 cm�2 km=s 1011 cm�2 10�9 10�9
(1) (2) (3) (4) (5) (6) (7) (8) (9) (10) (11) (12) (13) (14) (15) (16) (17) (18) (19) (20)
Complex A < 9:9 < 6:8 OI 4.6E4�4.8E4 [74000] 0.062 (0.1Z�
)
> 4:0 > 2:6 NaISiII 5200�4500 [1900] 0.15MgII >1300 [1400] >0.034CaII 19�5 [22] 0.0087
Mrk 106 161:14 42:88 Sey AVI �157 38�3 WE MgII �157 >500 N >1300 >0.035 87CaII �157 6.7�2.3 N 18�6 0.0081 70
I Zw 18 160:53 44:84 dIrr AVI �170 20�1 Ef OI �160 9100�9600 W 4.6E4�4.8E4 0.062 59 1SiII �160 1000�900 W 5200�4500 0.15 59
NGC 2841 UB3 166:85 43:81 QSO A �123 0.60�0.10 GB MgII >0 E >0 >0 121 fAD UMa 160:40 43:28 9:9�1.0 t 6:8 RR Lyr AVI �158 80�1 Ef CaII �160 17�2 W 21�2 0.0096 U 104PG 0832+675 147:75 35:01 8:1 a 4:6 PAGB AIII �144 30�6 WE( CaII <2.8 N <9.3 70) 2
CaII <2.7 W <9.1 94PG 0859+593 156:94 39:74 4:0�1.0 a 2:6 HB AIV �166 34�4 WE MgII <23 N <68 L 87SA 12 391 156:95 40:28 1:5�0.2 s 0:97 A0V AIV �155 24�4 Ef CaII <2.4 W <10 33 3HD 77770 169:30 41:88 1:3�0.3 t 0:87 B2IV WW81 �117 4.0�1.0 Dw NaI <0.44 W <11 80 4
CaII <1.0 W <26 80PG 0906+597 156:22 40:56 0:70�0.20 a 0:46 sdB AIV �153 29�5 WE MgII <12 N <41 L 87BD +75 306 139:02 28:79 0:58�0.06 s 0:28 A2V AI �187 182�3 ef NaI <1.3 S <0.71 38 5,6BD +75 310 139:45 29:14 0:50�0.06 s 0:24 A5V AI �184 329�3 ef NaI <1.4 S <0.42 38 5,7HD 75855 159:45 39:08 0:45�0.21 p 0:28 B9V A �167 6.0�1.3 Dw NaI <0.74 W <12 80
CaII <1.8 W <29 80HD 68164 154:62 33:45 0:35�0.13 p 0:19 B9V A �187 9.7�1.3 Dw NaI <0.44 W <4.5 80
CaII <1.0 W <11 80HD 76593 154:65 38:91 0:22�0.06 p 0:14 A0V AIV �180 76�15 ef NaI <0.29 W <0.38 33 8
CaII <0.69 W <0.91 l 33 3Mistaken claimsSA 12 391 156:95 40:28 1:5�0.2 s 0:97 A0V AIV �155 24�4 Ef CaII �165 3.0�1.0 N 13�5 0.0058 U 33 9
Cloud MI CaII [22]PG 1126+468 157:20 64:71 5:8�0.7 s 5:2 HB MI �100 7.5�0.5 Ef CaII <3.5 N <47 70BR UMa 165:53 66:29 4:7�0.5 s 4:3 RR Lyr MI �117 106�0.8 Ef CaII <12 N <11 70
MI ext (IV4) (< 0:8 < 0:7) SiII [19000]
> 0:6 > 0:5 MgI 6.6�1.4 0.00017CaII 3.3�0.9 [22] 0.0015FeII 1600�80 [7800] 0.051MnII 44�11 [87] 0.13
SN 1998 S 150:75 65:96 SN IV4 �87 43�2 Ef MgI �95:3 2.8�0.6 L 6.6�1.4 .00017 117 10CaII �95:3 1.4�0.4 L 3.3�0.9 0.0015 117FeII �95:3 710�20 L 1600�80 0.051 117MnII �95:3 19�5 L 44�11 0.13 117
PG 1213+456 141:93 70:44 2:9�0.7 a 2:7 sdB IV4 �86 2.5�0.5 JB CaII <1.3 L <50 93BD +49 2137 134:23 67:40 0:80�0.20 a 0:74 HB IV4 �102 17�1 Ef SiII >90 N >530 >0.015 U 83 11,S
CaII <0.35 W <2.1 93HD 106420 140:59 68:79 0:55�0.27 p 0:51 B8V IV4 �110 18�1 Ef SiII <90 N <500 L 83 SHD 105058 141:16 65:80 0:19�0.04 p 0:17 A2V IV4 �92 27�1 Ef SiII <90 N <330 L 83 SMistaken claimsHD 83206 167:70 46:93 0:90�0.20 t 0:66 B3V WW63 (�108) <2.0 Ef NaI <0.025 L X 107 12,13
( CaII �107 0.54 L >27 >0.012 U 94)CaII �108:2 0.71 L >35 >0.016 U 107

36
IonAbundancesin
HVCsandIV
Cs
Probe l b d z type Cld vHI NHI tel ion vion Nion code Aion Aref A/A
�
D? Ref Note
� � kpc kpc km=s 1018 cm�2 km=s 1011 cm�2 10�9 10�9
(1) (2) (3) (4) (5) (6) (7) (8) (9) (10) (11) (12) (13) (14) (15) (16) (17) (18) (19) (20)
Cloud MIII < 4:0 < 3:5BD +38 2182 182:16 62:21 4:0 a 3:5 B3V MIII (�93) <0.50 JB CII �85 >600 N >1.2E5 >0.34 U 57 14
OI �85 >1000 N >2.0E5 >0.27 U 57NaI <0.33 N 77 15SiII �85 >200 N >4.0E4 >1.1 U 57
( CaII �96 1.4�0.3 N >290 >0.13 U 77)CaII �96 1.4 L >290 >0.13 U 93
HD 93521 183:14 62:15 1:9 t 1:7 O9.5V MIII (�93) <0.50 JB CII <80 S 57 14,16OI <210 S 57 16NaI <0.33 N 77 15SiII <10 S 57 16CaII <0.90 N 77 15
C I (> 6:1 > 4:3) NI 7500�3200 [9300] 0.080 0.1Z�
,17
> 1:2 > 0:8 NII >530 >0.0057OVI [2000]NaIMgII >0 [1400] >0SiII [1900]SiIII 2100 0.060PII <310 [37] <0.83SII 1800�400 [1900] 0.098 18ArI <350 [120] <0.095CaII 22�1 [22] 0.010FeII 1.6E4�6.5E3 [780] 0.50FeIII <2900 <0.091
PG 1351+640 111:89 52:02 QSO CIA �115 7.2�3.0 Ef CaII �118 8.2�1.4 N 110�50 0.052 79Mrk 290 91:49 47:95 Sey CIA �136 92�7 WE SII �135 1700�400 N 1800�400 0.098 106
( SII �135 1700�100 N 1900�200 0.100 125)CaII �137 20�1 N 21�2 0.0098 79
C �105 33�5 Ef CaII �89 4.1�0.9 N 12�3 0.0056 79Mrk 817 100:30 53:48 Sey CIA �109 31�0.9 Ef SII �112 1900�100 N 6200�500 0.33 125Mrk 876 98:27 40:38 QSO CIB �133 19�0.9 Ef H2 <2000 N <1.1E4 119
NI �133 1000�100 N 5400�700 0.058 125NI �133 1400�600 N 7500�3200 0.080 119 19NII �133 >100 N >530 >0.0057 119OVI �133 580�110 N 119 20SiIII �133 400 N 2100 0.060 125PII �133 <58 N <310 119ArI �133 <65 N <350 119FeII �130 3000�1200 N 1.6E4�6.5E3 0.50 119FeIII �130 <550 N <2900 119
3C 351.0 90:08 36:38 QSO CIB �129 4.2�0.3 Ef MgII >0 E >0 >0 121 fQSO 1637+574 86:64 40:36 QSO CIB �122 33�1 Dw HI <74 � T
s
>140 112 TCO <1.3E4 N <3.9E4 112 21
BS 16034-0002 91:60 48:86 8:8�1.0 s 6:6 (HB) CIA �121 33�2 Ef CaII <3.0 W <9.1 114BS 16034-0114 89:40 45:07 6:1�0.7 s 4:3 (HB) CIB �125 68�1 Ef CaII <1.5 W <2.2 l 114BS 16079-0017 91:05 46:60 4:8�0.5 s 3:5 (HB) CIA �141 31�1 Ef CaII <3.0 W <9.7 114BS 16086-0123 92:14 47:40 4:5�0.5 s 3:3 (HB) CIA �141 36�2 Ef CaII <3.0 W <8.3 114
�113 7.8�1.3 Ef CaII <3.0 W <38 114PG 1510+635 100:69 47:28 4:2�0.5 s 3:1 HB CIA �114 11�1 Ef CaII <4.8 N <42 70BS 16079-0015 90:69 46:46 2:4�0.5 s 1:7 (HB) CIA �135 35�2 Ef CaII <2.4 W <6.8 114
C �105 5.6�2.0 Ef CaII <2.4 W <43 114BT Dra 99:41 51:21 1:9�0.2 t 1:5 RR Lyr C �109 7.9�1.1 Ef NaI <0.15 W <1.9 19
CaII <1.2 W <15 33 3

37
Probe l b d z type Cld vHI NHI tel ion vion Nion code Aion Aref A/A
�
D? Ref Note
� � kpc kpc km=s 1018 cm�2 km=s 1011 cm�2 10�9 10�9
(1) (2) (3) (4) (5) (6) (7) (8) (9) (10) (11) (12) (13) (14) (15) (16) (17) (18) (19) (20)
PG 1648+536 81:38 39:35 1:2�0.5 a 0:76 sdB C �133 12�1 Ef MgII <7.9 L <66 L 60FeII <100 L <830 l 60
PG 1519+640 100:27 46:17 0:70�0.20a 0:50 sdB C �121 8.9�1.6 Ef NaI <2.0 L <22 62MgII <3.2 L <36 L 60FeII <13 L <140 L 60CaII <4.0 L <45 62
HD 146813 85:71 43:81 0:41�0.13p 0:28 B8V CIB �109 37�2 Ef SiII <230 N <620 50 s,22Mistaken claimsBT Dra 99:41 51:21 1:9�0.2 t 1:5 RR Lyr CIA �109 7.9�1.1 Ef NaI �110 1.7�0.05 W 22�3 0.011 U 19 23
CaII �136 6.0 N 76 0.035 U 33 24
C III CII >0 [35000] >0 0.1Z�
,25NI 4300 [9300] 0.046OI 7.9E4�4.3E4 [74000] 0.11OVI [2000]NaIMgII >0 [1400] >0SiII 5000�2800 [1900] 0.14CaII 18�2 [22] 0.0081FeII 1300�700 [780] 0.041
PG 1351+640 111:89 52:02 QSO CIII �156 56�2 Ef CII >0 E >0 >0 67 f,26SiII >0 E >0 >0 67 f,26CaII �163 9.9�1.0 N 18�2 0.0081 79
PG 1259+593 120:56 58:05 QSO CIIIC�128 84�1 Ef NI 3600 L 4300 0.046 126OI 6.6E4�3.7E4 L 7.9E4�4.3E4 0.11 126OVI 460�110 L 126SiII 4200�2300 L 5000�2800 0.14 126MgII >0 E >0 >0 121 fFeII 1100�500 L 1300�600 0.041 126
3C 263.0 134:16 49:74 QSO C �176 3.0�0.4 Dw MgII >0 E >0 >0 121 f,27SU Dra 133:45 48:27 0:70�0.10 t 0:52 RR Lyr CIIIA�138 31�1 Dw CaII <0.58 W <1.9 33 3,28BD +63 985 133:74 53:42 0:40�0.10s 0:32 A5(V) C �141 2.3�0.9 Ef NaI <0.15 W <6.4 84PG 1338+611 112:54 55:25 0:30�0.10s 0:25 sdB C �126 56�1 Ef CaII <3.5 N <6.2 70 29HD 127557 109:43 47:13 0:28�0.06p 0:21 A0V C �135 3.5�1.0 Dw SiII <90 N <2600 83 SHD 101075 135:50 51:13 0:24�0.04p 0:19 A2IV C �149 5.0�0.8 Dw NaI <0.24 W <4.9 84HD 103718 134:74 55:33 0:23�0.05p 0:19 A3V CIIIA�130 57�0.8 Dw NaI <0.15 W <0.26 84
C-south > 1:2 > 0:8 OVI [2000] (0.1Z�
),30NaI <360 <0.17MgII 3600�1300 [1400] 0.095SII 8100�1900 [1900] 0.43CaII <580 [22] <0.27FeII 1.1E4�4.2E3 [780] 0.33
Mrk 876 98:27 40:38 QSO CD �173 4.4�0.9 Ef H2 <2000 N <4.5E4 119OVI �175 580�110 N 119 20FeII �175 470�160 N 1.1E4�4.2E3 0.33 119
Mrk 279 115:04 46:86 Sey C �123 31�5 Ef SII �147 2500�400 N 8100�1900 0.43 125 31Mrk 205 125:45 41:67 Sey C �120 1.2�0.3 Ef MgII �147 43�11 W 3600�1300 0.095 75 32
NaI <4.3 W <360 49CaII <7.0 W <580 49
FBS 0959+685 142:46 41:95 QSO C �140 15�4 Dw MgII >0 E >0 >0 121 f,33PG 1648+536 81:38 39:35 1:2�0.5 a 0:76 sdB C �164 17�2 Ef MgII <10 L <60 L 60
FeII <100 L <600 l 60PG 1708+602 89:28 35:91 1:1�0.3 a 0:65 sdB CD �189 24�2 Ef NaI <1.6 L <6.5 62SW Dra 127:27 47:33 1:0�0.1 t 0:74 RR Lyr C �145 25�1 Dw CaII <2.3 W <9.3 33 3

38
IonAbundancesin
HVCsandIV
Cs
Probe l b d z type Cld vHI NHI tel ion vion Nion code Aion Aref A/A
�
D? Ref Note
� � kpc kpc km=s 1018 cm�2 km=s 1011 cm�2 10�9 10�9
(1) (2) (3) (4) (5) (6) (7) (8) (9) (10) (11) (12) (13) (14) (15) (16) (17) (18) (19) (20)
C-extension NaI (0.1Z�
),34MgII >0 [1400] >0SiII [1900]SII <2.0E4 [1900] <1.1CaII <49 [22] <0.022
PG 1700+518 79:02 37:77 QSO C �130 0.60�0.10 GB MgII >0 E >0 >0 121 fPG 1718+481 74:38 34:83 QSO C �133 4.1�0.1 GB MgII >0 E >0 >0 121 fQSO 1732+389 64:03 31:00 QSO CeIII �195 5.4�1.3 Dw HI <8.7 � T
s
>15 112 TCeIII �151 32�1 Dw HI <47 � T
s
>90 112 TMrk 501 63:60 38:86 BL Lac CeI �116 10�1 Ef SII <2000 N <2.0E4 125
CaII <4.9 N <49 70PKS 1739+17 41:35 22:99 radio c �110 29 Ar HI <35 � T
s
>20 5 T4C 09.57 34:93 17:63 BL Lac c �139 15�3 Dw HI <39 � T
s
>90 112 T,35CO <5500 N <3.8E4 112 21
c �113 26�3 Dw HI <61 � T
s
>110 112 TPKS 1741–038 21:60 13:12 QSO c �132 14�2 Dw HI <48 � T
s
>50 112 Tc �86 33�2 Dw HI <63 � T
s
>80 112 TCO <1.0E4 N <3.1E4 112 21
V421 Her 64:84 31:60 5:5�0.6 s 2:9 RR Lyr CeIII �142 17�0.7 Dw CaII <5.4 N <32 70OW Her 62:84 24:91 4:4�0.4 s 1:9 RR Lyr CeIV �166 73�1 Dw CaII <17 N <24 70PG 1722+286 51:71 30:57 0:90�0.20 a 0:46 sdOB C �162 6.0�2.0 ef NaI <1.6 L <26 62
CaII <5.0 L <84 62PG 1743+477 74:41 30:65 0:80�0.30 a 0:41 sdB C �145 1.5�1.0 Dw CaII <4.1 N <270 70HD 156110 70:99 35:71 0:72�0.33 p 0:42 B3Vn C �145 8.1�0.5 Dw SiII <230 N <2800 50 sPG 1710+490 75:43 36:08 0:70�0.30 a 0:41 sdB C �134 1.9�0.7 Dw NaI <1.0 L <53 62
CaII <6.3 L <330 62
C/K > 0:8 > 0:6 NaIMgII [14000]CaII [22]FeII [7800]
PG 1619+522 80:47 43:96 0:80�0.30 a 0:56 sdB C/K �85 4.4�0.8 Dw MgII <10 L <230 L 60FeII <63 L <1400 60
PG 1743+477 74:41 30:65 0:80�0.30 a 0:41 sdB C/K �88 3.9�0.7 Dw CaII <4.1 N <110 70PG 1710+490 75:43 36:08 0:70�0.30 a 0:41 sdB C/K �94 22�0.8 Dw NaI <1.0 L <4.6 62
CaII <6.3 L <29 62
Complex G > 1:3 OI [740000]MgIMgII [14000]AlII [1600]CaII [22]FeII [7800]
QSO 2200+420 92:60 �10:45 BL Lac G �109 18�2 Dw HI <120 � T
s
>450 112 TCO <7800 N <4.3E4 112 21
HD 212593 99:90 �6:71 1:3�0.1 t 0:15 B9Iab G �107 60�8 Ef OI <1500 W <2600 L 42 36(4 Lac) MgI <4.1 W <6.9 42
MgII <38 W <64 L 42AlII <18 W <30 L 42FeII <63 W <110 L 42
IU Cas 112:69 �9:20 0:90�0.10 s 0:14 RR Lyr G �133 22�1 Dw CaII <9.6 N <43 70

39
Probe l b d z type Cld vHI NHI tel ion vion Nion code Aion Aref A/A
�
D? Ref Note
� � kpc kpc km=s 1018 cm�2 km=s 1011 cm�2 10�9 10�9
(1) (2) (3) (4) (5) (6) (7) (8) (9) (10) (11) (12) (13) (14) (15) (16) (17) (18) (19) (20)
Complex H – core I > 5:0 CII [35000] (0.1Z�
),37OI [74000]NaIMgII [1400]CaII [22]
0159+625 130:98 1:15 radio HI �199 190 Ws HI �199 170 � 0.92 T
s
=47 43 T,38BD +59 367 131:11 �1:28 5:0�0.6s 0:11 O9.5I H �181 17�5 Ef MgII <8.3 N <49 L 96BD +62 338 130:91 1:07 3:5�0.8 t 0:07 B3II HI �201 194�1 Ef MgII <5.3 N <2.7 L 96HD 10125 128:29 1:82 3:4�0.3 t 0:1 O9.5Ib HI �203 42�2 Ef MgII <4.1 N <9.8 L 96
CaII <5.0 L <12 62 39HI �162 13�2 Ef MgII <4.1 N <32 L 96
CaII <5.0 L <39 62BD +63 253 129:62 2:13 2:3�0.4 t 0:09 B0III HI �202 16�2 Ef CaII <3.2 L <20 62
HI �170 9.7�1.2 Ef CaII <3.2 L <33 62HD 13256 132:60 �0:64 2:1�0.2 t 0:02 B1Ia HI �186 30�1 Dw CaII <5.0 L <16 62 39LS I +62 200 130:70 1:22 1:9�0.3s 0:04 B1V HI �204 302�2 ef CaII <5.0 L <1.7 l 62 40LS I +61 251 130:73 0:04 1:8�0.3s 0 B1V: HI �194 95�2 ef CaII <5.0 L <5.3 62 41HD 12567 130:86 2:56 1:6�0.3 t 0:07 B0.5III HI �202 81�2 Ef CaII <2.5 L <3.1 62
Complex H – core II > 2:5 (0.1Z�
),42HD 108 117:93 1:25 2:5�0.2 t 0:05 O6Ia:f HII �188 7.7�1.6 Ef CII <160 N <2100 l 96
OI <420 N <5500 l 96MgII <5.2 N <68 L 96
RS Cas 114:47 0:78 2:0�0.2 t 0:03 Cep HII �160 33�2 Dw CaII <12 N <38 70HD 225160 117:44 �0:14 1:8�0.4 t 0 O8e HII �172 8.4�1.1 Ef MgII <4.3 N <51 L 96HD 1383 119:02 �0:89 1:7�0.2 t 0:03 B1II.. H �160 9.9�1.5 Ef MgII <5.4 N <55 L 96HD 223987 116:18 �0:51 1:3�0.1s 0:01 B1Ib HII �163 9.3�3.5 Ef MgII <3.8 N <41 L 96
Complex H – core III > 3:6 (0.1Z�
),43HD 12323 132:91 �5:87 3:6�0.3 t 0:37 O9V HIII�145 6.8�1.1 Ef MgII <5.1 N <75 L 96HDE 236894 130:83 �3:50 3:4�0.3 t 0:21 O8V HIII�184 10�1 Ef CII <150 N <1500 L 96 44
OI <390 N <3900 L 96HIII�144 12�1 Ef CII <150 N <1300 L 96
OI <390 N <3300 L 96HD 12993 133:11 �3:40 3:4�0.2 t 0:20 O6.5V HIII�153 8.0�1.7 Ef CII <160 N <2000 l 96
OI <410 N <5100 l 96
Complex H – other > 2:3 (0.1Z�
),454C 67.05 132:13 6:24 QSO H �164 27�2 Dw CO <1.4E4 N <5.2E4 112 21,464C 47.08 145:00 �9:86 BL Lac H �120 17�1 Dw CO <1.7E4 N <1.0E5 112 21,47HD 14947 134:99 �1:74 2:3�0.2 t 0:07 O5f H �149 18�1 Ef CII <220 N <1300 L 96
OI <580 N <3300 L 96HD 15629 134:77 1:01 2:1�0.1 t 0:04 O5e H �175 13�2 Ef CII <220 N <1800 L 96 48
OI <560 N <4500 l 96HD 17520 137:22 0:88 1:7�0.2 t 0:03 O9V H �136 13�2 Dw MgII <3.1 N <24 L 96HD 2619 120:74 2:49 1:2�0.2 t 0:05 B0.5III H �201 16�2 ef NaI <2.5 L <16 62
CaII <2.5 L <16 62 49H �137 25�2 ef NaI <2.5 L <10 62
CaII <2.5 L <10 62HD 17505 137:19 0:90 1:1�0.1 t 0:02 O6.5V H �134 13�4 Dw MgII <5.1 N <40 L 96

40
IonAbundancesin
HVCsandIV
Cs
Probe l b d z type Cld vHI NHI tel ion vion Nion code Aion Aref A/A
�
D? Ref Note
� � kpc kpc km=s 1018 cm�2 km=s 1011 cm�2 10�9 10�9
(1) (2) (3) (4) (5) (6) (7) (8) (9) (10) (11) (12) (13) (14) (15) (16) (17) (18) (19) (20)
AC Shell (> 1:5) CaII [22]3C 123 170:58 �11:66 radio ACS �62 230 Ar HI �63:9 220 � 0.96 T
s
=832 5 T,50
�70 230 ab HI �70 160 � 0.70 T
s
>360 21 T
�73:0 16 ab HI �73:0 16 � 1.0 T
s
=81 5 T
�73:1 55 ab HI �73:1 55 � 1.00 T
s
=280 21 T
�57:9 20 ab HI �57:9 20 � 1.0 T
s
=562 5 T
�55:9 1.5 ab HI �55:9 1.5 � 1.00 T
s
=57 21 T
�59:2 13 ab HI �59:3 13 � 1.0 T
s
=192 21 THDE 256725 192:32 3:36 8:0�2.0 s 0:47 O5V ACS �61 33�1 Ef CaII <1.4 W <4.3 24 51HDE 248894 187:89 �2:51 3:0�0.3 s 0:13 O8V ACS �56 40�2 Ef CaII <1.4 W <3.5 24HDE 255055 188:69 3:87 2:6�0.3 s 0:18 O9V ACS �81 34�1 Dw CaII <1.4 W <4.2 24HDE 256035 189:42 4:33 1:5�0.2 s 0:11 O9V ACS �79 72�1 Dw CaII <1.4 W <2.0 l 24HD 45314 196:96 1:52 0:90�0.10s 0:02 O9V:pe ACS �66 100�9 Dw CaII <0.92 W <0.90 l 24
Cloud AC0 (> 0:3) NaICaII [22]
HDE 252550 179:91 6:25 0:90�0.05s 0:10 A0V AC0 �116 37�4 Ef NaI <0.66 W <1.8 92HDE 253069 179:86 6:74 0:40�0.05s 0:05 B9V AC0 �111 120�5 Ar NaI <0.64 W <0.53 92HD 42904 180:74 6:83 0:30�0.03s 0:04 A0V AC0 �114 110�5 Ar NaI <1.4 W <1.3 92
CaII <2.0 W <1.8 l 92HDE 252605 180:63 5:89 0:30�0.03s 0:03 A0V AC0 �112 150�5 Ar NaI <1.0 W <0.67 92
Cloud ACI (> 0:4) NaI (0.1Z�
)CaII [22]
HDE 241573 184:37 �11:75 0:40�0.05s 0:08 B9V ACI �203 62�4 Ef NaI <1.2 W <1.9 92HD 33415 181:69 �10:46 0:36�0.03p 0:07 A0V ACI �187 77�9 Dw CaII <0.69 W <0.90 l 33 52,53HDE 241597 184:70 �11:95 0:30�0.03s 0:06 A2V ACI �205 66�3 Ef NaI <1.7 W <2.5 92HD 33233 181:47 �10:68 0:30�0.03s 0:06 A0V ACI �187 78�10 Dw CaII <0.69 W <0.89 l 33 52,54HD 33090 181:63 �11:04 0:29�0.09p 0:06 B5V ACI �188 77�3 Dw CaII <0.69 W <0.90 l 33 52,55HD 32641 179:91 �10:73 0:25�0.08p 0:05 B5V ACI �188 66�3 Dw CaII <0.69 W <1.1 l 33 52,56HDE 241882 184:60 �11:37 0:20�0.03s 0:04 A7V ACI �197 155�1 Dw NaI <1.2 W <0.78 92
CaII <2.4 W <1.5 l 92
Cloud ACII (> 0:3) NaI (0.1Z�
)CaII [22]
HDE 241573 184:37 �11:75 0:40�0.05s 0:08 B9V ACII �143 30�3 Ef NaI <1.2 W <4.1 92HD 33415 181:69 �10:46 0:36�0.03p 0:07 A0V ACII �162 24�9 Dw CaII <0.70 W <3.0 33 52,53HDE 241597 184:70 �11:95 0:30�0.03s 0:06 A2V ACII �136 23�4 Ef NaI <1.6 W <7.1 92HD 33233 181:47 �10:68 0:30�0.03s 0:06 A0V ACII �162 20�7 Dw CaII <0.70 W <3.4 33 52,54HD 33090 181:63 �11:04 0:29�0.09p 0:06 B5V ACII �164 33�3 Dw CaII <0.70 W <2.1 l 33 52,55HD 32641 179:91 �10:73 0:25�0.08p 0:05 B5V ACII �165 21�3 Dw CaII <0.70 W <3.3 33 52,56HDE 241882 184:60 �11:37 0:20�0.03s 0:04 A7V ACII �138 42�1 Dw NaI <1.2 W <2.9 92
CaII <8.4 W <20 92
Cohen Stream > 0:3 > 0:2 NaIMgII [14000]CaII [22]
PKS 0202+14 147:93 �44:05 Sey CHS �109 5.3�0.5 Ef HI <2.3 � T
s
>50 39 T3C 75 170:25 �44:91 radio CHS �110 15�0.4 Ar HI <4.2 � T
s
>70 39 T3C 78 174:86 �44:51 radio CHS �97 13�0.6 Ar HI <1.9 � T
s
>30 39 TMrk 595 164:76 �46:55 Sey CHS �124 27�0.9 Ef NaI <1.1 N <4.2 103HD 14069 156:66 �49:52 0:30�0.03s 0:23 A0V CHS �111 22�2 Ef NaI <0.24 W <1.1 68
MgII <7.4 S <33 L 68 57HD 17473 166:54 �45:44 0:30�0.03s 0:21 A2V CHS �127 21�1 Ef NaI <1.0 W <5.0 92HD 17481 166:39 �45:24 0:30�0.03s 0:21 A0V CHS �114 15�1 Ef NaI <0.24 W <1.7 68 58
MgII <8.0 S <55 L 68 57CaII <0.58 W <4.0 68 58

41
Probe l b d z type Cld vHI NHI tel ion vion Nion code Aion Aref A/A
�
D? Ref Note
� � kpc kpc km=s 1018 cm�2 km=s 1011 cm�2 10�9 10�9
(1) (2) (3) (4) (5) (6) (7) (8) (9) (10) (11) (12) (13) (14) (15) (16) (17) (18) (19) (20)
HD 18059 167:87 �44:21 0:30�0.08 p 0:21 A0V CHS �106 3.9�0.6 Ef NaI <0.30 W <7.8 92 VHD 17907 168:50 �45:40 0:25�0.13 p 0:18 B9.5V CHS �116 6.6�1.1 Ef NaI <0.24 W <3.7 68 58
MgII <6.8 S <100 L 68 57CaII <0.58 W <8.8 68 58
HD 18910 172:35 �44:73 0:20�0.02 s 0:14 A0V CHS �98 13�2 Dw MgII <8.6 S <66 L 68 57HD 14951 157:03 �45:99 0:18�0.03 p 0:13 B7IV CHS �119 6.1�4.9 Dw NaI <0.24 W <4.0 68 58
MgII <6.8 S <110 L 68 57CaII <0.58 W <9.5 68 58
Cloud WW507 > 0:3 > 0:2 NaI (0.1Z�
)MgII [1400]CaII [22]
4C 10.08 161:87 �43:40 radio WW507 �335 130�0.8 Ef HI <92 � T
s
>320 112 T,59HD 17473 166:54 �45:44 0:30�0.03 s 0:21 A2V WW507 �274 15�0.9 Ef NaI <1.1 W <7.3 92HD 17481 166:39 �45:24 0:30�0.03 s 0:21 A0V WW507 �276 50�1 Ef NaI <0.50 W <1.0 92
MgII <7.3 S <14 L 68 57CaII <0.58 W <1.1 l 68 58
HD 18059 167:87 �44:21 0:30�0.08 p 0:21 A0V WW507 �277 4.0�0.9 Ef NaI <0.30 W <7.6 92HD 17907 168:50 �45:40 0:25�0.13 p 0:18 B9.5V WW507 �270 2.9�0.9 Ef NaI <0.24 W <8.4 68 58,V
( NaI <0.29 W <10 92)MgII <5.6 S <190 l 68 57CaII <0.58 W <20 68 58
HD 18910 172:35 �44:73 0:20�0.02 s 0:14 A0V WW507 �247 5.8�2.1 Dw MgII <7.2 S <120 L 68 57HD 14951 157:03 �45:99 0:18�0.03 p 0:13 B7IV WW507 �320 2.8�0.9 Dw NaI <0.24 W <8.7 68 58,V
MgII <5.3 S <190 l 68 57CaII <0.58 W <21 68 58
Other AC cloudsPKS 0428+205 176:81 �18:56 radio WW363 �110 5.0�0.6 Ar HI <1.6 � T
s
>20 39 T,603C 109 181:83 �27:78 Sey WW418 �222 14�0.5 Ar HI <1.7 � T
s
>20 39 TCTA 21 166:64 �33:60 radio WW468 �121 2.0�0.4 Ar HI <2.0 � T
s
>40 39 T,HD 16582 170:76 �52:21 0:20�0.03 p 0:16 B2IV WW525 �203 7.3�1.2 Dw SiII <230 N <3200 50 s,61
Complex GCNMrk 509 35:97 �29:86 Sey (WW419)�283 20�20 md CII �283 430�340 L 2100�2700 0.0060 110 62,63
CIV �283>1600 L 110NI <380 L <1900 110NV <150 L 110OVI �280 910�80 L 118 64SiII <100 L <500 110SiIII �283 >150 L >770 >0.022 110SiIV �283 >280 L 110SII <850 L <4300 110SIII <2300 L <1.1E4 110
�227 2.2�2.2 md CII <310 L <1.4E4 110CIV �227 >480 L 110NI <250 L <1.1E4 110NV <95 L 110OVI �210 1800�200 L 118 64SiII <69 L <3100 110SiIII �227 25�17 L 1100�1400 0.032 110SiIV <85 L 110SII <660 L <3.0E4 110SIII <2600 L <1.2E5 110

42
IonAbundancesin
HVCsandIV
Cs
Probe l b d z type Cld vHI NHI tel ion vion Nion code Aion Aref A/A
�
D? Ref Note
� � kpc kpc km=s 1018 cm�2 km=s 1011 cm�2 10�9 10�9
(1) (2) (3) (4) (5) (6) (7) (8) (9) (10) (11) (12) (13) (14) (15) (16) (17) (18) (19) (20)
PKS 2155–304 17:73 �52:25 BL Lac (GCN) �256 20�20 md( CIV �260 420�30 L 55) 63,65CIV �256 320�50 L 110NV <110 L 110OVI �250 330�30 L 118 64SII <1600 L <7900 110
�140 20�20 md CIV �140 320�50 L 110NV <140 L 110OVI �140 680�60 L 118 64SiII �140 54�16 L 270�280 0.0076 110SII <1300 L <6600 110
HD 173011 21:18 �3:51 1:1 t 0:07 B0.5V WW302 �208 3.3�0.8 Dw CaII <2.4 W <72 1HD 187350 38:67 �13:42 0:32�0.14 p 0:07 B1Vne WW345 �231 6.3�0.7 Dw CaII <2.3 W <37 1HD 188350 40:55 �13:92 0:11�0.01 p 0:03 A0III WW345 �211 1.0�0.5 Dw CaII <1.2 W <120 1 V
Complex GCP (> 0:3 > 0:1) CaII [22]HD 187350 38:67 �13:42 0:32�0.14 p 0:07 B1Vne GP +99 299�3 Dw CaII <2.3 W <0.78 l 1HD 188859 40:92 �14:43 0:11�0.01 p 0:03 A0V GP +95 200�6 Dw CaII <1.2 W <0.59 L 1HD 188350 40:55 �13:92 0:11�0.01 p 0:03 A0III GP +90 200�10 Dw CaII <1.2 W <0.59 L 1
Outer Arm CIV [1600]NV [350]OVI [2000]MgII >0 [14000] >0CaII [22]
PKS 1820+17 46:07 14:36 radio OA �68 55 Ar HI <51 � T
s
>20 5 T3C 386 46:97 10:55 radio OA �73 102�0.4 Ar HI <57 � T
s
>940 39 T4C 29.56 57:51 16:88 QSO OA �97 29�0.5 Ar HI <16 � T
s
>290 39 T,66OA �71 40�0.5 Ar HI <40 � T
s
>460 39 T3C 382 61:31 17:45 Sey OA �87 13�0.5 Ar HI <30 � T
s
>390 39 T3C 395 63:03 11:76 QSO OA �84 110 Ar HI �73 39 � 0.36 T
s
=55 5 T,67HI �73 3.7 � 0.034 T
s
=38 112 T4C 33.48 66:39 8:37 radio OA �81 180�8 Ef HI <170 � T
s
>140 5 TQSO 2005+403 76:83 4:29 QSO OA �118 122�0.3 Dw HI �121 100 � 0.86 T
s
=147 112 T3C 380.0 77:23 23:50 QSO OA �110 93�1 Dw HI <190 � T
s
>570 112 T,683C 418 88:82 6:03 QSO OA �116 130�20 Dw HI <320 � T
s
>620 112 T,69H 1821+643 94:00 27:42 QSO OA (�213) <3.0 Ef CIV �213 120�30 N 76 70
OVI �210 1000�200 L 118 64OA �128 3.3�0.5 Ef CIV �120 610�110 N 76 71
NV <420 N 76OA �87 8.5�0.7 Ef CIV �70 600�160 N 76
NV <350 N 76MgII >0 E >0 >0 121 f
4C 73.18 105:63 23:54 QSO OA �121 33�2 GB MgII >0 E >0 >0 121 f,72HI <0.0 � T
s
>110 112 THS 0624+6907 145:71 23:35 QSO OA �100 20�2 Ef MgII >0 E >0 >0 121 f,733C 147.0 161:64 10:20 QSO OA �121 32�4 Dw HI <0.0 � T
s
>2000 21 T,74HI <53 � T
s
>410 112 THD 178329 72:15 14:98 0:63�0.22 p 0:16 B3V OA �93 83�2 Dw CaII <1.2 W <1.4 l 1HD 189818 91:18 14:36 0:40 t 0:10 B5V OA �131 47�2 Dw CaII <1.9 W <4.0 1HD 176502 70:88 16:00 0:29�0.05 p 0:08 B3V OA �91 45�2 Dw CaII <1.2 W <2.6 1HD 205021 107:54 14:03 0:18�0.02 p 0:04 B1III OA �119 104�1 Dw CaII <0.46 W <0.44 L 1
Complex R4C 33.48 66:39 8:37 radio R �128 29�2 Ef HI �128 5.8 � 0.20 T
s
=69 5 T

43
Probe l b d z type Cld vHI NHI tel ion vion Nion code Aion Aref A/A
�
D? Ref Note
� � kpc kpc km=s 1018 cm�2 km=s 1011 cm�2 10�9 10�9
(1) (2) (3) (4) (5) (6) (7) (8) (9) (10) (11) (12) (13) (14) (15) (16) (17) (18) (19) (20)
Magellanic Stream CIV [1600] 0.25Z�
NV [350]OVI [2000]NaI <2.5 <0.0012MgII 3600�700 [3600] 0.095 75SiII >440 [4800] >0.012SII 6200�400 [4700] 0.33CaII 27�2 [22] 0.012FeII 2000�800 [1900] 0.062
3C 454.3 86:11 �38:18 QSO MS �365 1.1�0.1 GB MgII �375 300�130 W 2.7E4�1.2E4 0.72 121 76CTA 102 77:44 �38:58 QSO WW485 �323 3.0�0.2 Ar HI <0.18 � T
s
>10 39 TPKS 2251+11 82:78 �41:94 QSO MS �363 4.9�0.1 GB MgII �304 240�190 W 4900�3800 0.13 121 76PKS 0003+15 107:32 �45:33 QSO WW509 �326 0.90�0.10 GB MgII �290 93�46 W 1.0E4�5.3E3 0.27 121 76NGC 7469 83:10 �45:47 Sey MS �333 3.1�0.6 Ef MgII �340 70�9 N 2300�500 0.059 122 76
OVI �300 4200�700 L 118 64PKS 2344+09 97:50 �50:13 QSO MS �372 4.3�0.1 GB MgII �332 280�300 W 6600�7100 0.17 121 76PG 2302+029 78:46 �50:23 QSO MS �324 4.1�0.1 GB MgII �310 150�50 W 3600�1300 0.094 121 762331+073 91:90 �50:56 radio MS �338 28�1 Dw HI <54 � T
s
>50 112 TIII Zw 2 106:98 �50:63 Sey MS (�350) <1.5 Dw MgII �350 100�10 N >6800 >0.18 122 77PKS 2243–123 53:87 �57:07 QSO (MS) (�335) <0.70 GB MgII �335 130�90 W >1.8E4 >0.48 121 76PG 0043+039 120:22 �58:67 QSO WW532 �366 1.3�0.1 GB MgII �388 140�70 W 1.1E4�5.3E3 0.28 121 76PKS 2340–036 85:40 �61:15 QSO MS �277 4.1�0.1 GB MgII �310 130�30 W 3100�900 0.081 121 76PKS 2345–167 65:56 �71:90 QSO MS �174 11�1 Dw HI <5.7 � T
s
>10 112 TCO <1.4E4 N <1.3E5 112 21
PKS 0103–453 295:04 �71:82 radio MS 101 9.7�0.8 PK HI <11 � T
s
>50 44 TTon S180 139:00 �85:07 QSO MS (�150) <3.0 Dw OVI �150 1900�300 L 118Ton S210 224:97 �83:16 QSO MS (�175) <3.0 Ef OVI �175 1300�300 L 118Fairall 9 295:07 �57:83 QSO MS +190 89�1 PK CIV <410 W 66 78
NV <510 W 66NaI <2.2 W <2.5 8 79
( SiII +195 >1500 N >1700 >0.047 66) �
SiII +176 >390 N >440 >0.012 122SII 5500�400 N 6200�400 0.33 122CaII +193 24�2 W 27�2 0.012 8 79
+149 14�0.8 PK( SII <3900 W <2.8E4 66)SII +142 1100�400 N 7700�3100 0.41 122
+194 75�1 PK( SII <3500 W <4600 66)( SII +193 4500�400 N 5900�500 0.32 122)
PKS 0252–712 290:02 �42:88 radio MS +218 80�2 PK HI <41 � T
s
>460 44 T+257 80�2 PK HI <41 � T
s
>460 44 TPKS 0407–658 278:64 �40:88 radio MS +258 9.4�1.6 PK HI <11 � T
s
>480 44 TPKS 0202–76 297:55 �40:04 QSO MS +148 114�3 PK HI <170 � T
s
>40 44 TPKS 0409–752 288:98 �36:13 radio MS +200 124�2 PK HI <59 � T
s
>670 44 T+243 147�3 PK HI <59 � T
s
>670 44 TPKS 0637–75 286:37 �27:16 QSO MS +245 31�0.9 PK MgII +254 >1300 W >4300 >0.11 74) 76,�
MgII +254 >1300 W >4200 >0.11 121 76,�
FeII +200 610�240 W 2000�800 0.062 99 76HD 219188 83:03 �50:17 2:3�0.2 t 1:8 B0.5II MS �273 3.3�0.6 Ef SiII <230 N <7000 50 sHD 3175 306:22 �53:96 1:6�0.2 t 1:3 B5III MS +168 26�0.5 PK CaII <4.9 W <19 30 V
WW524 +104 8.3�0.9 PK CaII <4.8 W <58 30PG 0039+048 118:59 �57:64 1:1�0.4 a 0:93 sdB WW532 �367 27�2 Ef NaI <1.6 L <5.8 62PG 2337+070 93:71 �51:49 0:80�0.30a 0:63 sdB MS �313 27�1 Ef NaI <1.3 L <4.7 62HD 220172 68:10 �62:65 0:80�0.10 t 0:71 B3Vn MS �235 2.0�0.3 Dw SiII <230 N <1.1E4 50 s

44
IonAbundancesin
HVCsandIV
Cs
Probe l b d z type Cld vHI NHI tel ion vion Nion code Aion Aref A/A
�
D? Ref Note
� � kpc kpc km=s 1018 cm�2 km=s 1011 cm�2 10�9 10�9
(1) (2) (3) (4) (5) (6) (7) (8) (9) (10) (11) (12) (13) (14) (15) (16) (17) (18) (19) (20)
Population EP > 0:4 > 0:2 CI 270�170 0.00075 0.25Z�
CIV [1600]NI >4000 [23000] >0.043NII >1100 >0.012NV [350]NaI <3.6 <0.0018SiII >1100 [4800] >0.031AlII <1500 [410] <0.51SII 4500�1300 [4700] 0.24PII <140 [93] <0.36PIII <490 [93] <1.3ArI <2100 [300] <0.59FeII 1000�200 [1900] 0.032CaII 67�8 [22] 0.031
NGC 1705 261:08 �38:74 Gal WW487 +287 1.7�0.4 PM SiII +260 290�50 W 1.7E4�5.0E3 0.48 91SiII +260 1700�800 W 1.0E5�5.0E4 2.9 91SiII +260 1800�800 W 1.0E5�5.5E4 2.9 91SII +260<4500 W <2.6E5 101AlII +260 <26 W <1500 101FeII +260 <460 W <2.7E4 101
NGC 3783 287:46 22:95 Sey WW187 +240 83�9 AP H2 +241 6.9E5�1.6E5 L 8.3E5�2.1E5 127CI +236 220�140 W 270�170 .00075 64CIV <330 W 64NI +240>3300 L >4000 >0.043 127NII +240 >930 L >1100 >0.012 127NV <330 W 64NaI <3.0 N <3.6 22
( SiII +231 >930 W >1100 >0.031 64) 80,�
SiII +240 4400�1000 L 5300�1300 0.15 127 �
( SII +236 4000�1600 W 4800�2000 0.26 64) 81SII +236 3700�1000 N 4500�1300 0.24 100PII +240 <110 L <140 127PIII +240 <410 L <490 127ArI +240<1800 L <2100 127FeII +240 850�100 N 1000�200 0.032 100CaII +241 56�3 N 67�8 0.031 22
NGC 2808 282:19 �11:25 8:9 1:7 GC WW621 +275 2.2�0.9 PM CaII <5.9 W <270 8HD 86248 264:59 18:11 7:6�1.7 t 2:4 B3II WW211 +201 7.6�3.0 GB SiII <230 N <3000 50 s,82HD 102383 290:10 19:97 0:80�0.10 t 0:27 B6Vne WW187 +230 2.0�0.3 PK CaII <5.5 W <280 25HD 101274 287:47 22:94 0:40�0.03 s 0:16 A0V WW187 +244 83�9 AP CaII <5.4 W <6.5 l 25
Population ENMrk 205 125:45 41:67 Sey WW84 �202 8.0�5.0 WE NaI <4.4 W <55 49 83
MgII �209 61�17 W 770�530 0.020 75CaII <7.1 W <89 49
PKS 1923+210 55:56 2:26 radio WW274 (�198) <2.5 Dw HCO+
�198 4.3 N >170 115

45
Probe l b d z type Cld vHI NHI tel ion vion Nion code Aion Aref A/A
�
D? Ref Note
� � kpc kpc km=s 1018 cm�2 km=s 1011 cm�2 10�9 10�9
(1) (2) (3) (4) (5) (6) (7) (8) (9) (10) (11) (12) (13) (14) (15) (16) (17) (18) (19) (20)
Complex L > 0:2 > 0:1HD 135485 347:31 35:46 0:18�0.04 p 0:1 B5IIIp WW132 �98 5.1 WJ CII <70 N <1400 L 78 84
OI <200 N <3900 L 78SiII <10 N <200 l 78
Mistaken claimsHD 135485 347:31 35:46 0:18�0.04 p 0:1 B5IIIp WW132 �98 5.1 WJ CaII �98 1.8�0.3 W 34�5 0.016 U 58 84,85
CaII �127 1.9�0.3 W 37�6 0.017 U 58
Complex WB NaICaII 280�120 [22] 0.13
PKS 0837–12 237:17 17:43 QSO WW225 +112 7.9�3.2 Ef CaII +106 22�3 N 280�120 0.13 48 86HD 76510 241:02 19:75 1:3 t 0:44 B1V WW225 +100 10�5 Dw NaI +98 <1.5 N <15 54
CaII +98 <1.5 N <15 l 54
Complex WE < 13 < 3:2HD 156359 328:68 �14:52 13�2 t 3:2 O9.7II WW364(+110) <2.0 VE CII +112 290�100 W >1.5E4 >0.042 U 45 87,W
NV +128 58�22 N 71MgII +112 20�3 W >1000 >0.027 U 45 WSiII +106 20�6 W >990 >0.028 U 45 WSiIII +106 14�3 W >690 >0.019 U 45 WFeII +115 51�14 W >2600 >0.079 U 45 W
Small positive-velocity clouds3C 200 193:95 32:60 radio WW137 +97 14 Ar HI <14 � T
s
>20 5 TBD +10 2179 235:21 54:44 4:0 r 3:3 Bp WW29 +88 5.7�0.4 Ef SiII <230 N <4000 50 s4C 06.41 241:11 52:65 QSO WW34 +91 2.6�0.3 Dw MgII >0 E >0 >0 121 fPKS 1136–13 277:53 45:43 QSO WW62 +100 <1.0 Ef MgII >0 E >0 >0 121 fSN 1991 T 292:61 65:19 SN +113 2.9�0.1 HC CaII <0.46 W <16 47 88HD 212593 99:90 �6:71 1:3�0.1 t 0:15 B9Iab 100–7 +106 5.0�0.2 WJ OI +110 2.5E4�2.0E4 L 5.0E5�4.0E5 0.68 U 42 89(4 Lac) MgII +100 3200�2200 L 6.3E4�4.3E4 1.7 U 42 �
MgI +100 5.0�1.2 L 100�20 0.0026 U 42AlII +106 63�38 L 1300�800 0.42 U 42FeII +105 400�90 L 8000�1900 0.25 U 42

46
IonAbundancesin
HVCsandIV
Cs
Probe l b d z type Cld vHI NHI tel ion vion Nion code Aion Aref A/A
�
D? Ref Note
� � kpc kpc km=s 1018 cm�2 km=s 1011 cm�2 10�9 10�9
(1) (2) (3) (4) (5) (6) (7) (8) (9) (10) (11) (12) (13) (14) (15) (16) (17) (18) (19) (20)
HVCs with low or no H ISN 1994 I 104:84 68:56 SN (+250) <2.5 Ef NaI +246 3.2�1.5 L >130 >0.062 73 90
NaI +272 0.79�0.18 L >32 >0.016 73NaI +301 1.3�0.3 L >50 >0.025 73
SN 1993 J 142:15 40:92 SN (+125) <6.0 ef NaI +125 48 N >800 >0.39 61 91KI +122 0.55 N >9.2 >0.068 61CaI +122 0.10 N >1.7 >.00076 61CaII +125 17 N >280 >0.13 61
(+140) <6.0 ef CIV +140 400 L 53NaI +140 29 N >480 >0.24 61MgI +140 20 L >330 >0.0087 53AlII +140 100 L >1700 >0.55 53AlIII +140 200 L >3300 >1.1 53SiII +140 2500 L >4.2E4 >1.2 53 �
SiIV +140 250 L 53KI +140 0.35 N >5.8 >0.043 61CaI +140 0.10 N >1.7 >.00076 61CaII +140 2.6 N >43 >0.020 61FeII +140 1600 L >2.6E4 >0.82 53
(+230) <6 MgII +231 40�16 N >670 >0.018 63PKS 0232–04 174:46 �56:16 QSO (+275) <0.70 GB MgII +275>540 W >7.7E4 >2.0 121 76PG 0953+414 179:78 51:71 QSO (�150) <2.0 Ef CII �149 350�60 L >1.8E4 >0.050 128
SiII �152 32�5 L >1600 >0.046 128SiIII �148 35�7 L >1800 >0.050 128AlII �145 8.9�3.6 L >450 >0.15 128
(+130) <2.0 Ef CII +126 210�30 L >1.1E4 >0.030 128SiIII +131 43�9 L >2100 >0.060 128
PG 1116+215 223:36 68:21 QSO (+200) <0.70 GB CII +200 >0 N >0 >0 98SiII +200 >0 N >0 >0 98MgII +267 90�48 W >1.3E4 >0.34 121 76,W
SN 1994 D 290:15 70:14 SN +204 1.6�0.5 Ef CaII +204 1.7�0.3 L 100�40 0.047 69 92(+214) <2.5 Ef NaI +214 1.4�0.2 L >57 >0.028 73
CaII +216 3.4�0.4 L >140 >0.062 69(+234) <2.5 Ef NaI +234 1.5�0.2 L >59 >0.029 73
CaII +232 13�1 L >500 >0.23 69(+252) <2.5 Ef NaI +254 0.50�0.08 L >20 >0.0098 73
CaII +254 3.5�0.4 L >140 >0.065 69SN 1991 T 292:61 65:19 SN (+250) <0.30 HC CaII +215 0.74�0.12 N >250 >0.11 47 88
CaII +263 1.1�0.1 N >370 >0.17 47SN 1986 G 309:54 19:40 SN WW219 +245a 2.8�1.2 PK NaI +233 1.3�0.05 W 46�20 0.023 31 93,V
CaII +233 4.3�0.3 W 150�70 0.070 31WW219 +245b 4.0�1.2 PK NaI +254 2.4�0.05 W 60�18 0.030 31
CaII +254 6.2�0.3 W 150�50 0.070 31SN 1983 N 314:54 31:95 SN (+250) <6.0 Dw CaII +248 1.6�1.4 W >27 >0.012 20 94,W

47
Probe l b d z type Cld vHI NHI tel ion vion Nion code Aion Aref A/A
�
D? Ref Note
� � kpc kpc km=s 1018 cm�2 km=s 1011 cm�2 10�9 10�9
(1) (2) (3) (4) (5) (6) (7) (8) (9) (10) (11) (12) (13) (14) (15) (16) (17) (18) (19) (20)
HVC on LMC @+160 km s�1
< 50 CI <590 <0.0017NaI <5.9 <0.0029MgI 110�20 0.0029MgII 2.3E4�2.7E3 [14000] 0.61AlII 930�170 [1600] 0.31SiII 1.8E4�5.4E3 [19000] 0.50PII <1.2E4 [370] <31ClI <930 <5.0KI <2.9 <0.022CaI 0.87�0.11 0.00040CaII 40�10 [22] 0.018 95TiII <150 [21] <1.7CrII <290 [150] <0.61MnII 74�21 [87] 0.22FeII 8700�1800 [7800] 0.27NiII <590 [260] <0.33ZnII <93 [42] <2.1
SN 1987 A 279:70 �31:94 50 g 26 SN +165 5.4 AB CI <32 L <590 109 96NaI <0.32 N <5.9 109MgI +165 6.0�1.1 L 110�20 0.0029 U 109
( MgII +171 400�190 L 7400�3500 0.19 U 34)MgII +165 1300�100 L 2.3E4�2.7E3 0.61 U 109
( AlII +171 55�13 L 1000�200 0.34 U 34)AlII +165 50�9 L 930�170 0.31 U 109
( SiII +171 500�120 L 9300�2200 0.26 U 34)SiII +165 950�290 L 1.8E4�5.4E3 0.50 U 109PII <630 L <1.2E4 109ClI <50 L <930 109KI <0.16 L <2.9 109
( CaI +168:6 0.043�0.003 N 0.80�0.06 .00036 U 26)CaI +165 0.047�0.006 N 0.87�0.11 .00040 U 109
( CaII +165:4 2.1 W 39 0.018 U 27) W( CaII +169:9 2.8�0.01 N 52�0.2 0.024 U 26)
CaII +165 2.8�0.3 N 52�6 0.024 U 109TiII <7.9 L <150 109
( CrII <10 L <190 34)CrII <16 L <290 109
( MnII <10 L <190 34)MnII +165 4.0�1.1 L 74�21 0.22 U 109
( FeII +171 400�110 L 7400�2100 0.23 U 34)FeII +165 470�100 L 8700�1800 0.27 U 109
( NiII <79 L <1500 34)NiII <32 L <590 109ZnII <5.0 L <93 109
Sk–67 166 277:84 �32:49 50 g 27 O4If+ (+170) <2.0 PR CaII +175 3.6 W >180 >0.081 U 40 97,WSk–68 135 279:26 �31:77 50 g 26 On9.7Ia +170 2.0�1.0 PR CaII +150 7.4 W 370 0.17 U 40 97,WSk–68 137 279:20 �31:73 50 g 26 O3III(f*) +170 2.0�1.0 PR CaII +160 3.6 W 180 0.081 U 40 97,WSk–69 51 281:02 �35:07 50 g 29 B1 +170a 11�1 PR CaII +155 11 W 110 0.050 U 40 97
+170b 9.5�1.0 PR CaII +180 10 W 110 0.048 U 40 97Sk–69 52 281:23 �35:02 50 g 29 B2Ia +170 20�1 PR CaII +160 7.4 W 37 0.017 U 40 97,WSk–69 106 280:44 �33:30 50 g 27 B0: CaII +150 3.6 W U 23 97,WSk–69 107 280:42 �33:27 50 g 27 O9.5Ib CaII +150 3.6 W U 23 97,WSk–69 211 279:85 �31:86 50 g 26 B9Ia +165 6.5�1.0 PI CaII +169:6 4.4�0.3 L 67�11 0.031 U 52Sk–69 216 279:83 �31:77 50 g 26 Be +164 5.6 PI CaII +169:7 5.5�0.5 L 98�9 0.045 U 52Sk–69 276 279:96 �31:37 50 g 26 B0Iab CaII +165:7 8.7�0.3 N U 85

48
IonAbundancesin
HVCsandIV
Cs
Probe l b d z type Cld vHI NHI tel ion vion Nion code Aion Aref A/A
�
D? Ref Note
� � kpc kpc km=s 1018 cm�2 km=s 1011 cm�2 10�9 10�9
(1) (2) (3) (4) (5) (6) (7) (8) (9) (10) (11) (12) (13) (14) (15) (16) (17) (18) (19) (20)
Sk–69 243=R136 279:47 �31:69 50 g 26 OB+WN5-6 +155 5.8�1.0 Pk( CaII +149 2.0 W 34 0.016 U 6) 98,W(HD 38268) CaII +141:6 1.5�0.6 L 26�11 0.012 U 52
Sk–69 282 279:34 �31:38 50 g 26 B1.5 CaII +176:2 2.7�0.1 N U 85TiII +173:8 1.5�0.9 N U 85
Sk–69 290 279:29 �31:31 50 g 26 B0.5 CaII +182:0 4.2�1.1 N U 85
HVC on LMC @+120 km s�1
< 50 CI <400 <0.0011CIV [1600]OI 2.2E5�9.0E4 [740000] 0.30 99NaI 0.75�0.38 0.00037MgI 400�200 0.011 100MgII [14000]AlII 1200�200 [1600] 0.39AlIII 54�37 0.018SiII 1.8E4�5.5E3 [19000] 0.51SiIV [440]PII <7900 [370] <21SII 5.0E4�3.0E5 [19000] 2.7 101ClI <630 <3.4KI <2.5 <0.018CaI <0.050 <.000023CaII 31�14 [22] 0.014 102TiII <99 [21] <1.2CrII <200 [150] <0.41MnII 63�33 [87] 0.18FeII 2.0E4�1.5E4 [7800] 0.62 103NiII <400 [260] <0.22ZnII <63 [42] <1.4
SN 1987 A 279:70 �31:94 50 g 26 SN +122 8.0 AB CI <32 L <400 109 96NaI +122 0.060�0.030 N 0.75�0.38 .00037 U 109MgI +122 8.9�1.0 L 110�10 0.0029 U 109
( MgII +129 400�190 L 5000�2400 0.13 U 34)MgII +122 1700�200 L 2.1E4�2.9E3 0.55 U 109
( AlII +129 50�12 L 630�150 0.21 U 34)AlII +122 93�19 L 1200�200 0.39 U 109
( SiII +129 400�90 L 5000�1200 0.14 U 34)SiII +122 1400�400 L 1.8E4�5.5E3 0.51 U 109PII <630 L <7900 109ClI <50 L <630 109KI <0.20 L <2.5 109
( CaI <.0070 N <0.088 l 26)CaI <.0040 N <0.050 l 109
( CaII +125:7 3.3 W 41 0.019 U 27) WCaII +122 4.6�0.2 N 57�3 0.026 U 109TiII <7.9 L <99 109
( CrII <10 L <130 34)CrII <16 L <200 109
( MnII <10 L <130 34)MnII +122 5.0�2.6 L 63�33 0.18 U 109
( FeII +129 600�260 L 7500�3200 0.23 U 34)FeII +122 720�200 L 9100�2500 0.28 U 109
( NiII <79 L <990 34)NiII <32 L <400 109ZnII <5.0 L <63 109

49
Probe l b d z type Cld vHI NHI tel ion vion Nion code Aion Aref A/A
�
D? Ref Note
� � kpc kpc km=s 1018 cm�2 km=s 1011 cm�2 10�9 10�9
(1) (2) (3) (4) (5) (6) (7) (8) (9) (10) (11) (12) (13) (14) (15) (16) (17) (18) (19) (20)
+120� 14 AB CIV 270�30 L 37 104+190 AlIII 7.6�5.2 L 54�37 0.018 U 37
SiIV 59�7 L 37Sk–66 118 277:00 �32:66 50 g 27 B2Ia CIV +130 >300 N 81Sk–66 169 276:60 �32:11 50 g 27 O9.7Ia NaI +108 11�3 W U 8 WSk–67 05 278:89 �36:33 50 g 30 O9.7Ib +133 2.2�1.0 Pk NaI <2.3 W <100 8 98,105,WSk–67 104 277:76 �33:04 50 g 27 WC5+O9 +120 5.8 Pk H2 +131 3200 L 5.5E4 000055 U 124 98(HD 36402) OI +131 1.6E4�1.2E4 L 2.7E5�2.0E5 0.37 U 124
MgI +131 20�12 L 340�210 0.0090 U 124MgII +131 1600�1300 L 2.7E4�2.3E4 0.72 U 124 �
SiII +131 4000�3000 L 6.9E4�5.1E4 1.9 U 124 �
SII +131 5000�3000 L 8.6E4�5.2E4 4.6 U 124FeII +131 1600�1200 L 2.7E4�2.0E4 0.84 U 124
Sk–67 120 277:70 �32:89 50 g 27 O8III: +113 8.8�1.0 PI CaII +130 6.1 W 69 0.032 U 40 97Sk–67 166 277:84 �32:49 50 g 27 O4If+ +130 3.0�1.0 PR H2 +120 5000 L 1.7E5 .00017 U 124
OI +125 7100�3400 L 2.4E5�1.4E5 0.32 U 124MgI +125 18�8 L 590�340 0.016 U 124MgII +125 630�590 L 2.1E4�2.1E4 0.55 U 124SiII +125 2000�1500 L 6.7E4�5.4E4 1.9 U 124 �
SII +125 7100�3400 L 2.4E5�1.4E5 13 U 124CaII +120 4.8 W 160 0.073 U 40 97,WFeII +125 1300�800 L 4.2E4�2.9E4 1.3 U 124
Sk–67 169 277:15 �32:54 50 g 27 B1Ia +104 4.6�1.0 Pk CIV +145 70 N 81 98Sk–68 82 279:32 �32:78 50 g 27 B3I+WN +122 12�1 Pk( H2 +120 2.9E4�7.0E3 N 2.4E5�6.0E4 105) 98(HD 269546) H2 +118 3.6E4�6.7E3 L 3.0E5�6.0E4 124
OI +118 1.6E4�1.2E4 L 1.3E5�9.7E4 0.17 U 124NaI <1.2 W <10 12 WMgI +118 63�47 L 510�390 0.013 U 124SiII +118 1.3E4�9.4E3 L 1.0E5�7.7E4 2.9 U 124 �
SII +118 4500�3300 L 3.6E4�2.7E4 2.0 U 124CaII +123 24�2 W 200�20 0.089 U 12 W
( FeII +120 2000�1000 L 1.6E4�7.8E3 0.50 U 105)FeII +118 2500�1900 L 2.0E4�1.5E4 0.63 U 124 �
Sk–69 91 280:69 �33:36 50 g 27 B0.7Ia CaII <5.4 W 8 WSk–69 195 279:67 �31:99 50 g 26 B2: +122 8.0 AB NaI <1.6 L <20 52Sk–69 203 279:66 �31:95 50 g 26 B0.7Ia +122 8.0 AB NaI <0.63 L <7.9 52
CaII +122 8.3�0.8 L 100�10 0.048 U 52Sk–69 204 279:92 �31:92 50 g 26 B1 +115 7.7 PI NaI <0.42 L <5.4 52Sk–69 211 279:85 �31:86 50 g 26 B9Ia +115 7.6 PI NaI <0.52 L <6.9 52
+115a 4.7 PI CaII +107:1 3.2�0.3 L 68�6 0.031 U 52+115b 2.9 PI CaII +129:4 2.0�0.3 L 68�10 0.031 U 52
Sk–69 213 279:60 �31:88 50 g 26 B1Ia +116 7.3 PI NaI <0.32 L <4.3 52Sk–69 215 279:52 �31:88 50 g 26 O-B0 +116 7.1 PI NaI <0.32 L <4.5 52Sk–69 216 279:83 �31:77 50 g 26 Be +112 7.5 PI NaI <0.42 L <5.6 52
CaII <2.2 L <30 52Sk–69 224 279:61 �31:82 50 g 26 B0 +115 7.2 PI NaI <0.42 L <5.8 52
CaII <5.4 L <75 52Sk–69 225 279:68 �31:81 50 g 26 B8I +114 7.3 PI NaI <0.63 L <8.6 52Sk–69 239 279:48 �31:72 50 g 26 A0I +111 6.1 Pk NaI <0.21 L <3.4 52
CaII <1.3 L <22 52

50
IonAbundancesin
HVCsandIV
Cs
Probe l b d z type Cld vHI NHI tel ion vion Nion code Aion Aref A/A
�
D? Ref Note
� � kpc kpc km=s 1018 cm�2 km=s 1011 cm�2 10�9 10�9
(1) (2) (3) (4) (5) (6) (7) (8) (9) (10) (11) (12) (13) (14) (15) (16) (17) (18) (19) (20)
Sk–69 243=R136 279:47 �31:69 50 g 26 OB+WN5-6 +111 6.1 Pk NaI <0.32 L <5.2 52 98(HD 38268) ( CaII +123 1.2 W 19 0.0087 U 6) W
CaII +121:6 1.3�0.6 L 21�10 0.0097 U 52Sk–69 246 279:39 �31:67 50 g 26 WN7 +111 6.1�1.0 Pk NaI <0.32 L <5.2 52 98(HD 38282) CaII <1.3 L <22 52
FeII +130 320 L 5200 0.16 U 3Sk–69 247 279:93 �31:61 50 g 26 A0Ia+ +105 7.4 Pk NaI <0.52 L <7.1 52 106
+105a 3.0 Pk CaII +121:7 1.2�0.5 L 40�17 0.018 U 52+105b 4.4 Pk CaII +135:3 1.8�0.5 L 40�11 0.018 U 52
Sk–69 274 280:25 �31:35 50 g 26 B2.5Ia +110 5.0�1.0 PR CaII +110 2.3 W 47 0.021 U 40 97,WSk–69 282 279:34 �31:38 50 g 26 B1.5 CaII +112:9 3.3�0.1 N U 85Sk–69 290 279:29 �31:31 50 g 26 B0.5 CaII +105:7 2.8�1.1 N U 85Sk–70 111 280:49 �31:31 50 g 26 B0.5Ia CaII +117:7 5.4�0.1 N U 85Sk–71 3 282:82 �34:25 50 g 28 pec +125 2.7�1.0 Pk( NaI +144 6.4�0.9 W 240�90 0.12 U 8) 98,W
NaI <2.5 W <93 12 W( CaII +139 35�3 W 1300�500 0.59 U 8) W
CaII +126 52�3 W 1900�700 0.89 U 12 WSk–71 33a 281:85 �32:19 50 g 27 B5Ia CaII +120 4.8 W U 23 97,WSk–71 41 281:91 �32:07 50 g 27 O8.5I +112 11�1 Pk CaII +120 2.3 W 22 0.010 U 23 97,WSk–71 42 281:87 �32:06 50 g 27 B1Iab +112 11�1 Pk NaI <0.99 W <9.2 12 98,W
( CaII +132 26 W 240 0.11 U 12) WCaII +130 3.6 W 33 0.015 U 23 97,W
Sk–71 45 281:86 �32:02 50 g 27 O4If +112 11�1 Pk CaII +120 2.3 W 22 0.010 U 23 97,WLH 10:3120 277:19 �36:06 50 g 29 O5.5V H2 +120 1.0E4 L U 124
OI +122 1.0E4 L U 124SiII +122 400 L U 124SII +122 1.3E4 L U 124FeII +122 1600 L U 124
IVC on LMC @+65 km s�1
< 50 CI 340�130 0.00095CII >6.0E4 [350000] >0.17CIV [1600] 8600NV [350] <2600OI 1.0E5�2.0E4 [740000] 0.13NaI 11�1 0.0054 107MgI 390�50 0.010MgII 2.6E4 [14000] 0.68AlII [1600] 108SiII 3.5E4�2.0E4 [19000] 0.99 109SiIII >2600 >0.073SiIV [440]PII <9700 [370] <26SII >1.9E4 [19000] >1.00ClI <770 <4.1KI <3.9 <0.029CaI 0.31�0.06 0.00014CaII 100�70 [22] 0.046 110TiII <120 [21] <1.4CrII 930�170 [150] 1.9MnII 390�70 [87] 1.1FeII 3.3E4�6.0E3 [7800] 1.0 111NiII 2200�800 [260] 1.2ZnII 40�24 [42] 0.91

51
Probe l b d z type Cld vHI NHI tel ion vion Nion code Aion Aref A/A
�
D? Ref Note
� � kpc kpc km=s 1018 cm�2 km=s 1011 cm�2 10�9 10�9
(1) (2) (3) (4) (5) (6) (7) (8) (9) (10) (11) (12) (13) (14) (15) (16) (17) (18) (19) (20)
SN 1987 A 279:70 �31:94 50 g 26 SN +65 6.5 AB CI +65 22�8 L 340�130 .00095 U 109 96OI +70>1.0E4 L >1.5E5 >0.21 U 34
( NaI +64:6 0.69 W 11 0.0052 U 27) W( NaI +74:8 0.097 W 1.5 .00073 U 27) W( NaI +64:5 0.50�0.08 N 7.7�1.2 0.0038 U 36)
NaI +65 0.74�0.07 N 11�1 0.0056 U 109MgI +65 25�3 L 390�50 0.010 U 109AlII +70 >500 L >7700 >2.6 U 34 �
( SiII +70 >1200 L >1.8E4 >0.52 U 34) �
SiII +65 4800�800 L 7.4E4�1.2E4 2.1 U 109PII <630 L <9700 109ClI <50 L <770 109KI <0.25 L <3.9 109
( CaI +65:3 0.016 W 0.25 .00011 U 27) W( CaI +64:3 0.022�0.003 N 0.34�0.05 .00015 U 26)
CaI +65 0.020�0.004 N 0.31�0.06 .00014 U 109( CaII +60:8 8.7�0.004 W 130�0.06 0.061 U 27) W( CaII +64:5 8.3�0.01 N 130�0.2 0.058 U 26)( CaII +73:5 2.3�0.01 W 36�0.2 0.017 U 27) W( CaII +83:6 1.8�0.01 W 28�0.2 0.013 U 26) W
CaII +65 15�0.3 N 230�5 0.11 U 109TiII <7.9 L <120 109
( CrII +70 30�13 L 450�190 0.95 U 34)CrII +65 60�11 L 930�170 1.9 U 109
( MnII +70 30�13 L 460�200 1.4 U 34)MnII +65 25�5 L 390�70 1.1 U 109
( FeII +70 >1500 L >2.3E4 >0.72 U 34)FeII +65 2600�500 L 4.0E4�8.3E3 1.2 U 109
( NiII +70 170�40 L 2600�600 1.5 U 34)NiII +65 140�50 L 2200�800 1.2 U 109
( ZnII <2.0 L <31 34)ZnII +65 2.6�1.5 L 40�24 0.91 U 109
Sk–65 40 276:76 �34:02 50 g 28 B3Ia +60 <2.0 Pk CaII <1.2 W 12 98,WSk–66 28 277:27 �36:06 50 g 29 WC6+O8 CaII +70 3.6 W U 35 97,WSk–66 118 277:00 �32:66 50 g 27 B2Ia CIV +73 >1000 N 81Sk–67 05 278:89 �36:33 50 g 30 O9.7Ib +45 4.9�1.0 Pk NaI +57 3.4�0.8 W 70�22 0.034 U 8 98,105,W
+45� 7.1�1.0 Pk OI +75 7400 W 1.0E5 0.14 U 10 W+133 AlII +70 30 W 430 0.14 U 10 W
FeII >1300 L >1.8E4 >0.55 U 10Sk–67 104 277:76 �33:04 50 g 27 WC5+O9 +52 4.8 Pk H2 +60 4000 L 8.3E4 000083 U 124 98(HD 36402) CII +90 >7000 N >1.5E5 >0.41 U 11
CIV +90 1000 N 11NV <300 N 11
( OI +90 >5000 L >1.0E5 >0.14 U 10)( OI +90>1.0E4 L >2.1E5 >0.28 U 11)
OI +70 1.8E4�1.3E4 L 3.7E5�2.8E5 0.50 U 124MgI +70 20�14 L 420�280 0.011 U 124
( MgII +90 >630 L >1.3E4 >0.35 U 10)( MgII +90 3000 N 6.2E4 1.6 U 11) �
MgII +70 320�280 L 6600�5800 0.17 U 124( AlII +90 >130 L >2600 >0.87 U 10)
AlII +90 150 N 3100 1.0 U 11( SiII +90 >3200 L >6.6E4 >1.9 U 10) �
( SiII +90 3500 N 7.3E4 2.1 U 11) �
SiII +70 1000�700 L 2.1E4�1.4E4 0.59 U 124 �

52
IonAbundancesin
HVCsandIV
Cs
Probe l b d z type Cld vHI NHI tel ion vion Nion code Aion Aref A/A
�
D? Ref Note
� � kpc kpc km=s 1018 cm�2 km=s 1011 cm�2 10�9 10�9
(1) (2) (3) (4) (5) (6) (7) (8) (9) (10) (11) (12) (13) (14) (15) (16) (17) (18) (19) (20)
SiIII +90 >300 N >6300 >0.18 U 11SiIV +90 300 N 11SII +70 2000�1200 L 4.2E4�2.5E4 2.2 U 124
( FeII +90>2500 L >5.2E4 >1.6 U 10) �
( FeII +90 2500 N 5.2E4 1.6 U 11) �
FeII +70 1600�1100 L 3.3E4�2.3E4 1.0 U 124Sk–67 120 277:70 �32:89 50 g 27 O8III: +51 3.9�1.0 PI CaII +70 7.4 W 190 0.086 U 40 97Sk–67 166 277:84 �32:49 50 g 27 O4If+ (+60) <2.0 PR H2 +60 4000 L >2.0E5 >.00020 U 124
OI +61 1.0E4�9.4E3 L >5.0E5 >0.67 U 124MgI +61 7.9�5.9 L >400 >0.010 U 124MgII +61 2000�1900 L >1.0E5 >2.6 U 124 �
SiII +61 1000�700 L >5.0E4 >1.4 U 124 �
SII +61 6300�6100 L >3.2E5 >17 U 124CaII +60 4.8 W >240 >0.11 U 40 97,WFeII +61 2500�1500 L >1.3E5 >3.9 U 124 �
Sk–67 169 277:15 �32:54 50 g 27 B1Ia (+70) <2.0 Pk CIV +73 600 N 81 98Sk–67 174 277:91 �32:44 50 g 27 O8V NaI +87 2.0 W U 7 97,WSk–67 250 277:96 �31:37 50 g 26 O7.5II(f) CaII +67 17 W U 14 97,WSk–68 82 279:32 �32:78 50 g 27 B3I+WN +50 1.6�1.0 Pk H2 +60 4.5E4�3.6E4 L 2.8E6�2.8E6 0.0028 U 124 98(HD 269546) OI +56 2000�1400 L 1.2E5�1.2E5 0.17 U 124
NaI +67 7.6�0.6 W 470�300 0.23 U 12 WMgI +56 40�38 L 2500�2900 0.065 U 124MgII +56 71�60 L 4400�4600 0.12 U 124SiII +56 4000�2700 L 2.5E5�2.3E5 7.0 U 124 �
SII +56 1.6E4�7.6E3 L 1.0E6�7.8E5 53 U 124CaII +58 41�2 W 2600�1600 1.2 U 12 WFeII +56 3200�2400 L 2.0E5�1.9E5 6.1 U 124 �
Sk–68 114=R116 278:89 �32:36 50 g 27 B1Iae NaI +45:8 <0.24 W 18 WSk–68 135 279:26 �31:77 50 g 26 On9.7Ia (+60) <2.0 PR CaII +60 4.8 W >240 >0.11 U 40 97,WSk–69 91 280:69 �33:36 50 g 27 B0.7Ia ( CaII <5.4 W 8) WSk–69 103 280:42 �33:27 50 g 27 WC5+OB CaII +70 2.3 W U 23 97,WSk–69 104 279:91 �33:38 50 g 28 O6Ib(f) SiII +60 170 W U 10 WSk–69 106 280:44 �33:30 50 g 27 B0: CaII +80 3.6 W U 23 97,WSk–69 107 280:42 �33:27 50 g 27 O9.5Ib CaII +70 2.3 W U 23 97,WSk–69 195 279:67 �31:99 50 g 26 B2: +65 10 AB NaI +61:8 0.45�1 L 4.5�10 0.0022 U 52Sk–69 203 279:66 �31:95 50 g 26 B0.7Ia +65 10 AB( NaI +64:4 0.20�0.08 N 2.0�0.8 .00098 U 36)
( NaI +73:7 0.70�0.08 N 7.0�0.8 0.0034 U 36)NaI +73:7 0.69�0.14 L 6.9�1.4 0.0034 U 52CaII +64:6 6.7�0.5 W 67�5 0.031 U 52 W
Sk–69 204 279:92 �31:92 50 g 26 B1 +57 8.8 PI NaI +61:3 0.79�0.14 L 9.0�1.6 0.0044 U 52Sk–69 211 279:85 �31:86 50 g 26 B9Ia +57 8.5 PI ( NaI +64:0 3.1�0.08 N 36�0.9 0.018 U 36)
NaI +64:0 3.1�0.1 L 36�2 0.018 U 52+57a 7.8 PI CaII +64:8 31�0.3 L 400�4 0.18 U 52+57b 0.74 PI CaII +79:2 3.0�0.3 L 400�40 0.18 U 52
Sk–69 213 279:60 �31:88 50 g 26 B1Ia +64 6.8 PI NaI <0.32 L <4.7 52Sk–69 215 279:52 �31:88 50 g 26 O-B0 +66 5.9 PI NaI <0.32 L <5.4 52Sk–69 216 279:83 �31:77 50 g 26 Be +55 7.8 PI NaI +64:4 1.7�0.09 L 22�1 0.011 U 52
+55a 4.2 PI CaII +66 20�0.5 L 490�10 0.22 U 52+55b 2.1 PI CaII +91:4 10�0.5 L 490�20 0.22 U 52+54c 1.6 PI CaII +100:5 7.9�0.5 L 480�30 0.22 U 52
Sk–69 220=R127 279:96 �31:80 50 g 26 OIafpe +53 8.2 PI NaI +46:7 0.99�0.10 W 12�1 0.0059 U 18 WSk–69 221=R128 279:96 �31:79 50 g 26 B2Ia +52 8.2 PI NaI +47:6 1.6�0.1 W 19�1 0.0095 U 18 W

53
Probe l b d z type Cld vHI NHI tel ion vion Nion code Aion Aref A/A
�
D? Ref Note
� � kpc kpc km=s 1018 cm�2 km=s 1011 cm�2 10�9 10�9
(1) (2) (3) (4) (5) (6) (7) (8) (9) (10) (11) (12) (13) (14) (15) (16) (17) (18) (19) (20)
Sk–69 224 279:61 �31:82 50 g 26 B0 +63 6.5 PI NaI <0.42 L <6.4 52CaII <5.4 L <83 52
Sk–69 225 279:68 �31:81 50 g 26 B8I +61 7.0 PI NaI <0.63 L <9.0 52Sk–69 239 279:48 �31:72 50 g 26 A0I +70 1.5 Pk NaI <0.21 L <14 52 98
( CaII +40 2.3 W 160 0.072 U 23) 97,W+70a 0.75 Pk CaII +55:2 2.7�0.3 L 360�40 0.16 U 52+70b 0.75 Pk CaII +67:0 3.0�0.3 L 390�40 0.18 U 52
R 134 279:46 �31:67 50 g 26 WN6 +70 1.5�1.0 Pk CaII <2.3 W <160 23 97,WR 137 279:45 �31:68 50 g 26 B0.5Ia: +70 1.5�1.0 Pk CaII <2.3 W <160 23 97,WR 139 279:45 �31:68 50 g 26 WN7/Of +70 1.5�1.0 Pk CaII +60 2.3 W 160 0.072 U 23 97,WR 140 279:45 �31:68 50 g 26 WN6 +70 1.5�1.0 Pk CaII +60 2.3 W 160 0.072 U 23 97,WSk–69 243=R136 279:47 �31:69 50 g 26 OB+WN5-6 +70 1.5�1.0 Pk NaI <0.32 L <21 52 98(HD 38268) ( CaII +70 2.8 W 190 0.086 U 6 W
( CaII <2.3 W <160 23) 97,W( CaII +100 3.6 W 240 0.11 U 40) 97,W
CaII +58:4 1.2�0.6 L 80�67 0.037 U 52Sk–69 246 279:39 �31:67 50 g 26 WN7 +70 1.5�1.0 Pk NaI <0.32 L <21 52 98(HD 38282) ( CaII +62 4.3�1.2 W 290�210 0.13 U 12) W
( CaII <2.3 W <160 23) 97,WCaII +67:5 1.3�0.3 L 86�61 0.039 U 52SiII +60 170 W 1.1E4 0.31 U 10 WFeII +60 400 L 2.7E4 0.82 U 10
Sk–69 247 279:93 �31:61 50 g 26 A0Ia+ +45 7.1�1.0 Pk NaI <0.52 L <7.4 52 106+45a 3.8 Pk CaII +65:8 1.7�0.5 L 45�13 0.020 U 52+45b 3.3 Pk CaII +76:3 1.5�0.5 L 45�15 0.020 U 52
Sk–69 248 279:47 �31:65 50 g 26 WN7 +70 1.5�1.0 Pk CaII +60 2.3 W 160 0.072 U 23 97,WSk–69 255 279:81 �31:53 50 g 26 WC5+OB +45 7.1 Pk CaII +71:1 2.2�0.2 N 31�3 0.014 U 85Sk–69 270 279:42 �31:44 50 g 26 B2.5Ia (+60) <2.0 PR CaII +60 10 W >500 >0.23 U 40 97,WSk–69 274 280:25 �31:35 50 g 26 B2.5Ia +45 7.1 PR CaII <0.35 W <4.9 l 85 W
TiII <1.8 W <25 85 WSk–69 276 279:96 �31:37 50 g 26 B0Iab CaII +75:7 4.0�0.2 N U 85Sk–69 282 279:34 �31:38 50 g 26 B1.5 CaII +76:3 3.1�0.1 N U 85
TiII +82:6 2.0�0.9 N U 85Sk–69 289 279:93 �31:27 50 g 26 B0.7Ia (+60) <2.0 PR CaII +60 7.4 W >370 >0.17 U 40 97,WSk–69 290 279:29 �31:31 50 g 26 B0.5 CaII +73:8 5.1�1.1 N U 85
TiII +65:0 7.8�3.1 N U 85TiII +87:7 7.7�3.1 N U 85
Sk–70 111 280:49 �31:31 50 g 26 B0.5Ia CaII +58:0 20�0.2 N U 85Sk–70 115 280:48 �30:70 50 g 26 O6.5III +55 <2.0 Pk CaII +55:5 8.3�0.1 N >420 >0.19 U 85 98
TiII <3.5 W 85 WSk–71 3 282:82 �34:25 50 g 28 pec +61 2.0�1.0 Pk( NaI +70 1.5�0.5 W 74�45 0.036 U 8) 98,W
NaI +71 2.0�0.5 W 100�56 0.049 U 12 W( CaII +68 5.4�1.9 W 270�170 0.12 U 8) W
CaII +75 8.7�1.3 W 430�230 0.20 U 12 WSk–71 33a 281:85 �32:19 50 g 27 B5Ia CaII +70 3.6 W U 23 97,WSk–71 41 281:91 �32:07 50 g 27 O8.5I +66 6.2�1.0 Pk CaII +70 2.3 W 38 0.017 U 23 97,98,WSk–71 42 281:87 �32:06 50 g 27 B1Iab +66 6.2�1.0 Pk NaI <0.99 W <16 12 98,W
( CaII +71 27 W 440 0.20 U 12) 98,WCaII +70 3.6 W 57 0.026 U 23 97,W
Sk–71 45 281:86 �32:02 50 g 27 O4If +66 6.2�1.0 Pk CaII +80 3.6 W 57 0.026 U 23 97,98,WLH 10:3120 277:19 �36:06 50 g 29 O5.5V H2 +60 1.0E4 L U 124
SiII +51 320 L U 124SII +51 1.0E4 L U 124FeII +51 320 L U 124

54
IonAbundancesin
HVCsandIV
Cs
Probe l b d z type Cld vHI NHI tel ion vion Nion code Aion Aref A/A
�
D? Ref Note
� � kpc kpc km=s 1018 cm�2 km=s 1011 cm�2 10�9 10�9
(1) (2) (3) (4) (5) (6) (7) (8) (9) (10) (11) (12) (13) (14) (15) (16) (17) (18) (19) (20)
Upper IV Arch: IV14, IV13, IV7, IV16, IV6, IV5, IV17, IV11, IV12, IV9, IV15, IV8, IV10
IV7 < 5:0 < 3:9PG 0955+291 199:89 51:94 5:0�0.6 s 3:9 B5V IV7 �64 8.0�3.0 Ef CaII �64 1.8 L 23 0.010 U 93 112
IV6 < 1:9 < 1:7 CI* 720�690 0.0020 1Z�
> 0:4 > 0:4 CIV [1600]NaI 1.6 0.00080MgII 2.7E4�2.8E4 [14000] 0.72SiII 3.3E4�3.2E4 [19000] 0.94SII 3.8E4�3.6E4 [19000] 2.1SIII 3500�3700 0.19SiIV [440]CaII 30 [22] 0.014TiII 39�38 [21] 0.46MnII 180�170 [87] 0.52FeII 1.4E4�1.3E4 [7800] 0.42
BD +38 2182 182:16 62:21 4:0 a 3:5 B3V IV6 (�73) <0.50 JB NaI �74 0.25 L >50 >0.025 U 93 113CaII �73 1.3 L >250 >0.12 U 93
HD 93521 183:14 62:15 1:9 t 1:7 O9.5V IV6 �65 3.2�3.0 GB CI* �66:3 23�5 L 720�690 0.0020 U 56CIV �67 240 N 51NaI �64:8 0.052 L 1.6 .00080 U 107MgII �66:3 870�370 L 2.7E4�2.8E4 0.72 U 56 114SiII �66:3 1100�200 L 3.3E4�3.2E4 0.94 U 56SII �66:3 1200�90 L 3.8E4�3.6E4 2.1 U 56SIII �66:3 110�60 L 3500�3700 0.19 U 56SiIV �60 820 N 51
( CaII �66:3 1.1�0.1 L 36�34 0.016 U 56)CaII �65:6 0.95 L 30 0.014 U 107TiII �66:3 1.3�0.3 L 39�38 0.46 U 56MnII �66:3 5.6�0.8 L 180�170 0.52 U 56FeII �66:3 440�40 L 1.4E4�1.3E4 0.42 U 56
HD 98152 171:46 66:38 0:40�0.10 t 0:37 A0V IV6 �72 37�5 Ef SiII <90 N <250 L 83 S
IV17 < 0:8 < 0:7 MgI 36 0.00094
> 0:6 > 0:5 SiII >190 [19000] >0.0055CaII 16�10 [22] 0.0073MnII 130 [87] 0.39
SN 1998 S 150:75 65:96 SN IV17 �54 102�1 Ef MgI �59 36 N 36 .00094 117 10,115CaII �59 27 N 26 0.012 117MnII �59 140 N 130 0.39 117
PG 1126+468 157:20 64:71 5:8�0.7 s 5:2 HB IV17 �63 78�0.6 Ef CaII �70 12 W 16 0.0071 U 70 116PG 1213+456 141:93 70:44 2:9�0.7 a 2:7 sdB IV17 �61 24�1 JB CaII <1.3 L <5.2 93BD +49 2137 134:23 67:40 0:80�0.20 a 0:74 HB IV17 �53 46�1 Ef SiII >90 N >190 >0.0055 U 83 11,S
�53a 29�1 Ef CaII �63 1.2 L 4.3 0.0020 U 93
�53b 18�1 Ef CaII �76 0.76 L 4.3 0.0020 U 93HD 106420 140:59 68:79 0:55�0.27 p 0:51 B8V IV17 �59 39�1 Ef SiII <90 N <230 L 83 SHD 105058 141:16 65:80 0:19�0.04 p 0:17 A2V IV17 �57 75�0.9 Ef SiII <90 N <120 L 83 S
IV11 (> 0:8 > 0:7) SiII [19000]PG 1255+546 120:91 62:68 0:80�0.30 a 0:71 sdB IV11 �81 4.5�0.3 Dw SiII <90 N <2000 l 83 S

55
Probe l b d z type Cld vHI NHI tel ion vion Nion code Aion Aref A/A
�
D? Ref Note
� � kpc kpc km=s 1018 cm�2 km=s 1011 cm�2 10�9 10�9
(1) (2) (3) (4) (5) (6) (7) (8) (9) (10) (11) (12) (13) (14) (15) (16) (17) (18) (19) (20)
IV9 < 2:1 < 1:6 CIV [1600] 1Z�
> 0:3 > 0:2 SiII <290 [19000] <0.0083SiIV [440]SII 1.5E4�2.2E2 [19000] 0.78CaII 7.5 [22] 0.0034
PG 1351+640 111:89 52:02 QSO IV9 �74 15�1 Ef CaII <50 N <340 79 117HD 121800 113:01 49:76 2:1�0.3 t 1:6 B1.5V IV9 �71 72�0.7 Ef CIV �79 360�40 N 129
SiIV �79 140�40 N 129SII �69 1.1E4�1.2E2 N 1.5E4�2.2E2 0.78 U 129 118CaII �71 5.4 N 7.5 0.0034 U 58
HD 127557 109:43 47:13 0:28�0.06p 0:21 A0V IV9 �71 98�1 Dw SiII <90 N <92 L 83 S
�58 31�2 Dw SiII <90 N <290 L 83 S
IV15 CaII [22]BS 16079-0015 90:69 46:46 2:4�0.5 s 1:7 (HB) IV15 �72 5.7�1.5 Ef CaII <2.4 W <41 114
Upper IV Arch (off cores)BA 90700003 114:19 30:08 4:2 a 2:1 IVa �88 8.6�0.5 Dw SiII >90 N >1000 >0.029 U 83 S,119PG 1212+369 159:93 77:72 2:7�0.4 a 2:6 sd(B2) IVa (�96) <3.0 Ef CaII �96 0.95 L >32 >0.015 U 93 120
(�76) <3.0 Ef CaII �76 0.76 L >25 >0.012 U 93(�66) <3.0 Ef CaII �66 2.0 L >68 >0.031 U 93(�57) <3.0 Ef CaII �57 3.5 L >120 >0.053 U 93
BT Dra 99:41 51:21 1:9�0.2 t 1:5 RR Lyr IVa �79 5.2�1.1 Ef CaII �83 8.0 N 150 0.070 U 33 121
Lower IV Arch: IV22, IV24, IV18, IV26, IV21, IV19, IV25, IV23, IV27, IV20
IV24 > 0:5 > 0:4HD 87015 211:17 51:48 0:49�0.19p 0:38 B2.5IV IV24 �41 57�2 Ef NaI <0.13 L <0.22 93
SiII <230 N <400 l 50 s( CaII <1.2 W <2.0 2)
CaII <0.20 L <0.35 L 93
IV26 < 2:7 < 2:6 NaI 0.57 0.00028
> 0:4 > 0:4 SiII >54 [19000] >0.0015CaII 4.6 [22] 0.0021
H.O.+41B 144:63 75:06 3:1 r 3:0 B5V IV26 �36 166�1 JB NaI �50 0.95 L 0.57 .00028 U 93SiII >90 N >54 >0.0015 U 83 SCaII �53 7.6 L 4.6 0.0021 U 93
PG 1212+369 159:93 77:72 2:7�0.4 a 2:6 sd(B2) IV26 �29 154�2 Ef CaII �41 17 L 11 0.0049 U 93 120HD 98152 171:46 66:38 0:40�0.10 t 0:37 A0V IV26 �54 28�4 Ef SiII <90 N <320 L 83 S
IV21 < 0:4 < 0:3 NaI 1.2 0.00057BD +63 985 133:74 53:42 0:40�0.10s 0:32 A5V IV21 �47 85�2 Ef NaI �45 0.99 W 1.2 .00057 U 84HD 101714 135:93 52:78 0:30�0.10s 0:24 A5V IV21 �48 105�1 Dw NaI <0.15 W <0.14 84HD 101075 135:50 51:13 0:24�0.04p 0:19 A2IV IV21 �47 189�1 Dw NaI <0.24 W <0.13 84HD 103718 134:74 55:33 0:23�0.05p 0:19 A3V IV21 �46 96�1 Dw NaI <0.15 W <0.15 84
IV19 < 2:1 < 1:6 SiII >900 [19000] >0.025SII 1.5E4�7.6E3 [19000] 0.81CaII 25�10 [22] 0.011
PG 1351+640 111:89 52:02 QSO IV19 �47 105�2 Ef CaII �46 39�0.8 N 37�1 0.017 79 117HD 121800 113:01 49:76 2:1�0.3 t 1:6 B1.5V IV19 �37 10�5 Ef SiII >90 N >900 >0.025 U 83 S
SII �37 1500�100 N 1.5E4�7.6E3 0.81 U 129 118CaII �57 1.3 N 13 0.0059 U 58
PG 1338+611 112:54 55:25 0:30�0.10s 0:25 sdB IV19 �52 124�4 Ef CaII <3.5 N <2.8 70 29

56
IonAbundancesin
HVCsandIV
Cs
Probe l b d z type Cld vHI NHI tel ion vion Nion code Aion Aref A/A
�
D? Ref Note
� � kpc kpc km=s 1018 cm�2 km=s 1011 cm�2 10�9 10�9
(1) (2) (3) (4) (5) (6) (7) (8) (9) (10) (11) (12) (13) (14) (15) (16) (17) (18) (19) (20)
Lower IV Arch (off cores)PG 1259+593 120:56 58:05 QSO IVa �54 30�1 Ef NI 1.2E4�9.5E3 L 4.1E4�3.2E4 0.44 126
OI 2.0E5�1.5E5 L 6.7E5�5.1E5 0.91 126OVI 480�160 L 126SiII 5400�2700 L 1.8E4�9.2E3 0.51 126ArI 350�270 L 1200�900 0.33 126FeII 3600�1500 L 1.2E4�5.0E3 0.38 126
PG 0953+414 179:78 51:71 QSO IVa �47 23�1 Ef SII �40 4800�800 L 2.1E4�3.6E3 1.1 128PG 0955+291 199:89 51:94 5:0�0.6a 3:9 B5V IVa �45 15�3 Ef CaII �45 5.5 L 36 0.016 U 93 112BD +38 2182 182:16 62:21 4:0 a 3:5 B3V IVa �53a 9.5�0.1 JB NaI �56 0.58 L 6.1 0.0030 U 93
CaII �58 5.2 L 55 0.025 U 93
�53b 34�0.1 JB NaI �44 1.7 L 4.9 0.0024 U 93CaII �44 19 L 55 0.025 U 93
BD +36 2268 153:37 79:56 3:7�0.7s 3:6 B2V IVa �47a 22�1 Ef NaI <0.13 L <0.58 93 122CaII �56 3.4 L 16 0.0071 U 93
�47b 37�1 Ef NaI <0.13 L <0.34 93CaII �44 5.8 L 16 0.0071 U 93
PG 1213+456 141:93 70:44 2:9�0.7a 2:7 sdB IVa �40 27�1 JB CaII <1.3 L <4.6 93HD 93521 183:14 62:15 1:9 t 1:7 O9.5V IVa �57:8 22�3 GB H2 �62 3200�1900 L 1.4E4�9.0E3 116
CI* �57:8 120�8 L 540�80 0.0015 U 56NaI �57:4 0.35 L 1.6 .00079 U 107MgII �57:7 1300�500 L 6200�2500 0.16 U 56 114SiII �57:7 4400�300 L 2.0E4�3.1E3 0.56 U 56SII �57:7 3200�100 L 1.4E4�2.1E3 0.78 U 56SIII �57:7 130�70 L 590�320 0.032 U 56
( CaII �55 6.1�0.4 N 28�4 0.013 U 16)( CaII �57 7.2 L 33 0.015 U 93)
CaII �59:1 1.7 L 7.9 0.0036 U 107CaII �56:2 2.6 L 12 0.0055 U 107
( TiII �55 5.4�0.7 N 25�5 0.29 U 16)( TiII �57:7 2.8�0.4 L 13�2 0.15 U 56)
TiII �59:1 6.3 L 29 0.34 U 107MnII �57:7 17�14 L 78�66 0.23 U 56FeII �57:7 2600�2200 L 1.2E4�1.0E4 0.36 U 56
�51:2 16�3 GB CI* �51:2 48�10 L 300�90 .00085 U 56NaI �54:6 0.13 L 0.80 .00039 U 107MgII �51:2 1600�600 L 1.0E4�4.0E3 0.26 U 56 114SiII �51:2 3900�400 L 2.5E4�5.5E3 0.69 U 56SII �51:2 3400�200 L 2.1E4�4.3E3 1.2 U 56SIII �51:2 510�80 L 3200�800 0.17 U 56
( CaII �51:2 1.2�0.2 L 7.8�1.8 0.0036 U 56)CaII �49:5 3.7 L 24 0.011 U 107
( TiII �51:2 1.5�0.5 L 9.8�3.5 0.12 U 56)TiII �52:5 0.20 L 1.3 0.015 U 107MnII �51:2 14�1 L 89�19 0.26 U 56FeII �51:2 910�60 L 5800�1200 0.18 U 56
�38:8 7.6�3.0 GB CI* �38:8 37�8 L 490�220 0.0014 U 56MgII �38:8 1000�700 L 1.4E4�1.0E4 0.36 U 56 114SiII �38:8 1300�90 L 1.7E4�7.0E3 0.49 U 56SII �38:8 1000�200 L 1.4E4�5.9E3 0.74 U 56SIII �38:8 140�110 L 1800�1600 0.098 U 56
( CaII �40 2.4�0.4 N 32�14 0.014 U 16)( CaII �39 3.7 L 49 0.022 U 93)
CaII �38:8 2.8�0.2 L 37�15 0.017 U 56

57
Probe l b d z type Cld vHI NHI tel ion vion Nion code Aion Aref A/A
�
D? Ref Note
� � kpc kpc km=s 1018 cm�2 km=s 1011 cm�2 10�9 10�9
(1) (2) (3) (4) (5) (6) (7) (8) (9) (10) (11) (12) (13) (14) (15) (16) (17) (18) (19) (20)
( TiII �40 0.80�0.40 N 11�7 0.12 U 16)TiII �38:8 0.50�0.43 L 6.6�6.3 0.077 U 56MnII �38:8 5.9�1.2 L 77�35 0.23 U 56FeII �38:8 600�30 L 7900�3200 0.25 U 56
PG 1255+546 120:91 62:68 0:80�0.30 a 0:71 sdB IVa �51 75�0.3 Dw SiII <90 N <120 L 83 SHDE 233791 154:53 56:65 0:48�0.70 a 0:40 HB IVa �50 39�0.6 Ef NaI �51 1.7 L 4.5 0.0022 U 93 123
�50a 11�0.6 Ef CaII �66 >2.0 L >18 >0.0081 U 93
�50a 27�0.6 Ef CaII �52 4.9 L 18 0.0082 U 93
IV Spur < 2:1 < 2:1 SiII >200 [19000] >0.0056
> 0:3 > 0:3 CaII 22 [22] 0.0099FeII >0 [7800] >0
HD 100340 258:85 61:23 3:0 a 2:6 B1V Sp �70 7.3�2.0 Dw( CaII �64 1.1 N 15 0.0069 U 58) 124CaII �63 1.6 L 22 0.0099 U 113FeII �55 >0 N >0 >0 U 86
Feige 40 245:37 63:62 2:9�0.4 t 2:6 B4V Sp �52 45�3 Dw SiII >90 N >200 >0.0056 U 83 S,125PG 1205+228 235:56 79:12 2:1 a 2:1 sdB S1 �42 137�4 Ef SiII >90 N >66 >0.0019 U 83 S,126HD 100600 239:18 69:47 0:30�0.05 t 0:28 B4V S1 �40 86�1 Ef SiII <90 N <110 L 83 S
CaII <0.60 N <0.70 L 58
LLIV Arch < 1:8 < 1:2 CIV [1600] 1Z�
(> 0:9 > 0:6) NI 5.2E4�2.1E4 [93000] 0.55NII 7100�3400 0.076OI 7.6E5�4.2E5 [740000] 1.0NaI 2.4 0.0012MgI 44 0.0012MgII >750 [14000] >0.020AlII 280 [1600] 0.092AlIII <44 <0.015SiII 1.4E4�4.9E3 [19000] 0.39SiIV [440]PII 470�130 [370] 1.3ArI 1200�200 [1200] 0.32FeII 7000�800 [7800] 0.21FeIII 270�60 0.0084CaII 13�1 [22] 0.0059ZnII 70�21 [42] 1.6
SN 1993 J 142:15 40:92 SN LLIV1 �50 70�10 Ef CIV �50>2000 L 53 127NaI �50 1.7 N 2.4 0.0012 61MgI �50 32 L 45 0.0012 53SiII �50 7900 L 1.1E4 0.32 53 �
SiIV �50 630 L 53AlII �50 200 L 290 0.094 53AlIII <32 L <45 53FeII �50 2500 L 3600 0.11 53 �
CaII �53 9.9 N 14 0.0065 61ZnII �50 50�15 L 72�24 1.6 53
PG 0804+761 138:28 31:03 QSO LLIV �58 35�1 Ef H2 �55 5100�3800 L 1.5E4�1.1E4 123NI �55 1.8E4�7.1E3 L 5.2E4�2.1E4 0.55 123NII �55 2500�1200 L 7100�3400 0.076 123OI �55 2.6E5�1.5E5 L 7.6E5�4.2E5 1.0 123SiII �55 4800�1700 L 1.4E4�4.9E3 0.39 123PII �55 160�50 L 470�130 1.3 123ArI �55 400�60 L 1200�200 0.32 123FeII �55 2400�300 L 7000�800 0.21 123FeIII �55 93�22 L 270�60 0.0084 123

58
IonAbundancesin
HVCsandIV
Cs
Probe l b d z type Cld vHI NHI tel ion vion Nion code Aion Aref A/A
�
D? Ref Note
� � kpc kpc km=s 1018 cm�2 km=s 1011 cm�2 10�9 10�9
(1) (2) (3) (4) (5) (6) (7) (8) (9) (10) (11) (12) (13) (14) (15) (16) (17) (18) (19) (20)
PG 0832+675 147:75 35:01 8:1 a 4:6 PAGB LLIV �55 92�2 Ef CaII �57 13 L 14 0.0062 U 94PG 0859+593 156:93 39:74 4:0�1.0 a 2:6 HB LLIV3 �52 53�3 WE MgII �50 >400 N >750 >0.020 U 87PG 0833+698 145:00 34:50 3:4 a 1:9 PAGB LLIV �75 24�0.8 Ef CaII �67 2.9 L 12 0.0056 U 94
�37 77�1 Ef CaII �45 1.9 L 2.5 0.0011 U 94PG 1008+689 141:27 42:29 1:8�0.2 s 1:2 HB LLIV1�45a 34�0.6 Ef CaII �51 4.6 L 13 0.0062 U 94
�45b 24�0.6 Ef CaII �41 3.2 L 13 0.0062 U 94SA 12 391 156:95 40:28 1:5�0.2 s 0:97 A0V LLIV3 �52 88�2 Ef CaII <2.3 W <2.6 33BD +67 598 146:34 40:62 0:90�0.10 s 0:59 A0V LLIV1 �54 88�2 Dw CaII <0.93 W <1.1 l 61 128PG 0906+597 156:22 40:56 0:70�0.20 a 0:46 sdB LLIV3 �50 110�5 WE MgII <12 N <11 L 87HD 68164 154:62 33:45 0:35�0.13 p 0:19 B9V LLIV4 �50 78�1 Dw CaII <1.0 W <1.3 80 V
LLIV Arch extension < 0:9 < 0:6 NaI 4.2 0.0020 1Z�
MgII >1500 [14000] >0.040SiII >730 [19000] >0.021CaII 14�3 [22] 0.0064TiII 9.5 [21] 0.11
Mrk 106 161:14 42:88 Sey LLIVe �39 26�3 WE MgII �40 >400 N >1500 >0.040 87HDE 233622 168:17 44:23 4:4�0.6 t 3:1 B1.5V LLIVe �40 32�0.7 Ef NaI <0.16 W <0.51 94 129
SiII �44 >230 N >730 >0.021 U 50 sCaII �44 4.4 L 14 0.0063 U 94TiII �42 3.0 N 9.5 0.11 U 72
�62 <5.0 Dw CaII �62 1.4 L >28 >0.013 U 94HDE 237844 158:60 47:06 2:4�0.4 t 1:8 B3V LLIVe �40 20�0.9 Ef NaI <0.12 W <0.61 94 129
CaII �47 3.5 L 17 0.0079 U 94HD 77770 169:30 41:88 1:2�0.3 t 0:80 B2IV LLIVe �38 31�1 Dw NaI �37 1.3 N 4.2 0.0020 U 80 4
CaII �37 4.2 N 14 0.0062 U 80HD 83206 167:70 46:93 0:90�0.20 t 0:66 B3V LLIVe �40 16�0.6 Ef ( NaI <0.025 L <0.16 107) 12
CaII �34:2 1.4 L 9.1 0.0042 U 107
Complex K < 6:8 < 4:5 NaI 20�15 0.0098MgII >0 [14000] >0SII <3.7E4 [19000] <2.0CaII 89 [22] 0.041
Mrk 501 63:60 38:86 BL Lac K �83 5.6�0.7 Ef SII <2000 N <3.6E4 125CaII �80 5.0 W 89 0.041 70
B2 1607+26 44:17 46:20 radio K �60 10�0.3 Ar HI <5.3 � T
s
>80 39 TM 13 II-67 59:06 40:97 6:8 g 4:5 K2Ib K �69 18�3 JD NaI �69 7.9�3.8 L 45�23 0.022 U 88M 13 III-73 58:96 40:96 6:8 g 4:5 K (�68) <6.0 JD NaI <0.50 L 88M 13 II-34 59:06 40:94 6:8 g 4:5 K �70 10�3 JD NaI <0.50 L <5.0 88M 13 III-33 58:97 40:93 6:8 g 4:5 B2p K (�65) <6.0 JD MgII >0 N >0 >0 U 15(Barnard 29) CaII 11�3 L >190 >0.085 U 88M 13 L 598 58:99 40:91 6:8 g 4:5 K �68 18�3 JD NaI �69 2.5�0.7 L 14�5 0.0069 U 88M 13 III-56 58:97 40:91 6:8 g 4:5 K (�68) <6.0 JD NaI <0.40 L 88M 13 L 629 59:00 40:90 6:8 g 4:5 K �70 18�3 JD NaI <0.50 L <2.8 88M 13 V-15 58:98 40:89 6:8 g 4:5 K �70 13�3 JD NaI <0.63 L <5.0 88M 13 I-48 59:04 40:88 6:8 g 4:5 K0Ib K �72 10�3 JD NaI �72 1.3�0.4 L 13�5 0.0062 U 88M 13 IV-25 58:94 40:87 6:8 g 4:4 K (�68) <6.0 JD NaI <0.50 L 88PG 1722+286 51:71 30:57 0:90�0.20 a 0:46 sdOB K �84 15�2 ef NaI <4.0 L <27 62
CaII <5.0 L <33 62

59
Probe l b d z type Cld vHI NHI tel ion vion Nion code Aion Aref A/A
�
D? Ref Note
� � kpc kpc km=s 1018 cm�2 km=s 1011 cm�2 10�9 10�9
(1) (2) (3) (4) (5) (6) (7) (8) (9) (10) (11) (12) (13) (14) (15) (16) (17) (18) (19) (20)
PP Arch < 1:1 < 0:9 0.5Z�
HD 215733 85:16 �36:35 2:7�0.4 s 1:6 B1II PP �92 2.8�0.7 GB CII* �93 11�9 L 390�350 0.0011 U 90 130SiII �93 110�8 L 3900�1000 0.11 U 90SII �93 87�26 L 3100�1200 0.17 U 90CaII �93 0.36�0.05 L 13�4 0.0059 U 90FeII �93 51�1 L 1800�500 0.057 U 90
�56 78�0.7 GB CII* �56 340�50 L 440�70 0.0012 U 90 131CIV �66:0 14�8 L 90MgII �56 1800�400 L 2300�500 0.062 U 90 114SiII �56 4800�700 L 6200�900 0.17 U 90SII �56 4600�300 L 5900�400 0.32 U 90CaII �56 6.5�1.5 L 8.3�1.9 0.0038 U 90CrII �56 27�5 L 35�6 0.072 U 90MnII �56 13�3 L 17�4 0.051 U 90FeII �56 1400�100 L 1900�200 0.057 U 90ZnII �56 7.9�1.5 L 10�2 0.23 U 90
�43 20�0.7 GB CI �43 47�6 L 240�30 .00068 U 90 131CI* �43 14�6 L 71�29 .00020 U 90CI** �43 6.3�4.7 L 32�24 000091 U 90CII* �43 480�70 L 2500�400 0.0069 U 90CII* �43 480�70 L 2500�400 0.0069 U 90CIV �38:9 370�40 L 90MgI �43 5.9�2.8 L 30�14 .00079 U 90MgII �43 1900�1000 L 9500�5100 0.25 U 90 114SiII �43 5200�1000 L 2.7E4�5.1E3 0.76 U 90SiIV �38:9 66�12 L 90SII �43 4300�600 L 2.2E4�3.1E3 1.2 U 90CaII �43 10�2 L 51�12 0.023 U 90TiII �45 4.3�2.0 N 22�10 0.26 U 16CrII �43 35�7 L 180�40 0.37 U 90MnII �43 17�4 L 87�18 0.26 U 90FeII �43 1700�200 L 8900�1300 0.28 U 90ZnII �43 8.3�1.5 L 43�8 0.95 U 90
PG 0039+048 118:59 �57:64 1:1�0.4 a 0:93 sdB PP �47 110�10 Ef NaI �47 18 W 16 0.0079 U 62
Southern IVCsHD 203699 65:64 �24:92 0:80�0.10 t 0:34 B2.5IVn �30 37�5 Ef CaII �42 2.0 N 5.5 0.0025 U 58PG 0039+134 119:54 �49:05 1:7�0.4 a 1:3 He-sdO �46 23�3 ef NaI <11 N <49 623C 33 129:45 �49:31 Sey �43 15�0.4 Ar HI <17 � T
s
>350 39 T3C 41 131:38 �29:07 radio �53 40�0.4 Ar HI <14 � T
s
>450 39 THD 14633 140:78 �18:20 2:5�0.2 t 0:78 O8.5V �82 7.7�1.2 Dw NaI <0.020 L <0.26 107
CaII �77:0 0.41 L 5.3 0.0024 U 107NaI <0.025 L <0.33 107CaII �72:5 0.74 L 9.6 0.0044 U 107NaI <0.025 L <0.33 107CaII �63:8 2.2 L 29 0.013 U 107
HD 16581 169:69 �51:41 0:30 p 0:23 B9V �64 2.3�0.5 Ef CaII <5.0 N <220 58TiII <1.7 N <74 58

60
IonAbundancesin
HVCsandIV
Cs
Probe l b d z type Cld vHI NHI tel ion vion Nion code Aion Aref A/A
�
D? Ref Note
� � kpc kpc km=s 1018 cm�2 km=s 1011 cm�2 10�9 10�9
(1) (2) (3) (4) (5) (6) (7) (8) (9) (10) (11) (12) (13) (14) (15) (16) (17) (18) (19) (20)
Complex gp < 4:3 < 2:0 NaI 20 0.0098
> 0:8 > 0:3 KI 4.9 0.036SiII >0 [19000] >0SII 1.6E4�8.2E3 [19000] 0.88CaII 38 [22] 0.018FeII >0 [7800] >0
Mrk 509 35:97 �29:86 Sey +60 25�1 Ef NaI +62:9 2.6�0.5 L 10�2 0.0051 13 98SiII +59 >0 N >0 >0 13SII +60 4000�2000 N 1.6E4�8.2E3 0.88 120 132CaII +59 18�3 L 74�14 0.034 25 133FeII +59 >0 N >0 >0 13
M 15 65:01 �27:31 10 g 4:6 GC +69 47�0.8 Ef NaI +68 6.0�0.7 W 13�1 0.0063 U 8 VCaII +61 32�4 W 69�10 0.031 U 8
M 15 IV-38 65:00 �27:33 10 g 4:6 AGB +69 49�1 Ef( NaI +60 7.5 W 15 0.0075 U 4) 134,V( NaI +59 11 W 22 0.011 U 41)
NaI +67 9.6 W 20 0.0096 U 102KI <0.40 L <0.82 102
M 15 K 027 64:89 �27:28 10 g 4:6 HB +70 54�1 Ef CaII +59 14�9 W 27�17 0.012 U 108 134,VM 15 K 048 65:01 �27:31 10 g 4:6 HB +69 50�1 Ef CaII +69 25�16 W 51�33 0.023 U 108 134,VM 15 K 064 64:97 �27:27 10 g 4:6 HB +70 53�1 Ef CaII +64 28�18 W 53�33 0.024 U 108 134,VM 15 K 080 65:01 �27:31 10 g 4:6 HB +69 47�1 Ef CaII +57 9.4�9.7 W 20�21 0.0091 U 108 134,VM 15 K 084 65:01 �27:31 10 g 4:6 HB +69 47�1 Ef CaII +60 6.4�7.2 W 14�15 0.0062 U 108 134,VM 15 K 127 64:89 �27:36 10 g 4:6 HB +69 44�1 Ef CaII +65 11�8 W 25�19 0.011 U 108 134,VM 15 K 143 65:00 �27:28 10 g 4:6 HB +70 51�1 Ef CaII +61 13�9 W 25�17 0.011 U 108 134,VM 15 K 144 = II-75 65:00 �27:27 10 g 4:6 AGB +70 51�1 Ef( NaI +61 16 W 31 0.015 U 4) 134,V
( NaI +58 21 W 40 0.020 U 41)NaI +67 20 W 38 0.019 U 102KI +68 2.5 L 4.9 0.036 U 102
M 15 K 154 = III-9 64:98 �27:29 10 g 4:6 HB +70 52�1 Ef CaII +66 41�37 W 79�73 0.036 U 108 134,VM 15 K 239 65:02 �27:28 10 g 4:6 HB +69 48�1 Ef CaII +63 21�11 W 43�24 0.020 U 108 134,VM 15 K 258 65:01 �27:29 10 g 4:6 HB +69 50�1 Ef CaII +80 14�9 W 29�19 0.013 U 108 134,VM 15 K 267 65:02 �27:31 10 g 4:6 HB +69 50�1 Ef CaII +80 9.4�8.0 W 19�16 0.0086 U 108 134,VM 15 K 341 65:05 �27:27 10 g 4:6 HB +68 42�1 Ef NaI +56 8.6 W 20 0.0100 U 41 134,VM 15 K 996 65:05 �27:33 10 g 4:6 HB +69 46�1 Ef NaI +70 12�4 W 26�9 0.013 U 25 134,V
CaII +69 20 L 44 0.020 U 25M 15 N1 65:01 �27:31 10 g 4:6 +69 50�1 Ef CaII +63 14�9 W 29�19 0.013 U 108 134,VM 15 S1 64:91 �27:18 10 g 4:6 +70 54�1 Ef NaI +54 8.1 W 15 0.0074 U 41 134,VM 15 S4 65:01 �27:31 10 g 4:6 +69 50�1 Ef NaI +57 5.5 W 11 0.0055 U 41 134,VM 15 S7 64:93 �27:37 10 g 4:6 +69 44�1 Ef NaI +59 9.7 W 22 0.011 U 41 134,VM 15 S8 65:02 �27:31 10 g 4:6 +69 50�1 Ef NaI +56 7.1 W 14 0.0070 U 41 134,VM 15 NW core 65:01 �27:31 10 g 4:6 +69 50�1 Ef NaI +68 5.0 N 10 0.0049 U 111 134,135M 15 SE core 65:01 �27:31 10 g 4:6 +69 50�1 Ef NaI +68 >80 N >160 >0.079 U 111 134,135HD 203664 61:93 �27:46 4:3�0.4 t 2:0 B0.5III +65 2.2�0.4 JB( NaI +70 1.7 N 77 0.038 U 65)
( CaII +81 9.0 N 410 0.19 U 58)( CaII +69 5.0 N 230 0.10 U 65)( CaII +70 10 L 450 0.21 U 102)
+65a 1.1 JB NaI +80:2 1.4�0.07 N 120�6 0.059 U 82CaII +80:0 5.0�0.5 N 440�40 0.20 U 82
+65b 0.53 JB NaI +75:2 0.16�0.06 N 30�11 0.015 U 82CaII +75:2 2.4�0.4 N 450�80 0.20 U 82
+65c 0.53 JB NaI <0.25 N <47 82CaII +69:8 2.4�0.6 N 440�110 0.20 U 82
HD 203699 65:53 �24:92 0:80�0.10 t 0:34 B2.5IV +76 10�1 Ef( CaII <1.4 W <13 65)CaII <0.40 L <3.8 l 102
HD 205556 60:02 �32:62 0:40�0.10 s 0:22 B9V +57 2.1�0.6 JB CaII <1.4 W <67 65

61
Probe l b d z type Cld vHI NHI tel ion vion Nion code Aion Aref A/A
�
D? Ref Note
� � kpc kpc km=s 1018 cm�2 km=s 1011 cm�2 10�9 10�9
(1) (2) (3) (4) (5) (6) (7) (8) (9) (10) (11) (12) (13) (14) (15) (16) (17) (18) (19) (20)
Other Negative-Velocity IVCsHD 137569 21:87 51:93 0:60�0.30 t 0:47 B5IIIp (�43) <4.0 GB CaII �43 1.7 N >42 >0.019 U 58SN 1981 D 240:21 �56:70 SN �35 6.6�3.0 PM CaII �43 6.2 L 93 0.043 25 136NGC 3783 287:46 22:95 Sey NaI �39 7.0 N 22
CaII �39 14�2 N 22HD 101274 287:47 22:94 0:40�0.03s 0:16 A0V CaII �48 10 L U 25Mistaken claimsM 3 vZ1128 42:50 78:68 9:7 g 9:5 PAGB K (�70) <3.0 Dw CII �70 >1000 N >3.3E4 >0.094 U 17 137HD 83206 167:70 46:93 0:90�0.20 t 0:66 B3V (�80) <2.0 Ef ( NaI <0.24 W 94) 12,13,W
NaI <0.025 L 107( CaII �80 0.58 L >29 >0.013 U 94)
CaII �79:8 0.42 L >21 >0.0095 U 107
Other Positive-Velocity IVCsV421 Her 64:84 31:60 5:5�0.6 s 2:9 RR Lyr +61 2.9�0.6 Dw CaII <5.4 N <190 70HD 156110 70:99 35:71 0:72�0.33p 0:42 B3Vn +43 12�4 Dw SiII <230 N <1900 50 sPG 1710+490 75:43 36:08 0:70�0.30a 0:41 sdB +43 7.1�0.9 Dw NaI +43 1.7 W 23 0.011 U 62
CaII +43 2.6 W 37 0.017 U 62PG 1213+456 141:93 70:44 2:9�0.7 a 2:7 sdB +51 3.8�0.4 JB CaII <11 N <290 93SN 1998 S 150:75 65:96 SN (+48) <3.0 Ef FeII +47:8 190�20 L >6200 >0.19 117PG 0229+064 162:56 �48:29 0:70�0.30s 0:52 sdB (+82) <3.0 Ef NaI +82 2.9 W >98 >0.048 U 62 WBD +38 2182 182:16 62:21 4:0 a 3:5 B3V +38 2.4�0.04 JB CaII <0.23 W <9.6 93 VHD 93521 183:14 62:15 1:9 t 1:7 O9.5V +38 3.0�0.1 JB SiII <6.9 S <230 l 56
CaII <0.23 W <7.7 93HD 100340 258:85 61:23 3:0 a 2:6 B1V +45 4.8�0.3 GB NaI <0.20 L <4.2 113
+73 <1.5 GB( CaII +73 1.5 N >100 >0.046 U 58)CaII +77 1.7 L >120 >0.053 U 113
NGC 2808 282:19 �11:25 8:9 g 1:7 GC WW339 +76 124�1 PM CaII <5.9 W <4.8 8NGC 3783 287:46 22:95 Sey ( CaII +52 13 L 25)
CaII +64 18�2 N 22HD 86248 264:59 18:11 7:6�1.7 t 2:4 B3II CaII 6.4�1.0 N U 54HD 101274 287:47 22:94 0:40�0.03s 0:16 A0V +60 103�0.5 PM CaII +37 10 L 9.7 0.0044 U 25SN 1986 G 309:54 19:40 SN CaII +97 1.9 N 31SN 1983 N 314:54 31:95 SN +30 8.0�3.0 Dw( CaII +43 6.3 N 79 0.036 20)
CaII +42 4.1 L 51 0.023 25
ii

62 Ion Abundances in HVCs and IVCs
TABLE 3
Solar and Halo Ion Abundances
ion logA
�
A
�
log�
a
�
a
A(halo) IP
b
IP
[ppb] [ppb] (produce) (destroy)
C I �3.45 350000 �3.15 0.0007
c
240�280
c
11.26
C II �3.45 350000 �0.41 0.39
a
140000 11.26 24.38
C IV �3.45 350000 (N=1.6�10
14
)
d
47.89 64.49
N I �4.03 93000 �0.07 0.85
a
79000 14.53
N II �4.03 93000 �1.20 0.068
c
5500�7100
c
14.53 29,60
N V �4.03 93000 (N=3.5�10
13
)
d
77.47 97.89
O I �3.13 740000 0.00 1.0
a
740000 13.62
O VI �3.13 740000 (N=2.0�10
14
)
d
113.90 138.12
Na I �5.69 2000 �2.30 0.005
a
1.2�240
c
5.14
Mg I �4.42 38000 �2.50 0.003
c
6.6�390
c
7.65
Mg II �4.42 38000 �0.42 0.38
a
14000 7.65 15.04
Al II �5.52 3000 �0.27 0.53
a
1600 5.99 18.83
Al III �5.52 3000 (N=3.3�10
12
)
d
18.83 28.45
Si II �4.45 35000 �0.27 0.53
a
19000 8.15 16.35
Si III �4.45 35000 �1.00 0.1
a
3500 16.35 33.49
Si IV �4.45 35000 (N=4.4�10
13
)
d
33.49 45.14
P II �6.43 370 0.00 1.0
a
370 10.49 19.73
S II �4.73 19000 0.00 1.0
a
19000 10.36 23.33
S III �4.73 19000 �1.00 0.1
c
590�3500
c
23.33 34.83
Cl II �6.73 190 12.97 23.81
Ar I �5.44 3600 �0.48 0.33
a
1200 15.76
K I �6.87 135 �1.40 0.04
c
<0.8�>9.2
c
4.34
Ca I �5.66 2200 �3.30 0.0005
c
<0.05�>1.7
c
6.11
Ca II �5.66 2200 �2.00 0.01
c
2.5�570
c
6.11 11.87
Ti II �7.07 85 �0.45 0.35
c
30 6.82 13.58
Cr II �6.32 480 �0.50 0.32
a
150 6.77 16.50
Mn II �6.47 340 �0.59 0.26
a
87 7.44 15.64
Fe II �4.49 32000 �0.62 0.24
a
7800 7.79 16.18
Fe III �4.49 32000 �1.50 0.03
c
270�>2900
c
16.18 30.65
Zn II �7.35 45 �0.03 0.93
a
42 9.39 17.96
NOTE.|a: � is the product of depletion onto dust and ionization fraction typical for
halo gas, as derived by Savage & Sembach (1996a); b: IP stands for Ionization Potential;
c: value derived in this paper; for non-dominant ions a range is given for the abundances,
and an average for the value of �. d: average column density toward the galactic pole,
from Sembach & Savage (1992) and Savage et al. (2000b).
1

63
TABLE 4
Summary of distances and abundances
cloud distance z-height mass abundance A(Ca II) depletion pattern
(kpc) (kpc) M
�
(rel. to solar) (ppb)
HVCs
complex A 4.0{9.9 2.6{6.8 0.3{2�10
6
0.02{0.4 19�5 halo??
core IV4 0.6{0.8(1.8)
a
0.5{0.7(1.7)
a
1.5{2.5(13)�10
3
�1 3.3�0.9 warm disk
cloud MII/MIII <4.0 <3.5 <6�10
4
complex C >1.2(>6.1)
b
>0.8(>4.3)
b
>10
5
(>3�10
6
) 0.089�0.024
+0:020
�0:005
17�5
c
halo?
G >1.3 >5�10
4
H >5.0 >10
6
AC Shell (>1.5)
d
>2�10
5
cloud ACI (>0.4) >1�10
3
cloud ACII (>0.3) >5�10
2
Cohen Stream >0.3 >0.2 >3�10
2
cloud WW507 >0.3 >0.2 >4�10
2
complex GP >0.3 >0.1 >10
3
Mag. Str. (tail) >1.5�10
8e
0.33�0.05 27�2 warm disk { halo
Mag. Str. (leading arm) >5�10
7f
0.25�0.08 69�10 warm disk { halo
complex L >0.2 >0.1 >20
complex WB (WW225) (280�120)
g
complex WE <12.8 <3.2 <2.5�10
5
HVC100{7+110 <1.3 <0.2 <1 �1? halo?
IVCs
Upper IV Arch 0.8{1.8(0.8)
h
0.7{1.7(0.7)
h
1{4.5(1)�10
5
�1 20�9
i
Lower IV Arch l>150 0.4{1.9 0.4{1.7 0.4{7.0�10
5
�1 22�16 halo
Lower IV Arch l<150
j
(0.5{0.9) (0.4{0.8) 0.4{1.2�10
5
23�13
IV spur 0.3{2.1 0.3{2.1 0.2{8�10
5
22
LLIV Arch 0.9{1.8(0.9)
k
0.6{1.2(0.6)
k
1.5{6(1.5)�10
5
1.0�0.5 13�1 warm disk
complex K <6.8 <4.5 <7.5�10
5
<2.0 (89)
l
Pegasus-Pisces Arch <1.1 <0.9 <0.5�10
5
0.54�0.04 24�10 halo
complex gp 0.8{4.3 0.3{2.0 0.1{3�10
5
1{2 38�17
NOTE.|a: The value in parentheses is valid if the distance to BD+49 2137 is 1.8 kpc, rather than 0.8 kpc (see text). b: The value in
parentheses is from the weak limit toward BS 16034-0114. c: Average of components seen toward Mrk 290 and PG1351+640. d: This limit
requires that the Ca II abundance is >20 ppb. e: Mass excludes the bridge region (b>{45
�
) near the Magellanic Clouds, and assumes
a distance of 50 kpc. f: Mass of population EP clouds, assuming a distance of 50 kpc. g: From PKS0837�12, where N(H I) is low, so
that A(Ca II) tends to be high. h: The upper limit (1.8 or 0.8 kpc) depends on the distance to BD+49 2137. i: Average does not include
4.3 ppb toward BD+49 2137 and 150 ppb toward BTDra. j: Excluding IV21, using the lower distance for PG1255+546 and the higher
distance for HDE233791. k: The upper limit depends on whether the gas probed by HD77770 (d=1.2kpc) and HD83206 (d=0.9kpc) is
part of the LLIV Arch or not. l. From Mrk 501, where N(H I) is low, so that A(Ca II) tends to be high.
1

64 Ion Abundances in HVCs and IVCs
Figure 1. Scatter plots of [N(ion)/N(H I)] vs N(H I) for the ions for which multiple determinations exist in a single cloud. Circlesindicate actual measurements, triangles show lower limits. Closed symbols show measurements where both the H I and the ioncolumn density were carefully measured. Open symbols refer to measurements where only the equivalent width was given, or wherethe H I data were interpolated (in the case of LMC stars). Note that three Ca II limits in the IV Arch and one in complex gp areoff-scale. Most of the scatter at high N(H I) may be due to fine structure in N(H I), or to variations in depletion/ionization fraction.The scatter at low N(H I) is probably due to the ionization of hydrogen in the case of Mg II, or to low dust content in the case ofCa II (see Wakker & Mathis 2000).

65
Figure 2. Correlations for Na I and Ca II. a), b): log N(Na I) and log N(Ca II) vs log N(H I). The straight line in panel a showsthe relation claimed by Ferlet et al. (1985). The dotted line indicates the 1σ spread in that relation. c), d) log A(Na I) and logA(Ca II) vs vLSR; A(Ca II) appears to be higher in positive-velocity clouds, but this may be biased by the fact that many of thesedirections have low N(H I). e, f) ratio of A(Ca II) and A(Na I) vs vLSR, showing that above |vLSR|=50 kms−1 there is no obviousRoutly-Spitzer effect.

66 Ion Abundances in HVCs and IVCs
Figure 3. Abundance (i.e. N(ion)/N(H I)) patterns in 18 selected HVCs/IVCs where multiple elements have been measured. Theelements are ordered in terms of decreasing reference abundance in halo gas. The dotted lines shows the patterns for cool disk,warm disk and halo gas (Savage & Sembach 1996a), shifted by the overall metallicity. The latter is given in parentheses afterthe cloud name and is derived from the results for undepleted elements. Note that the halo pattern was derived from the IVCsin the direction of HD93521 and HD215733. Error bars are usually smaller than the size of the dots. Closed circles show goodmeasurements. Open circles indicate only the equivalent width was published. Downward pointing open triangles indicate an upperlimit. Upward pointing closed triangles indicate lower limits.
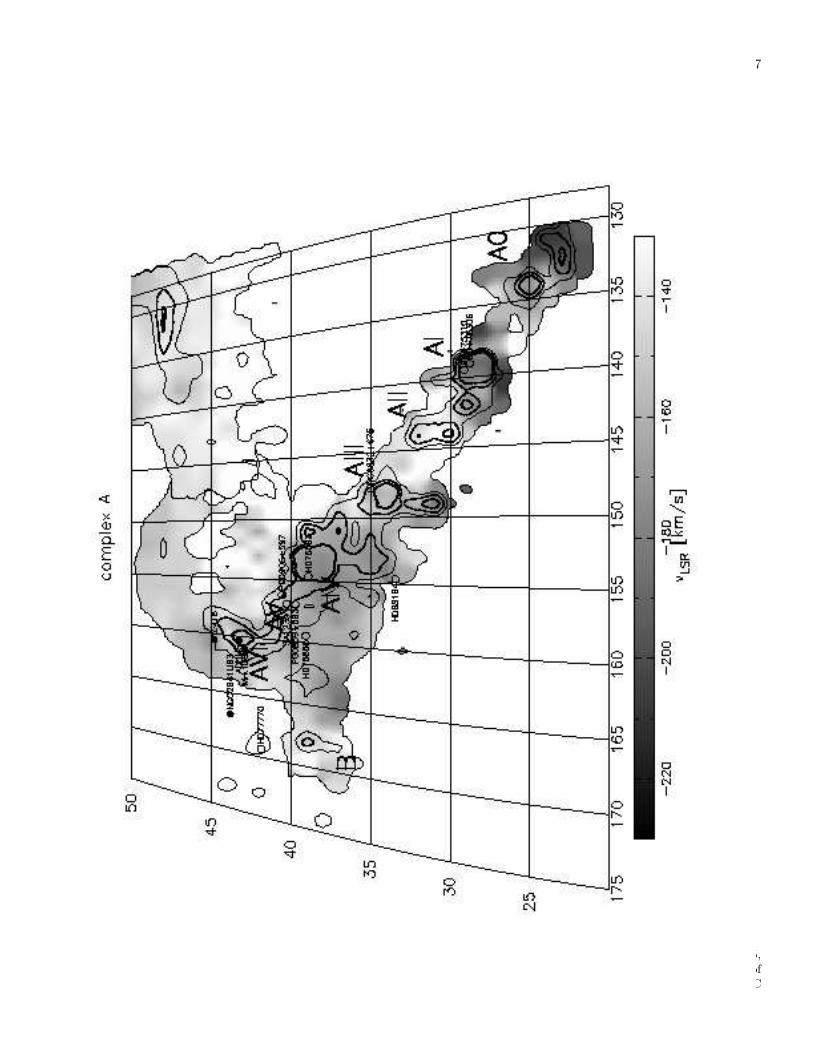
67
Figure 4. Map of HVC complex A, from Hulsbosch & Wakker (1988). Contours indicate brightness temperature levels of 0.05,0.3, 0.6 and 1K. The greyscale shows velocities, as identified by the wedge. The core names are shown, as are the positions ofprobe stars. Closed symbols refer to detections, open symbols to non-detections. The structure in the upper right corner is HVCcomplex C.

68 Ion Abundances in HVCs and IVCs
Figure 5. Map of HVC complex M, from Hulsbosch & Wakker (1988). Contours indicate brightness temperature levels of 0.05,0.3, 0.8 and 2.5K. The greyscale shows velocities, as identified by the wedge. The core names are shown, as defined by Wakker &van Woerden (1991) and Kuntz & Danly (1996). Closed symbols refer to detections, open symbols to non-detections.

69
Figure 6. Map of HVC complex C, from Hulsbosch & Wakker (1988). Contours indicate brightness temperature levels of 0.05, 0.4and 1.0K. Colors indicate velocities, as identified by the wedge. At many positions along the central ridge emission is seen at twovelocities. In these directions a half circle is shown for the second component. Core names are also given, as are the positions ofprobe stars. CI-A,B and CIII-A,B were defined by Giovanelli et al. (1973), as was CeI, which they named C-extension. CeII-V aredefined here by analogy. Giovanelli et al. (1973) also define a core CIIIC, which is named CIC here, while CIIIC is used for a corenot observed by Giovanelli et al. (1973). Complex D was defined by Wakker & van Woerden (1991), core “CD” is defined here, asis core “C/K” (see text). Closed symbols refer to detections, open symbols to non-detections.

70 Ion Abundances in HVCs and IVCs
Figure 7. Map of HVC complex H, from Hulsbosch & Wakker (1988). Contours indicate brightness temperature levels of 0.05, 0.3,0.6 and 1K. The greyscale shows velocities, as identified by the wedge. The core names are shown, as are the positions of probestars.

71
Figure 8. Map of the Anti-Center shell, from Hartmann & Burton (1997). Contours indicate column densities of 10, 40, 80and 160×1018 cm−2 for gas in the velocity range −130 to −60 kms−1. The open symbols show the positions of the probes withnon-detections. The structure at l=180◦, b=+6◦ is cloud AC0.

72 Ion Abundances in HVCs and IVCs
Figure 9. Map of the Anti-Center HVCs, from Hulsbosch & Wakker (1988). Contours indicate brightness temperature levels of0.05, 0.3, 0.8 and 1.5K. Colors indicate velocities, as identified by the wedge. At many positions along the central ridge emissionis seen at two velocities. In these directions two half circles are shown, with separate colors for each component. Core names arealso shown, as are the positions of probe stars.

73
Figure 10. Map of the Magellanic Stream, using data from Hulsbosch & Wakker (1988) and Morras et al. (2000). Added arethe clouds in populations EN and EP of Wakker & van Woerden (1991), as well as scattered small positive-velocity clouds in thenorthern Galactic hemisphere. Contour levels are at brightness temperatures of 0.05 and 1K. Colors indicate velocities as identifiedby the wedge. The projection has galactic longitude 270◦ along the middle and the LMC near the center. The thick solid linecrossing the poles represents the Galactic equator. The curved lines are the orbits of the LMC and SMC in the model of Gardiner& Noguchi (1996); the small dots are the present-day positions of the particles in that model. Labeled probes are those of theMagellanic Stream, clouds WW187, WW211 and WW487, as well as the extra-galactic objects in which Na I or Ca II absorptionis seen without associated H I (see Sect. 4.22). Filled symbols indicate detections, open symbols non-detections.

74 Ion Abundances in HVCs and IVCs
Figure 11. Map of complex WE, based on the data of Morras et al. (2000). The greyscale indicates velocities as identified by thewedge.. Contours are at brightness temperatures of 0.05 and 0.3K. The position of HD156359 is indicated.

75
Figure 12. Map of the Intermediate-Velocity Arch at velocities between −90 and −60 kms−1, from Hartmann & Burton (1997).The greyscale and contours indicate the column density in this velocity range, with contour levels at 10, 40, and 80×1018 cm−2.The names of the cores defined by Kuntz & Danly (1996) are indicated. The positions of the probes are shown, with closed circlesrepresenting detections; open circles are non-detections.

76 Ion Abundances in HVCs and IVCs
Figure 13. Map of the Intermediate-Velocity Arch at velocities between −60 and −30 kms−1, from Hartmann & Burton (1997).See further Fig. 12, except that there is an additional contour at 160×1018 cmm2.

77
Figure 14. Summary of upper and lower distance limits for the IV Arch. The x-axis shows an approximate “angle along the Arch”,with the origin at l=210◦, b=30◦. The top two panels show the distances, the bottom two the z-heights. Core names are indicated,as are the stars outside cores, for which just the beginning part of the name is shown. Three stars in the second and fourth panelare plotted at y-max, but they are more distant than that. Downward-pointing triangles are upper limits, upward-pointing trianglesare lower limits. The open triangle for MIII refers to the possible lower limit from HD93521. Diamond shapes are for the possiblealternative distance for three stars with uncertain distances (BD+49 2137 toward IV4 and IV17, HDE233791 and PG1255+546).

78 Ion Abundances in HVCs and IVCs
Figure 15. Map of the IV spur, from Hartmann & Burton (1997). Contours are at 10, 40 and 80×1018 cm−2. The core names areshown, as are the positions of probe stars. Closed symbols refer to detections, open symbols to non-detections.

79
Figure 16. Map of the Low-Latitude Intermediate-Velocity Arch, from Hartmann & Burton (1997). Contours are at 10, 40 and80×1018 cm−2. The core names are shown, as are the positions of probe stars. Closed symbols refer to detections, open symbols tonon-detections. Note that HVC complex A lies between the probes Mrk 106 and PG0804+761.

80 Ion Abundances in HVCs and IVCs
Figure 17. Map of complex K, from Hartmann & Burton (1997). Contours indicate column densities of 5, 10, and 20×1018 cm−2
for gas in the velocity range −95 to −60 km s−1. The open symbols show the positions of the probes with non-detections, closedsymbols refer to detections.

81
Figure 18. Map of southern IVCs, from Hartmann & Burton (1997). Contour levels are at 10, 40 and 80×1018 cm−2 for the gas withvelocities relative to the LSR between −85 and −45 km s−1. Closed symbols refer to detections, open symbols to non-detections.Thick solid lines outline the gas with vLSR<−85 km s−1 and are contour levels at 15 and 40×1018 cm−2. The following HVCs can beseen: the Cohen Stream and WW507 at l=160◦, b=−45◦, the Magellanic Stream (l∼80◦, b<−50◦), the VHVC near M33 (l=125◦,b=−30◦), and complex G (l=90◦, b=−15◦). The features at l=120◦, b=−20◦ and l=134◦, b=−31◦ are M31 and M33.

82 Ion Abundances in HVCs and IVCs
Figure 19. Map of the positive-intermediate-velocity gas in the region near HVC complex GP, from Hartmann & Burton (1997).The greyscale and contours show the gas with velocities between +50 and +200 kms−1, with contour levels at 5, 10, 40, and80×1018 cm−2. The positions of probes are show. Closed symbols refer to detections, open symbols to non-detections. The thickcontours show the gas with vLSR>+90 kms−1, i.e. HVC 40−15+100 (also known as the “Smith cloud”). The positions of the otherWW clouds within complex GP are also shown, with a label of the form WW#@v, where WW# is the catalogue number of Wakker& van Woerden (1991) and v the velocity in that catalogue.