Embed Size (px)
Citation preview

January | 2021
Viewpoint

1
Executive Summary
Editor’s Note: Due to no material updates to Fed policy or communication, there is no Federal Reserve
Watch Commentary this month
- An economic rebound is underway (Page 2),
The main risks to GDP growth would be a slower
vaccination rate . . . and the lingering effects of
the economic scarring.
- Bond market there are some problematic
developments: (Pages 2-3), Investment grade
and high yield/junk bond corporates are richly
priced. MBS and ABS valuations do not provide
adequate compensation. Tax exempt municipal
bonds are also richly priced and offer little value.
- Areas of opportunity in bonds (Page 3),
Taxable municipal bonds . . . provide fairly
attractive yields relative to the credit risk
assumed. Increasing global growth and a falling
dollar provide a tailwind for EM debt.
- Equity valuations are historically high (Page
3), investors should maintain target allocations for
equity as we start the year.
- We are in the process of rebalancing our
Strategic Models (Page 4), prudent risk
management dictates locking in some gains and
returning to a more neutral allocation.
- We anticipate growth above consensus
estimates . . . (Page 5), fueled by what we
anticipate being a more rapid pick up in the
second quarter.
- The 10-year Treasury yield breached the 1%
barrier (Page 9), We have begun the process of
reviewing if any extension in portfolio duration
levels . . . is warranted.
- Recent increase in market based inflationary
expectations is disturbing (Page 9). could
portend a more difficult environment going
forward.
- There are several positive factors supporting
a continuation of the new bull market (Page
11), Interest rates are low; GDP is expected to
rebound . . .; earnings are poised to grow sharply;
and, finally, stocks tend to do well in the first year
of a presidential cycle.
-There are some challenging factors (Page
11), Stocks are no longer priced at a discount to
fair value . . . global economic outlook is uncertain
. . . and coronavirus cases continue to rise.
-We recommend that investors pay close
attention to dividends (Page 11), consistent
dividend growth gives three important signals to
investors in the stock.
Asset Class Outlook
Equity Current Previous
U.S. Equity Slightly Unfavorable Slightly Unfavorable
Int’l Equity Neutral Neutral
Emer. Mkts Slightly Favorable Slightly Favorable
Real Assets Current Previous
Real Estate Slightly Unfavorable Slightly Unfavorable
Infrastructure Neutral Neutral
Commodities Slightly Favorable Slightly Favorable
Fixed Income Current Previous
Invest. Grade Credit Neutral Neutral
Treasury/Agency Unfavorable Unfavorable
Mortgage Backed Neutral Neutral
Commercial MBS Slightly Favorable Slightly Favorable
High Yield Unfavorable Slightly Unfavorable
Emer. Mkts Debt Neutral Neutral
Tax-Exempt Slightly Unfavorable Neutral
TIPS Slightly Favorable Slightly Favorable
Contact: Clay Nickel ([email protected]) Alex Jantsch ([email protected])
Market Insights & Asset Allocation Clay Nickel, CPM
2
A Glass Half Full After ringing in a new year, most are looking forward to a much brighter 2021 compared to a COVID consumed 2020. However, it is important to note that the flip of a calendar page does not magically transform realities. The first half of 2021 will look a lot like the second half of 2020 and improvements to our daily activities won’t be fully evident until the second half of the year. Yet, hope is alive as economic growth continues, corporate profitability is returning, and a vaccine should be widely available by mid-to-late summer providing for a resumption of a more normalized level of social engagement. Of course, this time of year is always rife with investment managers making predictions for the new year. While we try to avoid much of the silliness that surrounds such predictions—end point price levels of the S&P 500 or the Dow, for example, we do gather our portfolio managers and analysts for an annual strategic forum each December to discuss key themes and market conditions that may be most impactful for client portfolios. Below are some highlights from the annual Investment Management Group mind-meld. Economy An economic rebound is underway and is likely to continue through 2021. But the speed with which we achieve full recovery—GDP levels returning to 4Q2019 pre-pandemic levels—and a new expansion beyond that previous peak is dependent on arresting the holiday enabled surge in contagion and the vaccination roll-out. The main risks to GDP growth would be a slower than anticipated vaccination rate that delays achievement of herd immunity and the lingering effects of the economic scarring we’ve often mentioned in these Viewpoints. With a second round of mitigation protocols in response to the early winter surge in COVID-19 cases, and the sheer length of time many workers have now been unemployed/under-employed, and many businesses shuttered or operating at reduced capacity, the scarring impact has increased. This means that the return of GDP to previous high-water marks is being pushed back. Publicly traded corporations, like all businesses, adapt rapidly to recapture and increase profits, so investment market returns won’t necessarily correlate to economic growth, but a slower growing economy does make profits harder to come by. Inflation is likely to remain muted but should increase slightly from 2020 levels. Federal Reserve policy may be tweaked but will remain highly accommodative through 2021 and the Fed will stand ready to step in if significant financial systems dislocations arise. Fixed Income We anticipate that market-based interest rates will increase, mostly through curve steepening (longer dated rates rising more than rates for shorter term maturities). It is important to note that interest rate increases have already begun since our mid-December meeting, so some of the move has already gained traction, but expect a continued, jagged, drift higher. However, even these anticipated rate increases are likely to be muted by historical standards—it is difficult to envision a 10-year Treasury rate exceeding and remaining above 1.5% during the calendar year. As we survey the broader bond market there are some problematic developments: 1) Credit, specifically investment grade and high yield/junk bond corporates, are richly priced.
Since there are few options available for income seeking investors, however, we would

Market Insights & Asset Allocation Clay Nickel, CPM
3
advocate remaining invested in investment grade for the time being. But should spreads tighten further, reducing exposure to credit would be warranted. High yield bonds currently provide no margin of safety. Relative yield spreads are historically tight, and the fundamental backdrop indicates a default rate between 6.5% and 9% in the months to come. Corporate borrowers, who have largely avoided widespread defaults commensurate with the deep economic decline, are heavily indebted and highly leveraged. If corporate rates increase sufficiently, a number of borrowers could come under stress, with downgrades and potential defaults driving bond prices quickly lower. Being mindful of risk, with the willingness to quickly exit credit markets if pricing becomes extremely rich, is necessary.
2) Mortgage backed (MBS) and asset backed (ABS) bond valuations do not provide adequate
compensation for the potential risks. We give some deference to commercial mortgage bonds (CMBS) but even these valuations are becoming rich.
3) Tax exempt municipal bonds are also richly priced and offer little value. Additionally, many states and local authorities, whose budgets lag the economic cycle, are at risk of significant financial stress without a federal support package. Given the current fundamentals, and absent federal aid, we would anticipate a raft of ratings downgrades in 2021.
But there are some areas of opportunity in bonds, even in this low rate environment. 1) Taxable municipal bonds, largely as a replacement for corporate credit, provide fairly attractive
yields relative to the credit risk assumed.
2) As a result of the yield starved and richly priced U.S. market, we are increasingly looking overseas for fixed income opportunities, with an eye towards emerging market sovereign and corporate bonds. It is important that investors only partially allocate funds to emerging market bonds and that they utilize actively managed fund options in the asset class given the unique risks emerging market debt involves. From a macro-economic picture, increasing global growth and a falling dollar provide a tailwind for emerging market debt.
Equity Broadly, equity valuations are historically high, for U.S. large cap stocks in particular. Valuations indicate muted returns compared to historical averages. The higher valuations also increase the risk of sizable, short-term market corrections. At the same time, anticipations for continued fiscal stimulus and the highly accommodative Federal Reserve provide support for equity prices. Additionally, we anticipate that there are significant idle funds on the sidelines that may continue to flow into risk assets. On balance, investors should maintain target allocations for equity as we start the year. Within the equity market, rotations have begun from large-cap technology and “stay at home” stocks into more cyclically oriented small company shares that should benefit from a re-opening and economic acceleration. Along these lines there is also a rotation to non-U.S. stocks—more cyclically oriented and benefiting from a falling U.S. dollar—and, while not as pronounced, from growth stocks to value stocks. We anticipate that these themes are not just a flash in the pan and outperformance of small caps, cyclical/value stocks, and international—particularly emerging market equity—should continue through 2021 and possibly beyond. This is also the type of environment where astute “stock picking” via active portfolio management more easily outperforms passive, index style investing.

Market Insights & Asset Allocation Clay Nickel, CPM
4
Real Assets The backdrop of accelerating economic growth, increasing inflation, and low interest rate environment is favorable for real assets, which we define as real estate, commodities, and infrastructure. We have a favorable fundamental outlook for mid-stream energy infrastructure, global infrastructure, and commodities. Although investment in commodities is somewhat problematic given the investment vehicles available to most investors. Real estate valuations are historically low and would indicate a favorable buying opportunity, however, the fallout from COVID-19 and the potential for a dramatic change in work environs and consumer habits increases the risk to the asset class. Active fund management for real estate is advised, and we recommend keeping allocations modest until there is further clarity on work and consumer behavior post-pandemic. A Quick Word on Political Impacts for Markets First, the events at the Capitol building Wednesday afternoon and evening, while astounding and disheartening, do not change policy realities or electoral outcomes. Risk assets, already strongly advancing the first part of the day, did stumble upon news of a Capitol breach but most stock indexes still finished higher for the day. Thursday morning pre-market futures are also higher, indicating that market participants are taking the temporary unrest in stride. Prior to the disappointing events of Wednesday, all eyes had been on the Georgia Senate run-off and the probability that both seats were won by democratic candidates. The outcome ties the Senate at 50/50 with Vice President Elect Harris casting a tie breaking vote, effectively giving democrats control of the White House, Senate, and House—a delayed “blue wave” of sorts. Market participants were optimistic, bidding up stocks and driving rates higher in anticipation of another stimulus package in February or March, but with a slim margin of control that would likely prevent passage of the most aggressive portions of a progressive agenda due to a handful of moderate democratic senators. Or at least that was the narrative. It does beg the question if market participants are in a state of mind where nothing is a problem and all news is good news— “Divided government? That’s good for stocks!” “Blue wave? Well that means more stimulus, and…that’s good for stocks!” Current Portfolio Positioning We are in the process of rebalancing our Strategic Models. Having largely taken no action in the face of steadily advancing stock prices, those gains have pushed most client accounts beyond target allocations for risk assets. While the market’s happy feelings may continue, prudent risk management dictates locking in some gains and returning to a more neutral allocation.

Economic Indicators Clay Nickel, CPM
5
Current Economic Snapshot
Quarterly & Fiscal Year GDP Growth (Average Annual)
Source 4Q20
(Forecast) FY20
(Forecast) 1Q21
(Forecast) 2Q21
(Forecast) FY21
(Forecast)
Bloomberg 4.6% -3.5% 2.5% 3.6% 3.9%
AWM/IMG 4.0% -3.5% 2.0% 5.0% 4.4%
Sources: Bloomberg, Bureau of Economic Analysis; Methodology: Average Annual Return
Investment Management Group’s Recession Indicators Indicator* Current Previous Short Term Trend Long Term Trend
CB Leading Econ. Indicators -2.2% -2.9% Positive Negative 3–Mon./10–YR. Yield Curve Spread +0.77% +0.77% Positive Positive
New Orders–to–Inventories 16.3 13.9 Neutral Positive
Cap. Goods New Orders +7.4% +5.5% Positive Positive
Initial Jobless Claims 712k 751k Neutral Negative
New Building Permits 1,639k 1,553k Positive Positive Sources: Bloomberg *See the Appendix for description of each indicator
We have updated our GDP growth estimates to include the full year 2021 forecast. As shown, we anticipate growth above consensus estimates fueled partly by what we anticipate being a more rapid pick up in the second quarter. Vaccination roll-out glitches should be corrected soon, and wider uptake of more vaccine options should help accelerate a resumption of activity. But it is important to note that economic growth is still beholden to the virus, and now vaccine, dynamics.
As a result, we have begun monitoring vaccination rates in addition to ongoing tracking of contagion rates, hospitalization rates, mobility/engagement, and short-term economic indexes. Epidemiologists estimate that herd immunity can be achieved once 70%-80% of the population has been vaccinated. Obviously, there is much ground to cover. Bloomberg News’ vaccination tracking is as comprehensive and current as any we’ve yet seen and their interactive website can be found here: https://www.bloomberg.com/graphics/covid-vaccine-tracker-global-distribution/
The Global Vaccination Campaign
Source: Bloomberg News

Economic Indicators Clay Nickel, CPM
6
We continue to see rising hospitalization rates. As such, mitigation protocols (a.k.a. “lockdowns”) are likely to continue in some form. Mobility data dropped, but that is as indicative of holiday effects as consumer sentiment and work-from-home factors.
COVID-19 Hospitalization Rates
Source: Bloomberg; Copyright 2021 Bloomberg Finance L.P.
Dallas Fed Mobility and Engagement Index
Source: Dallas Federal Reserve Bank; Bloomberg; Copyright 2021 Bloomberg Finance L.P.

Economic Indicators Clay Nickel, CPM
7
Turning to more traditional economic data, the ADP payrolls report was released Wednesday morning. After months of substantial increases in employment, the ADP showed a loss of 123,000 jobs (estimates were for a gain of 75k, prior month showed 304k new jobs). The ADP is a pre-cursor to the Bureau of Labor Statistics Non-farm Payroll report, although the two are not always correlated. Meanwhile, the Challenger Job Cuts report showed a 134% increase in lay-off announcements (45% prior month).
Jobs data is always challenging around the holiday timeframe and even more so in a pandemic environment since the normal seasonal adjustments may be widely off the mark. Yet, the Weekly Jobless Claims, which is less subject to seasonal effects, continues to hover just below 800,000 new unemployment applicants each week. The December Non-farm Payrolls will be reported on Friday. Should it surprise significantly to the downside, it could impact Treasury rates and possibly stock markets. Suffice it to say that while investors are able to cheer the above average market gains of 2020, workers, particularly those in mid-to-lower income brackets, as well as women/mothers, continue to be hard-hit.
New York Fed Weekly Economic Index
Source: New York Federal Reserve Bank; Bloomberg; Copyright 2021 Bloomberg Finance L.P.
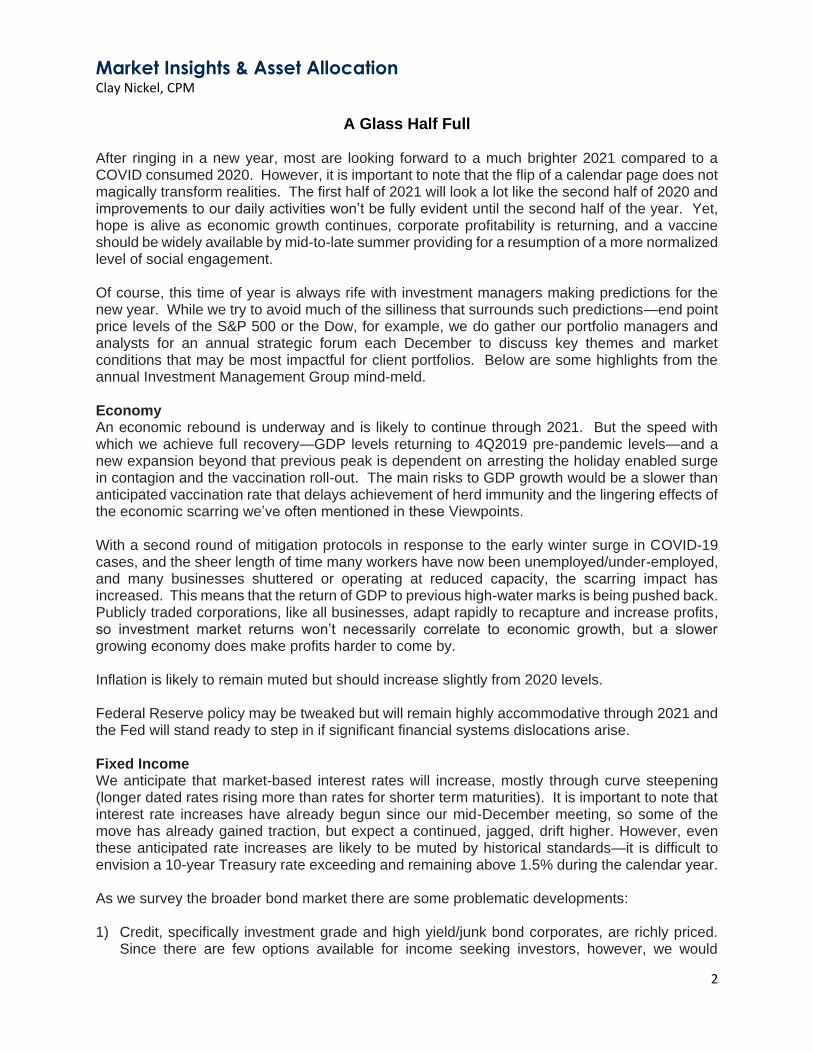
One good spot of news this week are the Purchasing Managers Indexes. Institute of Supply Managers survey and the Markit Purchasing Managers Index have continued to come in with strongly positive readings, signaling continuing expansion of the economy (chart below). We would not be surprised if the National Bureau of Economic Research (NBER), the arbiter of recessions—with determinations often made well after the fact, comes out later this year and declares that the recession has ended this quarter. Common belief is that recessions start with two back-to-back quarters of negative growth and end with two successive quarters of positive growth, but it’s a bit more complicated and the NBER is the widely accepted judge.
As we’ve stated, the recovery, while uneven, is underway and is likely to continue.
Economic Indicators Clay Nickel, CPM
8
Purchasing Managers Indexes
Source: ISM, Markit; Bloomberg; Copyright 2021 Bloomberg Finance L.P.
Clay Nickel oversees and directs research, product line development, security selection and portfolio allocations as director of investment strategy. He is a keynote speaker, spokesperson for the portfolio management team, and a resource for Arvest Wealth Management’s investment officers and client advisors. A graduate of Wichita State University, Clay has completed Columbia University’s Academy of Certified Portfolio Management and is a member of the Chartered Financial Analyst Institute and Kansas City Society of Chartered Financial Analysts.

Taxable Bond Market Dennis Whittaker, CFA
9
It finally happened. The 10-year Treasury yield breached the 1% barrier on Wednesday morning (January 6, 2020) following the conclusion of the run-off elections for the U.S. Senate in Georgia. The upward push in yields that has been experienced in the first few trading days of 2021 has helped to break through the 0.85% to 0.95% range that the market had settled into during the course of the holiday season.
10-Year Treasury Breaks Through A Recent Trading Range
Source: Bloomberg; Copyright 2021 Bloomberg Finance L.P. As we stipulated in our December 2020 commentary, we planned on utilizing any breach of the 1% barrier by the 10-year Treasury as an opportunity to extend portfolio duration levels. Having formally breached the barrier, we have begun the process of reviewing if any extension in portfolio duration levels beyond our current duration band of 85% to 95% of the relevant benchmark is warranted. Admittedly, we have some qualms about extending portfolio duration levels to a near neutral setting given the continued low level in yields. Moreover, we would not be surprised to see some further upward drift in Treasury yields as the market prepares itself for the potentiality of another fiscal package that results in a significant level of additional spending (i.e. something beyond the $900 billion package that recently became law). Nevertheless, we also recognize that the level of upward movement in Treasury yields is likely to be limited until such time as either, a) the market gets a sense that monetary policy is moving toward a tighter posture, or b) consumer inflation makes an upward and sustained move higher. Along those lines, the recent increase in market based inflationary expectations is disturbing and could portend a more difficult environment going forward.
Taxable Bond Market Dennis Whittaker, CFA
10
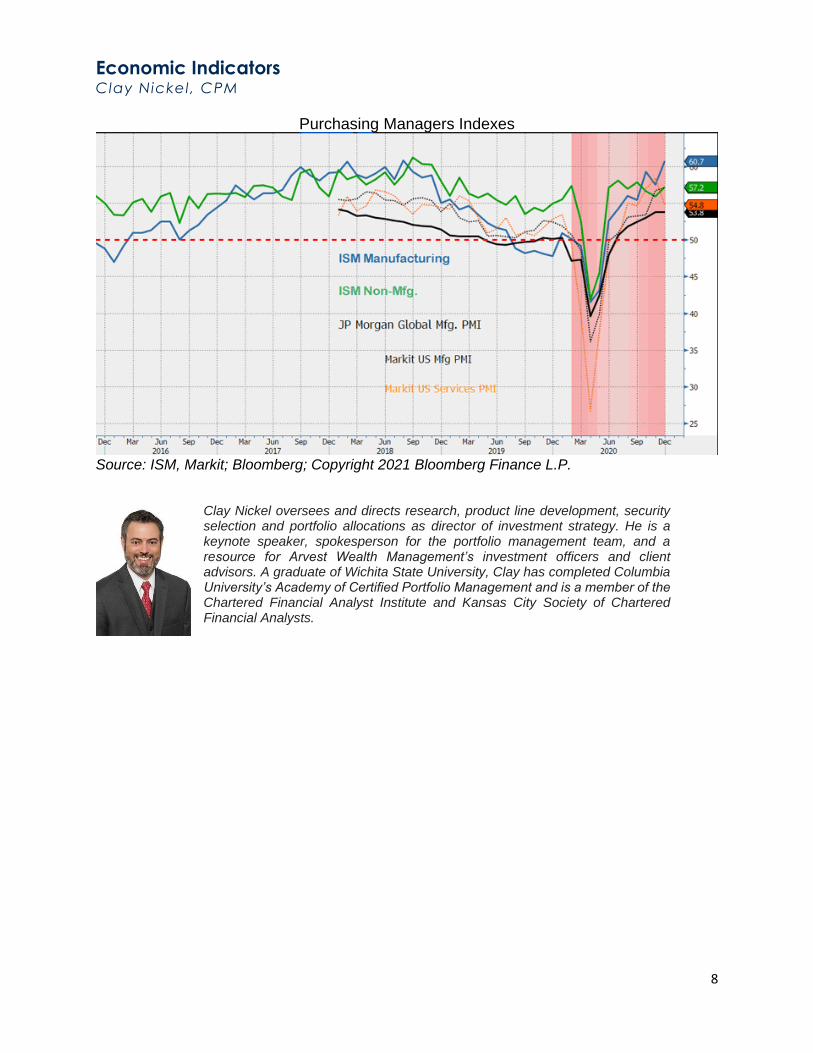
Market Based Inflation Expectations Pushing Higher
Source: Bloomberg; Copyright 2021 Bloomberg Finance L.P. Still, there remain significant risks to the economic (i.e. continued elevated level of initial jobless claims; implied reduction in job levels from the December ADP report) and health environment. Moreover, we suspect that the Federal Reserve will have little tolerance for any type of sharp and sudden upward movement in Treasury yields absent a substantial reduction related to these risks. As such, while we believe that yield levels will ultimately move higher, we remain inclined to believe that it will be some time in the future before such a move occurs.
Dennis Whitaker is responsible for the construction and management of several fixed income portfolios as the senior portfolio manager-fixed income. Prior to rejoining Arvest Wealth Management in 2006, he managed a tax-exempt mutual fund for an investment advisory firm and was responsible for the preparation of all fixed income research for a broker-dealer. Dennis has a BSBA in Economics and holds the Chartered Financial Analyst designation. He is a member of the Fixed Income Analysts Society and the Board of Directors of the Southern Municipal Finance Society, previously serving as chair, and a former member of the Board of Governors of the National Federation of Municipal Analysts.
U.S. Equity Market Christopher Magee, Ryan Ritchie, and Bret O’Meara
11
The long-term trend in the U.S. stock market has been higher. In the 40 years since Ronald Reagan became president, stocks have turned in positive performances almost 80% of the time. The average annual gain has been 9%.
The year 2020 was better than average, as the S&P 500 climbed close to 15%. But there was plenty of pain along the way, as the index fell 30% and into a bear market during February and March when the coronavirus began to spread throughout the world. Volatility has now played an important role in the market for three consecutive years. In 2019, stocks rose almost 30% while in 2018 they dropped 11%. As we look ahead to 2021, we see a market that is likely to generate more normal returns.
There are several positive factors supporting a continuation of the new bull market that began in March 2020, after the coronavirus ended the previous bull (which had been the longest on record). Interest rates are low; GDP is expected to rebound as COVID-19 vaccines are distributed; earnings are poised to grow sharply; and, finally, stocks tend to do well in the first year of a presidential cycle.
But there are some challenging factors as well. Stocks are no longer priced at a discount to fair value, so the market will be more dependent on earnings than on higher valuation multiples for returns; the global economic outlook is uncertain, particularly in the UK, Europe and Japan; and coronavirus cases continue to rise in the U.S., with new strains emerging around the world.
In all, our economic, earnings and valuation models support a forecast for another positive year for stocks in 2021. We expect to see earnings grow 20%-25% after a double-digit decline in 2020; interest rates remain at historically low levels as the Federal Reserve focuses on reducing the unemployment rate toward 4.0%; and valuations to hold steady.
Growth stocks outperformed value again in 2020. But in an environment of historically low interest rates (and with the coronavirus and a high unemployment rate seemingly poised to keep them low for a long time), many investors are searching for high levels of income, which can often be found in value stocks. During recent years, the performance record has favored growth. Since 2010, the Russell 1000 Growth Index has climbed more than 400%, compared to an advance of 200% for the Russell 1000 Value Index. In eight of the past 10 years, growth stocks have topped value stocks. That hasn’t always been the case. In the previous decade, including the Great Recession, value stocks were better performers than growth stocks, advancing an admittedly low 8% -- but still better than growth, which declined 15% during the decade.
Value investors trace their roots to the famous “Security Analysis” textbook, written by Ben Graham, an economics professor at Columbia University. Warren Buffett was one of his students. The tide may now be turning. Progress on COVID-19 vaccines has given a lift to some of the cyclical companies (energy companies and banks) that have lagged in recent quarters, and value stocks have kept pace with growth stocks in the past quarter. In any event, value is the place to achieve income. The current yield on the iShares Russell 1000 Value Index ETF is 2.5%, compared to the 1.0% current yield on the iShares Russell 1000 Growth Index ETF. This is important, as the current yield on the 10-year Treasury bond is 0.95%.
In a certain to be unpredictable investing environment, dividend yield and dividend growth become even more important. At this stage of the economic and market cycles, we recommend that investors pay close attention to dividends. We think consistent dividend growth at a company gives three important signals to investors in the stock: 1) the company’s balance sheet

U.S. Equity Market Christopher Magee, Ryan Ritchie, and Bret O’Meara
12
is strong enough to pay a dividend; 2) management is mindful of shareholder returns, which include dividends; and 3) a significant dividend increase can be a message from management to the market that the near-term outlook for the company is promising, even during a pandemic.
Bret O’Meara assists and supports the management of investment portfolios as an advisory solutions support specialist through research, analysis, and trading of equity securities. He joined Arvest Wealth Management in 2010 as a member of the Retirement Plan Services Group before transitioning to the Investment Management Group. Bret has a BSBA in economics and finance and MBA, and taught courses in accounting and economics at Northwest Arkansas Community College for six years.
Christopher Magee is the lead manager of the Arvest Bank Group Equity Fund and the Investment Management Group DIG Equity Portfolio, and is responsible for construction of equity portfolios for institutional and retail clients, including equity research, security selection, sector weightings and trading as senior equity portfolio manager. Prior to joining Arvest Wealth Management in 1992, Christopher served as a trust investment officer at a national bank in Shreveport, Louisiana and a bank in Amarillo, Texas. He has a BSBA in Finance, with an emphasis in Investments, and is a graduate of Cannon Financial Institute’s Advanced Trust Investments School.
Ryan Ritchie is co-manager of the Arvest Bank Group Equity Fund and co-lead manager of the Investment Management Group’s strategic portfolios, and is responsible for the construction of equity portfolios for institutional and retail clients, including equity research, sector weightings, and trading as equity portfolio manager. Additionally, he is responsible for directing the implementation of Arvest’s Wealth Management’s equity strategy throughout trust and brokerage relationships. Ryan has a BSBA in Finance with an emphasis in Financial Management.

Appendix Investment Management Group Team Members
Scott Phillips, Chief Investment Officer Jennifer Tichenor-Turner, Adv. Solutions Support Specialist
Christopher Magee, Sr Trust Investment Officer Jesica Campbell, Advisory Solutions Support Specialist
Clay Nickel, Director of Investment Strategy Abbey Vibhakar, Fixed Income Analyst
Ryan Ritchie, Portfolio Manager Jake Baker, Fixed Income Analyst
Dennis Whittaker, Sr Portfolio Manager Curtis Jones, Fixed Income Analyst
Alain Monkam, Portfolio Manager Alex Jantsch, Portfolio Analyst
Kevin Woodworth, Portfolio Manager Josh Warner, Portfolio Analyst
Bret O’Meara, Advisory Solutions Support Charles Kurtz, Executive Assistant
Description of IMG Recession Indicators
Conference Board Leading Economic Indicators (LEI) - The indicator tracks the Year-over-Year percentagechange in the Conference Board Leading Economic Indicators Index. The index is an American economic leadingindicator intended to forecast future economic activity. It is calculated by The Conference Board, a non-governmental organization, which determines the value of the index from the values of ten key variables.
U.S. Treasury Yield Curve (3-month to 10-year Spread) – This indicator measures the spread between the fixedincome yields of the 3-month Treasury Bill and the 10-Year Treasury Bond. The lower this number, the flatter theyield curve is. The flatter the yield curve is, the less longer term investors are getting compensated over shorterterm investors for the inherent interest rate risk. If the spread goes below zero, this means that the yield curve hasinverted.
ISM New Orders-to-Inventories Spread – This indicator looks at the spread of reported new order levels versusreported current inventories levels. The Institute for Supply Management (ISM) surveys 300 manufacturing firmson numerous manufacturing data points to get data points for both new orders and inventories.
Core Capital Goods (New Orders) – This indicator tracks the Year-over-Year percentage change in the value ofnew orders received during the reference period. Orders are typically based on a legal agreement between twoparties in which the producer will deliver goods or services to the purchaser at a future date.
Initial Jobless Claims – This indicator tracks the number of initial unemployment claims of people who have filedjobless claims for the first time during the specified period with the appropriate government labor office. Thisnumber represents an inflow of people receiving unemployment benefits.
New Building Permits – This indicator tracks the number of construction permits that have been issued andapproved for new construction, additions to pre-existing structures, or major renovations.
DISCLAIMER: These are not the only indicators that the IMG team looks at, and no decision should (or will) be made on any single indicator. These are simply what the IMG team utilizes to help forecast potential for a recessionary environment.

January | 2021
Disclosures Investment products and services provided by Arvest Investments, Inc., doing business as Arvest Wealth Management, member FINRA/SIPC, an SEC registered investment adviser and a subsidiary of Arvest Bank. Insurance products made available through Arvest Insurance, Inc., which is registered as an insurance agency. Insurance products are marketed through Arvest Insurance, Inc., but are underwritten by unaffiliated insurance companies. Trust services provided by Arvest Bank.
The Investment Management Group (IMG) is comprised of Arvest Wealth Management registered investment adviser representatives who provide portfolio management services with respect to certain of Arvest Wealth Management's investment advisory wrap fee programs (the "IMG managed programs").
Arvest Wealth Management does not provide tax or legal advice. Be sure to consult your own tax and legal advisors before taking any action that would have tax consequences.
Consider your investment objectives, and the risks, charge and expenses of any investment product carefully before investing. Obtain a prospectus or other product information from your Client Advisor and read it thoroughly before investing.