Embed Size (px)
Citation preview

Arundo Mapping and Eradication in
the Sacramento / San Joaquin DeltaArundo Control and Restoration Program
Funding provided by:
California Department of Water Resources
Sacramento/San Joaquin Delta Conservancy
Phase 1:
Map all Arundo within the Legal Delta
Develop an eradication prioritization
Work in partnership with Solano RCD on a
focused eradication and revegetation project
in Cache Slough Complex
Sacramento / San Joaquin Delta
119,269 acres
+/- 1,100 miles of waterways
+/- 1,300 acres of riparian (50ft buffer)
Miles and miles of levees
Many private access roads

Imagery Analysis GIS Digital
Mapping
GIS Digitizing from Aerial Imagery
Multiple, free, hi-res imagery sources
Dual Monitors (side-by-side comparison)
ArcGIS and Google Earth
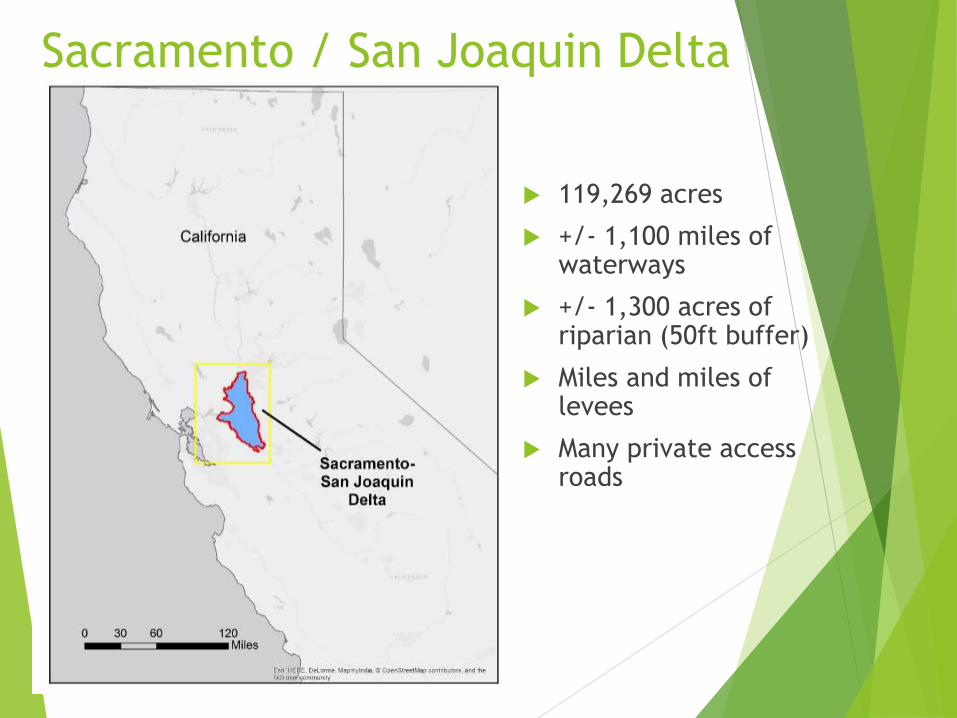
Aerial Imagery Sources:
Primary Source:
ESRI World Base-map
Esri online, accessed through ArcGIS Desktop
0.3m (or better) resolution throughout the continental United States
Imagery dates for area of interest = 11/2011 and 2/2012
Secondary Sources:
Google Earth High Res Imagery
Multi-Year Imagery Slider
Can upload index grid and mapping extent GIS Feature Classes (KML)
Bing Maps High Res Imagery
“Bird’s Eye” extra high res available in some locations
Google Maps Street View High Res Imagery
Multiple angles
Can verify anything in view of main roads

USGS DOQQ Index Grid used to help organize the mapping task

Initial Mapping
SEC created a point style feature class in an
ArcGIS geodatabase (GDB) with key attribute fields
developed in previous mapping efforts.
Arundo was identified from the aerial imagery at
a scale of 1:1000 or better and digitized on screen
with attributes noted.
Multiple points per infestation were recorded with
a cluster tolerance of approximately 30ft.

Attributes Captured
Observation Date (Imagery date)
Confidence Rating
Length / Width
DOQQ Number
Identifier
ID Date
Notes
Scale
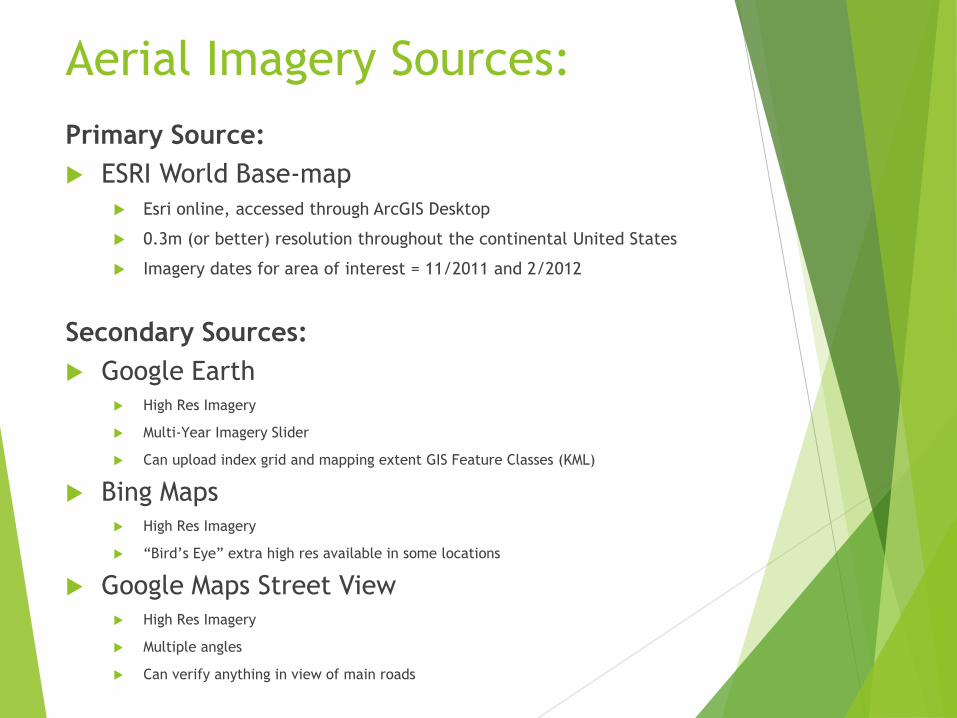
Field Mapping and Ground
Truthing
Windshield Survey where road access is available
By Boat where access is limited
Tablet computer with streaming imagery and data
points
Mapistry field mapping software
Google Earth streaming data

Points to Polygons: To ensure compatibility with other state‐wide mapping
efforts, carefully checked and verified points wereconverted to polygons.
The ArcMap freehand digitizing tool was used to createpolygons around mapped points and attributes werecross‐walked to match California Invasive Plant Council (CalIPC) attribute fields.
Total infestation area was then calculated based on thepolygon area and percent cover.
Conversion to polygons had the added advantage of giving the analyst one more pass at data quality assurance.

Mapping Results
A total of 2073 infestation polygons were digitized, with
a size range of .0002 – 1.94 acres in size, for a total of
98.3 acres.
The highest concentrations are in the Cache Slough
Complex and near the Western Delta boundary along the
Montezuma Hills.
The total number of Arundo acres is relatively small
given the total acreage of the Delta. However, Arundo
has a high density in very long narrow riparian corridors
on many of the Delta waterways.


Habitat Valuation Index-based Multi-species Conservation Value
(IMCV) analysis (Root, et al (2003, A multispecies approach to ecological
valuation and conservation. Conservation Biology, 17(1), 196-206)).
Assign a habitat value to the vegetation surrounding the Arundo infestation for specific species.
Stack multiple species habitat rankings for the same location in GIS
Calculate total value of habitat for the greatest number of species at each location
Target areas with the highest value to the greatest number of species for Arundo removal
Amphibian
Fish
Plant
Bird
Reptile
Mammal
Habitat Value

Habitat Valuation Methodology
Objective: Use the value of threatened habitat as basis for
recommending eradication priorities
Method combines maps of habitat suitability for selected
species into single GIS layer of an index based
multispecies conservation value (IMCV)
For each species, habitat suitability is weighted with
endangerment indices (extinction threat risk). This
results in greater habitat value being assigned to species
at risk.

IMCV Formula
where n is the number of species,
Sij is the habitat suitability for species i at location j,
and Ei is the endangerment index value for species i

Index Species
23 Delta-specific riparian species, (7 taxa)
Amphibian
Bird
Fish
Mammal
Reptile
Insect
Plant
Habitat suitability data for terrestrial species obtained from
CDFW VEGCamp
Habitat suitability data for fish obtained from NOAA NMFS
Salmonid Critical Habitat
Endangerment indices data obtained from federal and state
threat listings

Delta Specific Riparian Species Selected
Species Listing
Code Common Name Scientific Name Taxon Status
ONMY Cal . Centra l Val ley Steelhead DPS Oncorhynchus mykiss Fish FT
ONTS Centra l Val ley Winter Run Chinook ESU Oncorhynchus tshawytscha FE
North American Green Sturgeon, Southern
ACME DPS Acipenser medirostris Fish FT
HYTR Delta Smelt Hypomesus transpacificus Fish FT & SE
HYRE Paci fic Tree Frog Hyla regilla Amphibian
BAAT Cal i fornia Slender Sa lamander Batrachoseps attenuatus Amphibian
SCHA Western Spadefoot Scaphiopus hammondi Amphibian
BUBO Western Toad Bufo boreas Amphibian
CLMA Western Pond Turtle Clemmys marmorata Repti le
LAGE Common Kingsnake Lampropeltis getulus Repti le
THGI Giant Garter Snake Thamnophis gigas Repti le FT & ST
MEME Song Sparrow Melospiza melodia Bird
BUSW Swainson's Hawk Buteo swainsoni Bird ST
PACA Blue Grosbeak Passerina caerulea Bird
GACH Common Moorhen Gallinula chloropus Bird
MUVI Mink Mustela vison Mammal
LUCA River Otter Lutra canadensis Mammal
SYBARI Riparian Brush Rabbit Sylvilagus bachmani riparius Mammal FE & SE
DECA Val ley Elderberry Longhorn Beetle Desmocerus californicus dimorphus Insect FT
HILA6 Cal i fornia Hibiscus Hibiscus lasiocarpus var. occidentalis Plant
LIMA7 Mason's Li laeops is Lilaeopsis masonii Plant SR
SYLE2 Suisun Aster Symphyotrichum lentum Plant
LAJE Delta Tule Pea Lathyrus jepsonii Plant
Table 1. Delta Arundo Prioritization Species

Habitat Suitability Data Transformations
VEGCamp Data
Habitat Criteria Score
>50% of area is High Suitability 5
>50% of area is Medium or High Suitability 4
>50% of area is Low, Medium or High Suitability 3
50% < area of Low, Medium or High Suitability but >0% 2
Suitable Habitat in wetland/riparian habitats only (no areal
estimate)
1
No suitable habitat 0
Derive CGAP compatible score from NMFS SPAWN/NATAL data
SPAWN UTILIZATION
NATAL UTILIZATION
+ SPAWN QUALITY
+ NATAL QUALITY
Spawn Habitat Score
Natal Habitat Score
Blank blank 0
No Not suitable 0
Probable, undocumented Periodic, Poor 2
Probable, undocumented Periodic, Fair 2
Probable, undocumented Periodic, Good 3
Probable, undocumented Consistent, Poor 2
Probable, undocumented Consistent, Fair 3
Probable, undocumented Consistent, Good 4
Yes Periodic, Poor 2
Yes Periodic, Fair 3
Yes Periodic, Good 4
Yes Consistent, Poor 3
Yes Consistent, Fair 4
Yes Consistent, good 5
Federal
Listing Level
Federal
Endangerment
Index
State
Listing Level
State
Endangerment
Index
Endangered 3 Endangered 3
Threatened 2 Threatened 2
Special Concern 1.5
none 1 none 1
Conversion of Status Listing to Endangerment Index
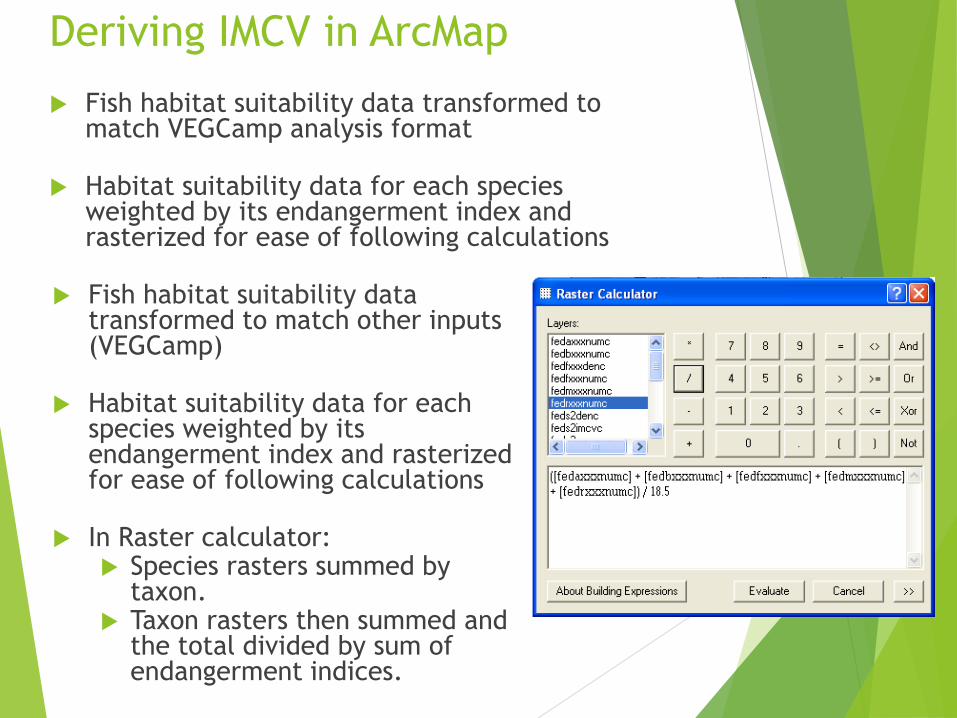
Deriving IMCV in ArcMap
Fish habitat suitability data transformed to match other inputs (VEGCamp)
Habitat suitability data for each species weighted by its endangerment index and rasterized for ease of following calculations
In Raster calculator: Species rasters summed by
taxon. Taxon rasters then summed and
the total divided by sum of endangerment indices.
Fish habitat suitability data transformed to match VEGCamp analysis format
Habitat suitability data for each species weighted by its endangerment index and rasterized for ease of following calculations

Riparian Habitat Suitability by taxon and IMCV. Darker areas have higher habitat value.
Amphibian
Plant Mammal Insect
Reptile Fish Bird

Combined
IMCV

IMCV Habitat Values joined
to Arundo Infestation points

IMCV
Ranked
Arundo
Infestations

Eradication Priority Use
This habitat value based threat level is one of a number of factors necessary to derive priorities. Other necessary factors are:
Known legal and permitting obstacles.
Presence of other impairments that are likely to compromise restoration success.
Presence of capable and willing local partners to perform actual eradication work.
Permission to perform eradication work from private landowners or public land managers.
Hazard potential caused by presence of Arundo, such as flooding and fire.
Local expert opinion about Arundo infestation size and invasion rates, propagule sources, and stream dynamics.


![Graduate in Biochemistry [Habilitações Académicas] Arundo](https://img.dokumen.tips/doc/110x75/6273980f6259f336d05fad07/graduate-in-biochemistry-habilitaes-acadmicas-arundo-.jpg)