Embed Size (px)
Citation preview

echT PressScienceComputers, Materials & ContinuaDOI:10.32604/cmc.2022.019246
Article
Artificial Intelligence in Medicine: Real Time Electronic Stethoscope forHeart Diseases Detection
Batyrkhan Omarov1,2,*, Nurbek Saparkhojayev2, Shyrynkyz Shekerbekova3, Oxana Akhmetova1,Meruert Sakypbekova1, Guldina Kamalova3, Zhanna Alimzhanova1, Lyailya Tukenova3
and Zhadyra Akanova4
1Al-Farabi Kazakh National University, Almaty, Kazakhstan2Khoja Akhmet Yassawi International Kazakh-Turkish University, Turkistan, Kazakhstan
3Abai Kazakh National Pedagogical University, Kazakhstan4NARXOZ University, Almaty, Kazakhstan
*Corresponding Author: Batyrkhan Omarov. Email: [email protected]: 07 April 2021; Accepted: 12 June 2021
Abstract: Diseases of the cardiovascular system are one of the major causesof death worldwide. These diseases could be quickly detected by changes inthe sound created by the action of the heart. This dynamic auscultations needextensive professional knowledge and emphasis on listening skills. There isalso an unmet requirement for a compact cardiac condition early warningdevice. In this paper, we propose a prototype of a digital stethoscopic systemfor the diagnosis of cardiac abnormalities in real time using machine learningmethods. This system consists of three subsystems that interact with eachother (1) a portable digital subsystem of an electronic stethoscope, (2) adecision-making subsystem, and (3) a subsystem for displaying and visualizingthe results in an understandable form. The electronic stethoscope capturesthe patient’s phonocardiographic sounds, filters and digitizes them, and thensends the resulting phonocardiographic sounds to the decision-making system.The decision-making system classifies sounds into normal and abnormal usingmachine learning techniques, and as a result identifies abnormal heart sounds.The display and visualization subsystem demonstrates the results obtained inan understandable way not only for medical staff, but also for patients andrecommends further actions to patients. As a result of the study, we obtainedan electronic stethoscope that can diagnose cardiac abnormalities with anaccuracy of more than 90%. More accurately, the proposed stethoscope canidentify normal heart sounds with 93.5% accuracy, abnormal heart soundswith 93.25% accuracy. Moreover, speed is the key benefit of the proposedstethoscope as 15 s is adequate for examination.
Keywords: Stethoscope; phonocardiogram; machine learning; classification;heart diseases; PCG
This work is licensed under a Creative Commons Attribution 4.0 International License,which permits unrestricted use, distribution, and reproduction in any medium, providedthe original work is properly cited.

2816 CMC, 2022, vol.70, no.2
1 Introduction
As is known, the most dangerous and common diseases are currently cardiovascular diseases(CVD) [1]. Cardiovascular diseases is the leading cause of death worldwide [2]. This determinesthe relevance of scientific and practical justification and development of effective methods oftreatment, rehabilitation and prevention, and, above all, ensuring reliable early diagnosis of cardio-vascular diseases in the presence of minimal symptoms (complaints or feelings of the patient) [3].The main requirements for such methods are simplicity of implementation, informativeness andreliability.
There are many methods for diagnosing cardiovascular diseases [4]. Among them, the mostcommon method is electrocardiography, which allows you to evaluate the work of the heartusing an electrocardiogram (ECG) [5]. However, the ECG characterizes the state of the heartdirectly at the time of registration. In addition, in some cases, the ECG does not reflect all theexisting disorders (for example, the presence of heart murmurs), and requires special conditionsfor registration [6].
A good addition to electrocardiography is phonocardiography (PCG), which allows inves-tigating and detecting the presence of disorders in the activity of the heart and its valvularapparatus [7]. Phonocardiograms are acoustic measurements of the sound generated by the sys-tolic and diastolic phases of the heart. The method is based on the recording and analysisof sounds that occur when the heart contracts and relaxes. This method is an affordable andrelatively easy way to diagnose the functional state of the cardiovascular diseases. The source ofdiagnostic information here is the phonocardiosignal, the recording method of which is calledphonocardiography.
Recently, a large number of studies using data analysis have been conducted in cardiology.The accumulated data on electrocardiography and phonocardiography are analyzed for the correctdiagnosis [8–11]. Auscultation of the heart continues to play an important diagnostic role inthe assessment of heart health [12]. All this has led to the development of diagnostic strategiesthat reasonably reduce the need for non-invasive diagnosis of heart disease [13]. One of theseapproaches is the creation of predictive models that characterize the existence of pathology in thepatient. For such tasks, the machine learning technique is most suitable.
Machine learning (ML) methods are considered to be the main tools of artificial intelligenceand are increasingly used in diagnostic and prognostic studies in clinical cardiology, including inpatients with heart diseases. At the same time, there is a small number of scientific studies inwhich these methods are used to assess the pre-test probability of obstructive coronary arterydisease and non-obstructive coronary artery disease in patients with various clinical variants ofheart disease. At the same time, most publications on this issue emphasize that the improvementof machine learning technologies can be implemented only on the basis of interdisciplinaryscientific cooperation.
This paper organized as follows: Section 2 reviews state of the art literatures in this area.Section 3 explains characteristics of heart sounds. In the Section 4, we explain architecture ofelectronic stethoscope and its components. Section 5 considers applying machine-learning methodsfor heart sound classification problem. The Section 6 demonstrates experiment results. After theresults, we discuss the received results and opportunities. In the end, we conclude our paper byidentifying further research directions.

CMC, 2022, vol.70, no.2 2817
2 Literature Review
Detection of cardiac diseases is crucial and they must be identified in the early stage utilizingregular auscultation evaluation with high accuracy. Cardiac auscultation is a method that uses anelectronic stethoscope to analyze and listen to heart sounds. This PCG signal contains importantinformation about the heart’s functioning and health, thus it may be used to investigate anddiagnose cardiac problems using a variety of signal processing and machine learning techniques.The cardiac sound signal may be categorized into two groups based on the PCG signal: normaland pathological. Son et al. [14] compiled a database of five types of cardiac sound signals(PCG signals) from diverse sources, one of which is normal and the other four are abnormal.From the heart sound data, the authors employed Mel Frequency Cepstral Coefficient (MFCCs)and Discrete Wavelets Transform (DWT) features, as well as support vector machine (SVM),deep neural network (DNN), and centroid displacement-based k closest neighbor for learning andclassification.
Reference [15] offers a prototype concept of an electronic stethoscope system that can detectand identify aberrant cardiac sounds in real-time. This system comprises of two modules: aportable stethoscope and a decision-making part that connects wirelessly utilizing Bluetoothtechnology. The portable subsystem records the patient’s phonocardiography signals, filters anddigitizes them, and delivers them wirelessly to a personal computer for visualization and additionalprocessing to determine if the heartbeats are normal or abnormal. They claim that a cost-adjustedoptimal ensemble method can diagnose normal and abnormal heartbeats with 88 percent and 97percent accuracy, respectively.
A stethoscope described in [16] distinguishes between normal and abnormal PCG signals infour different types of heart valve disease. The system developed on a personnel computer andportable hardware platforms. A portable heart valve disease screening device with an electronicstethoscope as the input is made using a multimedia board with a single board computer, audiocodec, and graphic LCD. Both systems have a 96.3 percent specificity rating. However, theportable device’s sensitivity and accuracy are only 77.78 percent and 87.04 percent, respectively,compared to the PC platform’s sensitivity and accuracy of more than 90 percent.
Varghees et al. [17] offer a unified PCG signal delineation and murmur classification approachfor automated detection and classification of heart sounds and murmurs that do not need theusage of a reference signal. The authors use empirical decomposition of the PCG signal based onthe wavelet transform, Shannon entropy envelope extraction, heart sound, and murmur parameterextraction to identifying heart murmurs. For cardiac sound segmentation, the suggested tech-nique obtains an average sensitivity of 94.38 percent, positive predictivity of 97.25 percent, andprediction accuracy of 91.92 percent.
To boost the loudness of the input PCG received by the stethoscope, [18] uses an acous-tic stethoscope, microphone, and preamplifier module. To identify aberrant cardiac sounds, theauthors employ the harmonic distribution of Amplitude and Phase. Babu et al. [19] suggestusing SVM and KNN algorithms to identify and classify systolic and diastolic patterns inphonocardiograms.
There are some researches that apply deep learning and deep neural networks in heartbeatabnormality detection [19–23]. Despite the high accuracy, deep learning architectures are limitedwith the decision-making time, since the electronic stethoscope must make a decision promptly.

2818 CMC, 2022, vol.70, no.2
3 Characteristics of Heart Sounds
The heart sounds S1 and S2 are high-frequency sounds and are clearly audible from thediaphragm of the stethoscope. S1 of normal heart changes between 50 to 60 Hz, and normal S2changes between 80 to 90 Hz [24]. S3 is a pre-diastolic low signal that has bandwidth limit about20–30 Hz. S4 is also low signal that takes place at the end of diastole and is well characterizedby a stethoscope. The abnormal S4 has a frequency of less than 20 Hz [24].
Although they are audible, S1 and S2 have their amplitude varying and sometimes becomingvery faint and not audible because of anomalies. S1 and S2 do not have fixed frequencies,but are in different frequency ranges at different heart periods. Such limitations of heart soundsegmentation have led researchers to develop a very specific approach [24].
Fig. 1 lists the full categories and functions of the HSs. There is one or two HSs correlatedwith each heart condition. Any miscellaneous heart sounds create a noisy high-pitched sound aftera first high-pitched sound tricuspid stenosis (TS). The most popular early systolic sound thatarises from irregular sudden stopping of the semilunar cusps when they open during early systoleis the ejection sound (ES). The mid-systolic click (MSC) is a mid-systole HF signal that comesfrom the sudden stopping of the excursion of prolapsing mitral valve leaflets into the atrium bychordae [25].
Figure 1: Heart sounds
The doctors are involved in irregular heart sounds and may offer valuable details for diagnosis.
4 Electronic Stethoscope Structure
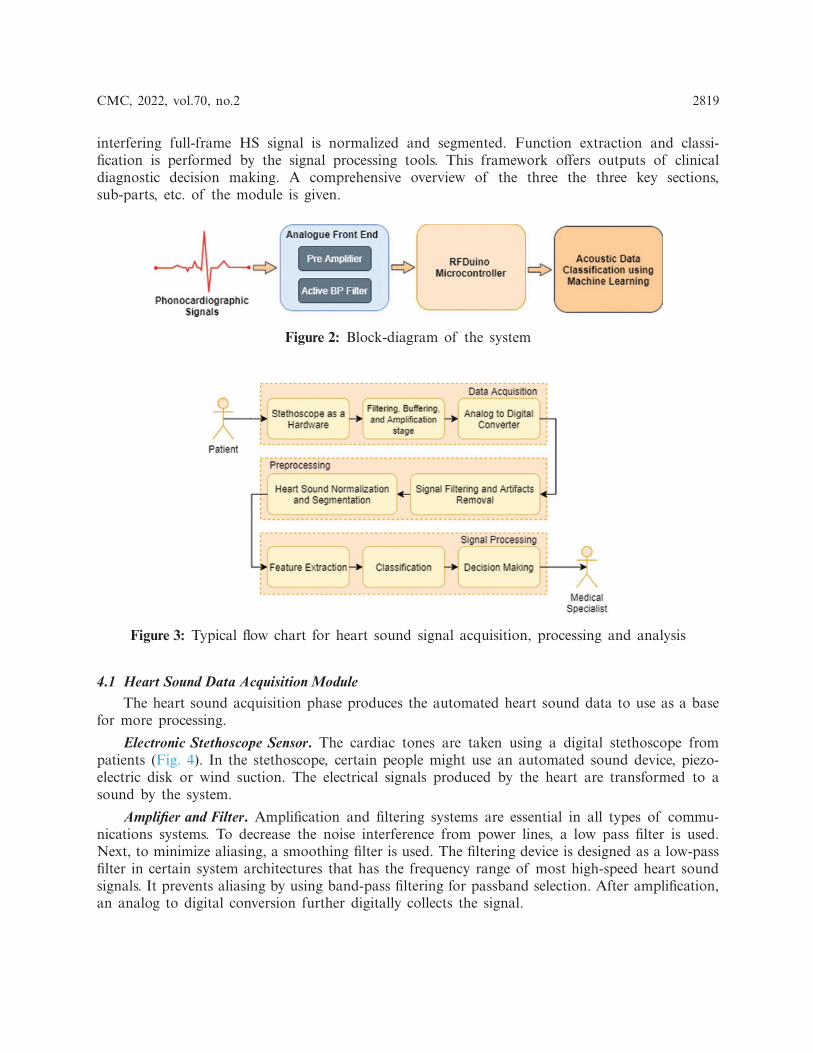
Fig. 2 illustrates a scheme of the proposed stethoscopic system using machine-learning tech-niques. The phonocardiographic signals are acquired by the stethoscope, which then amplifiesand filters it using analogue front end before digitizing and transmitting the raw data to thedecision-making subsystem. The analogue front end must have a high signal-to-noise ratio, goodcommonmode rejection, and little baseline drift and saturation. The pre-amplifier circuit amplifiesthe extremely weak cardiac sound signals captured by a microphone to the appropriate level.
For the computer based cardiac disorder monitoring device utilizing electronic stethoscope,there are three major modules, such as data collection module, pre-processing module and signalprocessing module (Fig. 3). The electronic stethoscope monitors the HS, and the pre-processingmodule transforms it into digital signals. In the pre-processing node, the noise-reduced and less
CMC, 2022, vol.70, no.2 2819
interfering full-frame HS signal is normalized and segmented. Function extraction and classi-fication is performed by the signal processing tools. This framework offers outputs of clinicaldiagnostic decision making. A comprehensive overview of the three the three key sections,sub-parts, etc. of the module is given.
Figure 2: Block-diagram of the system
Figure 3: Typical flow chart for heart sound signal acquisition, processing and analysis
4.1 Heart Sound Data Acquisition ModuleThe heart sound acquisition phase produces the automated heart sound data to use as a base
for more processing.
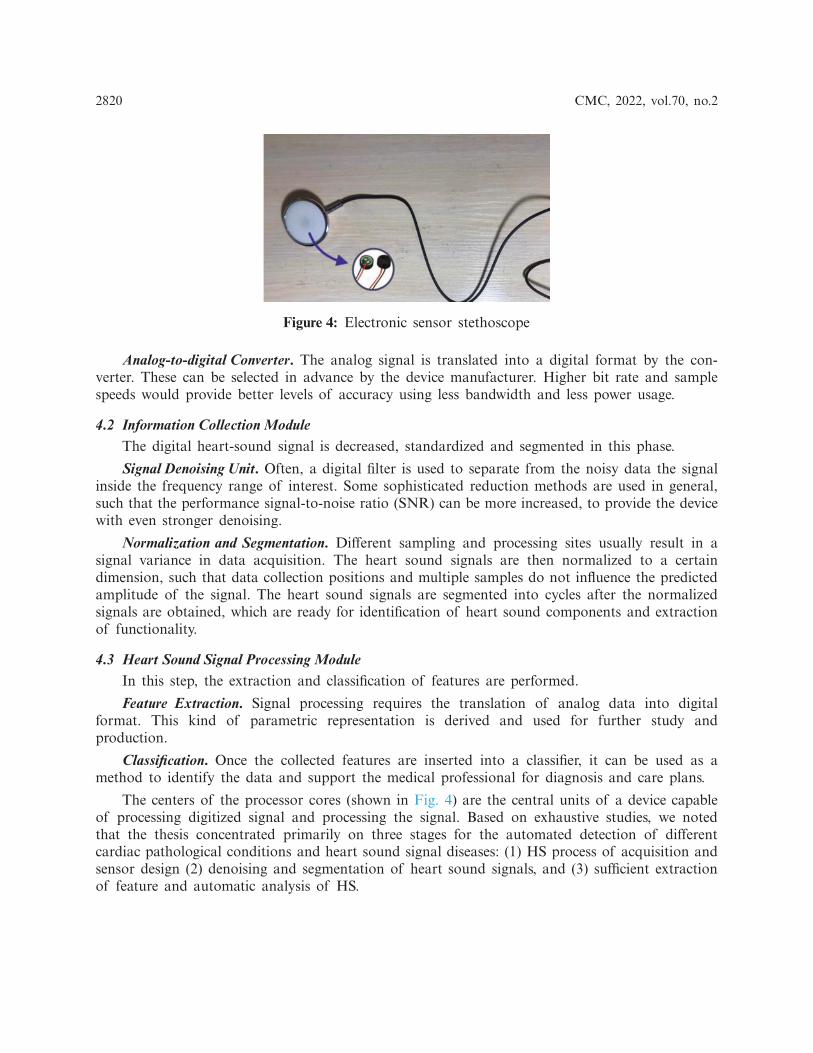
Electronic Stethoscope Sensor. The cardiac tones are taken using a digital stethoscope frompatients (Fig. 4). In the stethoscope, certain people might use an automated sound device, piezo-electric disk or wind suction. The electrical signals produced by the heart are transformed to asound by the system.
Amplifier and Filter. Amplification and filtering systems are essential in all types of commu-nications systems. To decrease the noise interference from power lines, a low pass filter is used.Next, to minimize aliasing, a smoothing filter is used. The filtering device is designed as a low-passfilter in certain system architectures that has the frequency range of most high-speed heart soundsignals. It prevents aliasing by using band-pass filtering for passband selection. After amplification,an analog to digital conversion further digitally collects the signal.
2820 CMC, 2022, vol.70, no.2
Figure 4: Electronic sensor stethoscope
Analog-to-digital Converter. The analog signal is translated into a digital format by the con-verter. These can be selected in advance by the device manufacturer. Higher bit rate and samplespeeds would provide better levels of accuracy using less bandwidth and less power usage.
4.2 Information Collection ModuleThe digital heart-sound signal is decreased, standardized and segmented in this phase.
Signal Denoising Unit. Often, a digital filter is used to separate from the noisy data the signalinside the frequency range of interest. Some sophisticated reduction methods are used in general,such that the performance signal-to-noise ratio (SNR) can be more increased, to provide the devicewith even stronger denoising.
Normalization and Segmentation. Different sampling and processing sites usually result in asignal variance in data acquisition. The heart sound signals are then normalized to a certaindimension, such that data collection positions and multiple samples do not influence the predictedamplitude of the signal. The heart sound signals are segmented into cycles after the normalizedsignals are obtained, which are ready for identification of heart sound components and extractionof functionality.
4.3 Heart Sound Signal Processing ModuleIn this step, the extraction and classification of features are performed.
Feature Extraction. Signal processing requires the translation of analog data into digitalformat. This kind of parametric representation is derived and used for further study andproduction.
Classification. Once the collected features are inserted into a classifier, it can be used as amethod to identify the data and support the medical professional for diagnosis and care plans.
The centers of the processor cores (shown in Fig. 4) are the central units of a device capableof processing digitized signal and processing the signal. Based on exhaustive studies, we notedthat the thesis concentrated primarily on three stages for the automated detection of differentcardiac pathological conditions and heart sound signal diseases: (1) HS process of acquisition andsensor design (2) denoising and segmentation of heart sound signals, and (3) sufficient extractionof feature and automatic analysis of HS.

CMC, 2022, vol.70, no.2 2821
5 Applying Machine Learning for Heart Sound Classification
In the analysis of the rhythms, limits, duration and information of the strength of the hearttones, the database is an obligatory prerequisite. We collected data and created a dataset utilizingsamples from all its patients with heart failure, especially those in the cardiologist departmentof cardiology center in Almaty. An electronic stethoscope was used to pick up the requisitebiothermography measurements of heart tones. For one subject, five samples were taken from theheart apex regions with a needle, (Fig. 5).
It is important to have the consistency of the database to train the model. Therefore, only theheart tones of patients that have already been confirmed with heart diseases have been registered.
Figure 5: Working principle of the smart stethoscope
5.1 Detection of Special CharacteristicsFunction identification is used to illustrate the heart tone’s signature characteristics, enabling
you to distinguish sounds and added heart tones. In Python, which was used to introduce signalprocessing operations, the feature extraction algorithm was developed. To achieve the best possibleprecision, the function detection algorithm uses 8 steps and has the potential to accumulate anappropriate number of properties from a single heart sound, since they can represent each patientindependently during the optimum processing period. The feature detector algorithm uses theamount of resolutions and thresholds obtained statically to conduct cardiac sound analysis.

2822 CMC, 2022, vol.70, no.2
Methods for defining the key components of cardiac sound (first cardiac signal (S1) andsecond heart sound tone (S2)) and measuring the limits of S1, S2, systole and diastole areavailable in most literature references (Fig. 6).
Step 1: A standardized root-mean-square curve lasting 10 s is obtained. Since heart soundsare non-stationary, to avoid missing special characteristics that are irregularly distributed overabnormal heart tones, 10-s-long signals have been extracted from the original recorded sound. Toincrease the illumination of the S1 and S2 peaks by reducing noise interference, uniform RMSenergy curves of the above obtained waves were then achieved.
Figure 6: Key components of cardiac sound [26]
Step 2: Find the elevated peak. Finding strong peaks between the S1 and S2 tones. Theresolution of the parameters was used to determine the peaks, and if the distances between thepeaks identified were not within a sufficient range, the process of assessing high peaks wouldbe performed over and over again, changing the resolution to obtain an appropriate amountof continuous peaks. The premise behind this repeated algorithm [27] is that every heart tone’sfrequency will differ from person to person. The required resolution for each heart tone is thenrelated to the patient’s accompanying heart rhythm. As a consequence, before an exact match isidentified, each heart signal must loop through different resolutions.
Step 3: The Maximum Peak Segmentation. Next, all zero wave crossings for the measuredthreshold were analyzed and the approximate peaks for the highest boundary were plotted. Then,after the verification phase, the whole process was restored to identify a high peak with a differentresolution if the amount of correctly segmented peaks was not at an acceptable stage.
Step 4: The shortest peak is described. Waves were collected between correctly segmented,continuous high-peak thresholds, and the maximum point in the period was taken as the shortpeak of importance. The test then calculated the distances between the short peaks described andthe high peaks correlated with them and checked for acceptable standard deviations. Otherwise,the short peak, the highest deviation of which is the direction, was substituted by the peak, whichhas the lowest deviation impact at the same interval. The maximum continuous short peaks areachieved following the same approach, and if the number is not sufficient, the whole processreturns to the measurement of high peaks [28].

CMC, 2022, vol.70, no.2 2823
Step 5: Segmentation of short peaks. For the assumed threshold, zero intersections of theextracted waves were measured between the boundaries of the high peaks. Afterwards, they werecontrasted to the short peaks measured. There, the segmentation of the short peaks will berepeated by changing the threshold if the limits of the short peaks were incorrectly calculated,even if there was some overlap.
Step 6: Final time-frame estimation and final verification. Ultimately, both of the above resultswere used in multiple arrays to calculate the distribution of peak values from high to low andpeak values from short to high. To ensure high accuracy, any peak or period that caused overlapor inappropriate variance was excluded when checked. Even if the amount of peaks or intervalsrecorded is not sufficient, the protocol for classifying high peaks has been reinstated, but in eithercase, the mechanism has been broken by adopting all the specified high-pitch detection resolutionsto guarantee 100% precision of the results. This termination occurs only in cardiac tones that arehighly disturbed by noise.
Step 7: S1, S2, the systolic and diastolic groups. All sections and intervals collected have beenclassified as S1, S2, systole, and diastole in compliance with the finding that the systolic length isshorter than the diastolic time for heart tones.
Step 8: Functions extract. Only samples which passed final verification were followed byextracted features.
5.2 Information Collection ModuleA statistical analysis was conducted to classify trends that vary depending on diseases, based
on the characteristic features obtained using the algorithm, and using certain derived features,such as the square of the fourth wavelet information coefficient. For each systole and diastoleseparately, the square of the fourth wavelet information coefficient was computed. For each formof disorder, a range of this value with a trust level of 87 percent was obtained.
5.3 Applying Machine Learning for Abnormal Heartbeat DetectionFig. 7 demonstrates the collection of the classification model with the signal pre-processing
work flowchart and the implementation of the machine learning methods. The heart sound datafrom the collection was segmented into datasets for a model training and testing. Using Python,signal pre-processing and automated segmentation were performed, and the statistics and machinelearning model training and classification of heart tone were performed. The heart sound pre-processing measures are summarized in the review portion. The segmented cardiac sound dataderived multiple time (t)-domain, frequency (f)-domain, and Mel frequency cepstral coefficients(MFCC) characteristics. Before it was fed into the machine learning model for testing, the trainingdataset underwent preprocessing measures.
For classification purpose, we applied k-nearest neighbor classifier. In the study, we usednumber of neighbours and distance as a hyperparameters. We continue to recognize heart soundsafter analyzing and removing the noises in the signals. The findings were issued after detectingregular and irregular heart sounds in Tabs. 1 and 2. We split the dataset into two sections, as wementioned earlier, with 200 irregular to 200 regular heart sounds. In conjunction, 80 percent to20 percent of the training and testing data are broken.

2824 CMC, 2022, vol.70, no.2
Figure 7: Machine learning-based heart tone abnormality detection mechanism flow map
The dataset is separated into a dataset for testing and a validation dataset. In order tominimize the error, the former trains the machine learning model with samples that have instructorprinciples. The above checks the network on examples that it has not “seen,” showing that on freshevidence the model should be utilized. The instruction collection contains 48 impulse responsesand the evaluation set includes 46 for the original pilot analysis of 12 patients.
5.4 ClassificationThe heart sound data was buffered for 10 s for real-time execution and then the baseline drift
was corrected, segmented into heart sound beats and Python 3.5 band-limited filtering. In orderto obtain, buffer, real-time pre-process, and identify the heart sound data on the host machine,a multi-threaded python script was written. Using Numpy, scikit-learn, and Matplotlib libraries,signal pre-processing and segmentation were implemented on a PC. For real-time classificationusing PyBrain and Scikit learn libraries, the best-performing algorithm was then implemented onthe PC.
6 Experiment Results and Analysis
6.1 Hardware and Software User InterfaceSmartphones will encourage regular work for health care through the exponential growth of
mobile technologies. Applications involve the usage of mobile devices to capture clinical data,supply physicians, researchers and patients with diagnostic records, track the vital signs of patientsin real time, and provide direct medical services.
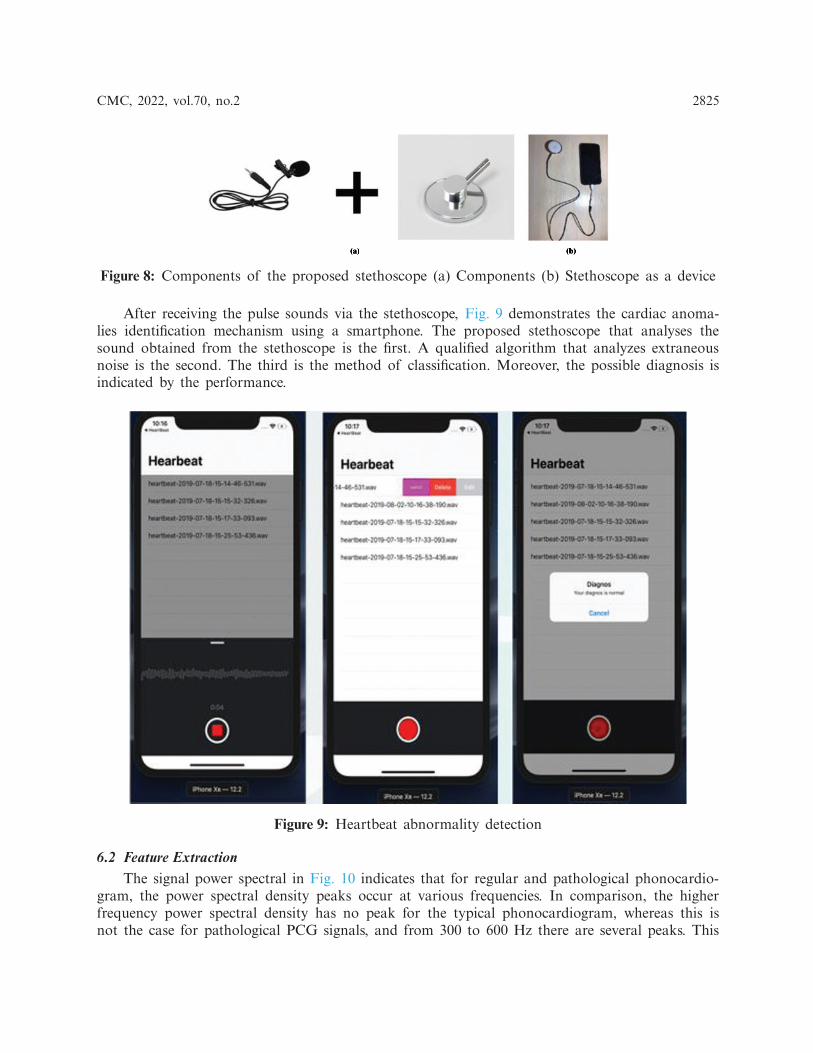
Using the smallest components: a stethoscope, a smartphone application and a portabledevice, the device is constructed as simply as possible. In order to produce sound, an electronicmicrophone is placed into the stethoscope vent. To minimize the noise factor, the hose is blockedat all other ends, except the reception section. Fig. 8 demonstrates components of the proposedstethoscope.
CMC, 2022, vol.70, no.2 2825
Figure 8: Components of the proposed stethoscope (a) Components (b) Stethoscope as a device
After receiving the pulse sounds via the stethoscope, Fig. 9 demonstrates the cardiac anoma-lies identification mechanism using a smartphone. The proposed stethoscope that analyses thesound obtained from the stethoscope is the first. A qualified algorithm that analyzes extraneousnoise is the second. The third is the method of classification. Moreover, the possible diagnosis isindicated by the performance.
Figure 9: Heartbeat abnormality detection
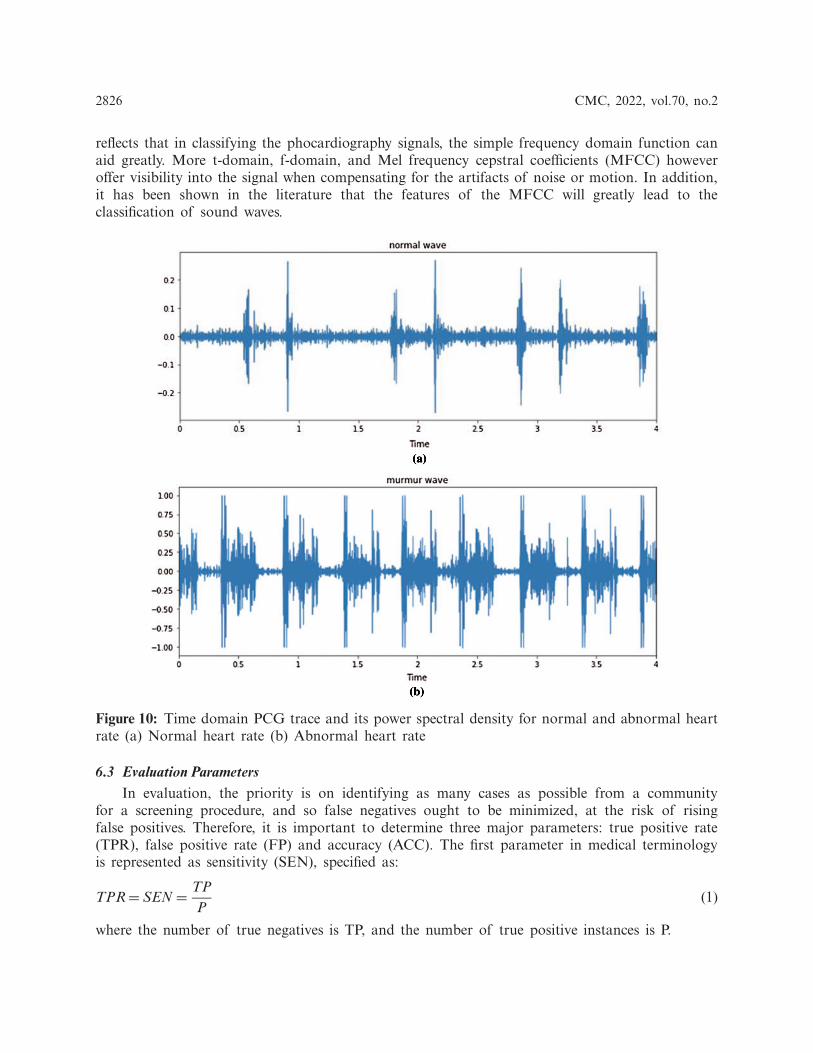
6.2 Feature ExtractionThe signal power spectral in Fig. 10 indicates that for regular and pathological phonocardio-
gram, the power spectral density peaks occur at various frequencies. In comparison, the higherfrequency power spectral density has no peak for the typical phonocardiogram, whereas this isnot the case for pathological PCG signals, and from 300 to 600 Hz there are several peaks. This
2826 CMC, 2022, vol.70, no.2
reflects that in classifying the phocardiography signals, the simple frequency domain function canaid greatly. More t-domain, f-domain, and Mel frequency cepstral coefficients (MFCC) howeveroffer visibility into the signal when compensating for the artifacts of noise or motion. In addition,it has been shown in the literature that the features of the MFCC will greatly lead to theclassification of sound waves.
Figure 10: Time domain PCG trace and its power spectral density for normal and abnormal heartrate (a) Normal heart rate (b) Abnormal heart rate
6.3 Evaluation ParametersIn evaluation, the priority is on identifying as many cases as possible from a community
for a screening procedure, and so false negatives ought to be minimized, at the risk of risingfalse positives. Therefore, it is important to determine three major parameters: true positive rate(TPR), false positive rate (FP) and accuracy (ACC). The first parameter in medical terminologyis represented as sensitivity (SEN), specified as:
TPR= SEN = TPP
(1)
where the number of true negatives is TP, and the number of true positive instances is P.

CMC, 2022, vol.70, no.2 2827
The estimation of the second term, false positive rate, is:
FPR= FPN
(2)
The percentage of false positives is FP, and the cumulative number of negative events in thepopulation is N. This statistic, however, is best interpreted as the ratio of true negative to actualnegative, represented as the specificity (SPEC) in medical terms, which is specified as:
TNR= SPEC = TNN
= 1−FPR (3)
where the number of true negative cases is TN, and the cumulative number of true negative casesis N.
Finally, the equilibrium between true positives and true negatives is defined by precision.Where the number of positive and negative cases is not equivalent, this can be a very beneficialstatistic. This is articulated as:
ACC = TP+TNP+N
(4)
where the definitions follow as before.
Finally, to measure the efficiency of the algorithm and to be used as a way to recordthe maximum sensitivity and minimum FPR together, a ratio between the FPR and TPR wasdeveloped.
R= FPRTPR
(5)
Criteria is set to determine the efficiency of the algorithm and the current state of the ANNis preserved until they are met (i.e., weights, bias and training time). These will refer to each runof the training of the algorithm. The three conditions are:
• Where the ratio of false positives to true positives exceeds a minimum of (initiated when itfalls below 0.7).
• Until full specificity is met.• When the training error has sunk below a point.
The first criteria is to establish that the procedure can be used to reliably diagnose OP casesas a screening method. The second is to analyze whether the strategy is capable of separatingthe healthy subjects well enough and reducing the false negatives and positives. The third is thealgorithm’s stop criterion, which would mean that overfitting is starting to happen.
6.4 Classification ResultsFig. 11 illustrates different types of heartbeats. Normal: healthy heart sounds; Murmur: extra
noises that arise while there is a vibration in the blood supply that creates extra vibrations that canbe heard; Extrahls: supplementary sound; Artifacts: there is a broad variety of various sounds.
Fig. 12 demonstrates model training and validation for abnormal heart rate detection. Thefigure shows the training and validation accuracy results up to 300 epochs. Fig. 13 demonstratestraining loss and validation loss results during the training epochs. After about 100 epochs trainingand validation loss show steady state.

2828 CMC, 2022, vol.70, no.2
(a)
(b) (c)
(d) (e)
Figure 11: Time domain PCG trace and its power spectral density for different types of heartsounds. (a) Artificial mfcc (b) Artificial spectrogram (c) Normal spectrogram (d) Murmur spec-trogram (e) Extrahls spectogram
Figure 12: Model training and validation for abnormal heartbeat detection

CMC, 2022, vol.70, no.2 2829
Figure 13: Evaluation of model training loss and validation loss
Fig. 14 shows confusion matrix when detecting five types of heartbeat condition as nor-mal heartbeat, murmur, extrasystole, extrahls, and artifacts. The results show high accuracy inheartbeat sounds classification and abnormal heartbeat detection.
Figure 14: Confusion matrix for different types of heart sound classification

2830 CMC, 2022, vol.70, no.2
Tabs. 1 and 2 demonstrate classification result of normal and abnormal heart sounds. Asshown in the tables, our model can detect abnormal heartbeats with 93.25% accuracy in testing.
Table 1: Detection of normal cardiac sounds
Normalsounds
Truepositive
Truenegative
Falsenegative
Falsepositive
Sensitivity Accuracy(train)
Accuracy(test)
S1 187 2 6 5 96.89 97 94.5S2 185 3 5 7 97.37 96 92.5Total 372 5 11 12 97.12 96.5 93.5
Table 2: Detection of abnormal cardiac sounds
Abnormalsounds
Truepositive
Truenegative
Falsenegative
Falsepositive
Sensitivity Accuracy(train)
Accuracy(test)
S1 188 3 4 5 97.91 0.98 94S2 185 4 5 6 97.36 0.97 92.5Total 373 7 9 11 97.64 97.5 93.25
7 Discussion
The present invention relates to a method and device for determining the frequency rangesof cardiac noise for the classification of pathological heart murmurs. Having a large database ofverified phonocardiosignals with known pathologies of cardiac activity classified by other methods,it is possible to identify similar signs in the signals of patients with identical diseases, createtemplates of signal sections corresponding to the disease, and add them to the general comparativetemplate.
In order to diagnose cardiac pathology, the paper provides a paradigm for identifying abnor-mal trends in phonocardiograms. The study of audio signals is primarily concerned with issuessuch as signal weakness, limited band bandwidth, noise contamination, randomness, the need toisolate the mixed signals into a single signal, etc. Heart tones are often subject to the law ascomplicated signals. Based on sound perception, heart valve vibrations, the loading and emptyingof ventricles and lungs, and the distortion between these sounds and a small frequency spectrumrender it impossible to diagnose heart-related complications.
The availability of accurate signs, such as ECGs, has, on the other hand, prompted expertsto focus on them for heart disease diagnosis. Although the PCG signal can be used to diagnosemultiple inappropriate disorders and cardiac arrest functions in an inexpensive and simple way asan independent tool. In recent years, while there have been many algorithms for identifying heartsounds, owing to the existence of audio signals, each of them has several barriers.
We must also have a system for segmenting and detecting heart sounds as clinically relevantfragments and defining their correspondence to heart cycles in order to be able to use thephonocardiogram signal as a diagnostic device in the area of heart disease. When the signal isused separately as a diagnostic tool, the importance of this algorithm and method improves,

CMC, 2022, vol.70, no.2 2831
instead of only influencing the ECG signal. Of course, because the complementary technique isused together, it is often appropriate to use one of these approaches.
8 Conclusion
A computerized phonocardiogram, as a non-invasive acoustic system for detecting heartabnormalities, is a useful method for doctors and for patients too. It can also open up oppor-tunities for checking the heart condition of patients through teleconsultation. It should be notedthat, although a digital phonocardiogram alone cannot provide all the information necessary, forexample, to make a decision about the feasibility of heart surgery, it can significantly reduce theunnecessary use of echocardiography, which is a more expensive and time-consuming method.In addition, early diagnosis of heart abnormalities in patients can eliminate the need for furthersurgical operations, if appropriate medical procedures are used.
In this study, we present an electronic stethoscope that receives heart sounds from a patient,processes them, classifies them using machine learning techniques, and as a result, diagnosesthe patient in real time, showing whether a patient has a pathology in the heart or not. Theproposed full functional stethoscope system includes three subsystem as portable digital elec-tronic stethoscope, decision-making system that applied machine learning to classify heart sounds,and subsystem for visualizing and displaying the results in an understandable form. Next maindifference of the proposed system from the other researches is its ability to identify abnormalheart sounds a short period of time with high accuracy. The proposed stethoscope can detectabnormal heartbeat in 15 s. In addition, the proposed stethoscope system does not transmitserver info, because anything on your phone is saved. It is necessary to supply the doctor withaudio recordings without complications. Accuracy has hit 93.5% in normal heartbeat detection,and 93.25% in abnormal heartbeat detection. Thus, the solution of the problem of classificationof phonocardiograms using machine learning methods is currently possible and provides highefficiency.
In conclusion, we would like to conclude that it is very simple and realistic for such technol-ogy. We can enhance the precision of the stethoscope in the future to raise the amount of cardiacdisorders that an intelligent stethoscope will detect.
Funding Statement: The authors received no specific funding for this study.
Conflicts of Interest: The authors declare that they have no conflicts of interest to report regardingthe present study.
References[1] M. E. Chowdhury, A. Khandakar, K. Alzoubi, S. Mansoor, A. Tahir et al., “Real-time smart-digital
stethoscope system for heart diseases monitoring,” Sensors, vol. 19, no. 12, pp. 2781, 2019.[2] M. Elhilali and J. E. West, “The stethoscope gets smart: Engineers from Johns Hopkins are giving the
humble stethoscope an AI upgrade,” IEEE Spectrum, vol. 56, no. 2, pp. 36–41, 2019.[3] M. N. Türker, Y. C. Çagan, B. Yildirim, M. Demirel, A. Ozmen et al., “Smart Stethoscope,” in 2020
Medical Technologies Congress, Izmir, Turkey, pp. 1–4, 2020.[4] Y. J. Lin, C. W. Chuang, C. Y. Yen, S. H. Huang, P. W. Huang et al., “An intelligent stethoscope with
ECG and heart sound synchronous display,” in 2019 IEEE Int. Symp. on Circuits and Systems, Sapporo,Japan, pp. 1–4, 2019.
2832 CMC, 2022, vol.70, no.2
[5] B. Omarov, A. Batyrbekov, A. Suliman, B. Omarov, Y. Sabdenbekov et al., “Electronic stethoscope fordetecting heart abnormalities in athletes,” in 2020 21st Int. Arab Conf. on Information Technology, Giza,Egypt, pp. 1–5, 2020.
[6] V. T. Tran and W. H. Tsai, “Stethoscope-sensed speech and breath-sounds for person identification withsparse training data,” IEEE Sensors Journal, vol. 20, no. 2, pp. 848–859, 2019.
[7] A. A. Shkel and E. S. Kim, “Continuous health monitoring with resonant-microphone-array-basedwearable stethoscope,” IEEE Sensors Journal, vol. 19, no. 12, pp. 4629–4638, 2019.
[8] H. Bello, B. Zhou and P. Lukowicz, “Facial muscle activity recognition with reconfigurable differentialstethoscope-microphones,” Sensors, vol. 20, no. 17, pp. 4904, 2020.
[9] S. Tekin, “Is big data the new stethoscope? Perils of digital phenotyping to address mental illness,”Philosophy & Technology, vol. 1, pp. 1–15, 2020.
[10] K. A. Babu and B. Ramkumar, “Automatic detection and classification of systolic and diastolic profilesof PCG corrupted due to limitations of electronic stethoscope recording,” IEEE Sensors Journal, vol.21, no. 4, pp. 5292–5302, 2020.
[11] V. Arora, R. Leekha, R. Singh and I. Chana, “Heart sound classification using machine learning andphonocardiogram,” Modern Physics Letters B, vol. 33, no. 26, pp. 1950321, 2019.
[12] S. Vernekar, S. Nair, D. Vijaysenan and R. Ranjan, “A novel approach for classification of nor-mal/abnormal phonocardiogram recordings using temporal signal analysis and machine learning,” in2016 Computing in Cardiology Conf., Vancouver, BC, Canada, pp. 1141–1144, 2016.
[13] M. N. Homsi and P. Warrick, “Ensemble methods with outliers for phonocardiogram classification,”Physiological Measurement, vol. 38, no. 8, pp. 1631–1644, 2017.
[14] G. Son and S. Kwon, “Classification of heart sound signal using multiple features,” Applied Sciences,vol. 8, no. 12, pp. 2344, 2018.
[15] M. Chowdhury, A. Khandakar, K. Alzoubi, S. Mansoor, A. Tahir et al., “Real-time smart-digitalstethoscope system for heart diseases monitoring,” Sensors, vol. 19, no. 12, pp. 2781, 2019.
[16] M. Suboh, M. Yaakop, M. Ali, M. Mashor, A. Saad et al., “Portable heart valve disease screeningdevice using electronic stethoscope,” Indonesian Journal of Electrical Engineering and Computer Science,vol. 15, no. 1, pp. 122–132, 2019.
[17] V. Varghees and K. Ramachandran, “Effective heart sound segmentation and murmur classificationusing empirical wavelet transform and instantaneous phase for electronic stethoscope,” IEEE SensorsJournal, vol. 17, no. 12, pp. 3861–3872, 2017.
[18] J. Roy, T. Roy and S. Mukhopadhyay, “Heart sound: Detection and analytical approach towardsdiseases, Smart Sensors,” Measurement and Instrumentation, vol. 29, no. 1, pp. 103–145, 2019.
[19] K. Babu and B. Ramkumar, “Automatic detection and classification of systolic and diastolic profiles ofPCG corrupted due to limitations of electronic stethoscope recording,” IEEE Sensors Journal, vol. 21,no. 4, pp. 5292–5302, 2021.
[20] A. Alqudah, H. Alquran and I. Qasmieh, “Classification of heart sound short records using bispectrumanalysis approach images and deep learning,” Network Modeling Analysis in Health Informatics andBioinformatics, vol. 9, no. 1, pp. 1–16, 2020.
[21] S. Singh, T. Meitei and S. Majumder, “Short PCG classification based on deep learning,” in DeepLearning Techniques for Biomedical and Health Informatics, Basingstoke, United Kingdom, pp. 141–164,2020.
[22] Y. Khalifa, J. Coyle and E. Sejdic, “Non-invasive identification of swallows via deep learning in highresolution cervical auscultation recordings,” Scientific Reports, vol. 10, no. 1, pp. 1–13, 2020.
[23] H. Li, X. Wang, C. Liu, Q. Zeng, Y. Zheng et al., “A fusion framework based on multi-domain featuresand deep learning features of phonocardiogram for coronary artery disease detection,” Computers inBiology and Medicine, vol. 120, no. 25, pp. 103733, 2020.
[24] F. D. L. Hedayioglu, “Heart sound segmentation for digital stethoscope integration,” Master’s Thesis.University of Porto, Porto, Portugal, 2011.
CMC, 2022, vol.70, no.2 2833
[25] H. Li, G. Ren, X. Yu, D. Wang and S. Wu, “Discrimination of the diastolic murmurs in coronaryheart disease and in valvular disease,” IEEE Access, vol. 8, pp. 160407–160413, 2020.
[26] A. Yadav, A. Singh, M. K. Dutta and C. M. Travieso, “Machine learning-based classification of cardiacdiseases from PCG recorded heart sounds,” NeuralComputingandApplications, vol. 32, no. 24, pp. 1–14,2019.
[27] R. Banerjee, S. Biswas, S. Banerjee, A. D. Choudhury, T. Chattopadhyay et al., “Time-frequencyanalysis of phonocardiogram for classifying heart disease,” in 2016 Computing in Cardiology Conf.,Vancouver, BC, Canada, pp. 573–576, 2016.
[28] L. G. Durand and P. Pibarot, “Most recent advancements in digital signal processing of the phono-cardiogram,” Critical ReviewsTM in Biomedical Engineering, vol. 45, no. 1–6, pp. 1–6, 2017.