Embed Size (px)
Citation preview

Sequencing and comparison ofyeast species to identify genesand regulatory elementsManolis Kellis*†, Nick Patterson*, Matthew Endrizzi*, Bruce Birren* & Eric S. Lander*‡
* Whitehead/MIT Center for Genome Research, Nine Cambridge Center, Cambridge, Massachusetts 02142, USA† Department of Computer Science and ‡ Department of Biology, Massachusetts Institute of Technology, Cambridge, Massachusetts 02139, USA
...........................................................................................................................................................................................................................
Identifying the functional elements encoded in a genome is one of the principal challenges in modern biology. Comparativegenomics should offer a powerful, general approach. Here, we present a comparative analysis of the yeast Saccharomycescerevisiae based on high-quality draft sequences of three related species (S. paradoxus, S. mikatae and S. bayanus). We firstaligned the genomes and characterized their evolution, defining the regions and mechanisms of change. We then developedmethods for direct identification of genes and regulatory motifs. The gene analysis yielded a major revision to the yeast genecatalogue, affecting approximately 15% of all genes and reducing the total count by about 500 genes. The motif analysisautomatically identified 72 genome-wide elements, including most known regulatory motifs and numerous new motifs. Weinferred a putative function for most of these motifs, and provided insights into their combinatorial interactions. The results haveimplications for genome analysis of diverse organisms, including the human.
Extracting the complete functional information encoded in agenome—including the genic, regulatory and structural elements—is a central challenge in biological research. Ideally, one would be ableto extract this information directly from the DNA sequence itselfwithout recourse to extensive experimentation. At present, however,our ability to directly interpret genomes is rudimentary.
De novo identification of the complete set of protein-codingsequences remains imperfect, even in well-studied organisms withcompact genomes. The yeast Saccharomyces cerevisiae, for example,has enjoyed a complete genome sequence since 1996 (ref. 1).However, the number of biologically significant open readingframes (ORFs) has been the subject of considerable debate2–6—with proposed counts ranging from roughly 4,800 to 6,400. Thesituation is worse for organisms with large, complex genomes, suchas mammals. Because the results of de novo gene prediction are notsufficiently reliable, gene identification is typically based on acomparison of genomic sequence to known messenger RNA tran-scripts or to genes in other organisms7.
Direct identification of the repertoire of regulatory elements in agenome is even more challenging. The best approach so far hasrelied on clustering genes into functionally related subsets (forexample, genes with a common biochemical function or coordi-nated transcription) and then searching for common sequencemotifs in the general vicinity of the genes (for example, usingcomputer programs such as MEME8 or AlignACE9; reviewed inref. 10). However, the approach has notable drawbacks. It requiresextensive prior knowledge about gene function, which is often notavailable and never comprehensive, and is inherently limited in itsability to extract information from a single genome.
Comparative genome analysis of related species should provide apowerful and general approach for identifying functional elementswithout previous knowledge of function. Because evolution relent-lessly tinkers with genome sequence and tests the results by naturalselection, such elements should stand out by virtue of having agreater degree of conservation across related species. The approachhas the advantage that one can increase its power by increasing thenumber of species studied.
Recent studies have demonstrated the potential power of com-parative genomic comparison. Cross-species conservation has
previously been used to identify putative genes or regulatoryelements in small genomic regions11–14. Light sampling of whole-genome sequence has been studied as a way to improve genomeannotation5,15. Complete microbial genomes have been comparedto identify pathogenic and other genes16–19. Genome-wide com-parison has been used to estimate the proportion of the mammaliangenome under selection7.
The goal of this paper is to develop and apply general approachesfor systematic analysis of protein-coding and regulatory elementswithin any genome by means of whole-genome comparisons withseveral related species. We focused on S. cerevisiae, because it is thebest-studied eukaryote and thus provides the best setting to test theapproach. High-quality draft genome sequences from three relatedSaccharomyces species were produced, aligned and analysed toidentify protein-coding genes and regulatory elements.
The comparative analysis indicates that S. cerevisiae contains only5,538 genes encoding $100 amino acids. It proposes the elimin-ation of about 500 previously annotated ORFs; the merger of 33pairs of consecutive genes; the redefinition of start or stop codons inat least ,300 cases; and the existence of ,60 new introns. It alsoidentifies 188 genes encoding between 50 and 99 amino acids,including 43 that had previously escaped notice.
Analysis of intergenic regions reveals 72 well-conserved sequencemotifs that occur frequently throughout the yeast genome. The setincludes most known regulatory motifs, together with a comparablenumber of previously uncharacterized motifs. We also identifiedcombinatorial relationships among these motifs.
The results demonstrate that comparative genomic analysis ofmultiple related species has substantial power to identify keyfunctional elements without previous biological knowledge.
Genome structure and evolution
Genome sequencingSaccharomyces paradoxus, S. mikatae and S. bayanus, which areseparated from S. cerevisiae by an estimated 5–20 million years ofevolution, were selected for sequencing on the basis of theirphylogeny. The three species were found to have sufficient sequence
articles
NATURE | VOL 423 | 15 MAY 2003 | www.nature.com/nature 241© 2003 Nature Publishing Group

similarity to S. cerevisiae to allow orthologous regions to be alignedreliably, but sufficient sequence divergence to allow many functionalelements to be recognized by their greater degree of conservation bya four-way species comparison. All three are members of theSaccharomyces sensu stricto group.
For each species, we generated about sevenfold redundant cover-age in paired end sequences from a whole-genome shotgun plasmidlibrary (see Methods). The information was then assembled withthe Arachne computer program20 into contigs (continuous blocksof uninterrupted sequence) and scaffolds (contigs linked by pairedforward–reverse reads from the same plasmid) to yield a draftsequence (Table 1).
The draft genome sequence of each species has long-rangecontinuity (N50 scaffold length of 230–500 kilobases (kb), ascompared with 942 kb for the finished sequence of S. cerevisiae),relatively short sequence gaps (0.6–0.8 kb, which is small comparedwith a typical gene), and contains most of the genome (,95%). Thedata are freely available through public sequence databases andthrough the Saccharomyces Genome Database (SGD) maintained atStanford (http://genome-www.stanford.edu/Saccharomyces/).
Genome alignmentWe sought to align the S. cerevisiae genome with that of each of theother three species. The first step was to produce a large-scalealignment of genomic regions. Each ORF in S. cerevisiae (a total of6,235 ORFs in the current SGD annotation; see below) was analysedrelative to each of the three related species to determine whether ithad a clear one-to-one match, multiple ambiguous matches or nomatch (see Methods). The one-to-one matches were used asorthologous landmarks to define the large-scale alignment, whichshowed strong conservation of synteny across the species (seebelow). The second step involved generating local nucleotide-levelalignments around each orthologous ORF (see Methods).
Genome evolution at large scaleMost ORFs have clear one-to-one orthologous matches in eachspecies, providing a dense set of landmarks (average spacing ,2 kb)to define blocks of conserved synteny covering essentially the entiregenome (Fig. 1). For a small number of ORFs (211), thecorrespondence is ambiguous, however. These ambiguous matchesalmost all reflect local gene-family expansion or contraction.
Most of the ambiguities are markedly clustered in telomericregions (Fig. 2). More than 80% fall into one of 32 clusters of twoor more genes (average size ,18 kb, together comprising ,4% ofthe genome), which correspond nearly perfectly to the 32 telomericregions of the 16 chromosomes of S. cerevisiae. Only one telomericregion lacks a cluster (chromosome VI-R). And only one clusterdoes not lie in telomeric regions in S. cerevisiae: it is a recentinsertion of a segment that is telomeric in the other three species.
The rapid structural evolution in the telomeric regions can also
be observed at the gene level. The gene families contained withinthese regions (including the HXT, FLO, PAU, COS, THI and YRFfamilies) show significant changes in number, order and orien-tation. The regions also harbour many new sequences, includingprotein-coding sequences, in the four yeasts (see below). Moreover,the telomeric regions have undergone 11 reciprocal translocationsacross the species.
Together, these features define relatively clear boundaries for thetelomeric regions on all 32 chromosome arms, with sizes rangingfrom ,7 kb to ,52 kb on chromosome I-R (Fig. 2). The extraordi-nary genomic churning occurring in these regions probably has akey role in rapidly creating phenotypic diversity over evolutionarytime. A high degree of variation in telomeric gene families has alsobeen reported in Plasmodium falciparum21, the parasite responsiblefor malaria, and is related to antigenic variation.
Outside of the telomeric regions, few genomic rearrangementsare found relative to S. cerevisiae (see Methods). We enumerated allnon-telomeric rearrangements affecting multiple consecutive genes(Fig. 2). Saccharomyces paradoxus shows no reciprocal transloca-tions, four inversions and three segmental duplications; S. mikataeshows four reciprocal translocations and 13 inversions; S. bayanushas five reciprocal translocations and three inversions. The resultsconfirmed four recently reported reciprocal translocations in thesespecies, identified by pulsed-field gel electrophoresis22, and identi-fied four additional reciprocal translocations that had been missed.
The sequence at the chromosomal breakpoints suggested thepossible mechanism that underlies the rearrangements. Notably, the20 inversions are all flanked by transfer RNA genes in oppositetranscriptional orientation and usually of the same isoacceptor type;the origins of inversions in recombination between tRNA genes hasnot been noted previously. The reciprocal translocations occurredbetween Ty elements in seven cases and between highly similar pairsof ribosomal protein genes in two cases; the implication of Tyelements in reciprocal translocation is consistent with previousreports22–25. One segmental duplication involves ‘donor’ and ‘reci-pient’ regions that are descendants of an ancient duplication in theyeast genome26. Differential gene loss of anciently duplicated geneshas been reported previously27, but this is the first observation of arecent re-duplication event within anciently duplicated regions.
Genome evolution at the nucleotide levelWith sequence alignments at millions of positions across the fourspecies, it is possible to obtain a precise estimate of the rate ofevolutionary change, including substitutions and insertions ordeletions (indels), in the phylogenetic tree connecting the species(Fig. 3; see also Supplementary Information and http://www-genome.wi.mit.edu/seq/Saccharomyces/). Using S. bayanus as anoutgroup, the substitution rate is similar in S. cerevisiae andS. mikatae, but is ,67% lower in the lineage leading toS. paradoxus. We compared the rate of sequence change at alignedsites across the four species in intergenic and genic (defined here asprotein-coding) regions. The proportion of sites corresponding to adifferent nucleotide in at least one of the three species is 58% inintergenic regions but only 30% in genic regions—a difference ofabout twofold. The proportion of sites corresponding to an inser-tion or deletion (indel) is 14% in intergenic regions, but only 1.3%in genic regions. The contrast is even sharper when one considersonly indels with length not a multiple of three (which would disrupta reading frame): 10.2% in intergenic regions versus 0.14% in genicregions—a difference of about 75-fold.
The four genomes show tremendous conservation of synteny andthey can be well aligned at the nucleotide level. The overall rate ofsequence divergence across the species seems to be high enough tofacilitate recognition of functional elements, and the marked con-trast between intergenic and genic regions should allow for greatlyimproved gene identification.
Table 1 Genome assemblies of four Saccharomyces species
S. cerevisiae S. paradoxus S. mikatae S. bayanus.............................................................................................................................................................................
Sequence coverage (fold) Finished 7.7 5.9 6.4Genome sequence in contigs
(Mb)*12.16 11.57 11.22 11.32
Genome length, including gaps(Mb)†
12.16 11.75 12.12 11.54
Percentage of genome incontigs
100 98 93 98
Number of scaffolds 16 51 90 100N50 scaffold length (kb) 942 509 334 234N50 contig length (kb) 942 51 20 25Gaps per 100 kb 0 3.2 10.3 4.4Average gap length (bp) 0 583 847 679.............................................................................................................................................................................
*Sum of contig lengths.†Sum of scaffold lengths, including contig lengths and estimated gap sizes between consecutivecontigs.
articles
NATURE | VOL 423 | 15 MAY 2003 | www.nature.com/nature242 © 2003 Nature Publishing Group
Identification of genesDe novo identification of protein-coding genes from genomicsequence is extremely important, yet surprisingly challenging. Thebasic approach is to identify ORFs that are too long to have occurredby chance. However, stop codons occur at a frequency of only about1 in 20 in random sequence. Thus, ORFs of $60 amino acids willoccur frequently by chance (,5% under a simple Poisson model)and even ORFs of $150 amino acids (or 450 base pairs (bp)) willappear by chance in a large genome (approximately 0.05%). Thisposes a huge challenge for higher eukaryotes, in which genes aretypically broken into many small exons (typical size ,125 bp forinternal coding exons in mammals28). Yeast genes typically containfewer and larger exons, but nonetheless there are many true exonsencoding #150 amino acids and it can be difficult to discriminatethese from randomly occurring ORFs.
Comparative genomic analysis provides a simple solution: testthe ORFs seen in one species by observing whether the orthologoussequence in related species also encodes an ORF. True protein-coding ORFs will typically be under strong selective pressure topreserve the open reading frame, whereas spurious ORFs willaccumulate frameshifts and stop codons. We applied this idea toperform de novo gene identification in S. cerevisiae. We started withthe list of all ORFs greater than a given size, compared the list to thethree related species and generated a yeast gene catalogue.
Public yeast gene catalogueWhen the yeast genome sequence was completed1, the authorsidentified 6,275 ORFs in the nuclear genome that could theoreti-cally encode proteins of $100 amino acids and that do not overlap alonger ORF by more than half of their length. SGD has sinceupdated the catalogue on the basis of complete resequencing andre-annotation of chromosome III, re-analysis of other chromo-somes and reports in the scientific literature. This resulted in acurrent version (as of May 2002) with 6,062 ORFs encoding $100amino acids, consisting of 3,966 ‘named’ genes (described in at leastone publication) and 2,096 ‘uncharacterized’ ORFs. SGD alsoincludes a small collection of ORFs encoding ,100 amino acids(see below).
Reading frame conservation testWe developed a reading frame conservation (RFC) test to classifyeach ORF in S. cerevisiae as biologically meaningful or meaningless,
on the basis of the proportion of the ORF over which reading frameis locally conserved in each of the other three species (see Methods).For overlapping ORFs in the S. cerevisiae genome (n ¼ 948), theRFC was calculated only for the portion unique to each overlappingORF. For spliced genes (n ¼ 240), the RFC was calculated only onthe largest exon.
Figure 4 illustrates the case of an ORF of 333 bp that is clearlybiologically meaningless. The orthologous sequence in all fourspecies is laden with frameshifts (as well as stop codons).
The RFC scores show a clearly bimodal distribution for each of thethree species, allowing a decision threshold to be defined for eachspecies to accept an ORF as biologically meaningful or reject an ORFas spurious; that is, occurring by chance. Each species thus ‘votes’ onthe validity of each ORF (or ‘abstains’ due to lack of orthologoussequence resulting from either incomplete sequence coverage orgenomic rearrangement in the species). The votes from the speciesare then tallied to reach a decision for each ORF (see Methods).
To investigate the power of the approach to reject spurious ORFs,we applied it to a set of control sequences consisting of 340intergenic sequences in S. cerevisiae with lengths similar to theORFs tested. About 96% were rejected as having conservationproperties incompatible with a biologically meaningful ORF, show-ing that the test has high sensitivity. Of the remaining 4% that werenot rejected, close inspection shows that three-quarters seem tocontain true ORFs. Some define short ORFs with conserved startand stop codons in all four species, and others extend S. cerevisiaeORFs in the 5 0- or 3 0-direction in each of the other three species (seebelow). Thus, at most, 1% of true intergenic regions failed to berejected by the RFC test.
Evaluating ORFsWe sought to apply the RFC test to all 6,062 ORFs in SGD. A total of117 could not be analysed because they were almost completelycontained within an overlapping ORF (99 cases, with average non-overlapping portion of 12 bp) or because an orthologous regioncould not be unambiguously defined in any of the species (18 cases).
Of the 5,945 ORFs tested, the analysis strongly validated 5,550ORFs. The vote was unanimous in 5,458 cases (,98%). In theremaining cases, a valid gene appears to have degenerated in oneof the four species. A total of 367 ORFs were strongly rejected.These rejections were unanimous in 63% of cases. In most of theremaining cases, S. paradoxus was too closely related to S. cerevisiae
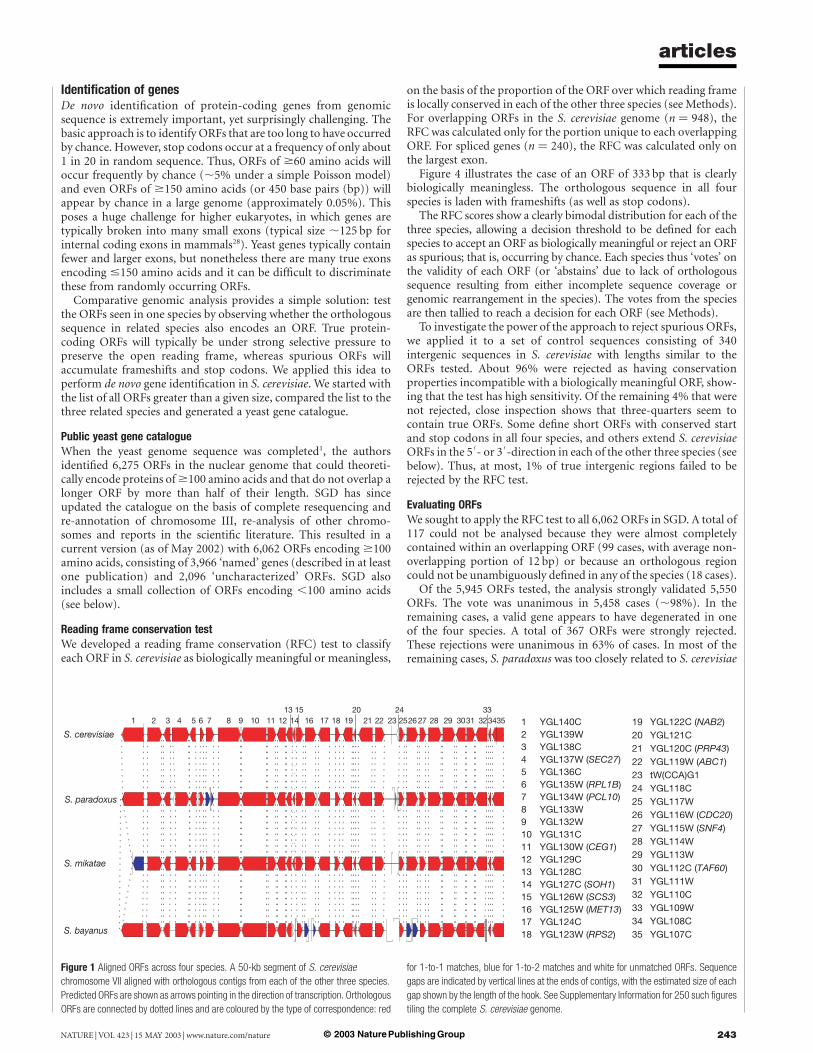
Figure 1 Aligned ORFs across four species. A 50-kb segment of S. cerevisiae
chromosome VII aligned with orthologous contigs from each of the other three species.
Predicted ORFs are shown as arrows pointing in the direction of transcription. Orthologous
ORFs are connected by dotted lines and are coloured by the type of correspondence: red
for 1-to-1 matches, blue for 1-to-2 matches and white for unmatched ORFs. Sequence
gaps are indicated by vertical lines at the ends of contigs, with the estimated size of each
gap shown by the length of the hook. See Supplementary Information for 250 such figures
tiling the complete S. cerevisiae genome.
articles
NATURE | VOL 423 | 15 MAY 2003 | www.nature.com/nature 243© 2003 Nature Publishing Group

to have accumulated enough frameshifts to allow definitiverejection.
Only 15 of these rejections involve one of the 3,966 named ORFs.We carefully inspected these 15 ORFs (KRE20, KRE21, KRE23,KRE24, VPS61, VPS65, VPS69, BUD19, FYV1, FYV2, FYV12,API2, AUA1, ICS3, UTR5 and YIM2) and concluded that all wereindeed likely to be spurious. Most lack experimental evidence. Forthe remainder, reported phenotypes associated with deletion of theORF seem likely to be explained by the fact that the ORF overlapsthe promoters of other known genes. The method thus rejects fewknown genes, indicating that it has high specificity.
Most of the rejections (352, or 96%) involve uncharacterizedORFs. Most of these (209) overlap another well-conserved ORF, but
show many insertions and deletions in the non-overlapping por-tion. The remainder (147) tend to be small (median of 111 aminoacids, with 93% #150 amino acids) and show atypical codonusage1,29,30. With only one exception, SGD reports no compellingbiological evidence (such as changes in mRNA expression) tosuggest that these ORFs encode a true gene. The one exception isYBR184W, which appears to represent a true gene that fails the RFCtest because it is evolving very rapidly (see below).
The analysis deadlocked (one confirmation, one rejection, oneabstention) for 28 ORFs (0.5%). Together with the 117 cases thatcould not be analysed, the RFC analysis thus produced clear resultsfor all but 145 ORFs. We inspected these cases individually andfound convincing evidence (on the basis of conservation of amino
Figure 2 Genome evolution. Locations in the S. cerevisiae genome of chromosomal
rearrangements in each of the three species are shown by vertical bars with the symbol at
the top indicating the type of rearrangement (inversions, insertions and translocations)
and colour indicating the species. Tick marks are shown every 50 kb. Inverted segments
are small and their endpoints are indistinguishable at this scale. All inversions are flanked
by tRNA genes in opposite transcriptional orientation. Reciprocal translocations involve
exchange between two breakpoints; the matching pairs are indicated by their common
numbering and the orientation of the arrowheads. All non-telomeric translocations are
mediated by Ty elements (2, 4, 5, 6, 7, 8, 9) or nearly identical copies of ribosomal protein
genes (1, 3). Location in the S. cerevisiae genome of genes whose correspondence in the
other species is ambiguous is shown by dots, with colour indicating the species in which
the ambiguity occurs. A gene whose correspondence is ambiguous in all three species
thus appears as three dots of different colours. Clusters of ambiguous genes are denoted
by purple horizontal bars; 31 of 32 clusters occur at telomeres.
articles
NATURE | VOL 423 | 15 MAY 2003 | www.nature.com/nature244 © 2003 Nature Publishing Group

acids, start and stop codons, and the presence of indels) that 20 arevalid protein-coding genes and 105 are spurious. We were unable toreach a judgment in the remaining 20 cases.
Finally, we performed certain consistency checks on the acceptedORFs. In 32 cases, two adjacent ORFs in S. cerevisiae are joined into asingle ORF in all three other species. In every case, a single nucleotidechange would suffice to join the ORFs in S. cerevisiae (either asubstitution altering a stop codon or an indel altering the readingframe). In principle, these cases could represent errors in the genomesequence, mutations private to the sequenced strain S288C, orsubstitutions fixed in S. cerevisiae. We examined 19 cases byresequencing the relevant region in S288C. Our results revealed anerror in the published sequence in 11 cases (establishing that there is asingle ORF in S288C) and confirmed the published sequence in theremaining seven cases. Sequencing of additional strains will berequired to determine whether these remaining cases representdifferences in the S288C strain alone or in S. cerevisiae in general.
We also found two named ORFs (FYV5 and CWH36) that passthe RFC test and cause phenotypes when deleted, but show nosignificant protein similarity across the four species. In both cases,inspection reveals that the opposite strand encodes a protein thatshows strong amino-acid conservation. (The latter gene has twointrons, increasing the count of doubly spliced genes to eight.) Ineach case, we postulate that the protein responsible for the reporteddeletion phenotype is encoded on the opposite strand.
Revised yeast gene catalogueOn the basis of the analysis above, we propose a revised yeast genecatalogue consisting of 5,538 ORFs encoding proteins of $100amino acids. This reflects the proposed elimination of 503 ORFs(366 from the RFC test, 105 by manual inspection and 32 throughmerger). A total of 20 ORFs in SGD remain unresolved. Completeinformation about the gene catalogue is provided in SupplementaryInformation and will be discussed more fully in a subsequentmanuscript in collaboration with SGD and other yeast investigators.The revised gene count is consistent with at least two recentpredictions based on light shotgun coverage of related species5,6.
We believe that this represents a reasonably accurate descriptionof the yeast gene set, because the analysis examines all ORFsencoding $100 amino acids, the methodology has high sensitivity
and specificity, and the evidence is unambiguous for most of theORFs. Nonetheless, some errors are likely to remain. The resultscould be confirmed and remaining uncertainties resolved bysequencing of additional related yeast species, as well as by otherexperimental methods.
Analysis of small ORFsSGD also lists 141 ORFs encoding 50–99 amino acids for whichsome biological evidence has been published. Applying the RFC testand inspecting the results, we conclude that 120 seem to be truegenes, 18 seem to be spurious ORFs and three remain unresolved.
We systematically searched the remainder of the S. cerevisiaegenome and evaluated all ORFs in this size range. Control experi-ments demonstrated that the RFC test has high power to discrimi-nate reliably between valid and spurious ORFs in this size range (seeSupplementary Information). The genome contains 3,161 suchORFs; nearly all are readily rejected by the RFC test. However, 43new genes were identified. These ORFs not only pass the RFC test,but they also have orthologous start and stop codons (see Methods).Five of these have been reported in the literature subsequent to theSGD release studied here.
SGD also lists 32 ORFs encoding ,50 amino acids. We did notundertake a systematic search for all such ORFs, because controlexperiments showed that the RFC test lacked sufficient power toprove the validity of such small ORFs (see Supplementary Infor-mation). However, it is able to reject seven of the 32 ORFs asprobably spurious. Our yeast gene catalogue thus contains 188 shortgenes (encoding ,100 amino acids), of which 43 are new.
Defining gene structureComparative genome analysis not only improves the recognition oftrue ORFs, it also yields much more accurate definitions of genestructure—including translation start, translation stop and intronboundaries.
Previous annotation of S. cerevisiae has defined the start oftranslation as the first in-frame ATG codon. However, the actualstart of translation could lie 3
0to this point or (if sequencing errors
or mutations have obscured an earlier in-frame ATG codon) 5 0 tothis point. We identified 210 cases in which the presumed transla-tional start in S. cerevisiae does not correspond to the first in-framestart codon in at least two of the three other species (see Methods).In most of these cases, inspection of the sequence alignmentsprovides strong evidence for an alternative conserved position forthe translational start, either 3 0 or 5 0 to the previous annotation(Fig. 5a, b). We examined four cases in which the comparative datasuggested an earlier start codon and found, by resequencing, that allcorrespond to errors in the published sequence of S288C.
Similarly, we identified 330 cases in which the presumed transla-tional stop codon in S. cerevisiae does not correspond to the firstin-frame stop codon in at least two of the three species. In about25% of these cases, the other three species share a common stop
Figure 3 Evolutionary tree of the four yeast species. Branch lengths denote number of
substitutions per site in genic (a) and intergenic (b) sequence. Pairwise distances were
calculated using the Kimura two-parameter model and trees were constructed using the
UPGMA method. The relative rate of the closest species was computed using the
neighbour-joining method. On the basis of single-species changes in four-way
alignments, we found S. paradoxus to evolve 67% slower than S. cerevisiae in coding
regions and 70% slower in intergenic regions. In coding regions, the average nucleotide
per cent identity to S. cerevisiae is 90% for S. paradoxus, 84% for S. mikatae and 80% for
S. bayanus. In intergenic regions, the nucleotide per cent identity is, respectively, 80%,
70% and 62% for the three species. Additional information can be found in
Supplementary Information. The nucleotide substitution level in aligned intergenic
nucleotides between S. cerevisiae and S. bayanus corresponds roughly to that between
human and mouse. Ribosomal DNA sequence analysis suggests divergence times of
5–20 million years for the four species.
Figure 4 Spurious ORF rejected by RFC test. Schematic representation of the multiple
sequence alignment of ORF YDR102C. Aligned nucleotides across the four species are
shown as stacked squares (S. cerevisiae, S. paradoxus, S. mikatae and S. bayanus,
respectively) coloured by their conservation: green for conserved positions, yellow
otherwise. Alignment gaps are shown in white and frame-shifting insertions (length not a
multiple of 3) are shown in red. In addition to the abundance of frame-shift indels shown
here, numerous in-frame stop codons are observed in the other three species. Full
nucleotide sequence alignment is provided in Supplementary Information.
articles
NATURE | VOL 423 | 15 MAY 2003 | www.nature.com/nature 245© 2003 Nature Publishing Group

codon, and a single base change to the S. cerevisiae sequence wouldresult in a stop codon in the corresponding location (Fig. 5c, d). Weexamined 17 such cases and found that 15 are explained by errors inthe published sequence of S288C. The remaining 75% of cases seemto represent true differences in the location of the translationalstop across the species. Thus, stop codons seem to show moreevolutionary variability in position than start codons.
New intronsWe also examined the conservation of introns in the yeast genome.We studied 218 of the 240 ORFs reported in SGD to contain at leastone intron (omitting the rest primarily due to lack of an ortholo-gous alignment).
In 92% of cases, the donor, branchpoint and acceptor sites wereall strongly conserved with respect to both location and sequence.Moreover, exon boundaries closely demarcated the domains ofsequence conservation as measured by both nucleotide identityand absence of indels.
Discrepancies were found in 17 cases, of which at least ninestrongly suggest that the previous annotation is incorrect. Fiveidentify a new first exon (Fig. 5e) and four predict that a previouslyannotated intron is spurious.
We then sought to identify previously unrecognized introns bysearching the S. cerevisiae genome for conserved splicing signals (seeMethods) and then visually inspecting each case. We predict 58 newintrons. Fifty cases affect the structure of known genes (definingnew 5
0exons in 42 cases, 3
0exons in seven cases and an internal
splice in one case) and two indicate the presence of new genes. Therelationship of the apparent splice signals to existing genes is unclearfor the remaining six cases.
We compared our predictions to the results of experimentalstudies by Ares and colleagues to identify new introns usingtechniques such as microarray hybridization31. Of our 58 predictedintrons, 20 were independently discovered by this group. Of the four
annotated introns predicted to be spurious, all four show noexperimental evidence of splicing. Our remaining predictions arecurrently being tested in collaboration with Ares and colleagues.
Despite the intensive study of S. cerevisiae so far, comparativegenome analysis points to the need for a major revision of the yeastgene catalogue, affecting more than 15% of all ORFs. Moreover, theresults suggest that comparative analysis of a modest collectionof species can permit accurate definition of genes and theirstructure.
Rapid and slow evolution of genesComparative genomic approaches for gene identification requirethat orthologues can be recognized and aligned in most of therelated species. Difficulties could arise in cases of rapid evolution,including the acquisition or loss of entire genes, the rapid diver-gence of nucleotide sequence or the presence of large insertions. Wecharacterized such events in the four yeast species.
Species-specific genesWe noted above that S. cerevisiae contains 18 genes for which wecould not identify orthologues in any of the other species, of whichseven encode $200 amino acids. These may be species-specificgenes in S. cerevisiae, but alternatively could simply reflect gaps inthe available draft genome sequences.
This uncertainty does not arise, however, in the reverse directionin identifying genes in the related species that lack an orthologue inS. cerevisiae. We found a total of 35 such ORFs encoding $200amino acids (with the minimum length chosen to ensure that theseare likely to represent valid genes). The list includes five genesunique to S. paradoxus, eight genes unique to S. mikatae (two ofwhich are 99% identical) and 19 genes unique to S. bayanus (three ofwhich form a gene family with $90% pairwise identity). There isalso one gene represented by orthologous ORFs found in the latter
Figure 5 Examples of proposed changes in gene structure. Representation of alignments
as in Fig. 4 (see Supplementary Information for full nucleotide alignments). Exon locations
are indicated by overhead bars. Dark blue bars indicate portions of annotated exons
unchanged in our analysis, and dark blue arrows indicate the continuation of ORFs beyond
the alignment shown; light blue bars indicate new 50or 3
0extensions of exons (in a and c)
and a new first exon (in e); grey bars indicate rejected portions of previously annotated
exons (in b and d). Black triangles indicate the predicted errors in the published sequence
of S288C; these predictions were confirmed by resequencing. In all five cases the
proposed change leads to perfect agreement in ORF boundaries across all four species.
a, Start moved upstream for SAP155. Elimination of a single base in the S. cerevisiae
sequence extends the ORF 74 amino acids in the 50
direction, with a conserved start
codon. Resequencing confirmed that the published sequence of S288C is in error. b, Start
moved downstream for YBP14. No change to the S. cerevisiae sequence is required. The
comparative data suggest that the true translation start is not until the second in-frame
ATG: the first ATG is not conserved and multiple frame-shifting indels are found in the
rejected portion. c, Stop moved downstream for YJL160C. Elimination of a single base in
the S. cerevisiae sequence extends the ORF by 108 amino acids in the 30direction, with
an orthologous stop codon in all four species. Resequencing confirmed that the published
sequence of S288C is in error. d, Stop moved upstream for YIP4. Comparative data
suggest a shorter ORF with an orthologous stop codon in all four species. The previously
annotated stop codon is not conserved, and multiple frame-shifting indels are found in the
rejected portion. All three predicted errors in the published sequence of S288C were
confirmed by resequencing. e, Changed first exon for RPL26B. No change to the
S. cerevisiae sequence is required. S. paradoxus sequence not shown. Conservation of
splice donor and branchpoint suggests an alternative to the previously annotated exon 1
that shows no conservation of start codon or splice donor and that has accumulated
numerous mutations and frame-shifting indels.
articles
NATURE | VOL 423 | 15 MAY 2003 | www.nature.com/nature246 © 2003 Nature Publishing Group

two species only, and one represented by orthologous ORFS in allthree related species.
These species-specific ORFs are notable with respect to bothfunction and location. Most (63%) can also be assigned biologicalfunction on the basis of strong protein-sequence similarity withgenes in other organisms. Most involve sugar metabolism and generegulation (including one encoding a silencer protein). Themajority (69%) are found in telomeric regions and an additionalset (17%) are immediately adjacent to Ty elements; these locationsare consistent with rapid genome evolution.
A coincidence was noted in the region between YFL014W andYFL016W in S. cerevisiae. In the orthologous regions in all fourspecies, we find a species-specific ORF in every case (165, 111, 136and 228 amino acids), but these four ORFs show little similarity atthe protein level. The amino-acid sequence has been disrupted byframe-shifting indels, but a long ORF has been maintained in eachcase. The explanation for this phenomenon is unclear, but mayprove interesting.
Rapidly evolving genesThe gene analysis described above rejected only a single ORF(YBR184W) that is clearly biologically meaningful. The explanationseems to be that the gene is evolving rapidly. The region containingYBR184W corresponds to a large ORF in all four species (524, 558,554 and 556 amino acids), but the alignment shows unusually lowsequence conservation. The sequence has only 32% nucleotideidentity and 13% amino-acid identity across the four species.Pairwise alignments across the species show numerous insertionsand deletions, explaining why the gene failed the RFC test. (Notably,multiple alignment of all four species simultaneously improves thealignment sufficiently to allow the gene to pass the RFC test; thissuggests a way to improve the test.)
The rapid divergence is suggestive of a gene under strong positiveselection. We tested this hypothesis by calculating the Ka /Ks ratio(the normalized ratio of amino-acid-altering substitutions to silentsubstitutions), a traditional test for positive selection32. Whereastypical genes in S. cerevisiae show a Ka /Ks ratio of 0.11 ^ 0.02,YBR184W has a ratio of 0.689. This ratio ranks as the third highestobserved among all yeast genes (if three small domains with highconservation are excluded, the ratio rises to 0.774). The two geneswith higher K a/K s ratio are YAR068W, a putative membraneprotein, and YER121W, whose expression changes under stress.
The protein encoded by YBR184W has not been studied exten-sively, but expression studies show that the gene is induced duringsporulation33, and sequence analysis shows that it is similar to thegene YSW1, which encodes a spore-specific protein. This is con-sistent with the observation that many of the best-studied examplesof positive selection in other organisms are genes related to gametefunction.
Evidence of rapid protein changeMost of the nucleotide changes in protein-coding regions are silentor affect individual amino acids. However, a small number of eventssuggest additional mechanisms of rapid protein change. These eventsinclude closely spaced compensatory indels that affect the translationof small contiguous amino-acid stretches. They also include the lossand gain of stop codons (by a nucleotide substitution or a frame-shifting indel), which may result in the rapid change of proteinsegments or the translation of previously non-coding regions34. Suchevents are observed more frequently near telomeric regions and mayaffect silenced genes or recently inactivated pseudogenes.
Furthermore, we found a small number of differences in thelength of orthologous proteins. These typically involve changes inthe copy number of tri-nucleotide repeats, such as (CAA), whichencodes hydrophobic stretches often involved in protein–proteininteractions. The most marked example is seen for the TFP1 gene,which encodes a vacuolar ATPase. The S. cerevisiae gene contains an
insertion of 1,400 bp that is absent in the three related species. Theinsertion corresponds to the recent horizontal transfer of a knownpost-translationally self-splicing intein, Vma1 (ref. 35).
Slowly evolving genesTo complement the analysis of rapidly changing genes, we scannedthe genome for genes with an unusually slow rate of evolution. Onecase stands out as an extreme outlier: the mating-type gene MATa2.The gene shows perfect 100% conservation at the amino-acid levelover its entire length (119 amino acids) across all four species. Morenotably, the gene shows perfect 100% conservation at the nucleotidelevel as well (357 bp). This differs sharply for the typical pattern seenfor protein-coding genes, which show relaxed constraint in thirdpositions of codons.
Notably, the MATa2 gene is the only one of the four mating-typegenes (the others being MATa1, MATa2 and MATa1) whosebiochemical function remains unknown despite two decades ofresearch36. An important clue may be that the sequence of MATa2is identical in all four species to the 3
0end of the MATa2 gene.
Perfect conservation at the nucleotide level and identity to theterminus of MATa2 suggests that MATa2 may function not byencoding a protein, but rather by encoding an antisense RNA or aDNA site.
Variation in the rate of genome evolution seems not to pose aserious problem for gene identification for the species studiedhere. Various examples of extremely rapid or slow gene evolutioncan be identified, however, and each is likely to merit furtherstudy.
Genome-wide identification of regulatory elementsDirect identification of regulatory elements is more challengingthan for genes. Such elements are typically short (6–15 bp), toleratesome degree of sequence variation and follow few known rules. Sofar, most have been found by experimental manipulation, such assystematic mutation of individual promoter regions; however, theprocess is laborious and unsuited for genome-scale analysis.
Computational analysis of single genomes has been successfullyused to identify regulatory elements associated with known sets ofrelated genes8–10, but these approaches do not have sufficient powerto permit comprehensive direct identification of regulatoryelements37.
Comparative genomics offers various approaches for findingregulatory elements. The simplest is to perform cross-speciessequence alignment to find ‘phylogenetic footprints’—regions ofunusually high conservation. This approach has long been used tostudy promoters of specific genes in many organisms11,13,24,38,39, andrecently was applied across the entire human and mouse genomes7.The genome alignments of the four Saccharomyces species cansimilarly be used to study each yeast gene, to help define promotersand other islands of intergenic conservation (Fig. 6).
Our interest was to go beyond inspection of individual islands ofconservation to construct a comprehensive dictionary of regulatoryelements used throughout the genome. We investigated the con-servation properties of known regulatory motifs and used theinsights gained to design an approach for de novo discovery ofregulatory motifs directly from the genome. We then developed anapproach for inferring a candidate function of these motifs, makinguse of biological knowledge about genes.
Conservation of the Gal4-binding siteWe first studied the binding site for one of the best-studiedtranscription factors, Gal4, whose sequence motif is CGGn(11)CCG(which contains 11 unspecified bases). Gal4 regulates genes involvedin galactose metabolism, including the GAL1 and GAL10 genes,which are divergently transcribed from a common intergenic region(Fig. 6). The Gal4 motif occurs three times in this intergenic region,
articles
NATURE | VOL 423 | 15 MAY 2003 | www.nature.com/nature 247© 2003 Nature Publishing Group

and all three instances show perfect conservation across the fourspecies. In addition, there is a fourth experimentally validatedbinding site40 for Gal4 that differs from the consensus by onenucleotide in S. cerevisiae. This variant site is also perfectly pre-served across the species.
We then examined the frequency and conservation of Gal4-binding sites across the aligned genomes. In S. cerevisiae, the Gal4motif occurs 96 times in intergenic regions and 415 times in genic(protein-coding) regions. The motif displays certain marked con-servation properties (see Methods). First, occurrences of the Gal4motif in intergenic regions have a conservation rate (proportionconserved across all four species) that is about fivefold higher thanfor equivalent random motifs (12.5% compared with 2.4%).Second, intergenic occurrences of the Gal4 motif are more fre-quently conserved than genic occurrences (12.5% compared with3%). By contrast, random motifs are less frequently conserved inintergenic regions than in genic regions (3.1% compared with7.0%), reflecting the lower overall level of conservation in intergenicregions. Thus, the relative conservation rate in intergenic comparedwith genic regions is about 11-fold higher for Gal4 than for randommotifs. Third, the Gal4 motif shows a higher conservation rate indivergent compared with convergent intergenic regions (those that lieupstream compared with downstream of both flanking genes); nosuch preferences are seen for control motifs. These three observationssuggest various ways to discover motifs based on their conservationproperties (see conservation criteria below).
Catalogue of known motifsWe extended these observations by assembling a catalogue of 55known regulatory sequence motifs (Table 2), by starting withtwo public databases (SCPD41 and YTFD42) and curating the entriesto select those with the best support in the literature. Nearly all ofthese sequence motifs are binding sites of known transcriptionfactors.
We defined a motif conservation score (MCS) on the basis of theconservation rate of the motif in intergenic regions: the MCS ismeasured in standard deviations above the rate for comparablecontrol motifs (see Methods). Most of the known motifs showstrong conservation, with 60% having MCS $4 (which is substan-tially higher than expected by chance). Some of the motifs, however,show relatively modest MCS. These motifs may be incorrect,suboptimal or not well conserved.
Methodology for genome-wide motif discoveryOur approach involves first identifying conserved ‘mini-motifs’ andthen using them to construct full motifs (see Methods). Mini-motifsare sequences of the form XYZn(0–21)UVW, consisting of twotriplets of specified bases interrupted by a fixed number (from 0to 21) of unspecified bases. Examples are TAGGAT, ATAnnGGC, orthe Gal4 motif itself. The total number of distinct mini-motifs is45,760, if reverse complements are grouped together.
Conserved mini-motifs are then defined according to threeconservation criteria (CC1–3), based on our observations about
Figure 6 Conservation in the GAL1–GAL10 intergenic region. Multiple alignment of the
four species shows a strong overlap between functional nucleotides and stretches of
conservation. Asterisks denote conserved positions in the multiple alignment. Blue arrows
denote the start and transcriptional orientation of the flanking ORFs. Experimentally
validated factor-binding footprints are boxed and labelled according to the bound factor.
Stretches of conserved nucleotides are underlined. Nucleotides matching the published
Gal4 motif are shown in red. The fourth experimentally validated site differs: it shows a
longer footprint and a non-standard consensus motif (bold). This variant motif is also
conserved across all four species. Scer, S. cerevisiae; Spar, S. paradoxus; Smik,
S. mikatae; Sbay, S. bayanus.
articles
NATURE | VOL 423 | 15 MAY 2003 | www.nature.com/nature248 © 2003 Nature Publishing Group

the properties of the Gal4 motif. In each case, conservation rates arenormalized to appropriate random controls. The conservationcriteria are: (1) intergenic conservation (CC1), the mini-motifshows a significantly high conservation rate in intergenic regions;(2) intergenic–genic conservation (CC2), the mini-motif showssignificantly higher conservation in intergenic regions than ingenic regions; (3) upstream–downstream conservation (CC3), themini-motif shows significantly different conservation rates when itoccurs upstream compared with downstream of a gene.
The conserved mini-motifs are then used to construct full motifs(Fig. 7). They are first extended by searching for nearby sequencepositions showing significant correlation with a mini-motif. Theextended motifs are then clustered, merging those with substantially
overlapping sequences and those that tend to occur in the sameintergenic regions. Finally, a full motif is created by deriving aconsensus sequence (which may be degenerate).
Each full motif is assessed for genome-wide conservation bycalculating its MCS, and those motifs with MCS $4 are retained.Each full motif was also tested for enrichment in upstreamcompared with downstream regions, by comparing its conservationrate in divergent versus convergent intergenic regions.
Results of genome-wide motif discoveryMost of the 45,760 possible mini-motifs show no distinctiveconservation pattern. However, approximately 2,400 mini-motifsshow high scores by one or more of these criteria (Fig. 7a–c). There
Table 2 Known motifs and related discovered motifs
Known motif Discovered motif*
Factor Motif MCS† Motif Genome-wide‡ Category- based§ MCSk...................................................................................................................................................................................................................................................................................................................................................................
ABF1 RTCRYnnnnnACG 50.0 RTCRYknnnnACGR S S 36.2UME6 TCGGCGGCTA 20.9 TSGGCGGCTAWW S NC 23.4CBF1 RTCACRTG 19.0 RTCACGTGV S S 17.6NDT80 TCGGCGGCTDW 18.6 TSGGCGGCTAWW S NC 23.4REB1 TTACCCGG 17.8 RTTACCCGRM S S 34.3MCM1a TTWCCCnWWWRGGAAA 16.5 TTCCnaAttnGGAAA S S 13.8SWI6 ACGCGT 16.4 WCGCGTCGCGt S S 10.2PHO4 CACGTG 16.1 RTCACGTGV S S 17.6MBP1 ACGCGTnA 14.8 WCGCGTCGCGt S S 10.2SWI4 TTTTCGCG 12.4 WTTTCGCGTT S S 12.0DAL81 GATAAG 12.1 – – NE –RPN4 TTTTGCCACC 11.5 TTTTGCCACCG S NC 11.0MSN2 CCCCT 11.3 hRCCCYTWDt S NE 7.8MSN4 CCCCT 11.3 hRCCCYTWDt S NE 7.8PDR1 CCGCGG 9.3 YCCGSGGS S NE 6.7ESR2 AAAAWTTTT 8.9 GRRAAAWTTTTCACT S NC 15.6MIG1 CCCCRSWWWW 8.7 DCCCCGCGH S NE 8.2MIG1b CCCCGC 8.4 DCCCCGCGH S NE 8.2BAS1 TGACTC 8.3 ATGACTCWT S S 6.1GCN4 ATGACTCAT 8.2 ATGACTCWT S S 6.1GAL4 CGGnnnnnnnnnnnCCG 8.0 CGGCnnMGnnnnnnnCGC S S 5.0HSF1b TTCTAGAA 7.8 TTCTMGAAGA S S 7.0ESR1 GATGAG 7.7 gcGATGAGmtgaraw S NC 24.7MET31 AAACTGTGGC 6.8 SKGTGGSGc S S 8.1AFT1 YRCACCCR 6.8 RVACCCTD S NC 10.3TEA1 CGGnCGG 6.8 – – NC –PUT3 CGGnnnnnnnnnnCCG 6.2 CCGMnnnnnnnnnmSGR W NE 5.4HAP2 TGATTGGC 5.7 TGATTGGT – S [6.4]RAP1 ACACCCATACATTT 5.2 ACACCCACACATnnC S S 9.9LEU3 CCGGnnCCGG 4.9 CCSGTAnCGG S S 6.5MCM1b YTTCCTAATTWGnnCn 4.8 TTCCnaAttnGGAAA S S 13.8INO4 CATGTGAAAT 4.1 GnnnCATGTGAA – S [6.8]INO2 CATGTGAAAT 4.1 CATGTG – S [4.4]GLN3 GATAAK 3.8 – – NE –ADR1 GGAGA 3.7 – – NE –FKH2 TTGTTTACST 3.6 tTTGTTTACnTTT S S 10.8FKH1 TTGTTTACST 3.6 tTTGTTTACnTTT S S 10.8RLM1 CTAWWWWTAG 3.6 CTAnnTTTAG S S [4.7]SWI5 KGCTGR 3.4 TGCTGG – S [6.1]HAP1 CGGnnnTAnCGG 2.5 GCnnTTAnCGG S NC 4.8XBP1 MCTCGARRRnR 2.5 TCTCGARRA S NC 12.5MAC1 TTTGCTCA 2.3 TGCTCA – S [5.4]TBF1 TTAGGG 2.3 GKBAGGGT S NC 4.8MSE TTTTGTG 1.4 TTTTGTGTCRC S NC 9.9STE12 RTGAAACA 0.7 YTGAAACA – S [12.2]DIG1 RTGAAACA 0.7 YTGAAACA – S [12.2]MET4 TGGCAAATG 0.7 CGGTGGCAAAA S NE –HAP4 TnRTTGGT 0.5 TGATTGGT – S [6.4]SMP1 ACTACTAWWWWTAG 0.4 – – NE –ACE2 GCTGGT 20.6 TGCTGGT – S [7.4]YAP1 TTACTAA 21.1 – – NE –CIN5 TTACTAA 21.1 – – NE –RME1 GAACCTCAA 21.4 – – NE –HAC1 CAGCGTG 21.4 – – NC –GCR1 GGAAG 218.5 GGAAGC – S [4.4]...................................................................................................................................................................................................................................................................................................................................................................
Lower-case characters denote lower stringency. Degenerate nucleotides as follows: S ¼ CG, W ¼ AT, R ¼ AG, Y ¼ CT, K ¼ GT, M ¼ AC, B ¼ CGT, D ¼ AGT, H ¼ ACT, V ¼ ACG, N ¼ ACGT.Characters in bold correspond to matches between known motif and discovered motif.*Discovered motif is the best genome-wide discovered motif, if one was found. Otherwise, it is the category-based motif found using the gene category corresponding to chromatin immunoprecipitationwith the corresponding transcription factor, if this category was available.†Negative MCS values indicate that the motif showed a weaker conservation than the random controls. Known motifs with low MCS values (,1.0) were only found in the category-based search.‡S indicates that a strong genome-wide match was found to the known motif; W, a weak match to the known motif was found.§S indicates that a strong category-based motif was found using the gene category for ChIP with the corresponding transcription factor; NE indicates that the known motif was not enriched in this genecategory; NC indicates that the gene category was available. Note that a strong category-based motif was found for every known motif for which the appropriate gene category was available and the knownmotif was actually enriched in the category.kMCS value of the genome-wide motif, if one was found. Category-based score shown in brackets otherwise.
articles
NATURE | VOL 423 | 15 MAY 2003 | www.nature.com/nature 249© 2003 Nature Publishing Group

is substantial overlap among the mini-motifs produced by the threecriteria, with about 50% of those found by one criterion also foundby another.
The conserved mini-motifs give rise to a list of 72 full motifshaving MCS $4 (Table 3). Most of the motifs show preferentialenrichment upstream of genes, but six are enriched downstream ofgenes. These 72 discovered motifs, found with no previous biologi-cal knowledge, show strong overlap with 28 of the 33 known motifshaving MCS $4. They include 27 strong matches and one weakermatch.
The 72 discovered motifs also contain matches to eight of the 22known motifs with MCS ,4. In these cases, the comparative analysisidentified closely related motifs that have higher conservation scoresthan the known motifs and occur largely at the same genes; thesemay represent a better description of the true regulatory element.
Comparative genomic analysis thus automatically discovered 36motifs with matches to most of the known motifs (65% of the fullset, 85% of those with high conservation). It also identified 42additional ‘new’ motifs not found in our list of known motifs.
Inferring function of genome-wide motifsWe next developed ways to assign candidate functions to thesediscovered motifs by the genes adjacent to conserved occurrences of
the motif with known gene categories. For inspiration, we againused the Gal4 motif. Given the biological role of Gal4, we consideredthe set of genes annotated to be involved in carbohydrate metab-olism (126 genes according to the Gene Ontology (GO)43 classifi-cation) with the set of genes that have a Gal4-binding motifupstream. The intergenic regions adjacent to carbohydrate metab-olism genes comprise only 2% of all intergenic regions, but 7% ofthe occurrences of the Gal4 motif in S. cerevisiae (3.5-fold enrich-ment) and 29% of the conserved occurrences across the four species(15-fold enrichment).
These results suggest that a function of the Gal4 motif could beinferred from the function of the genes adjacent to its conservedoccurrences. Such putative functional assignments can be useful indirecting experimentation for understanding the precise function ofa motif. We therefore assembled a collection of 318 yeast genecategories based on functional and experimental data. Thesecategories consist of 120 sets of genes defined with a common GOclassification in SGD43; 106 sets of genes whose upstream regionwas identified as binding a given transcription factor in genome-wide chromatin immunoprecipitation (ChIP) experiments44;and 92 sets of genes showing coordinate regulation in RNAexpression studies45. To measure how strongly the conserved occur-rences correlated with the regions upstream (or downstream) of a
Figure 7 Distribution of motifs by conservation score. a–c, Points denote individual mini-
motifs analysed with respect to the three conservation properties described in the text
(CC1, intergenic conservation (a); CC2, intergenic–genic conservation (b); CC3,
upstream–downstream conservation (c)). Blue points exceed the significance threshold
used; grey points are non-significant. d, The generation of a full motif from mini-motifs:
(1) we selected mini-motifs using each conservation criterion; (2) we extended mini-motifs
with additional conserved bases; (3) we generated mega-motifs by merging mini-motifs
with similar extension; (4) we merged mega-motifs that frequently co-occur in the
same intergenic regions.
articles
NATURE | VOL 423 | 15 MAY 2003 | www.nature.com/nature250 © 2003 Nature Publishing Group

particular gene category, we defined a category correlation score(CCS) (see Methods). A CCS $5 (nominal P-value ,1025) issignificant after accounting for testing of multiple categories.
Most of the 36 discovered motifs that correspond to known
motifs showed strong category correlation. Categories with thestrongest correlation included those identified by ChIP with thetranscription factor known to bind the motif, although many otherrelevant categories were identified. Of the 42 new motifs, 25 show
Table 3 Discovered motifs
No. Discovered motif Location* MCS† Best category‡ CCS§ Interpretationk...................................................................................................................................................................................................................................................................................................................................................................
1 YCGTnnnnmRYGAY 5 0 36.2 ChIP: Abf1 90 Known: Abf12 RTTACCCGRM 5 0 34.3 ChIP: Reb1 38 Known: Reb13 gcGATGAGmtgaraw 5 0 24.7 Exp.: cluster 74 62 Known: Esr1 GATGAG4 TSGGCGGCTAWW 5 0 23.4 GO: meiosis 10 Known: Ume6/Ndt805 RTCACGTGV 5 0 17.6 ChIP: Cbf1 27 Known: Cbf1/Pho46 WTATWTACADG 3 0 17.4 Exp.: cluster 16 downstream 25 New: mitochondrial downstream7 GRRAAAWTTTTCACT 5 0 15.6 Exp.: cluster 74 37 Known: Esr28 TTCCnaAttnGGAAA 5 0 13.8 ChIP: Mcm1 29 Known: Mcm19 CGTTTCTTTTTCY. 5 0 13.5 GO: filamentation 7 New: filamentation10 TYYTCGAGA. 5 0 12.5 Exp.: cluster 86 5 Known: Xbp1 (Hsf1-co-ocuring)11 TTTTCGCG 5 0 12.0 ChIP: Swi4 21 Known: Swi4 fixed gap11a TTTT ¼ CGCG{ 5 0 12.0 ChIP: Swi4 – New: Swi4 variable gap12 TKACGCGTT 5 0 12.0 ChIP: Mbp1 18 Known: Mbp1/Swi613 STGCGGnnnttTCTnnG 5 0 11.8 GO: filamentation 11 New: filamentation14 YCTATTGTT 5 0 11.5 ChIP: Fkh2 6 New: Rlm1-like15 TTTTGCCACCG 5 0 11.0 GO: proteolysis 25 Known: Rpn4/Met416 tTTGTTTACnTTT 5 0 10.8 ChIP: Fkh2 28 Known: Fkh1/217 RVACCCTD 5 0 10.3 – – Known: Aft118 WCGCGTCGCGt 5 0 10.2 ChIP: Mbp1 17 New: double Mbp119 GGGTnACCC 5 0 10.0 ChIP: Reb1 8 New: Reb1 palindrome20 GnnATGTGTGGGTGT 5 0 9.9 ChIP: Fhl1 5 Known: Rap121 TTTTGTGTCRC 5 0 9.9 ChIP: Sum1 14 Known: Mse22 TTTCAnCGCGC 5 0 9.8 – – New: no category23 TATTAWTATTATtMtnatta 3 0 9.5 – – New: no category24 SCGnHGGS 5 0 8.8 GO: filamentation 6 New: filamentation25 ACAGCCGCRY 5 0 8.6 Exp.: cluster 37 6 New: expression cluster 3726 DCGCGGGGH 5 0 8.1 Exp.: cluster 46 8 Known: Mig1b27 SKGTGGSGc 5 0 8.1 ChIP: Met31 5 Known: Met3128 TTTTn(19)GCKCG 5 0 7.8 – – Known: no category29 HRCCCYTWDt 5 0 7.8 Exp.: cluster 8 22 Known: Msn2/430 TKCCCnnnnGGG 5 0 7.3 ChIP: Mcm1 15 Known: Mcm1 (hits tRNA)31 GTGTCAGTAAt 5 0 7.1 ChIP: Sum1 15 New: Sum132 RGTTTTTCCG 5 0 7.1 ChIP: Rgt1 7 New: Rgt133 TTCTMGAAGA 5 0 7.0 ChIP: Hsf1 10 Known: Hsf134 YCCGSGGS 5 0 6.7 GO: filamentation 9 New: filamentation35 CnCCTTTTATAC 5 0 6.5 – – New: no category36 CCSGTAnCGG 5 0 6.5 ChIP: Leu3 8 Known: Leu337 SKTKCCTT 5 0 6.4 GO: filamentation 7 New: filamentation38 CTCCCCTTAT 5 0 6.4 Exp.: cluster 8 11 Known: Msn2/439 GCCCGG 5 0 6.3 GO: filamentation 10 New: filamentation40 SGCGCGRB 5 0 6.3 – – New: no category41 CTCSGCS 5 0 6.2 – – New: no category42 TGnKAGCGCCG 5 0 6.2 – – –43 ATGACTCWT 5 0 6.1 ChIP: Gcn4 44 Known: Gcn4/Bas144 CCGAnnnTCGG 5 0 6.1 Exp.: cluster 46 6 New: facilitators palindrome45 SCGMnnnnnnKCG 5 0 6.0 – – New: no category46 CnCCGCGCnnTTTs 5 0 6.0 – – New: no category47 TTTTnnnnnnnnnnnngGGGT 5 0 5.8 – – New: no category48 TGTRnCAW 3 0 5.5 – – New: no category49 YCSknnnnnnnnnKCGG 5 0 5.4 Exp: cluster 46 6 Known: Put350 CGGnnnnnnnnnnnnnKCGV 5 0 5.4 – – New: no category51 WGTGACg 5 0 5.3 ChIP: Sum1 14 New: Sum152 RTCCCTV 5 0 5.3 – – New: no category53 YTCGTTTAGG 5 0 5.2 GO: lipid metabolism 5 New: lipid metabolism54 TYCGKRM 5 0 5.2 GO: filamentation 7 New: filamentation55 CGCnnnnnnnnnnnnnnBCGB 5 0 5.1 – – New: no category56 TWCCCCM 5 0 5.0 Exp.: cluster 46 7 Known: Mig1 þ facilitators57 CGGCnnMGnnnnnnnCGC 5 0 5.0 ChIP: Gal4 7 Known: Gal458 CCGSnnnnnGVC 5 0 5.0 – – New: no category59 TRTAMATAKWT 3 0 4.8 ChIP: Dig1 7 New: Ste12 (hits tRNA)60 TtTATAnTATATAnA 3 0 4.8 Exp: cluster 74 downstream 6 New: downstream cluster 7461 GKBAGGGT 5 0 4.8 GO: glycolysis 6 Known: Tbf1/new: glycolysis62 GCnnTTAnCGG 5 0 4.8 – – Known: Hap163 GGCSnnnnnGnnnCGCG 5 0 4.7 ChIP: Mbp1 6 Known: Mbp1-like64 TTCTCnnnnnnnCGC 5 0 4.7 GO: filamentation 6 New: filamentation65 SCGKnnnnKCGD 5 0 4.5 – – New: no category66 AATATTCTT 3 0 4.4 Exp.: cluster 46 downstream 5 New: downstream facilitators67 CGCGTnnnnnnnnACG 5 0 4.4 ChIP: Swi4 8 New: Swi4-vary gap68 CCGHVGGM 5 0 4.3 – – New: no category69 CGCG ¼ TTTT 5 0 4.3 – – New: no category70 CGCGnnnnnGGGS 5 0 4.2 Exp.: cluster 46 6 New: expression cluster 4671 CTGCAGGGR 5 0 4.2 GO: filamentation 6 New: filamentation...................................................................................................................................................................................................................................................................................................................................................................
Lower-case characters and degenerate nucleotides as in Table 2.*Location indicates whether the motif tends to occur 5 0 or 3 0 of genes, based on preferential enrichment in divergent or convergent intergenic regions.†Motif conservation score for discovered motif.‡The gene category having the highest category correlation score (CCS) with discovered motif. Category types are: GO, Gene Ontology; ChIP, chromatin IP experiment; Exp., expression cluster.§CCS for best category.k Interpretation of discovered motif, based on similarity to known motifs (Table 2) and category correlation. No category denotes that no category was enriched in the motif.{Motif 11a is closely related to motif 11 but shows a variable gap.
articles
NATURE | VOL 423 | 15 MAY 2003 | www.nature.com/nature 251© 2003 Nature Publishing Group

strong correlation with at least one category and thus can beassigned a suggestive biological function (Table 3).
Examples of new motifsWe describe a few of the new motifs below.† Some motifs appear to define previously unknown binding sitesassociated with known transcription factors. Motif 32 is probablythe binding site for Rgt1, which regulates genes involved in glucosetransport46; the motif occurs upstream of many such genes, includ-ing appearing five times upstream of HXT1, which encodes ahigh-affinity glucose transporter. Motifs 21, 31 and 51 are allassociated with genes whose upstream regions are bound bySum1, a transcriptional repressor of genes involved in meiosis.The first motif has been reported previously (Mse)47, but the lattertwo are new and occur near genes whose products are involved inchromatin silencing and transcriptional repression.† Some motifs do not match regions bound by known transcrip-tion factors, but show strong correlation with functional categories.Motif 9 occurs upstream of genes involved in nitrogen metabolism,including amino-acid and urea metabolism, nitrogen transport,glutamine metabolism and carbamoyl phosphate synthesis. Motif25 is enriched among co-expressed genes (expression cluster 37)whose products function in vesicular transport and secretion, includ-ing GDP/GTP exchange factors essential for the secretory machinery,clathrin assembly factors and many vesicle and plasma membraneproteins. Motifs 9, 13, 24, 34, 37 may have a role in filamentation.They are all enriched in genes co-regulated during environmentalchanges, involved in signalling and budding, and bound by tran-scription factors involved in filamentation, such as Phd1.† Six motifs show higher conservation downstream of ORFs. Someof these may be transcribed in the 3 0 untranslated region and have aregulatory role in mRNA localization or stability. The strongest(motif 6; see ref. 48) is found at genes whose product localizes to thecytosolic translational machinery, the mitochondrial DNA transla-tional machinery or the mitochondrial outer membrane. Down-stream motifs are also found enriched in a group of genes repressedduring environmental stress (motif 60 with expression cluster 74)and a group of genes involved in energy production (motif 66 withexpression cluster 46).†Two motifs (motif 11a and motif 69) show variable gap spacing,suggesting a new type of degeneracy within the recognition site for atranscription factor complex. Motif 11a corresponds closely to theknown motif for Swi4 (motif 11) but is interrupted by a central gapof 5, 7 or 9 bases; these variant motifs all show strong correlationwith genes bound by Swi4 in ChIP experiments.
Category-based identification of regulatory elementsThe motifs above were identified solely on the basis of overallconservation across the genome. We next explored whetheradditional motifs could be found by searching specifically forconservation within individual gene categories. We used the sameprocedure for constructing full motifs as above, but used a modifiedconservation criterion (CC4) that defines conserved mini-motifs as
those enriched in the intergenic regions of genes in the category (seeMethods).
Known motifsWe first considered the 43 known motifs for which ChIP experi-ments had been performed with the transcription factor that bindsthe motifs44. For each category defined by the ChIP experiment, weundertook category-based motif discovery.
Strong category-based motifs were found in 29 cases and theseinvariably corresponded closely to the known motifs (Table 2).These include 11 cases in which the motif had not been found bygenome-wide motif discovery, suggesting that a category-basedapproach can be more sensitive in some cases.
No strong category-based motifs were found for the remaining 14known cases, including seven cases in which genome-wide analysisyielded the known motif. Analysis of these 14 known motifs showedthat none were, in fact, enriched in the ChIP-based category. Thismay reflect errors in the known motifs in some cases, and imperfectChIP data in others. Genome-wide analysis may simply be morepowerful than category-based analysis in some instances.
In all, 46 of the 55 known motifs were found by either genome-wide or category-based analysis. The remaining nine cases mayreflect true failures of the comparative genomic analysis or errors inthe known motifs.
New motifsWe then applied the approach to all of the gene categories. A total of181 well-conserved motifs were identified, with many of these beingequivalent motifs arising from multiple categories. Merging suchmotifs resulted in 52 distinct motifs, of which 43 were already found bythe analyses described above. The remaining nine motifs representnew category-based motifs (Table 4), including the following.†Three new motifs are associated with genes that are bound by thetranscription factors Rap1, Ste12 and Cin5, respectively. Rap1 isknown to bind incomplete or degenerate instances of the publishedmotif (Table 2), and the new motif may confer additional specificity.The motif associated with Ste12 is the known binding site for thepartner transcription factor Tec1, suggesting that Ste12 binding isstrongly associated with its partner under the conditions examined(see below). Similarly, the new motif associated with Cin5 may bethat of a partner transcription factor.† Three new motifs are associated with the GO category forcarbohydrate transport, fatty-acid oxidation and glycolysis–glycogenesis, respectively.†Three new motifs are associated with an expression cluster (cluster37) that includes many genes involved in energy metabolism andstress response. The cluster is also associated with a new genome-wide motif (motif 25).
Category-based motif discovery thus contributes a modestnumber of additional motifs beyond those found by genome-wideanalysis.
Table 4 Additional new motifs discovered by category-based analysis
No. Category* Category-based motif† Interpretation Score‡...................................................................................................................................................................................................................................................................................................................................................................
1 Exp.: cluster 37 YCCCTTAAA New: cluster 37 (Msn2/4-like) [8.5]2 ChIP: FHL1 in YPD ATGTACGGATG New: Rap1 alternate [7.6]3 GO: carbohydrate transport GTTTTTCCG New: carbohydrate transport [7.2]4 GO: fatty acid beta-oxidation TTAnnnCCG New: fatty acid oxidation [6.3]5 GO: glycolysis/glyconeogenesis TAGTGGAAGC New: glycolysis/glycogenesis [6.0]6 Exp.: cluster 37 TCAGCC New: cluster 37 [5.9]7 Exp.: cluster 37 CGGnnnnnCGG New: cluster 37 [5.7]8 ChIP: CIN5 in YPD GnTTAnnTnAGC New: Cin5 alternate [5.6]9 ChIP: STE12 in butanol CATTCT Known: Tec1 [5.4]...................................................................................................................................................................................................................................................................................................................................................................
*Category used in search.†Symbols as in Tables 2 and 3.‡Category-based enrichment score.
articles
NATURE | VOL 423 | 15 MAY 2003 | www.nature.com/nature252 © 2003 Nature Publishing Group

Combinatorial controlGiven a limited number of genome-wide regulatory motifs and alarge number of transcriptionally regulated processes, fine-grainedregulation may depend on combinatorial control. We sought toexplore such combinatorial control by searching for motifs thatoccur in the same intergenic regions much more frequently thanwould be expected by chance.
In a single genome, few significant correlations are found. This isbecause functional instances of the motif are overwhelmed by amuch larger number of random occurrences. Cross-species con-servation greatly decreases this random noise and reveals biologi-cally meaningful correlations. We describe a few examples here.
The Ste12 and Tec1 motifs show clear correlation, with about20% of regions having a conserved occurrence of one also having aconserved occurrence of the other. This enrichment is not apparentwhen considering S. cerevisiae alone. We found that the genes thatcontain only the conserved Ste12 motif are enriched for thoseinvolved in mating and pheromone response, whereas those thatcontain conserved occurrences of both the Ste12 and Tec1 motifs areenriched for those involved in filamentous growth. These compu-tational observations are consistent with recent work showinggenome-wide evidence that Ste12 and Tec1 cooperate duringstarvation to induce filamentation-specific genes49. We also foundthat genes that contain only conserved occurrences of the Tec1 motifare enriched for those involved in budding and cell polarity,suggesting that Tec1 has functions that do not require cooperativebinding with Ste12.
About 60% of regions containing conserved motifs for thetranscription factor Leu3 (which regulates branched-chainamino-acid biosynthesis) also contain conserved motifs for Gcn4(a general factor regulating amino-acid biosynthesis, as well as manyother processes). About 46% of regions containing conserved motifsfor the transcription factor Met31 also contain conserved occur-rences of Cbf1. In fact, Cbf1 (which is involves in DNA bending) isknown to physically interact and cooperate with the METregulatorycomplex. About 34% of regions containing a conserved Gal4 motifalso contain a conserved Mig1 motif. In this case, the correlationreflects antagonistic interaction. Gal4 induces galactose metabolismgenes in the presence of galactose, but Mig1 represses galactosemetabolism in the presence of glucose.
Pairwise co-occurrence connects a group of five motifs: Msn2/4(general stress response), Rlm1 (response to cell-wall stresses), Pdr1(pleiotropic drug resistance), Tea1 (Ty element activator) and Tbf1(Telomere-binding factor). This suggests a possible link betweenvarious stress responses and adaptive changes at the genome level50.
Many additional correlations are seen among known and newmotifs and can be used to construct comprehensive co-occurrencenetworks. These can provide information valuable in decipheringbiological pathways in yeast.
DiscussionThe goal of this paper is to explore the ability to extract a wide rangeof biological information from genome comparisons betweenrelated organisms. For S. cerevisiae, our results show that compara-tive genome analysis of a handful of related species has substantialpower to identify genes, define gene structure, highlight rapid andslow evolutionary change, recognize regulatory elements and revealcombinatorial control of gene regulation. The power is comparableor superior to experimental analysis, in terms of sensitivity andprecision.
In principle, the approach could be applied to any organism byselecting a suitable set of related species. The optimal choice ofspecies depends on multiple considerations, largely related to theevolutionary tree connecting the species. These include the follow-ing: first, the branch length t between species should be shortenough to permit orthologous sequence to be readily aligned. The
yeasts studied here differ by t ¼ 0.23–0.55 substitutions per site andare readily aligned. The strong conservation of synteny allowed theunambiguous correspondence of the vast majority of genes.
Second, the total branch length of the tree should be large enoughthat non-functional sites will have undergone substantially moredrift than functional sites, thereby providing an adequate degree ofsignal-to-noise enrichment. For this analysis, the multiple speciesstudied provide a total branch length of 0.83 and a probability ofnucleotide identity across all four species in non-coding regions of49%. The signal-to-noise enrichment is thus about twofold (that is,1/0.49) for highly constrained nucleotides and correspondinglyhigher for composite features involving many nucleotides.
Third, the species should represent as narrow a taxon as possible,subject to the considerations above. Because the comparativeanalysis above seeks to identify genomic elements common to thespecies, it can explain only aspects of biology shared across thetaxon. In the present case, the analysis identifies elements sharedacross Saccharomyces sensu stricto, a closely related set of species inwhich most of the genes and regulatory elements are shared.
What are the implications for the understanding of the humangenome? The present study provides a good model for evolutionarydistances (substitutions per site in intergenic regions) relevant tothe study of the human. The sequence divergence betweenS. cerevisiae and the most distant relative S. bayanus (11% indelsand 62% nucleotide identity in aligned positions) is similar to thatbetween human and mouse (12% indels and 66% nucleotideidentity in aligned positions).
An important difference between yeast and human is the inherentsignal-to-noise ratio in the genome. Yeast has a high signal-to-noiseratio, with protein-coding regions comprising approximately 70%of the genome, and regulatory elements comprising perhaps about15% of the intergenic regions. The human has a much lower signal-to-noise ratio, with the corresponding figures being perhaps ,2%and ,3%7. A lower signal-to-noise ratio must be offset by a highersignal-to-noise enrichment. Some enrichment can also be obtainedby filtering out the repeat sequences that comprise half of the humangenome. Greater enrichment can be accomplished by increasing thenumber of species studied, taking advantage both of nucleotide-level divergence and frequently occurring genomic deletion7.
Such considerations indicate that it should be possible to usecomparative analysis, such as explored here for yeast, to identifydirectly many functional elements in the human genome that arecommon to mammals. More generally, comparative analysis offers apowerful and precise initial tool for interpreting genomes. A
MethodsStrain informationThe sequence and annotation for S. cerevisiae reference strain S288C was obtained fromthe SGD website (http://www-genome.stanford.edu/Saccharomyces/) in May 2002.Saccharomyces paradoxus strain NRRL Y-17217, S. mikatae strain IFO1815, and S. bayanusstrain MCYC623 were provided by E. Louis (University of Leicester). All sequencedisolates were diploid.
Determining one-to-one orthologous ORFsFor each species, we gathered the complete set of all predicted ORFs starting with amethionine and having a length of at least 50 amino acids. On the basis of blast hits, weconnected predicted ORFs to S. cerevisiae ORFs in a bipartite graph, which weautomatically separated into subgraphs by eliminating suboptimal edges in a series ofsteps. We first eliminated all edges that are less than 80% of the maximum-weight edgeboth in amino-acid identity and in length. On the basis of the resulting unambiguousmatches, we built blocks of conserved gene order (synteny). We then preferentially keptmatches within synteny blocks and resolved additional matches. We finally separated genefamilies into subfamilies by searching for best unambiguous subgraphs. We reported theconnected components of the resulting graph as homology groups of unresolved genes.
Motif conservation scoreTo evaluate the motif conservation score (MCS) of a motif m of given length anddegeneracy, we compared its conservation ratio to that of random patterns of the samelength and degeneracy. We first computed the table F containing the relative frequencies oftwofold and threefold degenerate bases, given the S. cerevisiae nucleotide frequencies. Wethen selected 20 random intergenic loci in S. cerevisiae and used the order of nucleotides at
articles
NATURE | VOL 423 | 15 MAY 2003 | www.nature.com/nature 253© 2003 Nature Publishing Group

each locus together with the order of degeneracy levels in m to construct 20 random motifsthat were used as controls. We counted conserved and non-conserved instances of eachcontrol and computed r, the log-average of their conservation rates. We also counted thenumber of conserved and non-conserved intergenic instances of m, and evaluated thebinomial probability p of observing the two counts, given r. We finally reported the MCS ofthe motif as a z-score corresponding to p, the number of standard deviations away fromthe mean of a normal distribution that corresponds to tail area p.
Conservation criteriaFor CC1, we searched for mini-motifs that show a significant conservation in intergenicregions. For every mini-motif, we count i c, the number of perfectly conserved intergenicinstances in all four species, and i, the total number of intergenic instances in S. cerevisiae.We found that the two counts seem linearly related for most of the patterns (Fig. 7a),which can be attributed to a basal level of conservation r given the total evolutionarydistance that separates the four species compared. We estimated the ratio r as the log-average of non-outlier instances of i c/i within a control set of all motifs at a given gap size.We then calculated for every motif the binomial probability p of observing i c successes outof i trials, given parameter r. We assigned a z-score S to every motif corresponding toprobability p. Similar methods were used for computing CC2 and CC3 (seeSupplementary Information).
Constructing full motifsWe extended each mini-motif selected by searching for surrounding bases that arepreferentially conserved when the motif is conserved. We used an iterative approachadding at every iteration one base that maximally discriminates the neighbourhood ofconserved motif instances from the neighbourhood of non-conserved motif instances.The added base was selected from 14 degenerate symbols of the IUB code. When no suchsymbol separated the conserved and non-conserved instances with significance above 3j,we terminated the extension. Figure 7d shows the top-scoring mini-motif found in CC1(panel 1), and the corresponding extension (panel 2). We found that many mini-motifshave the same or similar extensions, and we clustered the extended motifs hierarchicallybased on sequence similarity. We then computed a consensus sequence for every cluster ofextended motifs, resulting in a smaller number of mega-motifs for each test (332 for CC1,269 for CC2, and 285 for CC3). Panel 3 shows the first nine members of the top cluster inCC1, and the resulting mega-motif. Finally, we merged mega-motifs based on theirco-occurrence in the same intergenic regions (panel 4). We computed a hypergeometricco-occurrence score between the intergenic regions containing each mega-motif and againcollapsed these hierarchically. We computed a consensus for every cluster, and iterated theco-occurrence-based collapsing step (results not shown). We obtained fewer than 200distinct genome-wide motifs, of which 72 have MCS $4 (Table 3).
Additional methodsSee Supplementary Information for a complete description of methods for sequencing,assembly, annotation, nucleotide alignments, genomic rearrangements, ambiguous ORFs,reading frame conservation, gene boundaries, resequencing, intron finding, genome-widemotif discovery, motif conservation score, the three mini-motif conservation criteria,motif extension and collapsing, and category-based motif discovery.
Received 27 February; accepted 1 April 2003; doi:10.1038/nature01644.
1. Goffeau, A. et al. Life with 6000 genes. Science 274, 546, 563–567 (1996).
2. Kowalczuk, M., Mackiewicz, P., Gierlik, A., Dudek, M. R. & Cebrat, S. Total number of coding open
reading frames in the yeast genome. Yeast 15, 1031–1034 (1999).
3. Harrison, P. M., Kumar, A., Lang, N., Snyder, M. & Gerstein, M. A question of size: the eukaryotic
proteome and the problems in defining it. Nucleic Acids Res. 30, 1083–1090 (2002).
4. Velculescu, V. E. et al. Characterization of the yeast transcriptome. Cell 88, 243–251 (1997).
5. Blandin, G. et al. Genomic exploration of the hemiascomycetous yeasts: 4. The genome of
Saccharomyces cerevisiae revisited. FEBS Lett. 487, 31–36 (2000).
6. Wood, V., Rutherford, K. M., Ivens, A., Rajandream, M.-A. & Barrell, B. A Re-annotation of the
Saccaromyces cerevisiae genome. Comp. Funct. Genomics 2, 143–154 (2001).
7. International Mouse Genome Sequencing Consortium. Initial sequencing and comparative analysis
of the mouse genome. Nature 420, 520–562 (2002).
8. Bailey, T. L. & Elkan, C. Fitting a mixture model by expectation maximization to discover motifs in
biopolymers. Proc. Int. Conf. Intell. Syst. Mol. Biol. 2, 28–36 (1994).
9. Tavazoie, S., Hughes, J. D., Campbell, M. J., Cho, R. J. & Church, G. M. Systematic determination of
genetic network architecture. Nature Genet. 22, 281–285 (1999).
10. Stormo, G. D. DNA binding sites: representation and discovery. Bioinformatics 16, 16–23 (2000).
11. McGuire, A. M., Hughes, J. D. & Church, G. M. Conservation of DNA regulatory motifs and discovery
of new motifs in microbial genomes. Genome Res. 10, 744–757 (2000).
12. Loots, G. G. et al. Identification of a coordinate regulator of interleukins 4, 13, and 5 by cross-species
sequence comparisons. Science 288, 136–140 (2000).
13. Pennacchio, L. A. & Rubin, E. M. Genomic strategies to identify mammalian regulatory sequences.
Nature Rev. Genet. 2, 100–109 (2001).
14. Oeltjen, J. C. et al. Large-scale comparative sequence analysis of the human and murine Bruton’s
tyrosine kinase loci reveals conserved regulatory domains. Genome Res. 7, 315–329 (1997).
15. Cliften, P. F. et al. Surveying Saccharomyces genomes to identify functional elements by comparative
DNA sequence analysis. Genome Res. 11, 1175–1186 (2001).
16. Alm, R. A. et al. Genomic-sequence comparison of two unrelated isolates of the human gastric
pathogen Helicobacter pylori. Nature 397, 176–180 (1999).
17. Carlton, J. M. et al. Genome sequence and comparative analysis of the model rodent malaria parasite
Plasmodium yoelii yoelii. Nature 419, 512–519 (2002).
18. Perrin, A. et al. Comparative genomics identifies the genetic islands that distinguish Neisseria
meningitidis, the agent of cerebrospinal meningitis, from other Neisseria species. Infect. Immun. 70,
7063–7072 (2002).
19. McClelland, M. et al. Comparison of the Escherichia coli K-12 genome with sampled genomes of a
Klebsiella pneumoniae and three salmonella enterica serovars, Typhimurium, Typhi and Paratyphi.
Nucleic Acids Res. 28, 4974–4986 (2000).
20. Batzoglou, S. et al. ARACHNE: a whole-genome shotgun assembler. Genome Res. 12, 177–189 (2002).
21. Gardner, M. J. et al. Genome sequence of the human malaria parasite Plasmodium falciparum. Nature
419, 498–511 (2002).
22. Fischer, G., James, S. A., Roberts, I. N., Oliver, S. G. & Louis, E. J. Chromosomal evolution in
Saccharomyces. Nature 405, 451–454 (2000).
23. Dunham, M. J. et al. Characteristic genome rearrangements in experimental evolution of
Saccharomyces cerevisiae. Proc. Natl Acad. Sci. USA 99, 16144–16149 (2002).
24. Blanchette, M. & Tompa, M. Discovery of regulatory elements by a computational method for
phylogenetic footprinting. Genome Res. 12, 739–748 (2002).
25. Fischer, G., Neuveglise, C., Durrens, P., Gaillardin, C. & Dujon, B. Evolution of gene order in the
genomes of two related yeast species. Genome Res. 11, 2009–2019 (2001).
26. Wolfe, K. H. & Shields, D. C. Molecular evidence for an ancient duplication of the entire yeast genome.
Nature 387, 708–713 (1997).
27. Bon, E. et al. Genomic exploration of the hemiascomycetous yeasts: 5. Saccharomyces bayanus var.
uvarum. FEBS Lett. 487, 37–41 (2000).
28. International Human Genome Sequencing Consortium. Initial sequencing and analysis of the human
genome. Nature 409, 860–921 (2001).
29. Dujon, B. et al. Complete DNA sequence of yeast chromosome XI. Nature 369, 371–378 (1994).
30. Sharp, P. M. & Li, W. H. The codon Adaptation Index—a measure of directional synonymous codon
usage bias, and its potential applications. Nucleic Acids Res. 15, 1281–1295 (1987).
31. Clark, T. A., Sugnet, C. W. & Ares, M. Jr Genome-wide analysis of mRNA processing in yeast using
splicing-specific microarrays. Science 296, 907–910 (2002).
32. Hurst, L. D. The Ka/Ks ratio: diagnosing the form of sequence evolution. Trends Genet. 18, 486 (2002).
33. Chu, S. et al. The transcriptional program of sporulation in budding yeast. Science 282, 699–705 (1998).
34. True, H. L. & Lindquist, S. L. A yeast prion provides a mechanism for genetic variation and phenotypic
diversity. Nature 407, 477–483 (2000).
35. Koufopanou, V., Goddard, M. R. & Burt, A. Adaptation for horizontal transfer in a homing
endonuclease. Mol. Biol. Evol. 19, 239–246 (2002).
36. Haber, J. E. Mating-type gene switching in Saccharomyces cerevisiae. Annu. Rev. Genet. 32, 561–599
(1998).
37. Hampson, S., Kibler, D. & Baldi, P. Distribution patterns of over-represented k-mers in non-coding
yeast DNA. Bioinformatics 18, 513–528 (2002).
38. McCue, L. et al. Phylogenetic footprinting of transcription factor binding sites in proteobacterial
genomes. Nucleic Acids Res. 29, 774–782 (2001).
39. Gelfand, M. S., Koonin, E. V. & Mironov, A. A. Prediction of transcription regulatory sites in Archaea
by a comparative genomic approach. Nucleic Acids Res. 28, 695–705 (2000).
40. Keegan, L., Gill, G. & Ptashne, M. Separation of DNA binding from the transcription-activating
function of a eukaryotic regulatory protein. Science 231, 699–704 (1986).
41. Zhu, J. & Zhang, M. Q. SCPD: a promoter database of the yeast Saccharomyces cerevisiae.
Bioinformatics 15, 607–611 (1999).
42. Mewes, H. W. et al. MIPS: a database for genomes and protein sequences. Nucleic Acids Res. 27, 44–48
(1999).
43. Dwight, S. S. et al. Saccharomyces Genome Database (SGD) provides secondary gene annotation using
the Gene Ontology (GO). Nucleic Acids Res. 30, 69–72 (2002).
44. Lee, T. I. et al. Transcriptional regulatory networks in Saccharomyces cerevisiae. Science 298, 799–804
(2002).
45. Gasch, A. P. & Eisen, M. B. Exploring the conditional coregulation of yeast gene expression through
fuzzy k-means clustering. Genome Biol. 3 RESEARCH0059 (2002).
46. Mosley, A. L., Lakshmanan, J., Aryal, B. K. & Ozcan, S. Glucose-mediated phosphorylation converts
the transcription factor Rgt1 from a repressor to an activator. J. Biol. Chem. 278, 10322–10327 (2003).
47. Lindgren, A. et al. The pachytene checkpoint in Saccharomyces cerevisiae requires the Sum1
transcriptional repressor. EMBO J. 19, 6489–6497 (2000).
48. Jacobs Anderson, J. S. & Parker, R. Computational identification of cis-acting elements affecting post-
transcriptional control of gene expression in Saccharomyces cerevisiae. Nucleic Acids Res. 28,
1604–1617 (2000).
49. Zeitlinger, J. et al. Program-specific distribution of a transcription factor dependent on partner
transcription factor and MAPK signaling. Cell 113, 395–404 (2003).
50. Morillon, A., Springer, M. & Lesage, P. Activation of the Kss1 invasive-filamentous growth pathway
induces Ty1 transcription and retrotransposition in Saccharomyces cerevisiae. Mol. Cell Biol. 20,
5766–5776 (2000).
Supplementary Information accompanies the paper on www.nature.com/nature.
Acknowledgements We thank D. Botstein, M. Cherry, K. Dolinski, D. Fisk, S. Weng and other
members of the Saccharomyces Genome Database staff for assistance with SGD, for making our
data available to the community through SGD, and for discussions; J. Butler, S. Calvo, J. Galagan,
D. Jaffe, J. Lehar and L. Jun Ma for technical advice and discussions; the staff of the Whitehead/
MIT Center for Genome Research Sequencing Center who generated the shotgun sequence from
the three yeast species; T. Lee, N. Rinaldi, R. Young and J. Zeitlinger for sharing data about
chromatin immunoprecipitation experiments and for discussions; M. Eisen and A. Gasch for
sharing information about gene expression clusters and for discussions; E. Louis and I. Roberts
for providing yeast strains and discussions; B. Berger, G. Fink, D. Gifford, S. Lindquist and
H. True-Krobb for discussions; and L. Gaffney for assistance with figures.
Competing interests statement The authors declare that they have no competing financial
interests.
Correspondence and requests for materials should be addressed to M.K. ([email protected]) or
E.S.L. ([email protected]). GenBank accession numbers are AABY01000000 for S. paradoxus,
AABZ01000000 for S. mikatae, and AACA01000000 for S. bayanus.
articles
NATURE | VOL 423 | 15 MAY 2003 | www.nature.com/nature254 © 2003 Nature Publishing Group