Embed Size (px)
Citation preview
Articles
www.thelancet.com Published online September 24, 2008 DOI:10.1016/S0140-6736(08)61311-2 1
Global epidemiology of injecting drug use and HIV among people who inject drugs: a systematic reviewBradley M Mathers, Louisa Degenhardt, Benjamin Phillips, Lucas Wiessing, Matthew Hickman, Steff anie A Strathdee, Alex Wodak, Samiran Panda, Mark Tyndall, Abdalla Toufi k, Richard P Mattick, for the 2007 Reference Group to the UN on HIV and Injecting Drug Use
Summary Background Injecting drug use is an increasingly important cause of HIV transmission in most countries worldwide. Our aim was to determine the prevalence of injecting drug use among individuals aged 15–64 years, and of HIV among people who inject drugs.
Methods We did a systematic search of peer-reviewed (Medline, EmBase, and PubMed/BioMed Central), internet, and grey literature databases; and data requests were made to UN agencies and international experts. 11 022 documents were reviewed, graded, and catalogued by the Reference Group to the UN on HIV and Injecting Drug Use.
Findings Injecting drug use was identifi ed in 148 countries; data for the extent of injecting drug use was absent for many countries in Africa, the Middle East, and Latin America. The presence of HIV infection among injectors had been reported in 120 of these countries. Prevalence estimates of injecting drug use could be ascertained for 61 countries, containing 77% of the world’s total population aged 15–64 years. Extrapolated estimates suggest that 15·9 million (range 11·0–21·2 million) people might inject drugs worldwide; the largest numbers of injectors were found in China, the USA, and Russia, where mid-estimates of HIV prevalence among injectors were 12%, 16%, and 37%, respectively. HIV prevalence among injecting drug users was 20–40% in fi ve countries and over 40% in nine. We estimate that, worldwide, about 3·0 million (range 0·8–6·6 million) people who inject drugs might be HIV positive.
Interpretation The number of countries in which the injection of drugs has been reported has increased over the last decade. The high prevalence of HIV among many populations of injecting drug users represents a substantial global health challenge. However, existing data are far from adequate, in both quality and quantity, particularly in view of the increasing importance of injecting drug use as a mode of HIV transmission in many regions.
Funding UN Offi ce on Drugs and Crime; Australian National Drug and Alcohol Research Centre, University of New South Wales.
IntroductionInjecting drug use has created major international public-health problems. The transmission of bloodborne viruses, in particular HIV,1 contributes substantially to the morbidity and mortality caused by illicit drug use.2,3 Investment in comprehensive public-health interventions is required to address this problem; accurate and reliable population estimates must inform all such interventions4,5 as policy makers and service providers develop HIV prevention initiatives, target resource allocation and service delivery, and measure service coverage.
Injecting drug use is dynamic. It is responsible for an increasing proportion of new HIV infections in many parts of the world, including countries in eastern Europe, South America, and east and southeast Asia.1 Nonetheless, there have been no systematic reviews of the epidemiology of injecting drug use worldwide in the past 4 years.6 The task is not simple: injecting drug use is an illegal, stigmatised behaviour; population surveys underestimate its prevalence because of selection biases; and alternative indirect methods can also be uncertain.7 Further, the collection of the relevant data presents technical challenges, especially in developing countries.8 Estimation of the prevalence of HIV among people who
inject drugs is challenging because of the diffi culties of selecting representative samples.9 By comparison, data on the extent of heterosexual spread of HIV within the general population is in many situations easier to obtain, with numerous more readily available sampling options.
Our aim was to systematically search and critique the peer-reviewed and non-peer-reviewed (grey) literature reporting data on the epidemiology of injecting drug use and on HIV among people who inject drugs. We present country-specifi c estimates derived from this literature, and produce regional and global estimates of the number of people who inject drugs, and who may be living with HIV/AIDS.
MethodsSearch strategy and selection criteriaIn August, 2007, comprehensive searches were done of the electronic peer-reviewed literature databases Medline, EmBase, and PubMed/BioMed Central. A comprehensive set of search terms was used to avoid missing potentially relevant material. Only those articles that had abstracts available in English were included. There were no time limits placed on these
Published OnlineSeptember 24, 2008DOI:10.1016/S0140-6736(08)61311-2
See Online/CommentDOI:10.1016/S0140-6736(08)61312-4
Secretariat of the Reference Group to the UN on HIV and Injecting Drug Use (B M Mathers MBChB, Prof L Degenhardt PhD, Prof R Mattick PhD, A Wodak MBBS), National Drug and Alcohol Research Centre, University of New South Wales, Sydney, Australia (Prof L Degenhardt, B Phillips BA, R P Mattick, A Wodak); Crime and Markets Unit, European Monitoring Centre for Drugs and Drug Addiction, Lisbon, Portugal (L Wiessing MSc); University of Bristol, Bristol, UK (Prof M Hickman FFPHM); Division of International Health and Cross-Cultural Medicine, University of California, San Diego, CA, USA (Prof S A Strathdee PhD); Alcohol and Drug Service, St Vincent’s Hospital, Sydney, Australia (A Wodak); National Institute of Cholera and Enteric Diseases (Indian Council of Medical Research) and Society for Positive Atmosphere and Related Support to HIV/AIDS (SPARSHA), West Bengal, India (S Panda MD); British Columbia Centre for Excellence in HIV/AIDS, Vancouver, BC, Canada (Prof M Tyndall MD); and Emerging Trends Department, French Monitoring Centre for Drugs and Drug Addiction, Paris, France (A Toufi k PhD)
Correspondence to:Dr Bradley Mathers, National Drug and Alcohol Research Centre, University of New South Wales, Sydney, NSW 2052, Australia [email protected]
For more on our search terms see www.idurefgroup.unsw.edu.au/IDUepiA
Articles
2 www.thelancet.com Published online September 24, 2008 DOI:10.1016/S0140-6736(08)61311-2
searches. These searches were developed in close consultation with a specialist drug and alcohol archivist and a generalist librarian with expertise across all the databases searched. Additionally, we searched the grey literature and online databases, including 44 online resource and database websites, 14 surveillance system websites, nine regional harm reduction websites, three prison literature databases, and 33 country-specifi c drug control agencies and ministry of health websites.
Requests were made of Reference Group members to provide any data they had access to on the epidemiology of injecting drug use and HIV infection among people who inject drugs from their regions. WHO, UNAIDS, and the UN Offi ce on Drugs and Crime (UNODC) headquarters staff sent emails to regional and country offi ce staff requesting them to provide relevant data and documents to the Reference Group Secretariat. In total, these searches and requests for material yielded 11 022
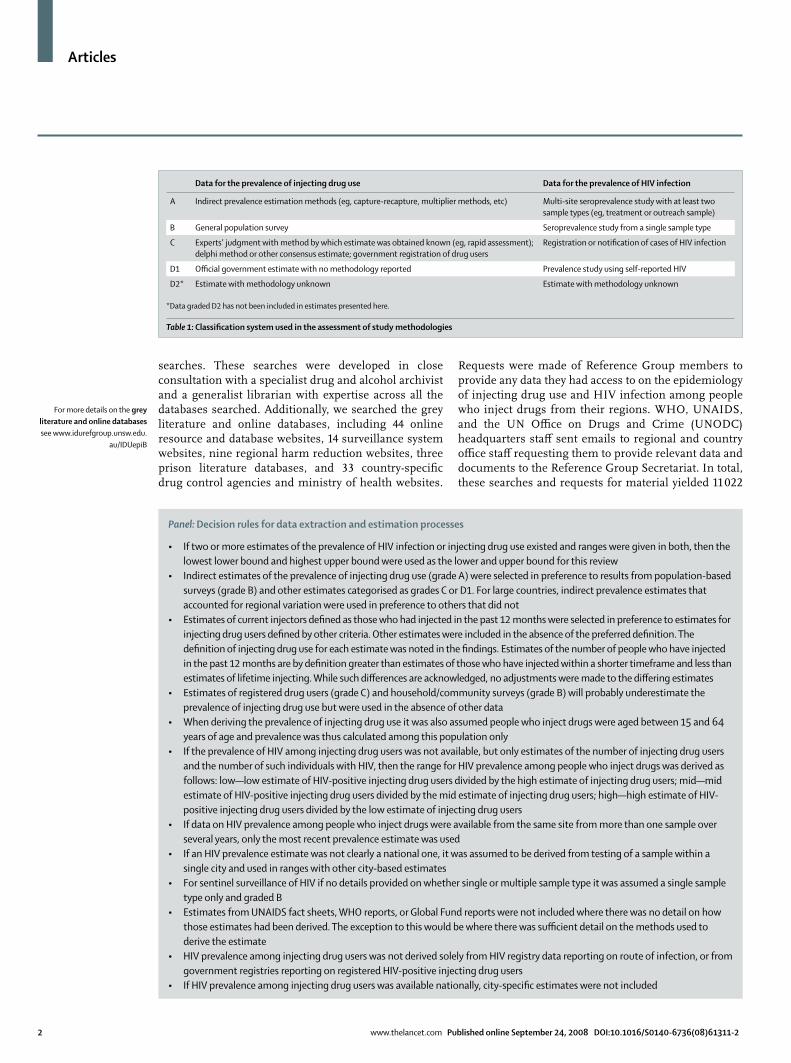
Data for the prevalence of injecting drug use Data for the prevalence of HIV infection
A Indirect prevalence estimation methods (eg, capture-recapture, multiplier methods, etc) Multi-site seroprevalence study with at least two sample types (eg, treatment or outreach sample)
B General population survey Seroprevalence study from a single sample type
C Experts’ judgment with method by which estimate was obtained known (eg, rapid assessment); delphi method or other consensus estimate; government registration of drug users
Registration or notifi cation of cases of HIV infection
D1 Offi cial government estimate with no methodology reported Prevalence study using self-reported HIV
D2* Estimate with methodology unknown Estimate with methodology unknown
*Data graded D2 has not been included in estimates presented here.
Table 1: Classifi cation system used in the assessment of study methodologies
Panel: Decision rules for data extraction and estimation processes
• If two or more estimates of the prevalence of HIV infection or injecting drug use existed and ranges were given in both, then the lowest lower bound and highest upper bound were used as the lower and upper bound for this review
• Indirect estimates of the prevalence of injecting drug use (grade A) were selected in preference to results from population-based surveys (grade B) and other estimates categorised as grades C or D1. For large countries, indirect prevalence estimates that accounted for regional variation were used in preference to others that did not
• Estimates of current injectors defi ned as those who had injected in the past 12 months were selected in preference to estimates for injecting drug users defi ned by other criteria. Other estimates were included in the absence of the preferred defi nition. The defi nition of injecting drug use for each estimate was noted in the fi ndings. Estimates of the number of people who have injected in the past 12 months are by defi nition greater than estimates of those who have injected within a shorter timeframe and less than estimates of lifetime injecting. While such diff erences are acknowledged, no adjustments were made to the diff ering estimates
• Estimates of registered drug users (grade C) and household/community surveys (grade B) will probably underestimate the prevalence of injecting drug use but were used in the absence of other data
• When deriving the prevalence of injecting drug use it was also assumed people who inject drugs were aged between 15 and 64 years of age and prevalence was thus calculated among this population only
• If the prevalence of HIV among injecting drug users was not available, but only estimates of the number of injecting drug users and the number of such individuals with HIV, then the range for HIV prevalence among people who inject drugs was derived as follows: low—low estimate of HIV-positive injecting drug users divided by the high estimate of injecting drug users; mid—mid estimate of HIV-positive injecting drug users divided by the mid estimate of injecting drug users; high—high estimate of HIV-positive injecting drug users divided by the low estimate of injecting drug users
• If data on HIV prevalence among people who inject drugs were available from the same site from more than one sample over several years, only the most recent prevalence estimate was used
• If an HIV prevalence estimate was not clearly a national one, it was assumed to be derived from testing of a sample within a single city and used in ranges with other city-based estimates
• For sentinel surveillance of HIV if no details provided on whether single or multiple sample type it was assumed a single sample type only and graded B
• Estimates from UNAIDS fact sheets, WHO reports, or Global Fund reports were not included where there was no detail on how those estimates had been derived. The exception to this would be where there was suffi cient detail on the methods used to derive the estimate
• HIV prevalence among injecting drug users was not derived solely from HIV registry data reporting on route of infection, or from government registries reporting on registered HIV-positive injecting drug users
• If HIV prevalence among injecting drug users was available nationally, city-specifi c estimates were not included
For more details on the grey literature and online databases see www.idurefgroup.unsw.edu.
au/IDUepiB
Articles
www.thelancet.com Published online September 24, 2008 DOI:10.1016/S0140-6736(08)61311-2 3
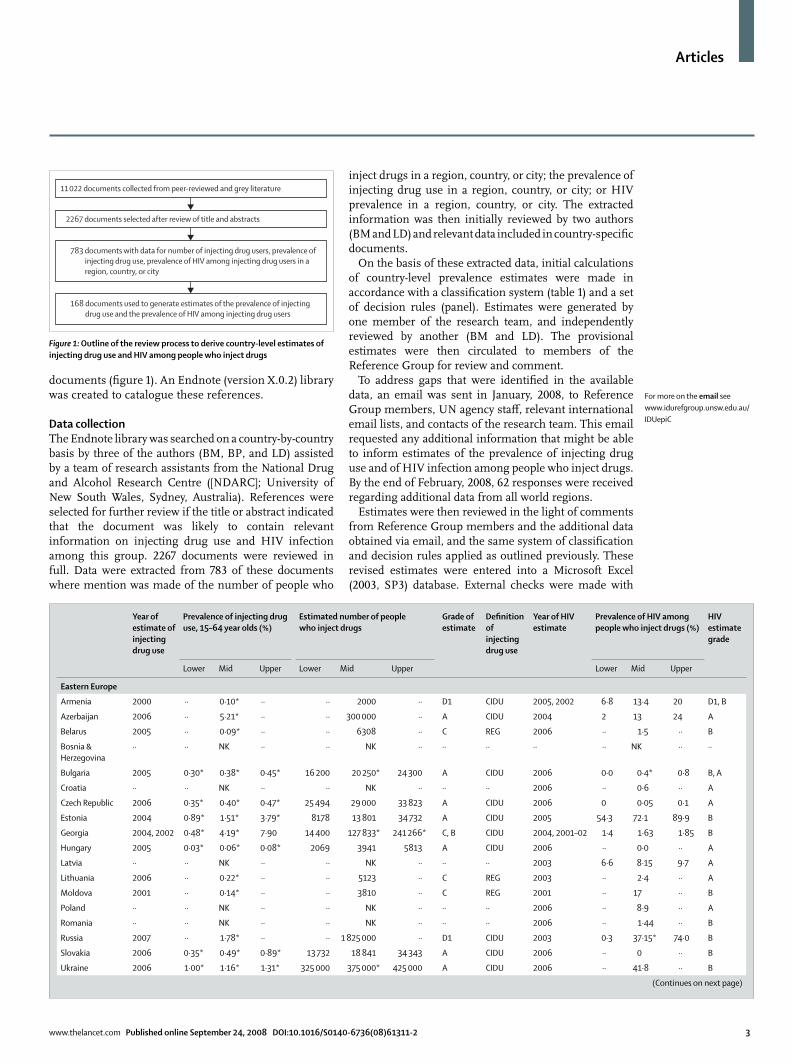
documents (fi gure 1). An Endnote (version X.0.2) library was created to catalogue these references.
Data collectionThe Endnote library was searched on a country-by-country basis by three of the authors (BM, BP, and LD) assisted by a team of research assistants from the National Drug and Alcohol Research Centre ([NDARC]; University of New South Wales, Sydney, Australia). References were selected for further review if the title or abstract indicated that the document was likely to contain relevant information on injecting drug use and HIV infection among this group. 2267 documents were reviewed in full. Data were extracted from 783 of these documents where mention was made of the number of people who
inject drugs in a region, country, or city; the prevalence of injecting drug use in a region, country, or city; or HIV prevalence in a region, country, or city. The extracted information was then initially reviewed by two authors (BM and LD) and relevant data included in country-specifi c documents.
On the basis of these extracted data, initial calculations of country-level prevalence estimates were made in accordance with a classifi cation system (table 1) and a set of decision rules (panel). Estimates were generated by one member of the research team, and independently reviewed by another (BM and LD). The provisional estimates were then circulated to members of the Reference Group for review and comment.
To address gaps that were identifi ed in the available data, an email was sent in January, 2008, to Reference Group members, UN agency staff , relevant international email lists, and contacts of the research team. This email requested any additional information that might be able to inform estimates of the prevalence of injecting drug use and of HIV infection among people who inject drugs. By the end of February, 2008, 62 responses were received regarding additional data from all world regions.
Estimates were then reviewed in the light of comments from Reference Group members and the additional data obtained via email, and the same system of classifi cation and decision rules applied as outlined previously. These revised estimates were entered into a Microsoft Excel (2003, SP3) database. External checks were made with
Year of estimate of injecting drug use
Prevalence of injecting drug use, 15–64 year olds (%)
Estimated number of peoplewho inject drugs
Grade of estimate
Defi nition of injecting drug use
Year of HIV estimate
Prevalence of HIV amongpeople who inject drugs (%)
HIV estimate grade
Lower Mid Upper Lower Mid Upper Lower Mid Upper
Eastern Europe
Armenia 2000 ·· 0·10* ·· ·· 2000 ·· D1 CIDU 2005, 2002 6·8 13·4 20 D1, B
Azerbaijan 2006 ·· 5·21* ·· ·· 300 000 ·· A CIDU 2004 2 13 24 A
Belarus 2005 ·· 0·09* ·· ·· 6308 ·· C REG 2006 ·· 1·5 ·· B
Bosnia & Herzegovina
·· ·· NK ·· ·· NK ·· ·· ·· ·· ·· NK ·· ··
Bulgaria 2005 0·30* 0·38* 0·45* 16 200 20 250* 24 300 A CIDU 2006 0·0 0·4* 0·8 B, A
Croatia ·· ·· NK ·· ·· NK ·· ·· ·· 2006 ·· 0·6 ·· A
Czech Republic 2006 0·35* 0·40* 0·47* 25 494 29 000 33 823 A CIDU 2006 0 0·05 0·1 A
Estonia 2004 0·89* 1·51* 3·79* 8178 13 801 34 732 A CIDU 2005 54·3 72·1 89·9 B
Georgia 2004, 2002 0·48* 4·19* 7·90 14 400 127 833* 241 266* C, B CIDU 2004, 2001–02 1·4 1·63 1·85 B
Hungary 2005 0·03* 0·06* 0·08* 2069 3941 5813 A CIDU 2006 ·· 0·0 ·· A
Latvia ·· ·· NK ·· ·· NK ·· ·· ·· 2003 6·6 8·15 9·7 A
Lithuania 2006 ·· 0·22* ·· ·· 5123 ·· C REG 2003 ·· 2·4 ·· A
Moldova 2001 ·· 0·14* ·· ·· 3810 ·· C REG 2001 ·· 17 ·· B
Poland ·· ·· NK ·· ·· NK ·· ·· ·· 2006 ·· 8·9 ·· A
Romania ·· ·· NK ·· ·· NK ·· ·· ·· 2006 ·· 1·44 ·· B
Russia 2007 ·· 1·78* ·· ·· 1 825 000 ·· D1 CIDU 2003 0·3 37·15* 74·0 B
Slovakia 2006 0·35* 0·49* 0·89* 13 732 18 841 34 343 A CIDU 2006 ·· 0 ·· B
Ukraine 2006 1·00* 1·16* 1·31* 325 000 375 000* 425 000 A CIDU 2006 ·· 41·8 ·· B
(Continues on next page)
For more on the email see www.idurefgroup.unsw.edu.au/IDUepiC
11 022 documents collected from peer-reviewed and grey literature
2267 documents selected after review of title and abstracts
783 documents with data for number of injecting drug users, prevalence ofinjecting drug use, prevalence of HIV among injecting drug users in aregion, country, or city
168 documents used to generate estimates of the prevalence of injectingdrug use and the prevalence of HIV among injecting drug users
Figure 1: Outline of the review process to derive country-level estimates of injecting drug use and HIV among people who inject drugs

Articles
4 www.thelancet.com Published online September 24, 2008 DOI:10.1016/S0140-6736(08)61311-2
specifi c requests to experts in countries where additional data or clarifi cation were required.
Statistical analysis All data were analysed in SPSS (version 15.0) for basic descriptive analyses. Data were also entered into MapInfo (version 9.0.2), and maps were generated to display prevalence estimates for injecting drug use and HIV among people who inject drugs. Final estimates were sent, with all working and reference lists included, and a draft of the manuscript, to Reference Group members for their review.
Following the collation of country-specifi c estimates, regional and global estimates for 2007 were derived. When generating estimates of the number of people injecting drugs in 2007, we assumed that the prevalence of injecting drug use was the same in 2007 as it was in the year of the estimate. UN Population Division estimates of population size were used.10 Deriving regional estimates involved the estimation of regional-specifi c, weighted estimates of the prevalence of HIV infection and injecting drug use and uncertainty bounds. Regional groupings were based on categorisations currently used by UNAIDS.1
Year of estimate of injecting drug use
Prevalence of injecting drug use, 15–64 year olds (%)
Estimated number of peoplewho inject drugs
Grade of estimate
Defi nition of injecting drug use
Year of HIV estimate
Prevalence of HIV amongpeople who inject drugs (%)
HIV estimate grade
Lower Mid Upper Lower Mid Upper Lower Mid Upper
(Continued from previous page)
Western Europe
Albania ·· ·· NK ·· ·· NK ·· ·· ·· ·· ·· NK ·· ··
Andorra ·· ·· NK ·· ·· NK ·· ·· ·· ·· ·· NK ·· ··
Austria 2000 0·22* 0·32* 0·42* 12 000 17 500 23 000 A CIDU 2006 ·· 7·1 ·· A
Belgium 1997 0·35* 0·39* 0·43* 23 200 25 800 28 400 A CIDU 2006 2·9 4·3 5·7 A
Denmark 1996 0·35* 0·44* 0·52* 12 372 15 416* 18 460 A CIDU 2006 ·· 2·1 ·· A
Finland 2002 0·35* 0·45* 0·57* 12 200 15 650 19 700 A CIDU 2006 ·· 0·2 ·· A
Macedonia ·· ·· NK ·· ·· NK ·· ·· ·· ·· ·· NK ·· ··
France 1999 ·· 0·32 ·· ·· 122 000 ·· A CIDU 2003 ·· 12·2 ·· A
Germany 2005 0·14* 0·17* 0·20* 78 000 94 250 110 500 A CIDU 2006 ·· 2·9 ·· A
Greece 2006 0·11* 0·13* 0·15* 8542 9720 11 134 A CIDU 2006 0·3 0·5 0·7 A
Iceland ·· ·· NK ·· ·· NK ·· ·· ·· ·· ·· NK ·· ··
Ireland 1996 0·20* 0·27 0·33* 4694 6289 7884 A CIDU 1999 ·· 5·8 ·· A
Italy 1996 ·· 0·83* ·· ·· 326 000 ·· A CIDU 2006 ·· 12·1 ·· A
Liechtenstein ·· ·· ·· ·· ·· ·· ·· ·· ·· ·· ·· ·· ·· ··
Luxembourg 2000 ·· 0·59 ·· ·· 1715 ·· A CIDU 2006 ·· 2·8 ·· A
Malta ·· ·· NK ·· ·· NK ·· ·· ·· 2006 ·· 0 ·· B
Monaco ·· ·· NK ·· ·· NK ·· ·· ·· ·· ·· NK ·· ··
Montenegro ·· ·· NK ·· ·· NK ·· ·· ·· ·· ·· NK ·· ··
Netherlands 2001 0·02* 0·03* 0·04* 2211 3115 4321 A CIDU 2002 ·· 9·5 ·· B
Norway 2005 0·27* 0·33* 0·38* 8374 10 049 11 724 A CIDU 2006 ·· 3·2 ·· A
Portugal 2000 0·23* 0·47* 0·70* 15 900 32 287 48 673 A CIDU 2006 10·9 15·6 20·2 A
San Marino ·· ·· NK ·· ·· NK ·· ·· ·· ·· ·· NK ·· ··
Serbia ·· ·· NK ·· ·· NK ·· ·· ·· ·· ·· NK ·· ··
Slovenia 2001 ·· 0·52* ·· ·· 7310 ·· A CIDU 2004 ·· 0·4 ·· A
Spain 1998 ·· 0·31* ·· ·· 83 972 ·· A CIDU 2006 ·· 39·7 ·· A
Sweden ·· ·· NK ·· ·· NK ·· ·· ·· 2007 ·· 5·4 ·· A
Switzerland 1997 0·51* 0·65* 0·78* 24 907 31 653 38 399 A † 2004 ·· 1·4 ·· A
UK 2005 0·38* 0·39* 0·42* 151 032 156 398 165 696 A CIDU 2006 0·6 2·3 4·0 A
··=no reports from which to estimate data. CIDU=estimate made for current injectors; indirect estimates defi ned as current injecting drug users unless otherwise specifi ed; current use defi ned as having injected in the past year. NK=injecting drug use or HIV reported among those who inject drugs but a prevalence estimate could not be made. REG=estimate derived from cumulative registries of drug users. When more than one year or grade is given, estimates are listed in order of the estimate they refer to—ie, lower followed by upper. For source documents for all fi gures listed in tables and for further information on how country-level estimates were determined see www.idurefgroup.unsw.edu.au/IDUepi. Because estimates of prevalence were calculated by the authors using UN population estimates these may diff er to those in the reports from which the data were drawn due to diff erent general population estimates being used; in particular such diff erences were noted in estimates reported by European Monitoring Centre on Drugs and Drug Addiction (EMCDDA). *Prevalence fi gures calculated by the authors using reported estimate of number of people who inject drugs and UN Population Division estimates of the 15–64-year-old population;10 midpoint fi gures for estimated number of people who inject drugs indicate that these were calculated by taking the midpoint of the reported range; fi gures for lower and upper estimated numbers of people who inject drugs indicate that these were calculated by the authors using reported prevalence estimates of injecting drug use and UN Population Division estimates of 15–64-year-old population. †Estimate of heroin users only.
Table 2: Prevalence of injecting drug use and HIV among people who inject drugs in Europe
For more on the country-specifi c data and estimates see www.idurefgroup.unsw.edu.au/
IDUepiE
For further details on how these estimates were derived and the
2007 country-specifi c estimates made see www.
idurefgroup.unsw.edu.au/IDUepi
Articles
www.thelancet.com Published online September 24, 2008 DOI:10.1016/S0140-6736(08)61311-2 5
Role of funding source Representatives from the HIV prevention division of the UNODC participated in the Steering Committee of the Reference Group to the UN on HIV and Injecting Drug Use. The Secretariat and Reference Group developed and agreed on the methodology; this was agreed by the Steering Committee. The members of
the Reference Group and Secretariat had full access to all the data. The decision on analysis, write up, and interpretation of results were all completed by members of the Reference Group and Secretariat. The decision to submit the manuscript for publication was made by the Secretariat and members of the Reference Group.
Year of estimate of injecting drug use
Prevalence of injecting drug use, 15–64 year olds (%)
Estimated number of people who inject drugs
Grade of estimate
Defi nition of injecting drug use
Year of HIV estimate
Prevalence of HIV amongpeople who inject drugs (%)
HIV estimate grade
Lower Mid Upper Lower Mid Upper Lower Mid Upper
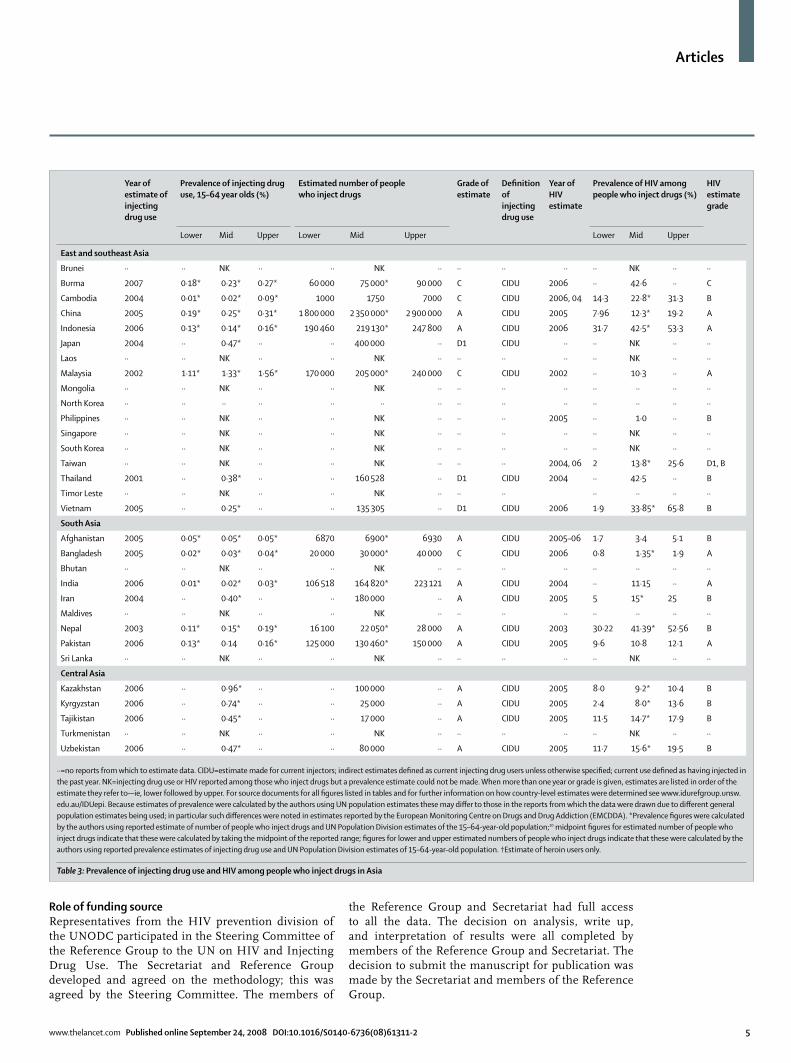
East and southeast Asia
Brunei ·· ·· NK ·· ·· NK ·· ·· ·· ·· ·· NK ·· ··
Burma 2007 0·18* 0·23* 0·27* 60 000 75 000* 90 000 C CIDU 2006 ·· 42·6 ·· C
Cambodia 2004 0·01* 0·02* 0·09* 1000 1750 7000 C CIDU 2006, 04 14·3 22·8* 31·3 B
China 2005 0·19* 0·25* 0·31* 1 800 000 2 350 000* 2 900 000 A CIDU 2005 7·96 12·3* 19·2 A
Indonesia 2006 0·13* 0·14* 0·16* 190 460 219 130* 247 800 A CIDU 2006 31·7 42·5* 53·3 A
Japan 2004 ·· 0·47* ·· ·· 400 000 ·· D1 CIDU ·· ·· NK ·· ··
Laos ·· ·· NK ·· ·· NK ·· ·· ·· ·· ·· NK ·· ··
Malaysia 2002 1·11* 1·33* 1·56* 170 000 205 000* 240 000 C CIDU 2002 ·· 10·3 ·· A
Mongolia ·· ·· NK ·· ·· NK ·· ·· ·· ·· ·· ·· ·· ··
North Korea ·· ·· ·· ·· ·· ·· ·· ·· ·· ·· ·· ·· ·· ··
Philippines ·· ·· NK ·· ·· NK ·· ·· ·· 2005 ·· 1·0 ·· B
Singapore ·· ·· NK ·· ·· NK ·· ·· ·· ·· ·· NK ·· ··
South Korea ·· ·· NK ·· ·· NK ·· ·· ·· ·· ·· NK ·· ··
Taiwan ·· ·· NK ·· ·· NK ·· ·· ·· 2004, 06 2 13·8* 25·6 D1, B
Thailand 2001 ·· 0·38* ·· ·· 160 528 ·· D1 CIDU 2004 ·· 42·5 ·· B
Timor Leste ·· ·· NK ·· ·· NK ·· ·· ·· ·· ·· ·· ··
Vietnam 2005 ·· 0·25* ·· ·· 135 305 ·· D1 CIDU 2006 1·9 33·85* 65·8 B
South Asia
Afghanistan 2005 0·05* 0·05* 0·05* 6870 6900* 6930 A CIDU 2005–06 1·7 3·4 5·1 B
Bangladesh 2005 0·02* 0·03* 0·04* 20 000 30 000* 40 000 C CIDU 2006 0·8 1·35* 1·9 A
Bhutan ·· ·· NK ·· ·· NK ·· ·· ·· ·· ·· ·· ·· ··
India 2006 0·01* 0·02* 0·03* 106 518 164 820* 223 121 A CIDU 2004 ·· 11·15 ·· A
Iran 2004 ·· 0·40* ·· ·· 180 000 ·· A CIDU 2005 5 15* 25 B
Maldives ·· ·· NK ·· ·· NK ·· ·· ·· ·· ·· ·· ·· ··
Nepal 2003 0·11* 0·15* 0·19* 16 100 22 050* 28 000 A CIDU 2003 30·22 41·39* 52·56 B
Pakistan 2006 0·13* 0·14 0·16* 125 000 130 460* 150 000 A CIDU 2005 9·6 10·8 12·1 A
Sri Lanka ·· ·· NK ·· ·· NK ·· ·· ·· ·· ·· NK ·· ··
Central Asia
Kazakhstan 2006 ·· 0·96* ·· ·· 100 000 ·· A CIDU 2005 8·0 9·2* 10·4 B
Kyrgyzstan 2006 ·· 0·74* ·· ·· 25 000 ·· A CIDU 2005 2·4 8·0* 13·6 B
Tajikistan 2006 ·· 0·45* ·· ·· 17 000 ·· A CIDU 2005 11·5 14·7* 17·9 B
Turkmenistan ·· ·· NK ·· ·· NK ·· ·· ·· ·· ·· NK ·· ··
Uzbekistan 2006 ·· 0·47* ·· ·· 80 000 ·· A CIDU 2005 11·7 15·6* 19·5 B
··=no reports from which to estimate data. CIDU=estimate made for current injectors; indirect estimates defi ned as current injecting drug users unless otherwise specifi ed; current use defi ned as having injected in the past year. NK=injecting drug use or HIV reported among those who inject drugs but a prevalence estimate could not be made. When more than one year or grade is given, estimates are listed in order of the estimate they refer to—ie, lower followed by upper. For source documents for all fi gures listed in tables and for further information on how country-level estimates were determined see www.idurefgroup.unsw.edu.au/IDUepi. Because estimates of prevalence were calculated by the authors using UN population estimates these may diff er to those in the reports from which the data were drawn due to diff erent general population estimates being used; in particular such diff erences were noted in estimates reported by the European Monitoring Centre on Drugs and Drug Addiction (EMCDDA). *Prevalence fi gures were calculated by the authors using reported estimate of number of people who inject drugs and UN Population Division estimates of the 15–64-year-old population;10 midpoint fi gures for estimated number of people who inject drugs indicate that these were calculated by taking the midpoint of the reported range; fi gures for lower and upper estimated numbers of people who inject drugs indicate that these were calculated by the authors using reported prevalence estimates of injecting drug use and UN Population Division estimates of 15–64-year-old population. †Estimate of heroin users only.
Table 3: Prevalence of injecting drug use and HIV among people who inject drugs in Asia
Articles
6 www.thelancet.com Published online September 24, 2008 DOI:10.1016/S0140-6736(08)61311-2
Year of estimate of injecting drug use
Prevalence of injecting drug use, 15–64 year olds (%)
Estimated number of people who inject drugs
Grade of estimate
Defi nition of injecting drug use
Year of HIVestimate
Prevalence of HIV amongpeople who inject drugs (%)
HIV estimate grade
Lower Mid Upper Lower Mid Upper Lower Mid Upper
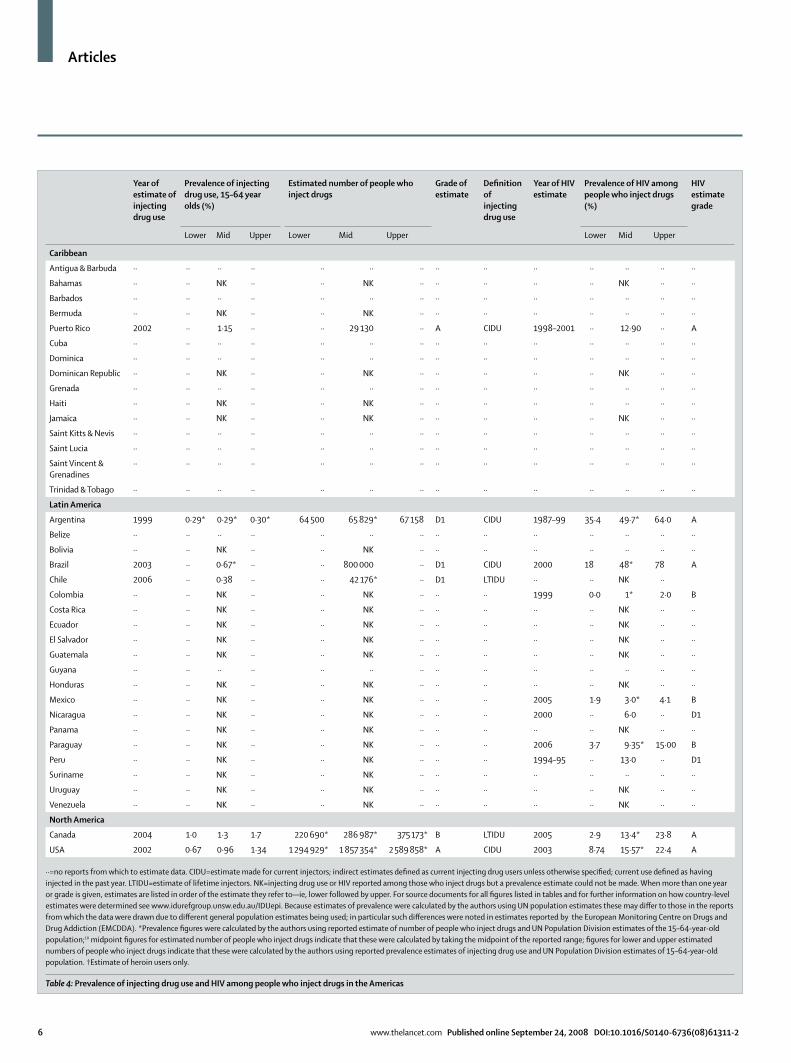
Caribbean
Antigua & Barbuda ·· ·· ·· ·· ·· ·· ·· ·· ·· ·· ·· ·· ·· ··
Bahamas ·· ·· NK ·· ·· NK ·· ·· ·· ·· ·· NK ·· ··
Barbados ·· ·· ·· ·· ·· ·· ·· ·· ·· ·· ·· ·· ·· ··
Bermuda ·· ·· NK ·· ·· NK ·· ·· ·· ·· ·· ·· ·· ··
Puerto Rico 2002 ·· 1·15 ·· ·· 29 130 ·· A CIDU 1998–2001 ·· 12·90 ·· A
Cuba ·· ·· ·· ·· ·· ·· ·· ·· ·· ·· ·· ·· ·· ··
Dominica ·· ·· ·· ·· ·· ·· ·· ·· ·· ·· ·· ·· ·· ··
Dominican Republic ·· ·· NK ·· ·· NK ·· ·· ·· ·· ·· NK ·· ··
Grenada ·· ·· ·· ·· ·· ·· ·· ·· ·· ·· ·· ·· ·· ··
Haiti ·· ·· NK ·· ·· NK ·· ·· ·· ·· ·· ·· ·· ··
Jamaica ·· ·· NK ·· ·· NK ·· ·· ·· ·· ·· NK ·· ··
Saint Kitts & Nevis ·· ·· ·· ·· ·· ·· ·· ·· ·· ·· ·· ·· ·· ··
Saint Lucia ·· ·· ·· ·· ·· ·· ·· ·· ·· ·· ·· ·· ·· ··
Saint Vincent & Grenadines
·· ·· ·· ·· ·· ·· ·· ·· ·· ·· ·· ·· ·· ··
Trinidad & Tobago ·· ·· ·· ·· ·· ·· ·· ·· ·· ·· ·· ·· ·· ··
Latin America
Argentina 1999 0·29* 0·29* 0·30* 64 500 65 829* 67 158 D1 CIDU 1987–99 35·4 49·7* 64·0 A
Belize ·· ·· ·· ·· ·· ·· ·· ·· ·· ·· ·· ·· ·· ··
Bolivia ·· ·· NK ·· ·· NK ·· ·· ·· ·· ·· ·· ·· ··
Brazil 2003 ·· 0·67* ·· ·· 800 000 ·· D1 CIDU 2000 18 48* 78 A
Chile 2006 ·· 0·38 ·· ·· 42 176* ·· D1 LTIDU ·· ·· NK ··
Colombia ·· ·· NK ·· ·· NK ·· ·· ·· 1999 0·0 1* 2·0 B
Costa Rica ·· ·· NK ·· ·· NK ·· ·· ·· ·· ·· NK ·· ··
Ecuador ·· ·· NK ·· ·· NK ·· ·· ·· ·· ·· NK ·· ··
El Salvador ·· ·· NK ·· ·· NK ·· ·· ·· ·· ·· NK ·· ··
Guatemala ·· ·· NK ·· ·· NK ·· ·· ·· ·· ·· NK ·· ··
Guyana ·· ·· ·· ·· ·· ·· ·· ·· ·· ·· ·· ·· ·· ··
Honduras ·· ·· NK ·· ·· NK ·· ·· ·· ·· ·· NK ·· ··
Mexico ·· ·· NK ·· ·· NK ·· ·· ·· 2005 1·9 3·0* 4·1 B
Nicaragua ·· ·· NK ·· ·· NK ·· ·· ·· 2000 ·· 6·0 ·· D1
Panama ·· ·· NK ·· ·· NK ·· ·· ·· ·· ·· NK ·· ··
Paraguay ·· ·· NK ·· ·· NK ·· ·· ·· 2006 3·7 9·35* 15·00 B
Peru ·· ·· NK ·· ·· NK ·· ·· ·· 1994–95 ·· 13·0 ·· D1
Suriname ·· ·· NK ·· ·· NK ·· ·· ·· ·· ·· ·· ·· ··
Uruguay ·· ·· NK ·· ·· NK ·· ·· ·· ·· ·· NK ·· ··
Venezuela ·· ·· NK ·· ·· NK ·· ·· ·· ·· ·· NK ·· ··
North America
Canada 2004 1·0 1·3 1·7 220 690* 286 987* 375 173* B LTIDU 2005 2·9 13·4* 23·8 A
USA 2002 0·67 0·96 1·34 1 294 929* 1 857 354* 2 589 858* A CIDU 2003 8·74 15·57* 22·4 A
··=no reports from which to estimate data. CIDU=estimate made for current injectors; indirect estimates defi ned as current injecting drug users unless otherwise specifi ed; current use defi ned as having injected in the past year. LTIDU=estimate of lifetime injectors. NK=injecting drug use or HIV reported among those who inject drugs but a prevalence estimate could not be made. When more than one year or grade is given, estimates are listed in order of the estimate they refer to—ie, lower followed by upper. For source documents for all fi gures listed in tables and for further information on how country-level estimates were determined see www.idurefgroup.unsw.edu.au/IDUepi. Because estimates of prevalence were calculated by the authors using UN population estimates these may diff er to those in the reports from which the data were drawn due to diff erent general population estimates being used; in particular such diff erences were noted in estimates reported by the European Monitoring Centre on Drugs and Drug Addiction (EMCDDA). *Prevalence fi gures were calculated by the authors using reported estimate of number of people who inject drugs and UN Population Division estimates of the 15–64-year-old population;10 midpoint fi gures for estimated number of people who inject drugs indicate that these were calculated by taking the midpoint of the reported range; fi gures for lower and upper estimated numbers of people who inject drugs indicate that these were calculated by the authors using reported prevalence estimates of injecting drug use and UN Population Division estimates of 15–64-year-old population. †Estimate of heroin users only.
Table 4: Prevalence of injecting drug use and HIV among people who inject drugs in the Americas

Articles
www.thelancet.com Published online September 24, 2008 DOI:10.1016/S0140-6736(08)61311-2 7
ResultsOf the 200 countries or territories considered here, injecting drug use was documented in 148 (74%; tables 2 to 6). Reports of injecting drug use in the Caribbean and sub-Saharan Africa were available for only a small number of countries (six of 15 in the Caribbean and 13 of 47 in sub-Saharan Africa).
Estimates of the prevalence of injecting drug use could be derived for 61 countries or territories, representing 77% of the world’s population aged 15–64 years. 40 of these estimates were based on indirect prevalence estimates such as capture-recapture and multiplier methods (grade A), 13 from unadjusted population survey data (grade B) or registration of drug users (grade C), and eight were offi cial government estimates that were reported without details of the methods used to derive the data (grade D1). Many of the reviewed documents reported estimates of the prevalence of injecting drug use and HIV without any clear indication of their source or the methods by which they were derived, and were thus excluded (grade D2). Estimation of the extent of injecting drug use had not been done in 87 countries where it was reported
to occur. Injecting was reported in 39 of 41 countries in Latin America, the Middle East, and north Africa, but prevalence estimates for only fi ve countries had been made. Estimates for 38 countries were based on data collected between 2004 and 2007. Estimates for eight countries (Argentina, Belgium, Denmark, France, Ireland, Italy, Spain, and Switzerland) were derived from data collected before 2000. About three-quarters of the country-level estimates of injecting drug use were based on data sourced from the grey literature; 53 were national-level prevalence estimates, the remaining estimates were based on extrapolation from sub-national estimates. For three countries, only estimates of lifetime injecting drug use could be made. Four estimates were based exclusively on the number of registered drug users. The remaining estimates were presumed to refer to current injecting drug use. Such drug use was defi ned in diff erent ways across studies and in many cases no explanation on what constituted current use was provided.
The prevalence of injecting drug use varied greatly (fi gure 2). Midpoint country estimates ranged from 0·02% (India and Cambodia) to 5·21% (Azerbaijan).
Year of estimate of injecting drug use
Prevalence of injecting drug use, 15–64 year olds (%)
Estimated number of people who inject drugs
Grade of estimate
Defi nition of injecting drug use
Year of HIV estimate
Prevalence of HIV amongpeople who inject drugs (%)
HIV estimate grade
Lower Mid Upper Lower Mid Upper Lower Mid Upper
Pacifi c Island states and territories
American Samoa ·· ·· ·· ·· ·· ·· ·· ·· ·· ·· ·· ·· ·· ··
Micronesia ·· ·· NK ·· ·· NK ·· ·· ·· ·· ·· NK ·· ··
Fiji ·· ·· NK ·· ·· NK ·· ·· ·· ·· ·· NK ·· ··
French Polynesia ·· ·· NK ·· ·· NK ·· ·· ·· ·· ·· NK ·· ··
Guam ·· ·· NK ·· ·· NK ·· ·· ·· ·· ·· NK ·· ··
Kiribati ·· ·· NK ·· ·· NK ·· ·· ·· ·· ·· ·· ·· ··
Marshall Islands ·· ·· ·· ·· ·· ·· ·· ·· ·· ·· ·· ·· ·· ··
Nauru ·· ·· ·· ·· ·· ·· ·· ·· ·· ·· ·· ·· ·· ··
New Caledonia ·· ·· NK ·· ·· NK ·· ·· ·· ·· ·· NK ·· ··
Palau ·· ·· ·· ·· ·· ·· ·· ·· ·· ·· ·· ·· ·· ··
Papua New Guinea ·· ·· NK ·· ·· NK ·· ·· ·· ·· ·· NK ·· ··
Samoa ·· ·· NK ·· ·· NK ·· ·· ·· 2004–05 ·· 0 ·· D1
Solomon Islands ·· ·· NK ·· ·· NK ·· ·· ·· 2004–05 ·· 0 ·· D1
Tonga ·· ·· NK ·· ·· NK ·· ·· ·· 2004–05 ·· 0 ·· D1
Tuvalu ·· ·· ·· ·· ·· ·· ·· ·· ·· ·· ·· ·· ·· ··
Vanuatu ·· ·· NK ·· ·· NK ·· ·· ·· ·· ·· ·· ·· ··
Australasia
Australia 2005 0·65* 1·09* 1·50* 89 253 149 591 204 564 A CIDU 2006 ·· 1·5 ·· A
New Zealand 2006 0·49* 0·73* 0·97* 13 535 20 163 26 792 B CIDU 2006 ·· 1·6 ·· B
··=no reports from which to estimate data. CIDU=estimate made for current injectors; indirect estimates defi ned as current injecting drug users unless otherwise specifi ed; current use defi ned as having injected in the past year. NK=injecting drug use or HIV reported among those who inject drugs but a prevalence estimate could not be made. When more than one year or grade is given, estimates are listed in order of the estimate they refer to—ie, lower followed by upper. For source documents for all fi gures listed in tables and for further information on how country level estimates were determined see www.idurefgroup.unsw.edu.au/IDUepi. Because estimates of prevalence were calculated by the authors using UN population estimates these may diff er to those in the reports from which the data were drawn due to diff erent general population estimates being used; in particular such diff erences were noted in estimates reported by the European Monitoring Centre on Drugs and Drug Addiction (EMCDDA). *Prevalence fi gures were calculated by the authors using reported estimate of number of people who inject drugs and UN Population Division estimates of the 15–64-year-old population;10 midpoint fi gures for estimated number of people who inject drugs indicate that these were calculated by taking the midpoint of the reported range; fi gures for lower and upper estimated numbers of people who inject drugs indicate that these were calculated by the authors using reported prevalence estimates of injecting drug use and UN Population Division estimates of 15–64-year-old population. †Estimate of heroin users only.
Table 5: Prevalence of injecting drug use and HIV among people who inject drugs in Oceania

Articles
8 www.thelancet.com Published online September 24, 2008 DOI:10.1016/S0140-6736(08)61311-2
Year of estimate of injecting drug use
Prevalence of injecting drug use, 15–64 year olds (%)
Estimated number of people who inject drugs
Grade of estimate
Defi nition of injecting drug use
Year of HIVestimate
Prevalence of HIV amongpeople who inject drugs (%)
HIV estimate grade
Lower Mid Upper Lower Mid Upper Lower Mid Upper
Middle East and north Africa
Algeria ·· ·· NK ·· ·· NK ·· ·· ·· ·· ·· NK ·· ··
Bahrain ·· ·· NK ·· ·· NK ·· ·· ·· 2000 ·· 0·3 ·· B
Cyprus 2006 0·04* 0·05* 0·07* 257 305 382 A CIDU 2006 ·· 0·0 ·· B
Egypt ·· ·· NK ·· ·· NK ·· ·· ·· 2006 0·6 2·55* 4·5 B
Iraq ·· ·· NK ·· ·· NK ·· ·· ·· ·· ·· ·· ·· ··
Israel ·· ·· NK ·· ·· NK ·· ·· ·· 2005, 2002–06 2·07 2·94* 3·81 B, A
Jordan ·· ·· NK ·· ·· NK ·· ·· ·· ·· ·· NK ·· ··
Kuwait ·· ·· NK ·· ·· NK ·· ·· ·· ·· ·· NK ·· ··
Lebanon ·· ·· NK ·· ·· NK ·· ·· ·· ·· ·· NK ·· ··
Libya 2001 ·· 0·05* ·· ·· 1685 ·· C REG 2004 ·· 22 ·· B
Morocco ·· ·· NK ·· ·· NK ·· ·· ·· 2006 ·· 6·5 ·· C
Oman ·· ·· NK ·· ·· NK ·· ·· ·· 2000, 2000–05 5 11·8 18·6 B
Palestine ·· ·· NK ·· ·· NK ·· ·· ·· ·· ·· NK ·· ··
Qatar ·· ·· NK ·· ·· NK ·· ·· ·· ·· ·· NK ·· ··
Saudi Arabia ·· ·· NK ·· ·· NK ·· ·· ·· 1997 ·· 0·14 ·· B
Sudan ·· ·· NK ·· ·· NK ·· ·· ·· 2003 ·· 0 ·· B
Syria ·· ·· NK ·· ·· NK ·· ·· ·· ·· ·· NK ·· ··
Tunisia ·· ·· NK ·· ·· NK ·· ·· ·· 1997 ·· 0·3 ·· B
Turkey ·· ·· NK ·· ·· NK ·· ·· ·· 2005, 2001 2·3 2·65* 3 B
United Arab Emirates ·· ·· NK ·· ·· NK ·· ·· ·· ·· ·· ·· ·· ··
Yemen ·· ·· NK ·· ·· NK ·· ·· ·· ·· ·· ·· ·· ··
Sub-Saharan Africa
Angola ·· ·· ·· ·· ·· ·· ·· ·· ·· ·· ·· ·· ·· ··
Benin ·· ·· ·· ·· ·· ·· ·· ·· ·· ·· ·· ·· ·· ··
Botswana ·· ·· ·· ·· ·· ·· ·· ·· ·· ·· ·· ·· ·· ··
Burkina Faso ·· ·· ·· ·· ·· ·· ·· ·· ·· ·· ·· ·· ·· ··
Burundi ·· ·· ·· ·· ·· ·· ·· ·· ·· ·· ·· ·· ·· ··
Cameroon ·· ·· ·· ·· ·· ·· ·· ·· ·· ·· ·· ·· ·· ··
Cape Verde ·· ·· ·· ·· ·· ·· ·· ·· ·· ·· ·· ·· ·· ··
Central African Republic ·· ·· ·· ·· ·· ·· ·· ·· ·· ·· ·· ·· ·· ··
Chad ·· ·· ·· ·· ·· ·· ·· ·· ·· ·· ·· ·· ·· ··
Comoros ·· ·· ·· ·· ·· ·· ·· ·· ·· ·· ·· ·· ·· ··
Cote d’Ivoire ·· ·· NK ·· ·· NK ·· ·· ·· ·· ·· ·· ·· ··
Dem Rep of the Congo ·· ·· ·· ·· ·· ·· ·· ·· ·· ·· ·· ·· ·· ··
Djibouti ·· ·· NK ·· ·· NK ·· ·· ·· ·· ·· NK ·· ··
Equatorial Guinea ·· ·· ·· ·· ·· ·· ·· ·· ·· ·· ·· ·· ·· ··
Eritrea ·· ·· ·· ·· ·· ·· ·· ·· ·· ·· ·· ·· ·· ··
Ethiopia ·· ·· ·· ·· ·· ·· ·· ·· ·· ·· ·· ·· ·· ··
Gabon ·· ·· NK ·· ·· NK ·· ·· ·· ·· ·· ·· ·· ··
Gambia ·· ·· ·· ·· ·· ·· ·· ·· ·· ·· ·· ·· ·· ··
Ghana ·· ·· NK ·· ·· NK ·· ·· ·· ·· ·· ·· ·· ··
Guinea ·· ·· ·· ·· ·· ·· ·· ·· ·· ·· ·· ·· ·· ··
Guinea-Bissau ·· ·· ·· ·· ·· ·· ·· ·· ·· ·· ·· ·· ·· ··
Kenya 2004, 2000–02 0·16 0·73* 1·3 30 264* 130 748* 231 231* C CIDU 2004, 2003 36·3 42·9* 49·5 B
Lesotho ·· ·· ·· ·· ·· ·· ·· ·· ·· ·· ·· ·· ·· ··
Liberia ·· ·· ·· ·· ·· ·· ·· ·· ·· ·· ·· ·· ·· ··
Madagascar ·· ·· ·· ·· ·· ·· ·· ·· ·· ·· ·· ·· ·· ··
(Continues on next page)
Articles
www.thelancet.com Published online September 24, 2008 DOI:10.1016/S0140-6736(08)61311-2 9
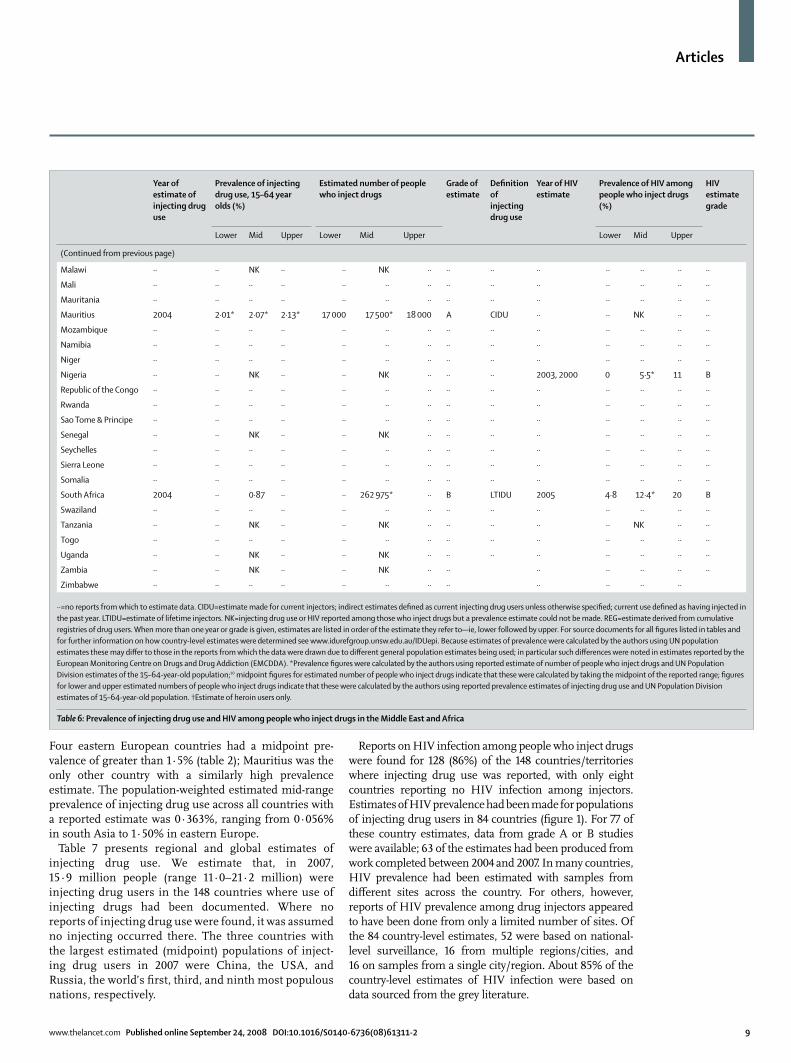
Four eastern European countries had a midpoint pre-valence of greater than 1·5% (table 2); Mauritius was the only other country with a similarly high prevalence estimate. The population-weighted estimated mid-range prevalence of injecting drug use across all countries with a reported estimate was 0·363%, ranging from 0·056% in south Asia to 1·50% in eastern Europe.
Table 7 presents regional and global estimates of injecting drug use. We estimate that, in 2007, 15·9 million people (range 11·0–21·2 million) were injecting drug users in the 148 countries where use of injecting drugs had been documented. Where no reports of injecting drug use were found, it was assumed no injecting occurred there. The three countries with the largest estimated (midpoint) populations of inject-ing drug users in 2007 were China, the USA, and Russia, the world’s fi rst, third, and ninth most populous nations, respectively.
Reports on HIV infection among people who inject drugs were found for 128 (86%) of the 148 countries/territories where injecting drug use was reported, with only eight countries reporting no HIV infection among injectors. Estimates of HIV prevalence had been made for populations of injecting drug users in 84 countries (fi gure 1). For 77 of these country estimates, data from grade A or B studies were available; 63 of the estimates had been produced from work completed between 2004 and 2007. In many countries, HIV prevalence had been estimated with samples from diff erent sites across the country. For others, however, reports of HIV prevalence among drug injectors appeared to have been done from only a limited number of sites. Of the 84 country-level estimates, 52 were based on national-level surveillance, 16 from multiple regions/cities, and 16 on samples from a single city/region. About 85% of the country-level estimates of HIV infection were based on data sourced from the grey literature.
Year of estimate of injecting drug use
Prevalence of injecting drug use, 15–64 year olds (%)
Estimated number of people who inject drugs
Grade of estimate
Defi nition of injecting drug use
Year of HIVestimate
Prevalence of HIV amongpeople who inject drugs (%)
HIV estimate grade
Lower Mid Upper Lower Mid Upper Lower Mid Upper
(Continued from previous page)
Malawi ·· ·· NK ·· ·· NK ·· ·· ·· ·· ·· ·· ·· ··
Mali ·· ·· ·· ·· ·· ·· ·· ·· ·· ·· ·· ·· ·· ··
Mauritania ·· ·· ·· ·· ·· ·· ·· ·· ·· ·· ·· ·· ·· ··
Mauritius 2004 2·01* 2·07* 2·13* 17 000 17 500* 18 000 A CIDU ·· ·· NK ·· ··
Mozambique ·· ·· ·· ·· ·· ·· ·· ·· ·· ·· ·· ·· ·· ··
Namibia ·· ·· ·· ·· ·· ·· ·· ·· ·· ·· ·· ·· ·· ··
Niger ·· ·· ·· ·· ·· ·· ·· ·· ·· ·· ·· ·· ·· ··
Nigeria ·· ·· NK ·· ·· NK ·· ·· ·· 2003, 2000 0 5·5* 11 B
Republic of the Congo ·· ·· ·· ·· ·· ·· ·· ·· ·· ·· ·· ·· ·· ··
Rwanda ·· ·· ·· ·· ·· ·· ·· ·· ·· ·· ·· ·· ·· ··
Sao Tome & Principe ·· ·· ·· ·· ·· ·· ·· ·· ·· ·· ·· ·· ·· ··
Senegal ·· ·· NK ·· ·· NK ·· ·· ·· ·· ·· ·· ·· ··
Seychelles ·· ·· ·· ·· ·· ·· ·· ·· ·· ·· ·· ·· ·· ··
Sierra Leone ·· ·· ·· ·· ·· ·· ·· ·· ·· ·· ·· ·· ·· ··
Somalia ·· ·· ·· ·· ·· ·· ·· ·· ·· ·· ·· ·· ·· ··
South Africa 2004 ·· 0·87 ·· ·· 262 975* ·· B LTIDU 2005 4·8 12·4* 20 B
Swaziland ·· ·· ·· ·· ·· ·· ·· ·· ·· ·· ·· ·· ·· ··
Tanzania ·· ·· NK ·· ·· NK ·· ·· ·· ·· ·· NK ·· ··
Togo ·· ·· ·· ·· ·· ·· ·· ·· ·· ·· ·· ·· ·· ··
Uganda ·· ·· NK ·· ·· NK ·· ·· ·· ·· ·· ·· ·· ··
Zambia ·· ·· NK ·· ·· NK ·· ·· ·· ·· ·· ·· ··
Zimbabwe ·· ·· ·· ·· ·· ·· ·· ·· ·· ·· ·· ··
··=no reports from which to estimate data. CIDU=estimate made for current injectors; indirect estimates defi ned as current injecting drug users unless otherwise specifi ed; current use defi ned as having injected in the past year. LTIDU=estimate of lifetime injectors. NK=injecting drug use or HIV reported among those who inject drugs but a prevalence estimate could not be made. REG=estimate derived from cumulative registries of drug users. When more than one year or grade is given, estimates are listed in order of the estimate they refer to—ie, lower followed by upper. For source documents for all fi gures listed in tables and for further information on how country-level estimates were determined see www.idurefgroup.unsw.edu.au/IDUepi. Because estimates of prevalence were calculated by the authors using UN population estimates these may diff er to those in the reports from which the data were drawn due to diff erent general population estimates being used; in particular such diff erences were noted in estimates reported by the European Monitoring Centre on Drugs and Drug Addiction (EMCDDA). *Prevalence fi gures were calculated by the authors using reported estimate of number of people who inject drugs and UN Population Division estimates of the 15–64-year-old population;10 midpoint fi gures for estimated number of people who inject drugs indicate that these were calculated by taking the midpoint of the reported range; fi gures for lower and upper estimated numbers of people who inject drugs indicate that these were calculated by the authors using reported prevalence estimates of injecting drug use and UN Population Division estimates of 15–64-year-old population. †Estimate of heroin users only.
Table 6: Prevalence of injecting drug use and HIV among people who inject drugs in the Middle East and Africa

Articles
10 www.thelancet.com Published online September 24, 2008 DOI:10.1016/S0140-6736(08)61311-2
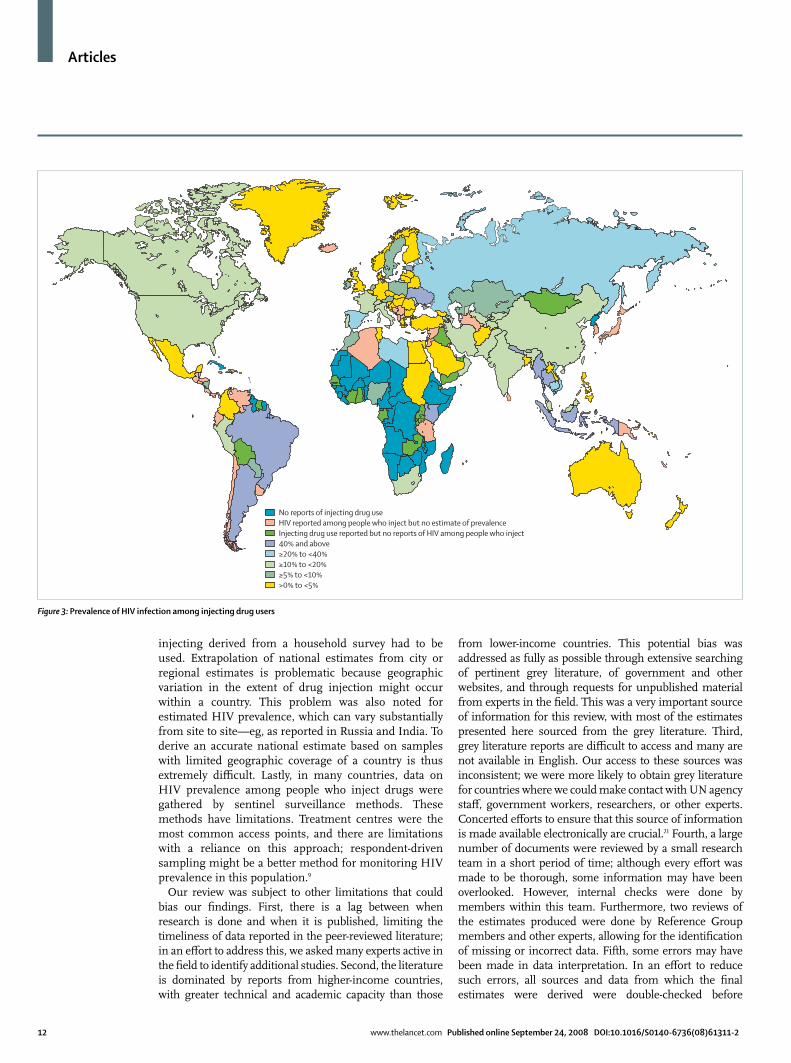
HIV prevalence varied greatly both between and within countries (fi gure 3). Country-level midpoint prevalence ranged from less than 0·01% (eight countries) to 72·1% (Estonia). HIV prevalence was 20–40% in fi ve countries and was greater than 40% in another nine. The countries with the largest estimated populations of injecting drug users—China, Russia, and the USA—all had midpoint estimates of HIV prevalence in these populations of over 10%. Ranges were reported for 40 countries and were considerably wide in most cases, on average about 50% around the midpoint prevalence estimates. HIV prevalence also varied within countries. In China, HIV infection among injecting drug users was reported to be concentrated within seven of the country’s provinces.11 In Russia, the reported prevalence of HIV infection among injecting drug users was noted as 0·3% in Pskov, 12·4% in Moscow, 32% in St Petersburg, and 74% in Biysk.12
Extrapolating to all countries, we estimate that globally about 3·0 million (range 0·8–6·6 million) people who inject drugs might be HIV positive (table 7); the largest populations of HIV-positive injecting drug users were in eastern Europe, east and southeast Asia, and Latin America. However, the large range of each of these estimates refl ects the considerable uncertainty around the estimates resulting from varying HIV prevalence among diff erent sub-populations of injecting drug users; recruitment from diff erent settings; and subcountry regional variation.
Discussion We estimate that there are about 16 million (range 11–21 million) individuals who inject drugs worldwide. Extrapolated estimates of HIV prevalence within this population are extremely tenuous, but around 3 million (range 1–7 million) injectors might be living with HIV. Within this population, we found clear geographic diff erences in estimated HIV prevalence. Areas of parti-cular concern are countries in southeast Asia, eastern Europe, and Latin America, where the prevalence of HIV infection among some subpopulations of people who inject drugs has been reported to be over 40%. Indeed, the prevalence of HIV infection among injecting drug users was reported to be zero in only eight of 148 countries.
A related review from 1998 identifi ed 129 countries where drug injecting was reported to occur,13 compared with 148 presented here. Similarly, in 1998 HIV infection was reported among injecting drug users in 103 countries13 compared with the 120 countries reported here. These diff erences suggest an increase in injecting drug use over time, but it is worth noting that the current review used a more sophisticated search strategy than did the earlier review, and there have probably been improvements in the documentation of injecting drug use and HIV infection over the past decade. Even so, no verifi able estimates of the number of injecting drug users could be obtained in most of the countries that reported injecting
No reports of injecting drug use identifiedInjecting drug use reported but no estimate of prevalence≥1%≥0·5% to <1%≥0·25% to <0·5%>0% to <0·25%
Figure 2: Prevalence of injecting drug use

Articles
www.thelancet.com Published online September 24, 2008 DOI:10.1016/S0140-6736(08)61311-2 11
drug use (87 of 148 countries); indeed, in a further 52 countries we could fi nd no published data on whether or not injecting drug use actually occurred. There is a pressing need to understand the extent of injecting drug use in all countries.
It is not clear how the size of the global population of injecting drug users has changed over time. The fi rst estimation exercise done in 2004 brought the potential size of the global population of injecting drug users to greater international attention.6 However, we believe it would be misleading to compare the two estimates. We drew data from a broad range and number of sources and excluded estimates that had no documentation of methodology; by contrast, 90% of the country-level estimates in the earlier review did not have details of methodology or a published reference to verify them. Further, few countries have produced estimates in diff erent time periods to allow for trends to be observed.
Injecting drug use may increase or emerge in countries where it is not already established.14,15 There is cause for concern about this in some regions. Little is known about injecting drug use in sub-Saharan Africa, but a constellation of risk factors exist for the development of injecting drug use, as has occurred elsewhere, for example in central Asia.16 First, injecting drug use is already well-established in a number of countries (Kenya, Mauritius, Nigeria, South Africa, and Tanzania). Second, socioeconomic hardship is common, and many people are exposed to confl ict situations. Third, many countries in the region are being increasingly used for the transit of illicit drugs into Europe.14,15 Because sub-Saharan Africa is a region with particularly high HIV-1 prevalence, with a range of social and biological risk factors having a role,17 the potential
emergence of injecting drug use as an additional route of HIV transmission warrants serious attention.
The dynamics of the spread of HIV infection are notable: a decade ago, HIV was not identifi ed among people who inject drugs in Estonia;13 by contrast, a more recent estimate now suggests that the prevalence of HIV infection had reached 72% in one sample of injecting drug users.18 Australia and New Zealand have maintained very low levels of HIV infection19 despite a higher prevalence of injecting than in some other countries; this diff erence has been attributed to geographic isolation, as well as the swift introduction of needle and syringe programmes when HIV infection was fi rst noted in the 1980s.20
Our study has a number of limitations related to the nature of the literature from which the data were collected. There exists a lack of consistency in defi nitions of injecting drug users in prevalence estimation studies, making comparisons between countries and studies diffi cult. In many instances, data are presented in the literature without qualifi cation of how injecting drug use has been defi ned. Furthermore, populations of injecting drug users are typically hard to access, and measuring their size is challenging. Many diff erent methods to measure this behaviour were reported in the literature, some of which may not provide good prevalence estimates. For some countries, the only measure available was the number of registered injecting drug users. Registration of drug users is common in many countries but the nature of registration can range from treatment registers to arrest counts; undoubtedly only a proportion of injecting drug users would ever be registered. Among some countries, such as Canada, no indirect prevalence estimates could be located, and an estimate of lifetime
Estimated number of people who inject drugs Estimated number of people who inject drugs and who are HIV positive
Lower Mid Upper Lower Mid Upper
Eastern Europe 2 540 000 3 476 500 4 543 500 18 500 940 000 2 422 000
Western Europe 816 000 1 044 000 1 299 000 39 000 114 000 210 500
East and southeast Asia 3 043 500 3 957 500 4 913 000 313 000 661 000 1 251 500
South Asia 434 000 569 500 726 500 34 500 74 500 135 500
Central Asia 182 500 247 500 321 000 16 500 29 000 47 000
Caribbean 137 500 186 000 241 500 6000 24 000 52 500
Latin America 1 508 000 2 018 000 2 597 500 181 500 580 500 1 175 500
Canada and USA 1 604 500 2 270 500 3 140 000 127 000 347 000 709 000
Pacifi c Island states and territories 14 500 19 500 25 000 <250 500 500
Australia and New Zealand 105 000 173 500 236 500 500 2500 6000
Middle East and north Africa 89 000 121 000 156 500 1500 3500 6500
Sub-Saharan Africa* 534 500 1 778 500 3 022 500 26 000 221 000 572 000
Extrapolated global estimates 11 008 500 15 861 500 21 222 000 764 000 2 997 500 6 589 000
All estimates rounded to the nearest 500; global fi gure totalled from regional estimates before rounding. 2007 UN population division estimates have been used to derive 2007 estimates of IDU population size. *Estimates for sub-Saharan Africa should be viewed with considerable caution as the prevalence estimates were derived from three of 47 countries in the region (South Africa, Mauritius, and Kenya). Additionally, the estimated range of injecting drug use for this region was derived by applying the regional observed error; this large error band refl ects the considerable uncertainty around these estimates.
Table 7: Regional and global estimates of the number of people who inject drugs, and the number who may be HIV positive, 2007
For further details on methods used to make these estimates see www.idurefgroup.unsw.edu.au/IDUepi
Articles
12 www.thelancet.com Published online September 24, 2008 DOI:10.1016/S0140-6736(08)61311-2
injecting derived from a household survey had to be used. Extrapolation of national estimates from city or regional estimates is problematic because geographic variation in the extent of drug injection might occur within a country. This problem was also noted for estimated HIV prevalence, which can vary substantially from site to site—eg, as reported in Russia and India. To derive an accurate national estimate based on samples with limited geographic coverage of a country is thus extremely diffi cult. Lastly, in many countries, data on HIV prevalence among people who inject drugs were gathered by sentinel surveillance methods. These methods have limitations. Treatment centres were the most common access points, and there are limitations with a reliance on this approach; respondent-driven sampling might be a better method for monitoring HIV prevalence in this population.9
Our review was subject to other limitations that could bias our fi ndings. First, there is a lag between when research is done and when it is published, limiting the timeliness of data reported in the peer-reviewed literature; in an eff ort to address this, we asked many experts active in the fi eld to identify additional studies. Second, the literature is dominated by reports from higher-income countries, with greater technical and academic capacity than those
from lower-income countries. This potential bias was addressed as fully as possible through extensive searching of pertinent grey literature, of government and other websites, and through requests for unpublished material from experts in the fi eld. This was a very important source of information for this review, with most of the estimates presented here sourced from the grey literature. Third, grey literature reports are diffi cult to access and many are not available in English. Our access to these sources was inconsistent; we were more likely to obtain grey literature for countries where we could make contact with UN agency staff , government workers, researchers, or other experts. Concerted eff orts to ensure that this source of information is made available electronically are crucial.21 Fourth, a large number of documents were reviewed by a small research team in a short period of time; although every eff ort was made to be thorough, some information may have been overlooked. However, internal checks were done by members within this team. Furthermore, two reviews of the estimates produced were done by Reference Group members and other experts, allowing for the identifi cation of missing or incorrect data. Fifth, some errors may have been made in data interpretation. In an eff ort to reduce such errors, all sources and data from which the fi nal estimates were derived were double-checked before
No reports of injecting drug useHIV reported among people who inject but no estimate of prevalenceInjecting drug use reported but no reports of HIV among people who inject40% and above≥20% to <40%≥10% to <20%≥5% to <10%>0% to <5%
Figure 3: Prevalence of HIV infection among injecting drug users
Articles
www.thelancet.com Published online September 24, 2008 DOI:10.1016/S0140-6736(08)61311-2 13
inclusion. Again, the process of internal and external review of estimates provided for some checks against this possibility. All data are available from our website to facilitate transparency. Lastly, English language documents were primarily reviewed. However, the abstracts of many non-English language peer-reviewed articles were included when available in English. All members of the Reference Group were required to review the estimates and within this group were members from a variety of non-English speaking backgrounds, with knowledge relating to all geographic regions. The estimates were also reviewed by WHO, UNAIDS, and UNODC representatives with access to other non-English language material.
Injecting drug use occurs in most countries and HIV infection is prevalent among many populations of injecting drug users, representing a major challenge to global public health. People who inject drugs have the right to enjoy the highest standard of health attainable. There is a clear mandate to invest in HIV prevention activities such as needle and syringe programmes and opioid substitution treatment and to provide treatment and care for those who are living with HIV/AIDS.22 The magnitude of the risk has not been met with an equally concerted investment in research to accurately quantify the problem. Such investment could currently be beyond the capacity of some countries; guidelines for the conduct of good quality research in this area could assist such countries, with a focus on indirect estimation of prevalence and regular sentinel HIV surveillance. Developing research capacity within countries is an important priority: only then can eff orts to prevent HIV infection among this population be targeted appropriately to eff ectively and comprehensively reduce the transmission of HIV and other harms related to drug injecting, and to assess the outcomes of these interventions. ContributorsBM and LD developed the methodology for this review with assistance from BP, LW, and MH. The methodology was approved by SS, AW, SP, MT, AT, and RPM. The collected literature was reviewed by BM, LD, and BP. BM and LD calculated the estimates with advice from LW and MH. LW assisted with the provision of data and the calculation of estimates for the European region. BM and LD drafted the manuscript. LW, MH, BP, SS, AW, SP, MT, AT, and RPM reviewed and commented on the estimates and the draft manuscript. All authors gave approval for the manuscript to be submitted.
2007 Reference Group to the UN on HIV and Injecting Drug UseTasnim Azim, Mauro Guarinieri, Matthew Hickman, Adeeba Kamarulzaman, Kasia Malinowska-Sempruch, Fabio Mesquita, Azarakhsh Mokri, Olanrewaju Olusola Onigbogi, Fred Owiti, Samiran Panda, Steff anie Strathdee, Fayzal Sulliman, Abdalla Toufi k, Jallal Toufi q, Mark Tyndall, Lucas Wiessing.
Confl ict of interest statementWe declare that we have no confl ict of interest.
Acknowledgments This study was done as part of the work of the 2007 Reference Group to the UN on HIV and Injecting Drug Use, an independent group of international experts established to provide technical advice to the co-sponsors of the UN Joint Programme on HIV/AIDS on eff ective approaches to HIV prevention and care among people who inject drugs. The Secretariat for the Reference Group is funded by the UN Offi ce on Drugs and Crime (UNODC). This work was also fi nancially supported by
For all data see www.idurefgroup.unsw.edu.au/IDUepi
Australian National Drug and Alcohol Research Centre, which receives funding from the Australian Department of Health and Ageing. LD is the recipient of an Australian NHMRC Senior Research Fellowship. Eva Congreve, Anna Roberts, Amanda Roxburgh, and Jessica Singleton assisted with the literature search and the review of the collected material.
References1 UNAIDS. 2006 report on the global AIDS epidemic. Geneva: Joint
UN Programme on HIV/AIDS, 2006.2 Degenhardt L, Hall W, Lynskey M, Warner-Smith M. Chapter 13:
Illicit drug use. In: Ezzati M, Lopez AD, Rodgers A, Murray CJL, eds. Comparative quantifi cation of health risks: global and regional burden of disease attributable to selected major risk factors, 2nd edn. Geneva: World Health Organization, 2004.
3 Ezzati M, Lopez AD, Rodgers A, Vander Hoorn S, Murray CJL, for the Comparative Risk Assessment Collaborating Group. Selected major risk factors and global and regional burden of disease. Lancet 2002; 360: 1347–60.
4 Amorim C, Dlamini-Zuma N, Douste-Blazy P, et al. Oslo Ministerial Declaration—global health: a pressing foreign policy issue of our time. Lancet 2007; 369: 1373–78.
5 Murray CJL, Frenk J. Health metrics and evaluation: strengthening the science. Lancet 2008; 371: 1191–99.
6 Aceijas C, Stimson GV, Hickman M, Rhodes T. Global overview of injecting drug use and HIV infection among injecting drug users. AIDS 2004; 18: 2295–303.
7 Hickman M, Taylor C. Indirect methods to estimate prevalence. In: Sloboda Z, ed. Epidemiology of drug abuse. New York: Springer Science & Business Media, 2005.
8 Hall WD, Ross JE, Lynskey MT, Law MG, Degenhardt LJ. How many dependent heroin users are there in Australia? Med J Aust 2000; 173: 528–31.
9 Magnani R, Sabin K, Saidel T, Heckathorn D. Review of sampling hard-to-reach and hidden populations for HIV surveillance. AIDS 2005; 19 (suppl 2): S67–72.
10 UN Population Division. World population prospects: the 2006 revision. New York: United Nations, 2007.
11 Lu F, Wang N, Wu Z, et al. Estimating the number of people at risk for and living with HIV in China in 2005: methods and results. Sex Transm Infect 2006; 82 (suppl 3): S87–91.
12 Borschevskaya V, Tumano M. Country report of the Russian Federation on the implementation of the Declaration of Commitment on HIV/AIDS (UNGASS). January–December 2005. Moscow: Federal Services for Surveillance of Consumer Rights and Welfare of Russian Federation, 2006.
13 Ball AL, Rana S, Dehne KL. HIV prevention among injecting drug users: responses in developing and transitional countries. Public Health Reports 1998; 113: 12.
14 International Narcotics Control Board. Report of the International Narcotics Control Board for 2007. Vienna: United Nations, 2008.
15 UNODC. World drug report. Vienna: UN Offi ce on Drugs and Crime, 2007.
16 Renton A, Gzirishvilli D, Gotsadze G, Godinho J. Epidemics of HIV and sexually transmitted infections in central Asia: trends, drivers and priorities for control. Int J Drug Pol 2006; 17: 494–503.
17 Buvé A, Bishikwabo-Nsarhaza K, Mutangadura G. The spread and eff ect of HIV-1 infection in sub-Saharan Africa. Lancet 2002; 359: 7.
18 EMCDDA. 2007 annual report: the state of the drugs problem in Europe. Lisbon: European Monitoring Centre for Drugs and Drug Addiction, 2007.
19 National Centre in HIV Epidemiology and Clinical Research. Australian NSP survey national data report 2003-2007: prevalence of HIV, HCV and injecting and sexual behaviour among IDUs at needle and syringe programs. Sydney: University of New South Wales, 2008.
20 Sendziuk P. Harm reduction and HIV-prevention among injecting drug users in Australia: an international comparison. Can Bull Med Hist 2007; 24: 17.
21 Calabria B, Phillips B, Singleton J, et al. Searching the grey literature to access information on drug and alcohol research. NDARC Technical Report No. 293. Sydney: National Drug and Alcohol Research Centre, 2008.
22 UN. Declaration of commitment on HIV/AIDS. UN General Assembly Special Session on HIV/AIDS. New York: United Nations, 2001.