Embed Size (px)
Citation preview

ARTICLES
EMPLOYMENT IN NORTH-EAST INDIA:AN INVESTIGATION
Krishna Surjya Das1
ABSTRACT
This paper attempts to study the process of employmentgrowth in north-eastern region of India. The region isprimarily grounded in rural economy, which is most isolatedand underdeveloped region of India. The negative growthrate of regular employment indicates poor quality of jobavailability in the region. The structural transformation hasbeen observed in the secondary sector which is led by theconstruction industry of the region. The binary logisticregression in our analysis observes a U-shape relationshipbetween education and employment in the region. The ST’sand Other’s participation in the region is lower than that ofSC and OBC community which defies the national patternof higher workforce participation of the ST community.The Christians and other community are more likely to be inthe workforce in the region. Finally, individuals from allother states, except Assam, have higher probability of beingin the workforce in the region.
Keywords: North-East India, Workforce, Elasticity, Industry, Determinants1. IntroductionEmployment is a key parameter of development, and the study of employmentis an important aspect to understand the growth phenomenon of an economy.Therefore, the analysis of the nature of employment is a widely discussedagenda among the researchers and policymakers. However, the labourmarket is witnessing a change in its nature of work from ‘standardemployment’ to ‘casual employment’ in recent times (ILO, 2015). While thedeveloped nations are experiencing a transformation of their workforce from
Manpower Journal, Vol.LII, Nos.1&2, January-June 2018
1 Ph.D. Scholar, Centre for the Study of Regional Development, School of Social Sciences, Jawaharlal Nehru University, New Delhi, India E-mail: [email protected]

2 Manpower Journal, Vol.LII, Nos.1&2, January-June 2018..............................................................................................................standard conventional employment to casual or home-based employment,the developing nations are witnessing a shift of employment from formal toinformal sector (ibid, 2015). The Indian labour market can be looked throughtwo scenarios – the pre-liberalisation period and the post-liberalisation period.During the first planning period of the independent India, it was expectedthat the economic growth would automatically improve the employmentsituation, but the situation of unemployment worsened in the nation(Papola, 2003). Therefore, the second five-year plan emphasised theproduction and capital goods industry to improve the status of unemploymentand poverty (Hari, 2000). During the period 1983/84 to 1993/94,the employment growth rate surpassed the population growth rate in thenation (Himanshu, 2011). The next period, 1993/94 to 2004/05, observed apositive growth rate of employment but at a sluggish rate than the period1983/84 to 1993/94 (Unni & Raveendran, 2007). However, with the increasingemployment growth rate the nation started witnessing income inequalities inthe society (Bhalla, 2008). The Indian labour force increases from 381 millionto 485 million during the post-liberalisation period (1993/94–2011/12), i.e.every year almost 5.5 million new people entered the labour market(Mehrotra, Parida & Singh, 2014). A decline in self-employment and a rise incasual employment were observed during the 1990s in the rural labour market.The urban labour market observed a decline in regular employment and arise in self and casual employment during the same period. Self-employmentrecorded a rapid increase during the year 2004/05 (Unni & Raveendran,2007; Himanshu, 2011; Mehrotra, Parida & Singh, 2014). In the latest 2011/12 National Sample Survey (NSS), almost 50 per cent of workers were foundin the self-employed category, and only 20 per cent of them were engaged inregular employment, while the rest were in casual employment (Shaw, 2013).The structural transformation of the Indian economy, that is, thetransformation of the workers from farm sector to non-farm sector has beenfound significantly high during the post-liberalisation period (Binswanger-Mkhize, 2013; Hensman, 2001; Sundaram, 2008; Chakravarty & Mitra, 2009;Himanshu, 2011). According to Papola & Sahu (2012), structuraltransformation gets processed rapidly in an open economy than in a closedeconomy. The international experience suggested the shift of the workersfrom the agricultural sector to non-farm sector, specifically due to the “push”of technological change in the agricultural sector and the “pull” of higherwage rate by non-farm sector (Fei & Ranis, 1975). During the post-liberalisation period, the construction sector generated most of theemployment opportunities in the non-farm sector, but mostly for the maleworkers (Bhalla, 2008). The analysis of Lahoti and Swaminathan (2013)observed the increase in casual jobs during 2004/05 to 2009/10 periodirrespective of the gender. During the period 2004/05 to 2009/10, theconstruction sector accounted for almost all the employment opportunitiescreated in the rural non-farm sector (Thomas, 2012). Moreover, the rise inemployment in the non-farm sector is characterised by poor income and

Employment in North-East India: An Investigation 3..............................................................................................................working conditions in the organised sector, and casual and contractualemployment in the unorganised sector (Papola & Sahu, 2012). The increasein employment in the tertiary sector was marginal during the post-liberalisationperiod. When all other tertiary sectors observed some degree of rise inemployment, the community, social and personal services sector laggedbehind (Sundaram, 2008).While the national level study of employment and unemployment getsconsiderable attention among the researchers, there is a very limited numberof analysis found at regional or state level (Chadha & Sahu, 2002;Rangarajan, Kaul, & Seema, 2007; Abraham, 2009; Binswanger-Mkhize,2013; Sundaram, 2009). Moreover, among the regional levels, large statesget more attention than the smaller ones and a study on the North-Easternregion (NER) is difficult to find.The NER consists of the eight states namely, Arunachal Pradesh, Assam,Manipur, Meghalaya, Mizoram, Nagaland, Sikkim, and Tripura.1 Accordingto a world bank report, “India’s NER could be seen as a victim of a low-levelequilibrium where poverty and lack of development (as compared with theremainder of India and other South-east Asian nations) lead to civil conflict,lack of belief in political leadership and government, and, therefore, to apolitically unstable situation. This, in turn, leads to further barriers to povertyreduction, accelerated development, and growth”.2The NER is highly diverse and vibrant with natural resources, despitethe fact that the region is underdeveloped as compared to other states of thenation. The overall development is the only solution to bring out the regionfrom its underdeveloped stage (Sharma, 2012). The infrastructural deficiency,insurgency, and market failure are to be blamed for the underdevelopmentof the region. In this state of underdevelopment, creation of employmentopportunity is a grave concern for the region. Therefore, this study attemptsto critically assess the current scenario of employment, the relation betweeneconomic growth and employment, and the factors that determine theworkforce participation rate (WPR) in the region.In our analysis, first, we will provide the trend, growth rate and status ofemployment in the NER and second, we will observe the factors thatpotentially determine the workforce participation rate in the region. The studyis based on the available labour market data sets on Indian labour market,that is, the 50th round (1993/94), 61st round (2004/05) and 68th round(2011/12) of the National Sample Survey.
2. The Trend of Workforce Participation in North-Eastern RegionTable 1 presents the state-wise WPR in the NER and respective growthrates during the post-liberalisation period. In the region, Meghalaya Statehas the highest WPR (66.3 per cent) in the year 2011/12, and NagalandState has the lowest (48.8 per cent) WPR. In the NER, the WPR is

4 Manpower Journal, Vol.LII, Nos.1&2, January-June 2018..............................................................................................................52.1 per cent while it is 56.6 per cent at the national level. Overall, theworkforce participation rate has been declining at both national level andin the NER. A state level analysis of growth rate represents that only theTripura and Mizoram States have the positive growth rate in the NER,while the State of Arunachal Pradesh has the highest negative growthrate of employment in the region. The decline in WPR is rapid at thenational level than in the NER.Table 1: Workforce Participation Rate and Respective Growth Rate in the
North-Eastern Region
State Workforce Participation Employment Growth RateRate (15-64)
1993-94 2004-05 2011-12 1994- 2004- 1994-2004 2012 2012Assam 54.2 59.8 49.9 0.0097 -0.0226 -0.0046Manipur 58.3 59.2 55.4 0.0016 -0.0084 -0.0028Meghalaya 79.7 79.2 66.3 -0.0006 -0.0223 -0.0103Nagaland 49.7 70.6 48.8 0.0351 -0.0461 -0.0010Tripura 51.5 45.7 54.6 -0.0119 0.0222 0.0032Arunachal Pradesh 69.1 69.6 55.5 0.0006 -0.0282 -0.0122Mizoram 63.7 67.8 64.4 0.0062 -0.0066 0.0005North-East 55.7 60.1 52.1 0.0076 -0.0178 -0.0037INDIA 65.3 64.5 56.6 -0.0013 -0.0162 -0.0080
Source: 50th, 61st & 68th Rounds of National Sample SurveyIn the next decade of liberalisation, the states of NER such as Assam,Manipur, Nagaland, Arunachal Pradesh and Mizoram observed an increasein their WPR but lost the momentum during the period 2004/05 to 2011/12.During the first decade after liberalisation (1993/94 to 2004/05), Tripura hada negative employment growth rate but during 2004/05 to 2011/12,it witnessed a positive growth rate of employment in the region.Spatial distribution of workforce by gender and place of residence ispresented in Table 2. A declining trend in WPR is observed for both thegenders in both sectors at the national level. In the NER, male WPR observesa slight increase in the urban areas while it is negative in the rural areas.In the NER, the female workforce participation rate (FWPR) declinedalmost 0.05 per cent annually during 2004/05 to 2011/12 in the rural areas.During the same period, the rural FWPR at the national level also declined ata rate of 0.04 per cent. The almost negligent rate of growth of employmentindicates the stagnant nature of the labour market in the NER. The restrictivenature of female mobility and the social stigma against females’ workingoutside the home are some of the reasons for low female WPR in both NERand at the national level.

Employment in North-East India: An Investigation 5..............................................................................................................
The NSS of India classifies work into three categories, namely self-employed,3 casual employment and regular or wage labourer to define thenature and quality of job available in the labour market. In the recent decades,the Indian economy indicated a jobless growth, and hence, it is expected thatthere will be an increase in the workers in either self-employed or casualemployed category. Table 3 presents the change in the composition ofworkers and the nature of their work during the post-liberalisation period.In the NER, Arunachal Pradesh has the highest percentage of self-employedand Tripura has the lowest as per the 68th round of NSS. The creation ofregular employment in the NER is very miserable – except Mizoram andNagaland, none of the states have more than 20 per cent of their workers inthe regular employment.Tripura has only 13.3 per cent of its total workers in regular employment,while the State of Nagaland with 25.2 per cent has the highest percentage ofwage employed, followed by Mizoram State with 22.5 per cent out of theirtotal workforce. With more than 46 percentage share in casual employmentout of their total employment, the State of Tripura shows a critical conditionof its labour market as well as employment creation in the region. NagalandState has the lowest casual employment with only 2 per cent share in itstotal employment in the region. In comparison to the national average,the NER has the higher percentage of workers in the self-employed category,
Table 2: WPR and Growth rate by Sex and Place of Residence in theNorth-Eastern Region
State Year Rural Urban Growth Rural UrbanRate
M F M F (CAGR) M F M F
1993- 82.3 28.3 72.6 18.2 1994- 0 .0035 0.0241 0.0031 0.021694 20042004- 85.3 36.0 74.9 22.6 2004- - - - -.
North- 05 2012 0.0067 0.0494 0.0028 0260East 2011- 80.8 24.3 73.2 18.4 1994- - -12 2012 0.0010 0.0086 0.0004 0.00051993- 88.3 50.83 78.9 23.2 1994- -94 2004 0.0019 0.0000 0.0002 0.00342004- 86.9 50.82 79.0 23.8 2004- - - - -
India 05 2012 0.0073 0.0401 0.0029 0.01872011- 82.0 36.9 77.2 20.5 1994- - - - -12 2012 0.0041 0.0178 0.0012 0.0068
Note: M = Male, F = FemaleSource: 50th, 61st & 68th Rounds of National Sample Survey

6 Manpower Journal, Vol.LII, Nos.1&2, January-June 2018..............................................................................................................Table 3: State-wise Variation in the Nature of Employment in NER
State Year Rural Urban TotalS R C S R C S R CAssam 1993-94 57.1 14.9 28.1 45.6 43.4 11.0 56.1 17.4 26.52004-05 70.6 9.4 20.0 42.1 45.2 12.7 68.2 12.4 19.42011-12 69.5 11.9 18.7 53.4 36.8 9.8 67.8 14.5 17.7Manipur 1993-94 81.6 12.0 6.3 61.9 34.2 4.0 77.0 17.3 5.82004-05 84.7 9.8 5.5 64.6 30.8 4.6 80.7 14.0 5.32011-12 64.6 12.6 22.8 72.2 22.8 5.0 66.3 14.9 18.7Meghalaya 1993-94 79.5 6.3 14.2 33.8 55.6 10.7 75.3 10.8 13.92004-05 80.7 5.1 14.2 19.4 71.2 9.4 74.3 12.0 13.72011-12 70.4 10.5 19.0 35.0 50.8 14.2 64.8 16.9 18.3Nagaland 1993-94 79.3 18.5 2.3 39.2 54.3 6.5 71.0 25.9 3.12004-05 87.7 11.6 0.7 61.7 34.2 4.1 81.3 17.2 1.52011-12 84.9 13.6 1.5 42.4 54.6 3.0 72.9 25.2 2.0Tripura 1993-94 52.4 12.3 35.2 36.7 48.0 15.4 50.4 16.8 32.72004-05 52.2 10.6 37.2 40.8 45.9 13.3 50.7 15.3 34.12011-12 40.4 8.4 51.3 38.5 45.4 16.1 40.1 13.3 46.6Arunachal 1993-94 89.2 6.2 4.6 21.8 67.3 10.9 80.9 13.7 5.4Pradesh 2004-05 82.9 11.1 6.0 41.3 50.1 8.6 79.2 14.6 6.22011-12 81.7 12.1 6.1 35.5 53.3 11.2 74.4 18.7 7.0Mizoram 1993-94 90.7 7.7 1.6 60.4 33.1 6.5 81.8 15.2 3.12004-05 91.4 6.9 1.7 58.4 34.7 7.0 80.5 16.1 3.42011-12 82.2 9.5 8.3 51.9 40.4 7.8 69.4 22.5 8.1North-East 1993-94 60.7 13.7 25.6 46.6 43.3 10.1 59.2 17.0 23.92004-05 71.9 9.2 18.9 45.1 44.3 10.6 69.0 13.0 18.02011-12 67.4 11.5 21.1 50.8 39.5 9.8 65.2 15.3 19.6India 1993-94 56.8 6.8 36.4 41.5 40.3 18.3 53.6 13.8 32.62004-05 59.2 7.4 33.5 44.6 40.3 15.1 55.9 14.8 29.32011-12 55.0 9.1 35.9 41.4 44.0 14.6 51.4 18.5 30.2
Note: S = Self-Employed, R = Regular/Wage Employed, C = Casual EmployedSource: 50th, 61st & 68th Rounds of National Sample Surveybut the percentage of regular and casual employment is lower than thenational average. The agrarian nature of the economy promotes self-employment in the region. During the post-liberalisation period, the self-employed workers increased in the region, but wage employment and casualemployment declined massively. The lower percentage of wage workers inthe region is a growing concern for the economy because it raises questions

Employment in North-East India: An Investigation 7..............................................................................................................on the availability of quality work in the region. Sahu (2012) observed thatinadequate wage rate and unavailability of the paid employment in the regionforces workers to move towards self-employment or casual employment.The evidence of lower wage rate in casual employment in the NER ispresented in Table 4.Table 4: State-wise Variation in Daily Wage Rate in the North-Eastern Region by
Regular and Casual Jobs
State Nature of Employment Daily Wage RateMale Female TotalAssam Regular 423 250 384Casual 144 99 137Manipur Regular 620 574 613Casual 200 173 194Meghalaya Regular 487 397 455Casual 199 131 176Nagaland Regular 576 436 558Casual 171 NA 171Tripura Regular 359 253 329Casual 168 123 164Arunachal Regular 679 534 655Pradesh Casual 228 156 211Mizoram Regular 806 611 766Casual 249 280 252North-East Regular 469 308 433Casual 154 110 147India Regular 413 304 391Casual 153 103 142
Source: 68th round of National Sample Survey (author’s calculation)Any industrial development of the NER mostly ignores rural areas, and hence,most of the employment opportunities in rural areas lie either in the agriculturalsector or at small and cottage industries. Moreover, in the North-Easternregion, the physical capital development is not enough to create gainfulemployment in the area. Therefore, the hill economy of the North-Easternregion is highly dependent on the forest covers for subsistence.The access and utilisation of the forest resources determine the livelihoodand employment creation process. Therefore, the livelihood of the region iscritically dependent on the “environmental entitlement” (Mishra, 2007).

8 Manpower Journal, Vol.LII, Nos.1&2, January-June 2018..............................................................................................................3. Structural Transformations of Employment in the North-Eastern
RegionThe structural transformation of an economy can be looked through differentmacroeconomic observations like output, employment, capital investment andconsumption. In the analysis presented at Table 5, an attempt has been madeto highlight the structural transformation through changing sectoralemployment in the NER. The transformation of employment was observedfrom the primary sector to tertiary sector in the region. During the post-liberalisation period (1993/94 to 2011/12), the share of primary sectoremployment declined from 69 per cent to 52.2 per cent in the region.The tertiary sector employment increased to 30.6 per cent from 24.4 percent during the same period, but the employment generation was rapid in thesecondary sector in the region. In the NER, Tripura is the only state whereprimary sector has a lower share of employment than the secondary sector.The states of Arunachal Pradesh, Nagaland, Mizoram, Meghalaya and Assamhave more than 50 per cent workers in the primary sector. In the secondarysector, Tripura has the highest (47.3 per cent) and Arunachal Pradesh hasthe lowest percentage (7 per cent) of workers in the NER. Except forArunachal Pradesh and Tripura, all the other states of the region have morethan 30 per cent of workers in the tertiary sector.Table 5: Structural Transformation of Employment in the NER
States 1993-94 2004-05 2011-12P S T P S T P S TArunachal 80.3 5.6 14.1 75.2 6.1 18.7 67.6 7.0 25.4PradeshNagaland 61.3 5.0 33.7 62.5 6.1 31.4 59.3 7.9 32.7Manipur 55.9 15.7 28.4 60.5 14.0 25.5 38.1 31.2 30.7Mizoram 74.7 4.1 21.2 70.2 4.7 25.0 55.0 10.7 34.3Tripura 43.8 8.2 48.0 37.4 16.4 46.2 26.4 47.3 26.3Meghalaya 78.2 4.0 17.8 73.1 8.3 18.6 56.0 12.0 32.1Assam 71.9 6.1 22.0 68.2 7.1 24.7 55.6 13.3 31.1North-East 69.0 6.6 24.4 65.9 8.2 26.0 52.2 17.2 30.6India 64.1 14.9 21.0 57.7 18.5 23.9 48.1 24.6 27.3
Note: P = Primary Sector, S = Secondary Sector, and T = Tertiary SectorSource: 50th, 61st & 68th rounds of National Sample Survey (author’s calculation)Figure 1 shows the structural change in employment by the growth rate ofemployment across primary, secondary and tertiary sectors in the NER.The growth rate of the respective sectors reveals that all the states of theregion have witnessed a negative growth rate of employment in the primarysector. With almost 10 per cent of annual growth rate, the Tripura Statehas the highest employment growth rate in secondary sector followed by

Employment in North-East India: An Investigation 9..............................................................................................................Mizoram and Meghalaya. Arunachal Pradesh has the lowest secondary sectoremployment growth rate in the region. In the tertiary sector, Tripura andNagaland have negative growth rates while all other states have positivegrowth rates of employment in the region. Meghalaya has the highest growthrate of tertiary sector employment in the NER.Figure 1: Growth Rate of Employment in the Primary, Secondary and
Tertiary Sector
Source: 50th, 61st & 68th Rounds of National Sample SurveyThe primary, secondary and tertiary sector can further be classified intonine broad industrial divisions. This classification of industries provides thereal picture of employment creation within the primary, secondary and tertiarysectors. Table 6 displays the industrial classification of workers in the NER.
Table 6: Industrial Classification of Workers in the North-Eastern Region
States Year 1 2 3 4 5 6 7 8 9Arunachal 1993-94 80.91 0.12 2.04 0.58 2.69 1.84 2.04 0.35 9.45Pradesh 2004-05 75.65 0.00 0.64 0.83 4.39 4.11 0.78 0.69 12.892011-12 68.07 0.14 1.00 0.29 5.49 7.06 1.16 0.14 16.65Nagaland 1993-94 61.85 0.87 0.96 0.25 3.18 7.96 1.16 0.35 23.422004-05 63.49 0.00 3.15 0.62 2.12 13.31 2.28 0.41 14.632011-12 60.54 0.12 2.05 1.89 3.57 9.59 2.69 0.00 19.56Manipur 1993-94 56.18 0.04 13.09 0.46 1.73 6.84 1.90 1.25 18.512004-05 60.99 0.41 9.85 0.01 3.36 9.34 2.45 0.39 13.182011-12 39.69 0.30 10.15 0.25 19.62 11.7 3.73 0.31 14.25Mizoram 1993-94 74.99 0.07 1.71 0.18 2.19 5.73 0.49 0.13 14.512004-05 70.54 0.03 2.31 0.03 2.37 8.03 1.22 0.5 14.962011-12 55.31 0.26 1.81 0.42 8.08 12.28 2.41 0.10 19.33Tripura 1993-94 44.06 0.09 6.15 0.22 1.99 12.26 3.78 0.84 30.622004-05 38.19 0.00 5.45 0.06 10.73 13.02 3.80 0.33 28.422011-12 27.12 0.34 6.42 0.04 40.11 10.85 3.11 0.53 11.49( contd.)

10 Manpower Journal, Vol.LII, Nos.1&2, January-June 2018..............................................................................................................States Year 1 2 3 4 5 6 7 8 9Megha- 1993-94 78.43 0.42 1.1 0.29 2.17 5.77 1.12 0.16 10.53laya 2004-05 73.47 1.15 3.93 0.49 2.48 6.49 1.46 0.19 10.342011-12 56.55 2.26 2.44 0.15 6.98 13.67 3.49 0.55 13.92Assam 1993-94 71.85 0.7 4.12 0.44 0.85 9.05 2.01 0.39 10.592004-05 68.49 0.34 3.67 0.35 2.74 10.54 3.29 0.36 10.222011-12 56.05 0.57 5.9 0.06 6.71 15.01 3.76 0.49 11.45North- 1993-94 69.01 0.58 4.46 0.4 1.17 8.84 2.03 0.45 13.05East 2004-05 66.22 0.36 4.06 0.33 3.39 10.19 2.99 0.36 12.12011-12 52.7 0.63 5.56 0.15 10.71 13.82 3.53 0.45 12.45India 1993-94 64.88 0.72 10.42 0.37 3.14 7.4 2.77 0.93 9.362004-05 58.5 0.57 11.73 0.27 5.57 10.24 3.83 1.55 7.742011-12 48.9 0.54 12.6 0.52 10.6 10.96 4.83 1.10 9.95
Notes: 1.Agriculture, Hunting, Forestry and Fishing 2. Mining and Quarrying3. Manufacturing 4. Electricity, Gas, and Water (Utility Sector) 5. Construction6. Wholesale, Retail Trade and Restaurants 7. Transport, Storage and Communication8. Financing, Insurance, Real Estate and Business 9. Community, Social and OtherServicesSource: 50th, 61st and 68th rounds of National Sample Survey (author’s calculation)
(Table 6 contd.)
We observe a decline in the share of agricultural workers from 1993/94 anda shift of workers towards the construction sector within the secondarysector; and wholesale, retail trade and business within the tertiary sector.The share of construction workers increased from 1.17 per cent to 10.71per cent during the post-liberalisation period. The percentage of wholesale,retail trade and business sector increased to 13.82 per cent in 2011/12 from8.84 per cent in 1993/94. From Table 6 it is clear that the community, social,personal and other services always remain an employment creation industryin the NER. However, in the last decade, it seemed to have become almoststagnant and observed a slight decline from the year 1993/94.4. The Elasticity of Employment in the NERThe analysis of employment may not represent the real picture of theemployment creation in a nation, if it is not complemented by the growth ofan economy. Therefore, the employment intensity or the elasticity ofemployment is one of the critical measures to identify the effect of economicgrowth on the creation of employment. The elasticity of employment is ameasure of the 1 percentage point change in the employment in responseto 1 percentage point change in the economic growth. The elasticity ofemployment indicates the ability of employment creation by an economywith its development process. In our analysis, the compound growth rate

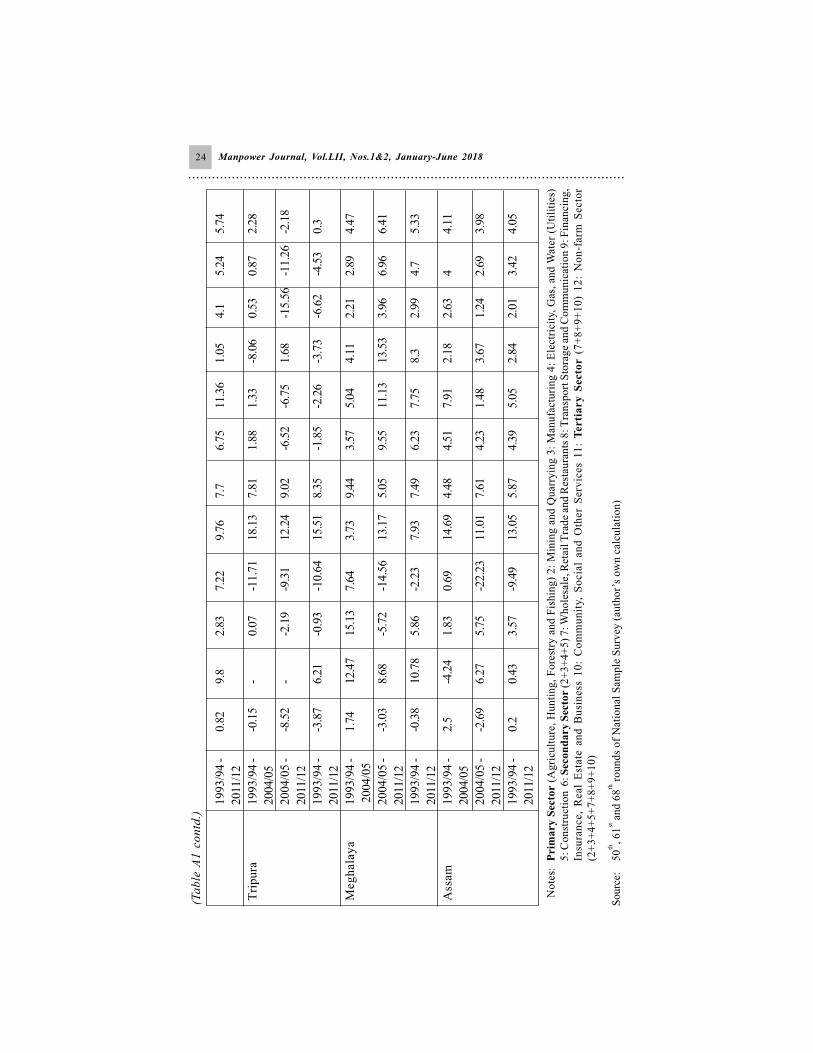
Employment in North-East India: An Investigation 11..............................................................................................................approach (CAGR) is used to indicate the ‘arc elasticity’ of employment inthe north-eastern region. The formula for calculating arc elasticity isWhere L denotes employment and Y denotes GDP of the economy.The numerator indicates the percentage change in the employment and thedenominator refers to the percentage change in economic growth, which isnothing but the economic growth rate of the state. The researchers preferthe CAGR or the ‘arc elasticity’ method due to unavailability of the panelinformation of employment growth rate in India.The economic growth of a state is expected to increase the employmentopportunity but not necessarily experienced forever. Therefore, to understandwhether the north-eastern region is successful in creating employmentopportunity with its development process or not, we have calculated theelasticity of employment of the region.In the process of economic growth, some sectors might get benefited,while some might lag behind. As mentioned above, the elasticity ofemployment explains a unit change of employment with respect to the changein the output growth rate of the respective sector(s). However,the employment elasticity calculation is not very simple because of variousunderlying factors influencing employment creation, e.g., prevailing wagerate, technological enhancement, infrastructural development, demand andsupply of the labour force etc.The motive behind the calculation of employment elasticity in the NER isto track the employment growth rate of the industrial sector and current andfuture perspectives of the employment creation rate in the respective sectors.Table 7 presents the elasticity of employment in the north-eastern region.In the North-Eastern region, only utility industry has the negative elasticityof employment that represents the negative employment growth and positiveoutput growth scenario of the industry. The construction sector has the highestelasticity of employment in the region, followed by mining & quarrying andwholesale, retail trade & business industry. All other industries except theutility industry have positive growth rate, but the figures are not verysignificant. The elasticity of employment is so low in the primary sector thatit can be considered a stagnant sector during the post-liberalisation period.During the period 2004/05 to 2011/12, employment growth rate of the regionwas registered as negative in both utility sector and primary sector of theeconomy. In the region, the secondary sector has the highest employmentelasticity followed by the tertiary sector. The state-level analysis of theelasticity of employment reveals that except Tripura all other states of theregion have positive elasticity of employment in the tertiary sector (Also seeTables A1, A2 & A3 in Annexure).
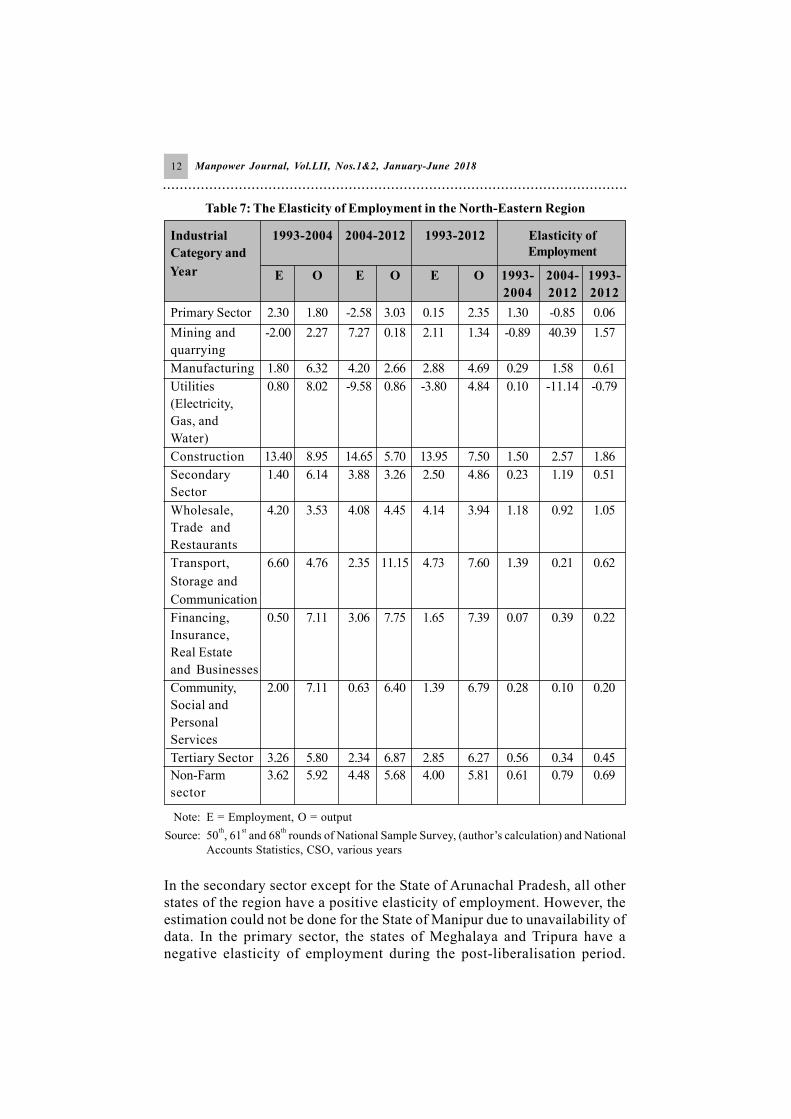
12 Manpower Journal, Vol.LII, Nos.1&2, January-June 2018..............................................................................................................Table 7: The Elasticity of Employment in the North-Eastern Region
Industrial 1993-2004 2004-2012 1993-2012 Elasticity ofCategory and Employment
Year E O E O E O 1993- 2004- 1993-2004 2012 2012Primary Sector 2.30 1.80 -2.58 3.03 0.15 2.35 1.30 -0.85 0.06Mining and -2.00 2.27 7.27 0.18 2.11 1.34 -0.89 40.39 1.57quarryingManufacturing 1.80 6.32 4.20 2.66 2.88 4.69 0.29 1.58 0.61Utilities 0.80 8.02 -9.58 0.86 -3.80 4.84 0.10 -11.14 -0.79(Electricity,Gas, andWater)Construction 13.40 8.95 14.65 5.70 13.95 7.50 1.50 2.57 1.86Secondary 1.40 6.14 3.88 3.26 2.50 4.86 0.23 1.19 0.51SectorWholesale, 4.20 3.53 4.08 4.45 4.14 3.94 1.18 0.92 1.05Trade andRestaurantsTransport, 6.60 4.76 2.35 11.15 4.73 7.60 1.39 0.21 0.62Storage andCommunicationFinancing, 0.50 7.11 3.06 7.75 1.65 7.39 0.07 0.39 0.22Insurance,Real Estateand BusinessesCommunity, 2.00 7.11 0.63 6.40 1.39 6.79 0.28 0.10 0.20Social andPersonalServicesTertiary Sector 3.26 5.80 2.34 6.87 2.85 6.27 0.56 0.34 0.45Non-Farm 3.62 5.92 4.48 5.68 4.00 5.81 0.61 0.79 0.69sector
Note: E = Employment, O = outputSource: 50th, 61st and 68th rounds of National Sample Survey, (author’s calculation) and NationalAccounts Statistics, CSO, various yearsIn the secondary sector except for the State of Arunachal Pradesh, all otherstates of the region have a positive elasticity of employment. However, theestimation could not be done for the State of Manipur due to unavailability ofdata. In the primary sector, the states of Meghalaya and Tripura have anegative elasticity of employment during the post-liberalisation period.

Employment in North-East India: An Investigation 13..............................................................................................................Some states of the region such as Arunachal Pradesh, Manipur, Mizoram,and Assam have negative elasticity of employment in the primary sectorduring the period 2004/05 to 2011/2012.5. The WPR by Socio-Economic Characteristics in the NER (2011-12)Preceding the discussion of trend, pattern and elasticity of employment in theregion, in this section we have discussed the WPR through various socio-economic lenses before proceeding to a statistical analysis of the paper.The analysis of this section is based only on the 68th round of NSSO. Thestate-specific analysis is not included in this section. Figure 2 presents theworkforce participation rate of the region by social category through sectoraland gender dimensions. India is a country where social group (caste) systemhas a determining impact on wealth distribution in the society. The peoplebelonging to SC and ST category find themselves on the lowest ladder of thesociety in both social status and income distribution (Zacharias &Vakulabharanam, 2011). The poverty profile estimated by the World Bankreveals that, in India 28 per cent of the nation’s population belongs to the SCand ST category, but 43 per cent of their population lives below poverty line.4
Figure 2: WPR by Social Category in the NER
Source: 68th Rounds of National Sample SurveyIn the north-eastern region, the male workforce participation does not varysignificantly across castes, but there is a significant gap in the FWPR bytheir social status. In the region, the ST community has the highest femaleWPR, followed by OBC and SC category; the Other (General) categoryhas the lowest female WPR. As mentioned above, the social stigma againstfemales’ working outside the home restricts female participation in theworkforce. The social groups like ST and SC experience less restrictionon their mobility towards labour market than the Other community of thesociety. The weak economic status of these two communities leaves themwith no option other than participating in the labour market (Srivastava &Srivastava, 2010).

14 Manpower Journal, Vol.LII, Nos.1&2, January-June 2018..............................................................................................................Figure 3 provides a religious classification of the workforce participationrate in the region by gender and sectoral dimension. Just like the social groups,male workforce participation rate is not bounded by the religious customsand norms, but the female workforce participation rate differs among differentreligious groups. The different social customs and restrictions practisedacross religious groups are responsible for lower female WPR.Figure 3: WPR by Religious Category in the NER
Source: 68th Rounds of National Sample SurveyIn the case of NER, it is important to notice that the Other (residualcommunity) religious community has the highest female WPR and Muslimcommunity has the lowest female WPR in the region. The Christiancommunity has also significantly high female WPR in the region incomparison to the Hindu and Muslim community in both rural and urbanareas. The higher level of fertility rate among the Muslim females is oneamong many reasons that cause lower female workforce participation in thelabour market (Bhalla & Kaur, 2011). Srivastava & Srivastava (2010) pointtowards the existence of more social restrictions on the Muslim females inhis analysis. Moreover, previous studies observed that females from theMuslim community are less interested in entering the workforce as comparedto their counterparts in Other community (Das, 2013). It is pertinent tomention here that Arunachal Pradesh has 16 per cent of Buddhist population,Mizoram has 7 per cent of Buddhist population, and Tripura has 1.11 percent of Buddhist population in the region, while other states have less than1 per cent of Buddhist population. The category ‘other’ constitutes Buddhistpopulation in the working age group.Better educational attainment is a gateway to better employmentopportunity in the labour market (Becker, 1975). However, the educationalattainment is also a reason behind low workforce participation of theindividuals in the younger age groups. Figure 4 presents the gender and

Employment in North-East India: An Investigation 15..............................................................................................................
Figure 4: Workforce Participation Rate by Educational Attainment in the NER
Source: 68th Round of National Sample SurveyIn the NER, a similar U-pattern relationship between education andemployment is observed. Despite having better education level, femaleparticipation in the workforce is lower than male participation which indicatesthe restriction put on females’ working outside the home in the region.Moreover, previous literature argues that gender discrimination at thehousehold level is the reason behind the low female literacy rate and finallylow workforce participation rate. Early marriage of females, keeping girlsinside the home to care for their kin etc., are some other reasons behind thelow level of female literacy rate in India (Rao & Gupta, 2006). Also, therising household income may be a reason for the withdrawal of femalesfrom the labour force. The highest female WPR by graduation and abovelevel of education indicates the breaking of attitudes towards work with higherlevel of education (Klasen & Pieters, 2015).The National Sample Survey (NSS) uses only monthly per capitaexpenditure (MPCE) as an economic variable to analyse the workforceparticipation of the population. Figure 5 presents the gender and sectoraldimension of workforce participation rate by monthly per capita expenditurein the North-Eastern region. Like education and workforce participationrelation, female workforce participation and income also have a U-shaperelationship.Figure 5 indicates that the female workforce participation rate iscomparatively higher at the very low-income strata and at the very high-
sectoral dimension of the workforce participation rate by educationalattainment in the north-eastern region. The workforce participation rate isassumed to have a U-shape relationship with the educational attainment.This indicates a higher workforce participation rate among the illiterates andthose having at least graduation level of education.

16 Manpower Journal, Vol.LII, Nos.1&2, January-June 2018..............................................................................................................
Figure 5: Workforce Participation Rate by MPCE deciles in the NER
Source: 68th Rounds of National Sample Survey6. Descriptive StatisticsWe used data from the employment and unemployment survey which is apart of the 68th round (2011-2012) of the survey conducted by the NSSO.To consider the working age population in our study, we restricted our dataset to the age group 15-64 years. The NER is the only area of observation inour analysis. Hence, our sample comprises data on 41,141 individuals fromthe region.In the study of the workforce participation, the decision of an individualwould only have two possibilities, either to participate in the workforceor not, hence, WPR is a yes or no decision. Therefore, the responsevariable or the regressand can take only two values, 1, if the individual isin the workforce and 0 if he or she is not. In other words, we need aregressand that is binary or dichotomous variable. Therefore, we usedthe binary logistic regression to analyse the determinants of WFP in theNER. The definition of all variables used in our regression analysis ispresented in Annexure A-4.Table 8 represents the mean and standard deviation for all thevariables used in our analysis. Some of the key features of the samplesare: 85 per cent of the sample is from the rural areas, and almost 48 per
income strata. In between these two income levels, the workforceparticipation rate falls as income increases (Srivastava & Srivastava, 2010).In the North-Eastern region, a smooth U-shape relationship between femaleWPR and MPCE is not observed. In the urban areas, the pattern ofworkforce participation is most inconsistent across the MPCE deciles.In the rural areas, the WPR is higher than the urban areas across all theincome strata, but the pattern of inconsistency prevails in the case of femaleworkforce participation in the region.

Employment in North-East India: An Investigation 17..............................................................................................................cent of individuals are females. In the NER, 57 per cent of the samplebelongs to Hindu religion, almost 24 per cent belongs to Muslim religion,and 15 per cent belongs to Christian religion. Among the sample, only3 per cent has graduation and above level of education and almost 19 perTable 8: Descriptive Statistics
Variables Mean SD Min MaxAge 34.127 12.847 15 64Household Size 5.232 2.014 1 18Illiterates 0.100 0.300 0 1Literate & Up to Primary 0.216 0.412 0 1Middle 0.253 0.435 0 1Secondary, HS & Diploma 0.321 0.467 0 1Graduation & above 0.109 0.312 0 1Hindu 0.444 0.497 0 1Muslim 0.097 0.296 0 1Christian 0.373 0.484 0 1Others 0.086 0.280 0 1ST 0.509 0.500 0 1SC 0.069 0.253 0 1OBC 0.197 0.398 0 1Others 0.225 0.417 0 1Male 0.506 0.500 0 1Female 0.494 0.500 0 1Unmarried 0.325 0.468 0 1Currently Married 0.637 0.481 0 1Widow/Divorce/Separated 0.039 0.193 0 1Rural 0.655 0.475 0 1Urban 0.345 0.475 0 1Arunachal Pradesh 0.121 0.326 0 1Nagaland 0.085 0.279 0 1Manipur 0.199 0.399 0 1Mizoram 0.113 0.317 0 1Tripura 0.121 0.326 0 1Meghalaya 0.098 0.297 0 1Assam 0.263 0.440 0 1Source: NSSO 68th round – Schedule 10, Employment and Unemployment, 2011-12 (author’scalculation)

18 Manpower Journal, Vol.LII, Nos.1&2, January-June 2018..............................................................................................................cent sample belongs to the illiterate category. 28 per cent of the sampleis from the ST community and 38 per cent from the other residualcategory, that is, non-ST/SC/OBC category. Due to limited sample sizein the divorced and separated category, we recoded the marital statusinto three categories, that is, unmarried, currently married, and widow,separated or divorced.7. Determinates of Workforce Participation in the North-Eastern
RegionIn this section, an attempt has been made to identify the determinantsof workforce participation among the population of the NER. The binarylogistic regression is used to identify the probable factors that maydetermine the workforce participation in the NER. In our model,the dependent variable Workforce Participation is a dummy variable.It indicates that the dummy takes a value of ‘1’ if the individual is aworker and ‘0’ otherwise. Table 9 presents the odds ratio of workforceparticipation in the NER. The independent variables in our analysis arevarious socio-economic characteristics found in the previous literature.These include age, household size, caste, religion, marital status,educational attainment and MPCE.We have also incorporated the state dummies to control the state levelheterogeneity in the NER. In our analysis, age and household size arecontinuous variables; gender dummies have been created, 0 for males and1 for females; and sector dummies represent 0 for rural areas and 1 for urbanareas. In the marital status category, we created three dummies for unmarried,currently married and widows, divorced and separated. In the caste category,three caste dummies for ST, SC and OBC have been created, and othercategory or the residual category has been used as the comparison category.Moreover, five education dummies have been created, representing literate &up to primary education, middle, secondary, higher secondary & diploma, andgraduation & above category, with illiterates as a comparison category.Similarly, the Muslim, Christian and Other religion dummies have been createdkeeping Hindu religion in the comparison category. The state control of theNER is done keeping the State of Assam in the comparison category.From the logistic regression analysis, we have identified the factors thatare positively related, negatively related and insignificant factors of ouranalysis. Table 10 indicates the positively associated, negatively associated,and insignificant variables of the logistic regression analysis.As shown in tables 9 and 10, the results tend to indicate that, those whohave educational level up to primary, and graduation & above are more likelyto participate in the workforce than the illiterates in the NER. However, theMiddle educational attendees and those having secondary, higher secondaryand any diploma are less likely to participate in the workforce than the

Employment in North-East India: An Investigation 19..............................................................................................................
Table 9: Logistic Regression – Determinants of WPR in theNorth-Eastern Region
Regressor Odds Ratio Z valuesAge 1.034*** 23.12Household Size 0.971*** -4.51Literate & Up to Primary 1.264*** 4.94Middle 0.909** -1.96Secondary, HS & Diploma 0.711*** -7.09Graduation & above 1.300*** 4.41Muslim 1.069 1.38Christian 1.358*** 5.52Others 1.591*** 7.3SC 1.334*** 4.65OBC 1.190*** 3.45Others 0.998 -0.04Female 0.065*** -87.84Currently Married 5.102*** 40.08Widow/Divorce/Separated 7.355*** 25.63Rural 0.602*** -17.39Arunachal Pradesh 1.344*** 5.26Nagaland 1.131* 1.87Manipur 1.497*** 9.5Mizoram 2.542*** 14.72Tripura 1.180*** 3.75Meghalaya 2.713*** 16.55_cons 0.399 -10.99Notes: Log likelihood = -19556.894, LR chi2 (22) = 17799.77, Pseudo R2 = 0.3128,Number of observation = 41142All the z values are at 99 per cent of the confidence interval and highlysignificant in most of the cases. The ‘***’ indicate the significant at the99 per cent level of confidence interval and ‘**’ and ‘*” indicates thesignificant at 95 and 90 per cent level of confidence interval respectively.Source: NSSO 68 th round – Schedule 10, Employment and Unemployment, 2011-12(author’s calculation)In the Indian context, SC, ST and the OBC categories are considered as themarginalised social groups in the society. Moreover, the ST and SC communityare assumed to be more deprived socially and economically. However, in theNER, except the State of Assam, most of the community belongs to the ST
illiterates of the region. Similarly, Christians and the people belonging to other(residual) religious groups are more likely to participate in the workforcethan the people belonging to Hindu religion.

20 Manpower Journal, Vol.LII, Nos.1&2, January-June 2018..............................................................................................................
8. Conclusion and DiscussionThe economic nature and characteristics of the North-Eastern region iswidely different from the rest of India. The economic development of theregion is determined by the various factors such as density of forest, landavailability for cultivation etc. In this paper, we observe that the workforceparticipation rate in the region is lower than the national average.However, Meghalaya State has shown consistently high workforceparticipation rate in the region in the last three decades. The states of
Table 10: Nature of the Regressors after Logistic Regression Analysis
Independent Variables Nature Independent Variables NatureAge + Manipur +Literate & Up to Primary + Mizoram +Graduation & above + Tripura +Christian + Meghalaya +Others + Household Size -SC + Middle -OBC + Secondary, HS & Diploma -Currently Married + Female -Widows/Divorced/Separated + Urban -Arunachal Pradesh + Others (Social Group) insignificantNagaland + Muslim insignificantSource: NSSO 68th round – Schedule 10, Employment and Unemployment, 2011-12 (author’scalculation)
community. In the region, Nagaland (96.98 per cent) has the highest shareof ST population followed by Mizoram (95.38 per cent), Meghalaya (90.74per cent) and Arunachal Pradesh (71.12 per cent). Therefore, the argumentsof economic deprivation of the ST population of NER needs further researchto identify the real picture of the economic status of ST population. In theregression analysis, we observed that in comparison to the ST population,the SC and OBC community are more likely to participate in the workforcewhile Others (residual) are less likely to participate in the workforce thanthe ST community.In the marital status category, the widows, divorced and separated aremost likely to participate in the workforce, followed by the currently marriedindividuals than the unmarried individuals in the region. Among the states,individuals from the State of Meghalaya are most likely to be in the workforcethan the other states of the region. However, in comparison to Assam State,individuals from all other states are more likely to be in the workforce.Females and individuals from the urban areas are less likely to be in theworkforce in the NER.

Employment in North-East India: An Investigation 21..............................................................................................................Nagaland and Tripura are lagging behind in employment creation as comparedto other states of the region. However, in the region, except Tripura andMizoram all other states experience a negative growth rate of employmentduring the period of our analysis, that is, 1993/94 to 2011/12. Tripura statewitnessed a significant rise in female workforce participation rate whereasmale workforce participation registered a negative growth. The State ofArunachal Pradesh witnessed the highest decline in its workforce in theregion followed by the states of Meghalaya and Manipur. The estimation ofelasticity of employment in the region reveals that the growth rate of theregion responds positively towards the employment creation except for theutility sector.The microeconomic analysis of data reveals that except construction,mining and quarrying and wholesale, retail trade and business industry,employment creation in other industries is not significant enough to considersustainable growth. The statistical analysis reveals a broad similarity withthe analysis of national level. The socio-cultural practices still keep thefemales away from the labour market in the region.Even though the region is lagging behind in the creation of employmentopportunity and economic development than the other parts of the nation,the available existing resources of the region have potentials to expandboth farm and non-farm sector employment in the region. The NER hasthe weather and land that is suitable for agriculture as compared to theother parts of the nation. Moreover, the region is known for using lesschemical outputs. Hence, NER has the potential to promote the organicproducts that have a fast-rising demand in the national and internationallevel. The international trading opportunity under “Look East Policy’ cannotbe denied.The promotion of micro, small and cottage industry would be a bettersubstitute to the big industries in the region. The region has a huge potentialto promote the agro-based and food processing industries. The promotion ofthe handloom industry could be a better employment-generating industry inthe region.The Public Private Partnership (PPP) model could be decisive for thedevelopment of the region. However, as we know, the region is very diversein nature, and rituals, culture and emotions of the people also differ from therest of the country. Therefore, the PPP along with the distribution of powerto the local government could be a better option for promoting developmentand the employment opportunity in the region. The PPP model could helpattract private investment, foreign direct investment to the region. The SpecialEconomic Zone (SEZ) is a viable option to utilise the untapped economicopportunity of the region especially for coffee, aromatic and medicinal plants,and horticulture products.
22 Manpower Journal, Vol.LII, Nos.1&2, January-June 2018..............................................................................................................There are certain institutional problems associated in the region such as theexpansion of the banking sector. Assam State has nearly 65 per cent ofbanks out of the total available banks in the North-Eastern region.Hence, the credit delivery system needs to be improved in the region.The rural institutes need to be revitalised as mentioned above.The agriculture sector can be enhanced with the help of contract farmingand by use of high yield varieties. The Panchayati Raj system needs to bestrengthened to play a significant role in the process of development in theNER because local people can easily identify the nature of their problemsand needs than the people from outside.The role of the Development of North Eastern Region (DONER)Ministry in the NER needs to be enhanced with the North EasternDevelopment Finance Corporation Ltd. (NEDFi), because the DONERMinistry recognises the required strategies to develop the region. The North-Eastern Vision Documents, 2020 published by the DONER Ministryconsidered some inter-dependent strategic components to promote inclusivegrowth in the region. The document includes self-governance, promotion offarm and non-farm sector, utilising the potentials of power generation,promotion of agro-based industries, sericulture, skill development of youth,augmenting the transportation system by all means and finally, ensuring publicinvestment in the infrastructure either independently or by the PPP mode.Moreover, the NEDFi is undertaking the core business activities anddevelopment activities in the region. The core business activity includeslending activities like project finance, microfinance and finance to micro andsmall enterprises. The first generation entrepreneurs’ capacity building andskill up-gradation programmes for entrepreneurs, farmers, artisans, etc. havebeen carried out under the development and other activities by NEDFi andDONER ministry. The activities targeted by the NEDFi and DONER ministryhave a high potential to enhance the development and the employmentopportunity in the NER.

Employment in North-East India: An Investigation 23
..............................................................................................................
An
nex
ures
Ta
ble
A1
: S
tate
-wis
e G
row
th R
ate
of
Em
plo
ym
en
t in
th
e N
ort
h-E
ast
ern
Reg
ion
(U
PS
S)
Sta
teY
ear
12
34
56
78
91
011
12
Aru
nach
al
1993/9
4 -
0.0
2-
-0.0
90.0
60.0
7-3
.63
0.1
1-0
.07
0.0
90.0
65.9
35.0
1
Pra
desh
2004/0
5
2004/0
5 -
-1.5
9-
5.3
1-1
3.4
12.5
2-0
.61
6.4
94.6
9-2
0.2
12.9
33.3
32.5
2011/1
2
1993/9
4 -
0.3
62.1
8-2
.64
-2.5
35.2
8-2
.29
8.7
9-1
.81
-3.7
74.4
74.7
84.1
7
2011/1
2
Nag
ala
nd
1993/9
4 -
2.8
8-
14.5
11.7
-1.4
43.7
57.7
69.3
74.2
-2.0
91.9
2.1
8
2004/0
5
2004/0
5 -
4.1
--0
.68
18.6
311.2
17.9
30.6
6.7
6-
8.3
25.1
85.6
7
2011/1
2
1993/9
4 -
3.4
2-7
.47
7.7
514.7
84.1
85.6
14.5
78.2
1-
2.5
43.3
63.7
3
2011/1
2
Man
ipu
r1993/9
4 -
3.7
826.2
30.1
2-3
5.3
29.6
1.7
96.0
85.5
-8.6
9-0
.43
1.7
91.7
9
2004/0
5
2004/0
5 -
-3.4
8-2
.02
2.2
642.1
223.9
411.8
84.7
7.1
4-0
.98
2.8
63.1
95.8
7
2011/1
2
1993/9
4 -
0.5
513.6
81.0
7-0
.915.9
76.2
85.4
76.2
3-5
.26
1.0
32.7
74.2
6
2011/1
2
Miz
ora
m1993/9
4 -
3.2
2-4
.64
6.8
4-1
4.0
94.6
25.1
67.2
12.9
517.3
4.1
35.5
25.4
6
2004/0
5
2004/0
5 -
-2.1
827.8
6-2
.19
33.8
516.1
910.8
96.1
79.3
7-1
9.2
54.0
74.9
6.0
8
2011/1
2(c
on
td.)
24 Manpower Journal, Vol.LII, Nos.1&2, January-June 2018
..............................................................................................................
1993/9
4 -
0.8
29.8
2.8
37.2
29.7
67.7
6.7
511.3
61.0
54.1
5.2
45.7
4
2011/1
2
Tri
pu
ra1993/9
4 -
-0.1
5-
0.0
7-1
1.7
118.1
37.8
11.8
81.3
3-8
.06
0.5
30.8
72.2
8
2004/0
5
2004/0
5 -
-8.5
2-
-2.1
9-9
.31
12.2
49.0
2-6
.52
-6.7
51.6
8-1
5.5
6-1
1.2
6-2
.18
2011/1
2
1993/9
4 -
-3.8
76.2
1-0
.93
-10.6
415.5
18.3
5-1
.85
-2.2
6-3
.73
-6.6
2-4
.53
0.3
2011/1
2
Meg
hala
ya
1993/9
4 -
1.7
412.4
715.1
37.6
43.7
39.4
43.5
75.0
44.1
12.2
12.8
94.4
7
2004/0
5
2004/0
5 -
-3.0
38.6
8-5
.72
-14.5
613.1
75.0
59.5
511.1
313.5
33.9
66.9
66.4
1
2011/1
2
1993/9
4 -
-0.3
810.7
85.8
6-2
.23
7.9
37.4
96.2
37.7
58.3
2.9
94.7
5.3
3
2011/1
2
Ass
am
1993/9
4 -
2.5
-4.2
41.8
30.6
914.6
94.4
84.5
17.9
12.1
82.6
34
4.1
1
2004/0
5
2004/0
5 -
-2.6
96.2
75.7
5-2
2.2
311.0
17.6
14.2
31.4
83.6
71.2
42.6
93.9
8
2011/1
2
1993/9
4 -
0.2
0.4
33.5
7-9
.49
13.0
55.8
74.3
95.0
52.8
42.0
13.4
24.0
5
2011/1
2
No
tes:
Prim
ary
Secto
r (A
gri
cult
ure
, H
un
tin
g,
Fo
rest
ry a
nd
Fis
hin
g)
2:
Min
ing
an
d Q
uar
ryin
g 3
: M
anu
fact
uri
ng
4:
Ele
ctri
city
, G
as,
and
Wat
er (
Uti
liti
es)
5: C
on
stru
ctio
n 6
: S
eco
nd
ary
Secto
r (
2+
3+
4+
5)
7: W
ho
lesa
le, R
etai
l T
rad
e an
d R
esta
ura
nts
8: T
ran
spo
rt S
tora
ge
and
Co
mm
un
icat
ion
9: F
inan
cin
g,
Insu
ran
ce,
Real
Est
ate
an
d B
usi
ness
10
: C
om
mu
nit
y,
So
cia
l an
d O
ther
Serv
ices
11
: T
erti
ary
Secto
r (
7+
8+
9+
10
) 1
2:
No
n-f
arm
Secto
r
(2+
3+
4+
5+
7+
8+
9+
10
)
Sourc
e:5
0th
, 6
1st
an
d 6
8th
ro
un
ds
of
Nat
ion
al S
amp
le S
urv
ey (
auth
or�
s o
wn
cal
cula
tio
n)
(Ta
ble
A1
co
ntd
.)

Employment in North-East India: An Investigation 25
..............................................................................................................
Ta
ble
A 2
: S
tate
-wis
e G
row
th R
ate
of
GD
P in
No
rth
-Ea
stern
Reg
ion
(a
t a
Co
nst
an
t P
ric
e 2
00
4-0
5)
Sta
teY
ea
r1
23
45
67
89
10
111
2
Aru
nach
al
Pra
desh
19
93
/94
- 2
00
4/0
50
.26
9.7
74
.3N
E1
1.1
17
.78
0.8
5-0
.83
67
.19
5.2
99
.51
20
04
/05
- 2
01
1/1
23
.74
4.4
64
.36
1.9
17
.01
6.0
63
.82
10
.53
6.7
55
.76
.16
6.1
1
19
93
/94
- 2
01
1/1
21
.81
7.4
14
.32
NE
9.2
81
2.5
72
.17
4.2
26
.33
6.5
35
.68
8
Nag
alan
d1
99
3/9
4 -
20
04
/05
11
.53
NE
-7.5
6-1
9.3
61
1.0
10
.95
6.1
84
.45
7.7
55
.25
6.0
54
.84
20
04
/05
- 2
01
1/1
22
.35
8.9
75
.28
-14
.45
10
.16
9.0
17
.21
5.2
56
6.2
96
.06
6.6
9
19
93
/94
- 2
01
1/1
27
.45
NE
-1.8
5-1
7.1
81
0.6
34
.53
6.6
44
.81
6.9
75
.71
6.0
55
.66
Man
ipu
r1
99
3/9
4 -
20
04
/05
4.4
4N
E1
2.4
NE
13
.05
NE
7.8
38
.17
5.9
57
.78
7.5
5N
E
20
04
/05
- 2
01
1/1
24
.34
NE
4.2
83
.08
4.4
94
.36
1.7
91
6.0
85
.97
5.7
55
.75
5.1
3
19
93
/94
- 2
01
1/1
24
.4N
E8
.79
NE
9.2
4N
E5
.15
11
.69
5.9
66
.88
6.7
5N
E
Miz
ora
m1
99
3/9
4 -
20
04
/05
10
.95
17
.24
5.9
8.4
71
8.3
81
3.4
89
.11
14
.91
6.7
71
5.2
11
4.2
91
4.1
1
20
04
/05
- 2
01
1/1
25
.92
9.3
58
.05
3.4
69
.27
.96
.04
7.5
58
.29
8.0
97
.82
7.8
3
19
93
/94
- 2
01
1/1
28
.72
13
.73
6.8
56
.24
14
.31
17
.75
11
.63
13
12
.05
11
.41
11
.32
Tri
pu
ra1
99
3/9
4 -
20
04
/05
3.9
11
2.0
73
.25
NE
21
.02
28
.62
5.2
19
.84
11
.92
8.8
88
.17
11
.27
20
04
/05
- 2
01
1/1
25
.39
6.1
6-3
.62
1.5
39
.65
8.6
15
.51
3.6
9.2
7.4
77
.69
7.9
8
19
93
/94
- 2
01
1/1
24
.57
9.4
50
.2 N
E1
5.9
71
9.7
25
.34
11
.51
10
.71
8.2
57
.96
9.8
1
Meg
hala
ya
19
93
/94
- 2
00
4/0
55
.34
12
.74
3.9
31
5.5
89
.65
9.2
88
.98
10
.42
4.0
46
.76
.77
.46
20
04
/05
- 2
01
1/1
23
.74
1.8
79
.13
-2.8
11
3.9
19
.05
7.1
39
.53
3.7
8.2
67
.17
.75
19
93
/94
- 2
01
1/1
24
.63
7.9
16
.24
7.4
11
1.5
59
.18
8.1
61
0.0
33
.89
7.3
96
.88
7.5
9
Ass
am
19
93
/94
- 2
00
4/0
50
.70
.97
0.8
62
3.6
37
.83
3.4
76
.33
15
.39
4.6
86
.44
6.9
55
.69
20
04
/05
- 2
01
1/1
22
.95
1.4
31
.62
4.7
45
.92
3.4
97
.69
10
.97
9.1
36
.91
8.0
26
.73
19
93
/94
- 2
01
1/1
21
.71
.18
1.2
15
.23
6.9
83
.48
6.9
31
3.4
36
.66
6.6
57
.43
6.1
5
No
tes:
1:
Prim
ary
Secto
r (A
gri
cult
ure
, H
un
tin
g,
Fo
rest
ry a
nd
Fis
hin
g)
2:
Min
ing
an
d Q
uar
ryin
g 3
: M
anu
fact
uri
ng
4:
Ele
ctri
city
, G
as,
and
Wat
er (
Uti
liti
es)
5:
Co
nst
ruct
ion
6
: S
eco
nd
ary
Secto
r (
2+
3+
4+
5)
7:
Wh
ole
sale
, R
etai
l T
rad
e an
d R
esta
ura
nts
8:
Tra
nsp
ort
Sto
rag
e an
d C
om
mu
nic
atio
n 9
: F
inan
cin
g,
Insu
rance
, Rea
l E
stat
e an
d B
usi
nes
s 10: C
om
munit
y, S
oci
al a
nd O
ther
Ser
vic
es 1
1: T
erti
ary
Sec
tor
(7+
8+
9+
10)
12: N
on-f
arm
Sec
tor
(2+
3+
4+
5+
7+
8+
9+
10)
NE
: N
ot-
Est
imat
ed d
ue
to t
he
abso
rbed
fig
ure
s an
d r
esu
lts.
So
urc
e: 5
0th
, 6
1st
an
d 6
8th
ro
un
ds
of
Nat
ion
al S
amp
le S
urv
ey (
auth
or�
s o
wn
cal
cula
tio
n)

26 Manpower Journal, Vol.LII, Nos.1&2, January-June 2018
..............................................................................................................
Ta
ble
A 3
: E
mp
loy
men
t E
last
icit
y w
ith
resp
ect
to G
PD
du
rin
g P
ost
-Lib
era
lisa
tio
n P
erio
d
Sta
teY
ear
III
III
IVV
VI
VII
VII
IIX
XX
IX
II
Aru
nach
al
Pra
desh
1993/9
4 -
2004/0
50.0
8-
-0.0
2-
0.0
1-0
.20
0.1
30.0
80.0
20.0
11.1
20.5
3
2004/0
5 -
2011/1
2-0
.43
-1.2
2-7
.02
0.3
6-0
.10
1.7
0.4
5-2
.99
0.5
10.5
40.4
1
1993/9
4 -
2011/1
20.2
0.2
9-0
.61
-0.5
7-0
.18
4.0
5-0
.43
-0.6
0.6
80.8
40.5
2
Nag
ala
nd
1993/9
4 -
2004/0
50.2
5-
-1.9
2-0
.6-0
.13
3.9
51.2
62.1
10.5
4-0
.40.3
10.4
5
2004/0
5 -
2011/1
21.7
4-
-0.1
3-1
.29
1.1
0.8
80.0
81.2
9-
1.3
20.8
50.8
5
1993/9
4 -
2011/1
20.4
6-
-4.1
9-0
.86
0.3
91.2
40.6
91.7
1-
0.4
40.5
60.6
6
Man
ipu
r1993/9
4 -
2004/0
50.8
5-
0.0
1-
0.7
4-
0.7
80.6
7-1
.46
-0.0
60.2
4-
2004/0
5 -
2011/1
2-0
.8-
0.5
313.6
85.3
32.7
22.6
30.4
4-0
.16
0.5
0.5
51.1
4
1993/9
4 -
2011/1
20.1
3-
0.1
2-
1.7
3-
1.0
60.5
3-0
.88
0.1
50.4
1-
Miz
ora
m1993/9
4 -
2004/0
50.2
9-0
.27
1.1
6-1
.66
0.2
50.3
80.7
90.8
71.0
30.2
70.3
90.3
9
2004/0
5 -
2011/1
2-0
.37
2.9
8-0
.27
9.7
81.7
61.3
81.0
21.2
4-2
.32
0.5
0.6
30.7
8
1993/9
4 -
2011/1
20.0
90.7
10.4
11.1
60.6
80.7
00.8
70.9
80.0
80.3
40.4
60.5
1
Tri
pu
ra1993/9
4 -
2004/0
5-0
.04
-0.0
2-
0.8
60.2
70.3
60.1
4-0
.68
0.0
60.1
10.2
0
2004/0
5 -
2011/1
2-1
.58
-0.6
1-0
.43
1.2
71.0
5-1
.19
-0.5
0.1
8-2
.08
-1.4
6-0
.27
1993/9
4 -
2011/1
2-0
.85
0.6
6-4
.65
-0.9
70.4
2-0
.35
-0.2
-0.3
5-0
.8-0
.57
0.0
3
Meg
hala
ya
1993/9
4 -
2004/0
50.3
30.9
83.8
50.4
90.3
91.0
20.4
0.4
81.0
20.3
30.4
30.6
0
2004/0
5 -
2011/1
2-0
.81
4.6
4-0
.63
5.1
80.9
50.5
61.3
41.1
73.6
60.4
80.9
80.8
3
1993/9
4 -
2011/1
2-0
.08
1.3
60.9
4-0
.30.6
90.8
20.7
60.7
72.1
30.4
0.6
80.7
0
Ass
am
1993/9
4 -
2004/0
53.5
7-4
.37
2.1
30.0
31.8
81.2
90.7
10.5
10.4
70.4
10.5
80.7
2
2004/0
5 -
2011/1
2-0
.91
4.3
83.5
5-4
.69
1.8
62.1
80.5
50.1
30.4
0.1
80.3
40.5
9
1993/9
4 -
2011/1
20.1
20.3
62.9
8-0
.62
1.8
71.6
90.6
30.3
80.4
30.3
0.4
60.6
6
No
tes:
I:
Pri
mary S
ecto
r (A
gri
cult
ure
, H
unti
ng, F
ore
stry
and F
ishin
g)
II:
Min
ing a
nd Q
uar
ryin
g I
II:
Man
ufa
cturi
ng I
V:
Ele
ctri
city
, G
as, an
d W
ater
(U
tili
ties
) V
:
C
onst
ruct
ion V
I: S
econ
dary
Sec
tor
(2+
3+
4+
5)
VII
: W
hole
sale
, Ret
ail T
rade
and R
esta
ura
nts
VII
I: T
ransp
ort
Sto
rage
and C
om
munic
atio
n I
X: F
inan
cing,
I
nsu
rance
, Rea
l Est
ate
and B
usi
nes
s X
: Com
munit
y, S
oci
al a
nd O
ther
Ser
vic
es X
I: T
erti
ary
Sec
tor
(7+
8+
9+
10) X
II: N
on-f
arm
Sec
tor (2
+3+
4+
5+
7+
8+
9+
10)
So
urc
e:
Ow
n e
stim
ates
bas
ed o
n N
atio
nal
Acc
ou
nts
Sta
tist
ics,
CS
O,
var
iou
s y
ears

Employment in North-East India: An Investigation 27
..............................................................................................................Table A.4: Definition and Variable used in the Analysis
Variable DescriptionAge Continuous variable. Age of the individual, (number of years)Household Continuous variable: Size of the household, (total members of
the size household)Female Binary variable: 1, if the sex of the individual is female, 0
otherwiseUrban Binary variable: 1, if a sector of the individual is urban, 0
otherwiseCurrently Binary variable: 1, if Unmarried, 0 otherwisemarriedWidow/ Binary variable: 1, if Widows/Separated/Divorced, 0 otherwiseSeparated/DivorcedOther Binary variable: 1, if Currently married, 0 otherwiseST Binary variable: 1, if the individual belongs to Schedule Tribe, 0
otherwiseSC Binary variable: 1, if the individual belongs to Schedule Caste, 0
otherwiseOBC Binary variable: 1, if the individual belongs to Other Backward
Class, 0 otherwiseOthers Binary variable: 1, if the individual belongs to a residual group, 0
otherwiseHindu Binary variable: 1, if the individual belongs to Hindu religion, 0
otherwiseMuslim Binary variable: 1, if the individual belongs to the Muslim
religion, 0 otherwiseChristian Binary variable: 1, if the individual belongs to Christian, 0
otherwiseOthers Binary variable: 1, if the individual belongs to a residual group, 0
otherwiseIlliterates Binary variable: 1, if the individual is illiterate, 0 otherwiseLiterate & Binary variable: 1, if the individual has at least primary level of
Up to Primary education, 0 otherwiseMiddle Binary variable: 1, if an individual has a middle level of
educational attainment, 0 otherwiseSecondary, Binary variable: 1, if an individual has secondary and HS level ofHS & Diploma education and diploma,0 otherwiseGraduation Binary variable: 1, if the individual has the graduation and above& above degree, 0 otherwiseArunachal Binary Variable: 1, if the state is Arunachal Pradesh, 0 OtherwisePradesh
(contd.)

28 Manpower Journal, Vol.LII, Nos.1&2, January-June 2018
..............................................................................................................Table A.4 (contd.)
Nagaland Binary Variable: 1, if the state is Nagaland, 0 OtherwiseManipur Binary Variable: 1, if the state is Manipur, 0 OtherwiseMizoram Binary Variable: 1, if the state is Mizoram, 0 OtherwiseTripura Binary Variable: 1, if the state is Tripura, 0 OtherwiseMeghalaya Binary Variable: 1, if the state is Meghalaya, 0 OtherwiseAssam Binary Variable: 1, if the state is Assam, 0 Otherwise
Notes1. In terms of geographical size, the region constitutes about 8% of the total area
of the country. The region comprises 262,230 square km. and the populationdensity is 148 per square km. Guwahati, Jorhat, Agartala, Dimapur, Shillong,Aizawl and Imphal are the largest cities in the region. Hinduism, Muslim,Buddhism, and Christianity are main religions in the area. The region sharesmore than the 4,500 kilometers of international border with China in the north,Myanmar in the east, Bangladesh in the southwest and Bhutan to the northwest.
2. Development and Growth in North East India: The Natural Resources, Water,and Environment Nexus, Strategy Report, June, 2007, South Asia RegionSustainable Development Department, Environment & Water ResourceManagement Unit, The International Bank for Reconstruction and Development,The World Bank
3. The self-employed category includes three types of working categories: (a)Workers who works in the household enterprises as the own account workers. (b)Workers who work in the household enterprises as the employers and (c) Theworkers who works in the household enterprises as the helper. The third categoryof self-employed is a worker who works as a helper in the household enterprisesand is considered as the unpaid workers within the self-employed category.
4. http://www.worldbank.org/en/news/infographic/2016/05/27/india-s-poverty-profile
ReferencesAbraham, V. (2009), Employment Growth in Rural India: Distress-Driven?, Economicand Political Weekly, Vol. 44, No. 16, pp. 97-104.
Becker, Gary S. (1975), Human Capital, 2d ed., New York: Columbia University Press(for NBER).
Bhalla, G. S. (2008), Globalisation and Employment Trends in India, The Indian Journalof Labour Economics, Vol. 51, No. 1.
–––– & R. Kaur (2011), Labour force participation of women in India: some facts,some queries, Working Paper, 40, Asia Research Centre, London School of Economicsand Political Science, London, UK.

Employment in North-East India: An Investigation 29
..............................................................................................................Binswanger-Mkhize, H.P. (2013), The stunted structural transformation of the Indianeconomy, Economic and Political Weekly, Vol. 48, No. 26-27, pp. 5-13.
Chadha, G. K. & P. P. Sahu (2002), Post-Reform Setbacks in Rural EmploymentIssues: That Need Further Scrutiny, Economic & Political Weekly, Vol. 37, No. 21,pp.1998-2026.
Chakravarty, S. and A. Mitra (2009), Is Industry still the engine of growth?An econometric study of the organized sector employment in India, Journal of PolicyModeling, No.31, pp. 22-35.
Das, M. B. (2013), Exclusion and discrimination in the labour market: backgroundpaper for the world development report 2013,Washington, DC; World Bank Group,available at SSRN: https://ssrn.com/abstract=2181701
Fei, J.C.H. and G. Ranis (1964), Development of the Labor Surplus Economy,Homewood, IL: Irwin.
Hari, K. S. (2000), Growth and Employment in India since Independence: An Inter-sectoral Analysis, M.Phil. Thesis, Jawaharlal Nehru University, New Delhi.
Hensman, R. (2001), The Impact of Globalisation on Employment in India andResponses from the Formal and Informal Sectors, CLARA Working Paper, No. 15.
Himanshu (2011), Employment Trends in India: A Re-examination, Economic andPolitical Weekly, Vol.46, No.37, pp. 43–59.
ILO (2015), World Employment Social Outlook - The changing nature of jobs, Geneva:International Labour Organisation.
Klasen, S. & J. Pieters (2015), What explains the stagnation of female labour forceparticipation in urban India?, Policy Research working paper, No. WPS-7222,Washington, D.C., World Bank Group.
Lahoti, R.A. and H. Swaminathan (2013), Economic Development and Female LaborForce Participation in India, IIM Bangalore, Research Paper No. 414, available atSSRN: https://ssrn.com/abstract=2284073 or http://dx.doi.org/10.2139/ssrn.2284073
Mehrotra, S., J. Parida & S. G. A. Singh (2014), Explaining Employment Trends in theIndian Economy: 1993-94 to 2011-12, Economic & Political Weekly, Vol. 49, No. 32,pp. 49-57.
Mishra, D.K. (2007), Gender, Forests and Livelihoods: A Note on the PoliticalEconomy of Transition in North-East India, Social Change, Vol. 37, No. 4, pp. 65-90.
Papola, T.S. (2003), Employment Trends in India, Retrieved at: http://111.93.232.162/pdf/EmployTrenz.
— & P.P. Sahu (2012), Growth and structure of employment in India: Long-term andpost-reform performance and the emerging challenge, New Delhi: Institute for Studiesin Industrial Development.
Rangarajan, C., I. Kaul & S.Seema (2007), Revisiting Employment and Growth, ICRABulletin-Money & Finance, Vol. 3,No. 2, pp. 57-68.

30 Manpower Journal, Vol.LII, Nos.1&2, January-June 2018
..............................................................................................................Rao, V. & P.V. Gupta (2006), Low Female Literacy: Factors and Strategies, AustralianJournal of Adult Learning, Vol. 46, No. 1, pp. 84-95.
Sahu, P. P. (2012), Employment Situation in North Eastern Region of India: RecentTrends and Emerging Challenges. NLI research Studies Series No.: 096/2012, V.V.Giri National Labour Institute, Uttar Pradesh.
Sharma, A. (2012), Inter-state Disparities in Socio-economic Development in NorthEast Region of India, Journal of Agricultural Science, Vol. 4, No. 9, pp. 236-243.
Shaw, A. (2013), Employment Trends in India - An Overview of NSSO’s 68th Round,
Economic & Political Weekly, Vol. 48, No. 42, pp. 24-25.
Srivastava, N. and R.Srivastava (2010), Women, Work, and Employment Outcomesin Rural India, Economic and Political Weekly, Vol. 45, No. 28, pp.49-63.
Sundaram, K. (2008), Employment, Wages and Poverty in the Non-AgriculturalSector: All-India, 2000-05, Economic and Political Weekly, May 31, pp. 91-99.
— (2009), Measurement of Employment and Unemployment in India: someissues, Department of Economics, Delhi School of Economics, Centre forDevelopment Economics Working Paper, 174.
Thomas, J. J. (2012), India’s Labour Market during the 2000s: Surveying the Changes,Economic and Political Weekly, Vol. 47, No. 51, pp. 39-51.
Unni, J, & G. Raveendran (2007), Growth of Employment (1993-93 to 2004-05): Illusionof Inclusiveness?, Economic and Political Weekly, pp. 196-199.
Zacharias, A. and V.Vakulabharanam (2011), Caste stratification and wealth inequalityin India, World Development, Vol. 39, No.10, pp.1820-1833.