Embed Size (px)
Citation preview
INDIAN JOURNAL OF APPLIED RESEARCH X 351
Volume : 5 | Issue : 8 | August 2015 | ISSN - 2249-555XReseaRch PaPeR
Why there are few takers of ISO-50001 standard in Indian Fertilizer industry
Avijit Choudhury BEE Accredited Energy Auditor & Lead Auditor for ISO-50001
Energy
Keywords M&V (Measurement & Verification), PAT, Energy Management System, ISO-50001, Fertilizer industry.
Since India has an agrarian economy, fertilizer plays an im-portant role in the stability and growth of our economy. Hence fertilizer industry has been given outmost impor-tance by the central government for its improvement and growth. With the total production of 38.6 million tones of fertilizer product, India comes as second largest fertilizer producer in the world. Major fertilizers produced in India are-
• Urea: 22.21millionmetrictons(MMT)• DAP(Di–ammoniumphosphate): 5.3MMT• NP/NPK(Nitrogenphosphorous&potassium): 8.1 MMT• SSP(Singlesuperphosphate): 2.9MMT
TheabovefigurestellusthatUreamanufacturingunitsareof prime importance as far as India is concerned. Some of the typical features of urea plants are given below-
• Urea Production is energy intensive process. It has mainly two steps-
a) Production of ammonia (and CO2 as by-product) from Natural Gas
b) ProductionofUreafromNH3 & CO2
• Cost of energy varies from 65% to 87% of the total production cost.
• Feed stocks used by the plants are natural gas, naph-tha, fuel oil, LSHS etc.
• Technology used byAmmonia plants are- Haldor Top-soe (HTAS), Kellogg Brown Root (KBR), ICI, CF Braun, Udheetc.
• Technology used by urea plants are- Snamprogetti,Toyo, Stamicarbon etc.
• Due to variation in feed stock, technology & age ofthe plant, SEC (Specific Energy Consumption) of Ureaindustry varies on a wide band.
• It is to be noted that overall urea making reaction is exothermic. Hence theoretically no extra heat should be required once the reaction is started. However evaporation of liquid ammonia, evaporation of water, melting of urea, recycling of carbamate, vacuum concentration of urea etc consumes lot of additional energy. Therefore tremendous scope existed for reduction of SEC (specific energy con-sumption) in urea industry.
The most important observation one can make from theabove points is- energy cost is the most critical factor in urea manufacturing process. Hence to make the fertilizercost bearable to the farmers, cost of production is to be reduced by optimizing the input energy cost. Fertilizer in-
dustrystartedworkinginthisdirectionsincebeginningandachievedaremarkableperformancetilldate.Letuslookatthe history of Indian fertilizer industry.
Thefirstfertilizerplantof Indiacamein1937atSindhri.Atthat period SEC of urea plant was 14.78 GCal/MT. Sincethen lot of evolutions have been seen in fertilizer industry by means of-
• Adoptionofnewtechnology• Retrofittingofenergyefficientequipment• UDP(UreaDe-bottleneckingProjects)• Improvementinoperationalpractices• ImprovedMIS – TechnicalOperatingData (TOP) of all
fertilizer plant has to be reported to FICC (Fertilizer In-dustry Co-ordination Committee) on regular basis and this a mandatory requirement.
• Benchmarkingwithworldstandard&• Mandatory Energy Saving Target under PAT (Perform
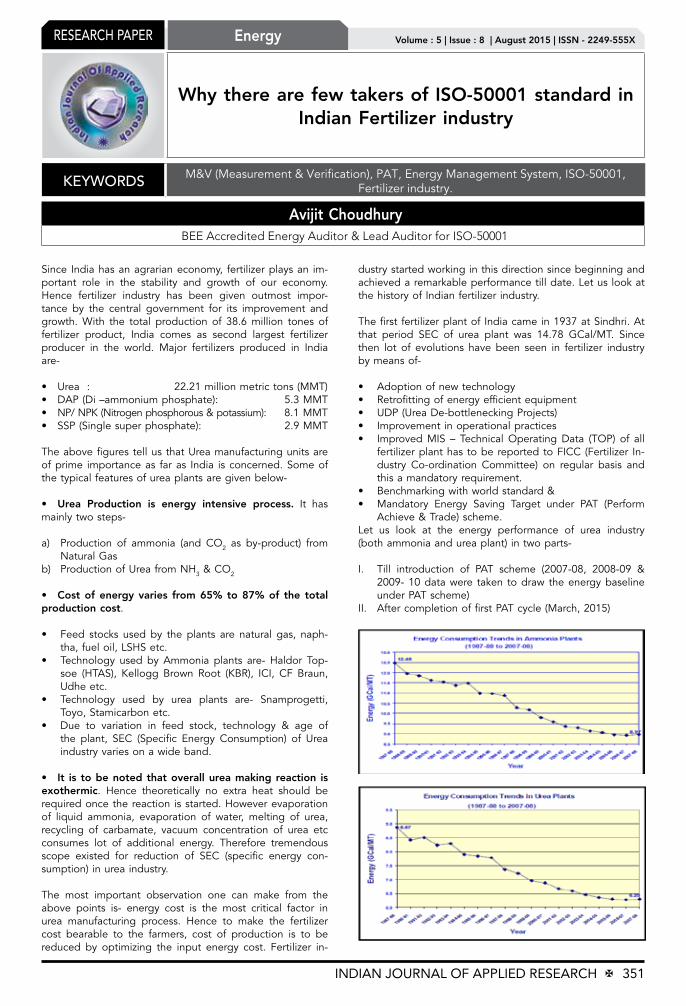
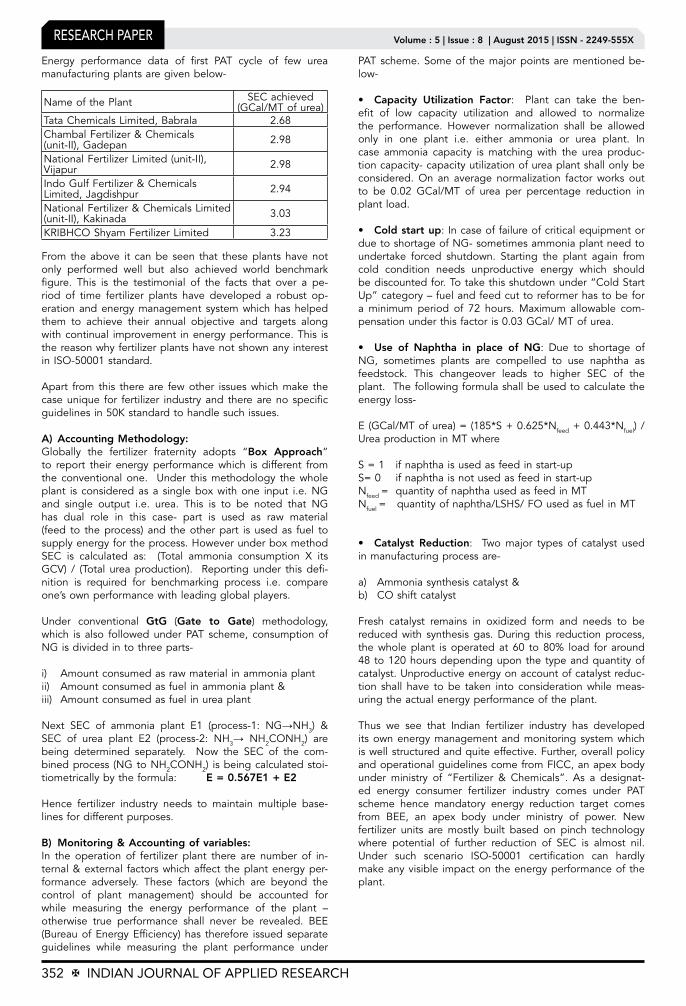
Achieve & Trade) scheme.Let us look at the energy performance of urea industry(both ammonia and urea plant) in two parts-
I. Till introduction of PAT scheme (2007-08, 2008-09 &2009-10datawere taken todraw theenergybaselineunder PAT scheme)
II. AftercompletionoffirstPATcycle(March,2015)
352 X INDIAN JOURNAL OF APPLIED RESEARCH
Volume : 5 | Issue : 8 | August 2015 | ISSN - 2249-555XReseaRch PaPeR
Energy performance data of first PAT cycle of few urea manufacturing plants are given below-
Name of the Plant SEC achieved (GCal/MT of urea)
Tata Chemicals Limited, Babrala 2.68Chambal Fertilizer & Chemicals (unit-II), Gadepan 2.98
National Fertilizer Limited (unit-II), Vijapur 2.98
Indo Gulf Fertilizer & Chemicals Limited, Jagdishpur 2.94
National Fertilizer & Chemicals Limited (unit-II),Kakinada 3.03
KRIBHCO Shyam Fertilizer Limited 3.23
From the above it can be seen that these plants have not only performed well but also achieved world benchmarkfigure. This is the testimonial of the facts that over a pe-riod of time fertilizer plants have developed a robust op-eration and energy management system which has helped them to achieve their annual objective and targets along with continual improvement in energy performance. This is the reason why fertilizer plants have not shown any interest in ISO-50001 standard.
Apart from this there are fewother issueswhichmake thecase unique for fertilizer industry and there are no specific guidelines in 50K standard to handle such issues.
A) Accounting Methodology: Globally the fertilizer fraternity adopts “Box Approach” to report their energy performance which is different from the conventional one. Under thismethodology thewholeplant is considered as a single box with one input i.e. NG and single output i.e. urea. This is to be noted that NG has dual role in this case- part is used as raw material (feed to the process) and the other part is used as fuel to supply energy for the process. However under box method SEC is calculated as: (Total ammonia consumption X itsGCV) / (Total urea production). Reporting under this defi-nition is required for benchmarking process i.e. compareone’s own performance with leading global players.
Under conventional GtG (Gate to Gate) methodology, which is also followed under PAT scheme, consumption of NG is divided in to three parts-
i) Amount consumed as raw material in ammonia plantii) Amount consumed as fuel in ammonia plant &iii) Amount consumed as fuel in urea plant
Next SEC of ammonia plant E1 (process-1: NG→NH3) & SEC of urea plant E2 (process-2: NH3→ NH2CONH2) are being determined separately. Now the SEC of the com-bined process (NG to NH2CONH2) is being calculated stoi-tiometricallybytheformula:E = 0.567E1 + E2
Hence fertilizer industry needs to maintain multiple base-lines for different purposes.
B) Monitoring & Accounting of variables:In the operation of fertilizer plant there are number of in-ternal & external factors which affect the plant energy per-formance adversely. These factors (which are beyond the control of plant management) should be accounted for while measuring the energy performance of the plant –otherwise true performance shall never be revealed. BEE (Bureau of Energy Efficiency) has therefore issued separate guidelines while measuring the plant performance under
PAT scheme. Some of the major points are mentioned be-low-
• Capacity Utilization Factor: Plant can take the ben-efit of low capacity utilization and allowed to normalize the performance. However normalization shall be allowed only in one plant i.e. either ammonia or urea plant. In case ammonia capacity is matching with the urea produc-tion capacity- capacity utilization of urea plant shall only be considered.On an average normalization factorworks outto be 0.02 GCal/MT of urea per percentage reduction inplant load.
• Cold start up: Incaseoffailureofcriticalequipmentordue to shortage of NG- sometimes ammonia plant need to undertake forced shutdown. Starting the plant again fromcold condition needs unproductive energy which should bediscountedfor.Totakethisshutdownunder“ColdStartUp”category–fuelandfeedcuttoreformerhastobefora minimum period of 72 hours. Maximum allowable com-pensation under this factor is 0.03 GCal/ MT of urea.
• Use of Naphtha in place of NG: Due to shortage ofNG, sometimes plants are compelled to use naphtha as feedstock. This changeover leads to higher SEC of theplant. The following formula shall be used to calculate the energy loss-
E(GCal/MTofurea)= (185*S+0.625*Nfeed + 0.443*Nfuel) / UreaproductioninMTwhere
S = 1 if naphtha is used as feed in start-upS= 0 if naphtha is not used as feed in start-upNfeed = quantity of naphtha used as feed in MT Nfuel = quantity of naphtha/LSHS/ FO used as fuel in MT
• Catalyst Reduction: Twomajor types of catalyst usedin manufacturing process are-
a) Ammonia synthesis catalyst &b) CO shift catalyst
Fresh catalyst remains in oxidized form and needs to be reducedwith synthesis gas.During this reduction process,the whole plant is operated at 60 to 80% load for around 48 to120hoursdependingupon the typeandquantityofcatalyst.Unproductiveenergyonaccountofcatalystreduc-tion shall have tobe taken into considerationwhilemeas-uring the actual energy performance of the plant.
Thus we see that Indian fertilizer industry has developed its own energy management and monitoring system which is well structured and quite effective. Further, overall policy and operational guidelines come from FICC, an apex body under ministry of “Fertilizer & Chemicals”. As a designat-ed energy consumer fertilizer industry comes under PAT scheme hence mandatory energy reduction target comes from BEE, an apex body under ministry of power. New fertilizer units are mostly built based on pinch technology where potential of further reduction of SEC is almost nil. Under such scenario ISO-50001 certification can hardlymakeanyvisible impactontheenergyperformanceof theplant.