Embed Size (px)
DESCRIPTION
Article of the Master thesis, Electronics Engineering, at Instituto Superior Tecnico, part of Urbisnet project.
Citation preview

1
Abstract—The aim of this work is to develop a mobile system,
and not too much expensive, to be placed in the top of buses or
taxis, making possible to measure air quality in wide areas, the
measurements are made trough several electronic sensors, the
time and geographical position of the measurement is obtained
trough GPS (Global Positioning System), and the data collected
from the station is transmitted to a central station trough the
GSM (Global System for Mobile Communications) network, or
can be download from a nearby computer through the IEEE
802.11 (wifi). These system also opens the possibility for creating
geographical maps with the air quality information represented
on the map, due to the wide area coverage than can be achieved
by portable autonomous air quality monitoring stations. The
measurement of the gases concentrations and the discrimination
of the present pollutants are to be made through various
electronic gas sensors, merging the data obtained from the several
sensors to make possible identify the different gases presents in
the atmosphere.
Index Terms—Air quality monitoring, autonomous stations, air
pollution maps, embedded system for sensor networks.
I. INTRODUCTION
HE project described in this article is about the remote
measurement of air pollution, the measurements data
transmission, design especially for urban areas. This project is
done as the work referent to the thesis of the course
Electronics engineering of the Instituto Superior Tecnico, at
TagusPark, but this work is part of a project called Urbisnet,
maintained by Instituto Superior Tecnico, and Instituto de
Telecomunicações, Instituto de Sistemas e Robotica, Institudo
de Soldadura e Qualidade. This project is supported by FCT
(Fundação para a Ciência e Tecnologia) under the contract
PTDC/EEA-CRO/104243/2008.
II. MOST USUAL AIR POLLUTANTS AND LEGISLATION
A. Air Pollution (Definition)
Air pollution means the presence in the exterior
atmospheres of one or more contaminants, or their
combination in quantities or with a duration such that can be
harmful to human life, vegetable life, animal life, or property.
The air contaminants include smokes, vapors, paper ashes,
dust, soot, carbon smokes, gases, mist, radioactive materials
and toxic chemical products.
B. Composition of dry atmosphere (by volume) in the
troposphere area
(in accordance with the source Poluição Atmosférica (Um
Manual Universitário) – João Gomes)
TABLE I
COMPOSITION OF DRY ATMOSPHERE (BY VOLUME) IN THE TROPOSPHERE AREA.
Symbol Gas Concentration by volume
N2 Nitrogen 78.08%
O2 Oxigen 20.95%
Ar Argon 0.93%
CO2 Carbon Dioxide 340 ppm
Ne Neon 18.18ppm
He Helium 5.24ppm
CH4 Methane 1.5ppm
Kr Krypton 1.14ppm
H2 Hydrogen 0.5ppm
N2O Nitrous Oxide 0.4ppm
Xe Xenon 0.09ppm
C. Conversion from µg/m3 to ppm
Units used to measure gas concentrations in the atmosphere:
The usual units used to measure gas concentration are ppm
or mg/m3 or µg/m
3, these are related by the equation:
)/()(][
]/[ 3
TRPMppmc
mgc••=
µ (1)
R-Universal constant for the gases (8.314J/(mol•K))
T-Atmosphere temperature in Kelvin (K)
P-Atmospheric pressure (Pa)
M-Molar mass of the gas (g/mol)
Standard values for the atmosphere at sea level:
T=0ºC=273K, P=101325Pa, R=8.314J/(mol•K)
Using the values stated and knowing the molar mass for
each gas the flowing table is obtained:
Mobile Sensor Network for Air Quality
Mapping
David Nuno G. da S. S. Quelhas, Nº57514, Instituto Superior Técnico - Taguspark
T

2
TABLE II
CONVERSION FACTOR FORM µg/m3 TO PPM,
FOR T=0ºC, AT SEA LEVEL, [µg /(PPM•m3)]
Symbol Gas Conversion factor
H2 Hydrogen 89
He Helium 178
CH4 Methane 712
CO Carbon Monoxide 1259
O3 Ozone 2140
NO Nitric Oxide 1960
NO2 Nitrogen Dioxide 2050
NH2 Amonia 760
SO2 Sulfur Dioxide 2860
H2S Hydrogen Sulfide 1520
D. Legislation of air pollution
With the propose to define and establish objectives to the
environment air, the framework directive 96/62/CE, created
the base principles to a common strategy, as a way of prevent
and reduce the noxious effects to human health and the
environment, and also to evaluate the air quality in EU-
member states, and inform the general public. This was
planned to be achieved through threshold values to alarm
situations, and the improvement of the environment air in the
situations where it is not satisfactory. The base principles
defined in the directive are: The definition of objectives to the
quality of environment air, establish common methods and
criteria of air quality evaluation, gather information about air
quality and disclose (spread) the information, assure that air
quality is good, and implement corrective strategies whenever
it's found that air quality isn't in accordance with the standards.
After this directive several decree/laws were emitted (in the
Portuguese Republic). This documents regulates the competent
authorities, were it is described the appropriate measures in
order to achieve the objectives of the management policy of air
quality, threshold values of the pollutant emissions to
industrial facilities, reference and threshold values for each
pollutant gas, and also many other aspects.
Here are presented the threshold values used to evaluate air
pollution:
Concentration classes associated to the IQAr (air quality
index) for each pollutant (year 2005), source Agência
Portugusa do Ambiente. The designations in Portuguese are:
Bad-Mau, Weak-Fraco, Average-Médio, Good-Bom,
Excellent-Muito Bom. (min stands for minimum, and max
stands for maximum).
TABLE III
III. EXISTENT SYSTEMS TO MONITOR AIR QUALITY IN URBAN
AREAS
The conventional systems to monitor air pollution in urban
areas are based in container style monitoring stations, or also
mobile station incorporated in a modified trailer to
accommodate the instruments and air circuits. These stations
have a large size and usually their construction involves a large
monetary cost. Most of the data collected by the stations is
transmitted to a central database, not requiring personnel to
operate the stations, but the methods used usually require some
maintenance and calibration process that can be made only by

3
qualified personnel. Following is a list of the main features of
these types of stations:
A. Average station size
The average size of the majority of the stations currently
used in Air Quality monitoring networks, are about 16m3 (4m
× 2m × 2m). There are some reduced size versions of this
station but the size mentioned is the usual and is actually
necessary to accommodate the instruments (usually there is a
distinct instrument for each type of gas to be monitored by the
station), and other equipment used for the operation of the
station, such as pure gas cylinder used for the calibration of the
instruments, air pump for the air circuits used to connect the
samplers placed on the roof of the station to the individual
measurement instruments, computer to remotely command the
instruments, read the results and send the data to a central
database, etc... The fixed stations based on this kind of
structure can require a lot of space for all the apparatus as can
be seen on figure 1.
Fig. 1. Outside of the fixed station to monitor air pollution
at Laranjeiro, part of Rede de Qualidade do Ar de Lisboa e
Vale do Tejo.
B. Average power consumption
The manufacturer of PM10 measurement instrument
(Environment SA is the usual manufacturer of the instruments
used in Portuguese stations) states that its instruments has a
power consumption of 330W (pump included). Each station
usually has at least 4 of this kind of instruments, one
instrument for each type of air pollutant (the PM10 is the one
with higher power consumption because of its heavy use of air
circuits). In addition, those instruments usually use a computer
for control and data transmission, a air pump, some extra
sensors (eg. temperature), and sometimes also a air
conditioning system, etc..., According to my estimations the
average power consumption for a station of this kind must be
in the order of the 1000W.
C. Methods used to measure each air pollutant
The usual methods used to measure Air pollutants are:
(although there are other possible methods for the
measurement of the same pollutants presented here.)
PM10 - Tapered Element Oscillating Microbalance, Beta
Attenuation monitor, Gravimetric monitor
CO – IR Absorption
SO2 – UV fluorescence
O3 – UV absorption
NO/NOx – Chemiluminescence
These methods usually require expensive equipment, that
occupies large amounts of space, and has high power
consumption due to the air pumps, motors, valves to make the
air flow (see Fig. 2.11 as an example). The methods listed
usually require some maintenance and calibration process that
can be made only by qualified personnel.
There are also compact systems, similar to the one
developed at this project, that are equipped with gas sensors,
and geographic positioning systems, and communication
systems. The company Libelium has stations that are modular,
modules can be assembled to have a system with an 8MHz
microprocessor, 8KB RAM, 128KB flash memory, GPS
module, GSM/GPRS module, 802.15.4 zigbee. These station
have the following sensors available to be mounted CO, CO2,
CH4, O2, H2, NH3, C4H10, CH3CH2OH, C6H5CH3, H2S,
NO2, O3, Volatile organic compounds, Hydrocarbons,
atmospheric pressure, humidity and temperature.
The stations made by Libelium are quite similar to the
specification required by the project proposed but miss some
of the requirements of the Urbisnet project, for example being
equipped with an more powerful processor, having a computer
running an operating system, having a wifi(IEEE 802.11)
interface.
Fig. 2 – Libelium Waspmote station, with GSM, zigbee,

4
GPS, 8-bit microprocessor
IV. HARDWARE SYSTEM DESIGN
A. System Architecture
The purpose of this work was to create a mobile air quality
monitoring station. Having in mind that the goal is to make
moderate cost and portable system to measure the air
pollution, and also store and transmit the data of the
measurements. The best way to achieve this goal is by using a
digital system that can store sensor data correspondent to large
periods of time, and that can be integrated with the existent
technology to make possible the transmission of the data to a
central station. To achieve this goal it was determined that the
following hardware components had to be used and integrated
into a single system:
Gas sensors (CO2,CO,O3,SO2,NO2)
Temperature and humidity sensors
Analog-to-Digital conversion
Microprocessor
Data storage
WiFi and GPRS communication systems
Global Positioning System receiver module
The architecture of the system is illustrated at Fig. 3.
Fig. 3 – Functional diagram of the air quality monitoring
station.
B. Gas sensors
Here the different gas sensors chosen are described. There is
a preference for sensors with low cost because the air quality
monitoring station should be suitable for mass production for
the possibility of making pollution maps. Also the sensors
should have a small to medium size to be integrated in the
station, making the station size appropriate to be placed at the
roof of buses or cars. It is also desired a fast response time for
the sensors, because the air quality monitoring station is
intended for measurements while the station is in motion, thus
having a fast changing atmosphere.
It should be understood that it may not be possible to find
available sensors that maximize all the refereed characteristics,
but the choices made were having in mind all these concerns.
CO and NO2 sensor:
The chosen sensors was the MICS-4514, these sensors are
solid-state devices composed of sintered metal oxides which
detect gas through an increase in electrical conductivity when
reducing gases are absorbed on the sensor's surface. This
sensors are both in the same SMD package, and have a small
size. The MICS-4514 includes two sensor chips with
independent heaters and independent sensitive layers. One
sensor chip detects oxidising gases (OX) and the other sensor
detects reducing gases (RED). In order to be able to make
exact measurements with MICS-4514 is necessary to take into
account the effects that humidity and temperature have on the
characteristic curve of the sensor resistance versus gas
concentration.
O3 sensor:
The chosen sensors was the MICS-2611, the sensor is a solid-
state device composed of sintered metal oxides which detect
gas through an increase in electrical conductivity when ozone
is adsorbed on the sensor's surface. In order to be able to make
exact measurements with MICS-2611 is necessary to take into
account the effects that humidity and temperature make on the
characteristic curve of the sensor resistance versus gas
concentration.
SO2 sensor:
The chosen sensor was the Alphasense SO2-BF, this is an
electrochemical cells that operate in the amperometric mode.
That is, it generates a current that is proportional to the
fractional volume of the toxic gas, in this case SO2.
The sensor for SO2 is used mounted on a board also
manufactured by Alphasense that is called Analogue
transmitter board. This board places an adequate voltage on
the sensor pins and amplifies the sensor current that is
proportional to the gas concentration, the transmitter board has
two potentiometers that make possible to adjust the sensor
current in clean atmosphere and the gain of the current
amplification made on the board.
CO2 sensor:
The chosen sensor was the Alphasense NDIR IRC-A1,
Alphasense IRC-A1 sensors use the principle of Non-
Dispersive Infra-Red (NDIR) to determine gas concentration.
Each sensor consists of an infrared source, optical cavity, dual

5
channel detector and internal thermistor.
This sensors should have an superior accuracy and selectivity
in the measurements of CO2 in comparison with the electronic
sensors that are going to be used for the other gases, because
of their principle of operation based on spectroscopy.
C. Humidity and temperature sensor
The chosen sensor was the Sensirion SHT25, this is a small
chip with the temperature and humidity sensors on it, it is a
pre-calibrated sensor that has a digital interface, transmitting
the measured data through a I2C bus. The humidity
measurement resolution is 0.04 %RH (12bit), the temperature
measurement resolution is 0.01 ºC (14bit).
V. THE STATION ENCLOSURE
An appropriate box for the station must be chosen, the box
should protect the hardware that is inside from the water of the
rain, but at the same time allow the outside air to flow through
the box, so that the sensors can detect the gases present on the
atmosphere, and make readings of humidity and temperature,
the ventilation may also be important in days were the station
is subjected to long hours under the exposure of the sun light
that can cause an overheating of the station. So the choosen
box was a box sold at the Farnell website, that has the
appropriate dimentions, and that had also an adequate price
36€. The box has the dimensions 22cm x 16,5 cm x 5,15 cm, is
made of Aluminum, inside the box there are longitudinal
holders on the sides, that allow for the PCBs to be inserted on
the box an stay placed like if they were shelfs. The box also
comes with two apertures, on front and back, these apertures
come with lids that make the box a closed space, the lids are
supported by 4 bolts.
As one of the requirements is that the box must allow the air
to flow through the box, these lids had to be replaced by lids
that were developed and built by me. I also developed a
system for the lids that also blocks the entrance of the rain to
the inside space of the box. These system for the lids is
composed of 2 lids for each entrance with the ventilation holes
misaligned, and with an sponge to block water droplets and
large particles of dust.
Fig. 4 – Drawing of 2 overlapping lids for covering only one
aperture, as you can see the holes on the outside lid are
misaligned with the holes of the inside lid.
Fig. 5 – The lids and the green sponge
This design allows for the entrance of air and protects from
the rain that falls on the top of the box. To get a good
protection from the rain the user should cover the small gap
that exists between the lid and the box with teflon tape(the
type of tape used in plumbing to prevent leaks in the pipes
junctions), and then screw the bolts to tighten the lids to the
box. The teflon tape placed on the edges of the box should
have at least 3 layers to have some volume making the box
have a good insulation against the rain.
It was made a test with the box closed with the dual lids and
the teflon tape on a bath shower, with water jet hitting the box
from the top and with maximum angle from the vertical of 30º
for a duration of 3 minutes. A large piece of hygienic paper
was previously placed inside the box, after the test was
finished the paper was dry.
The fact that the electronic boards of the station are
suspended on the the longitudinal holders, makes more
difficult for the board to catch any water droplets from the
rain.
VI. THE ETHERNET-WIFI BRIDGE
It is used an ethernet-wifi bridge to implement the wifi
interface on the station. The selected hardware was the ASUS
WL-330gE. The WL-330gE was selected because it’s very
configurable, it can work in 4 different modes: repeater,
access point, Ethernet-wifi bridge, router. It was chosed also
because of it's small size, that is about what was available
inside the box of the portable pollution measurement station. It
is appropriate also because it allows the installation of the
Open-WRT Linux firmware, allowing complete device
customization and control if required by the project objectives.
6
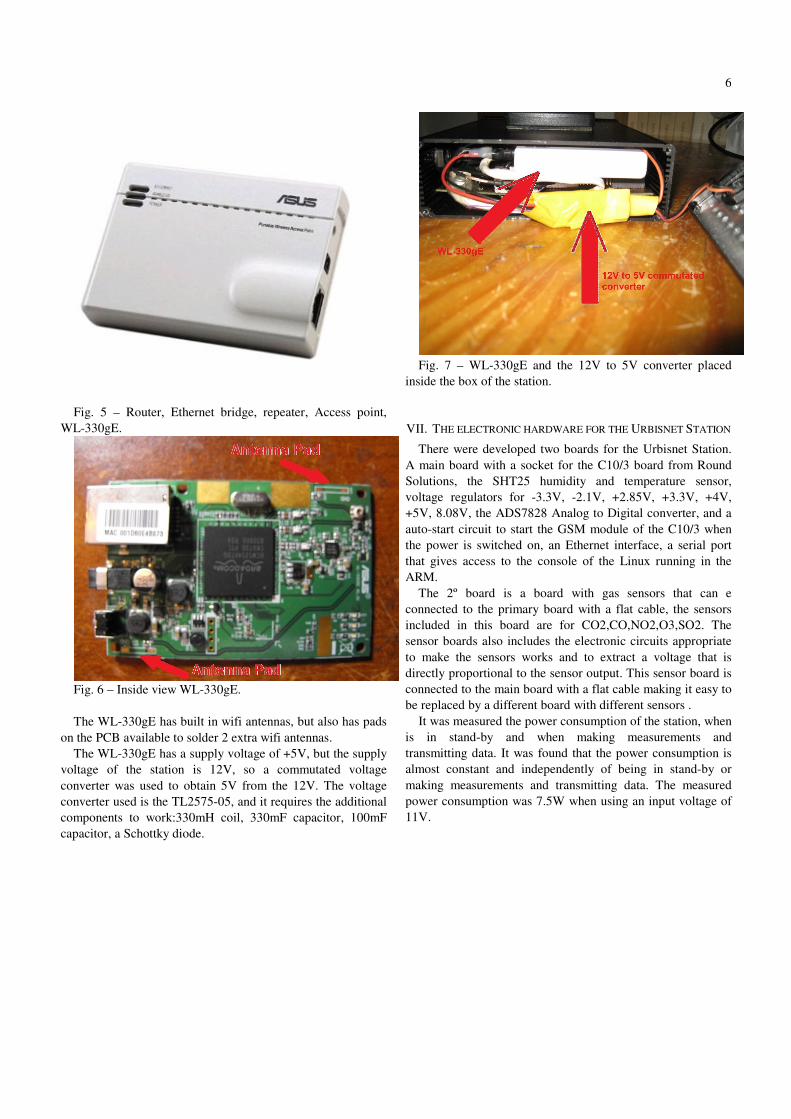
Fig. 5 – Router, Ethernet bridge, repeater, Access point,
WL-330gE.
Fig. 6 – Inside view WL-330gE.
The WL-330gE has built in wifi antennas, but also has pads
on the PCB available to solder 2 extra wifi antennas.
The WL-330gE has a supply voltage of +5V, but the supply
voltage of the station is 12V, so a commutated voltage
converter was used to obtain 5V from the 12V. The voltage
converter used is the TL2575-05, and it requires the additional
components to work:330mH coil, 330mF capacitor, 100mF
capacitor, a Schottky diode.
Fig. 7 – WL-330gE and the 12V to 5V converter placed
inside the box of the station.
VII. THE ELECTRONIC HARDWARE FOR THE URBISNET STATION
There were developed two boards for the Urbisnet Station.
A main board with a socket for the C10/3 board from Round
Solutions, the SHT25 humidity and temperature sensor,
voltage regulators for -3.3V, -2.1V, +2.85V, +3.3V, +4V,
+5V, 8.08V, the ADS7828 Analog to Digital converter, and a
auto-start circuit to start the GSM module of the C10/3 when
the power is switched on, an Ethernet interface, a serial port
that gives access to the console of the Linux running in the
ARM.
The 2º board is a board with gas sensors that can e
connected to the primary board with a flat cable, the sensors
included in this board are for CO2,CO,NO2,O3,SO2. The
sensor boards also includes the electronic circuits appropriate
to make the sensors works and to extract a voltage that is
directly proportional to the sensor output. This sensor board is
connected to the main board with a flat cable making it easy to
be replaced by a different board with different sensors .
It was measured the power consumption of the station, when
is in stand-by and when making measurements and
transmitting data. It was found that the power consumption is
almost constant and independently of being in stand-by or
making measurements and transmitting data. The measured
power consumption was 7.5W when using an input voltage of
11V.

7
Fig. 8 – The main board and the sensor board.
Fig. 9 – Urbisnet Station, top view
VIII. THE SOFTWARE INTERFACE
The station can communicate by wifi(IEEE 802.11) and
GSM SMS messages, with these communications the station
can interface with a PC, a server that receives communications
from several Stations, or with a network of similar stations and
routers that send data to a central server.
The implemented software is aimed to make the data
transmission directly to a PC. The software for the PC has the
ability to show the received measurements from the Urbisnet
Station, and to send new configurations for the Urbisnet
station. When the program starts is shown a window asking the
user to select the type of communications, it can be WIFI or
GSM.
In case the communication is being made with WIFI the
computer must have installed a wifi network interface, the user
then must connect to the wifi network broadcasted by the
station. After being connect to the network the user can open a
telnet connection on port 23, to the station being able to
control the station directly by the Linux console of the
Urbisnet Station. In the program for the Urbisnet the user
should specify the IP address of the station, the port used to
upload the station configurations and to download the data
obtained by the sensors. The program Urbisnet for the PC is
made to work with a program that should be running on the
station called Urbisnet_Station. The Urbisnet_Station program
is always listening for new configurations sent by the PC, and
acts accordingly to the configurations.
In case the communications is being made with GSM the
computer must have a serial port(or a serial to USB adapter),
this serial port should be connected to a GSM board that can
be interfaced with AT commands, allowing this way to send
configurations and to receive data from the sensors.
The Urbisnet_Station program that runs in the station, is
configured by the PC to work with GSM or WIFI
communications.
The user can check the credit of the SIM inserted on the
GSM interface for the PC, connected by the serial port, by
sending a CUSD command, that can be typed of the text box
CUSD code, and clicking the Send CUSD button.
The user can check the credit of the SIM inserted on the
C10/3 by opening a telnet connection to the Urbisnet_Station,
and then executing the program Send_CUSD, with the
appropriate SD command.
Fig. 10 – Main window of the Urbisnet program on the PC.
The Urbisnet program on the PC has the ability to send a
configurations file to the Urbisnet Station, this file is called
config_Urbisnet_Station.txt, this file is located on the Urbisnet
Station on the same folder were is the program
Urbisnet_Station. Every time the Urbisnet_Station program is
started on the station, this file is read and the Urbisnet_Station
program will operate in accordance with those configurations.
This is an example of such file:
### Urbisnet configuration file ###
SAMPLING_TIME:10
SENSOR_LOG:sensor_log.txt
COMUNICATION:WIFI
SAMPLES_ON_MESSAGE:6
CONFIGURATIONS_PORT:10100

8
GAS_MEASUREMENTS_PORT:10101
PC_SERVER_IPv4:192.168.1.101
PC_SERVER_PHONE:+351911516109
STATION_SIM_PIN:2038
SMS_CENTER:+351911616161
IX. TRIALS OF THE MOBILE AIR QUALITY STATION
It was programed a sensor calibration at the ISQ (Instituto
de Soldadura e Qualidade). The program had the objective to
calibrate all the gas sensors, for the gas concentration range
usual on the measurement of outside air quality.
The sensors used with the station were made available to me
by Prof. Francisco Alegria, the only sensor that was selected
by me was the Alphasense CO2 IRC-A1 NDIR.
At the sensor calibration tests, it was quickly discovered that
the SO2-BF was sensible to SO2 concentrations much higher
that the concentration range used on the measurement of air
quality. So this sensor couldn't be used to accomplish the
project objectives.
The sensors for O3, CO, NO2, are based on metal oxide
crystal that absorb negatively charged oxygen molecules.
These kind of sensors are very sensitive to several
environmental conditions like temperature, humidity,
atmospheric pressure. Also these sensors never are sensitive to
only one air pollutant, they are designed to be more sensitive
to one pollutant, but are always sensitive to several air
pollutants which makes the measurement of small
concentrations like the ones on the measurement of the air
quality very difficult. So these sensors were declared by me
and by Prof. Francisco Alegria inappropriate to the
measurement of outside air quality.
Fig. 11 – Diagram of the apparatus used to calibrate the
MICS-4514 CO and NO2 gas sensor.
Fig. 12 – Graph of the data obtained in the calibration MICS-
4514 CO sensor, when stimulated with different concentrations
of CO in a normal atmosphere.
Fig. 13 – Graph of the data obtained in the calibration MICS-
4514 NO2 sensor, when stimulated with different
concentrations of NO2 in a normal atmosphere.
The sensor for CO2, the NDIR IRC-A1 is based on the
absorption of infrared light by the CO2 gas. This sensor has an
active and a reference channel, so it has some immunity to all
the environmental conditions that can affect the sensor output.
This behavior was clearly observed at the tests made at ISQ,
the sensor output was substantially increased on the active and
reference channel by the nitrogen atmosphere, but was only
observed a difference between the active and reference
channel when it was present the CO2 gas.
The calibration for the CO2 sensor was made not in the sealed
compartment, it used a small cup to cover the sensor with the
gas tube connected to the top of the cup, like this the output
isn't so strongly affected by the pure nitrogen or the
atmospheric pressure present inside the sealed compartment.
TABLE IV
CALIBRATION DATA FOR THE IRC-A1 CO2 SENSOR
[CO2] (ppm) Activo_NDIR (V) Referência_NDIR (V)
0 0.749512 0.741577
2502 0.69038 0.739136
4991 0.6073 0.69519
7505 0.59204 0.698242
10000 0.554199 0.690918

9
Fig. 14 – Graph of the CO2 sensor output related to the gas
concentration.
X. ALTERNATIVE GAS SENSORS
The user of the station can easily change the sensor's board
of the Urbisnet Station, this can be achieved by disconnecting
the flat cable from the sensor board and connecting to another
sensor board designed to work with the Urbisnet Station. This
way different sensors can be used to measure air pollution,
possibly the user is available to spend some extra money on
sensors and buy sensors more selective and more appropriate
to measure low concentrations.
The best sensors found that would have a size and mode of
operation compatible with the station build are:
SO2: Alphasense has recently developed a sensor for
measuring low concentrations of SO2, that is very selective and
also has a size that is within the dimensions required for the
work, , the only negative aspect of the sensor is that it requires
a large signal conditioning circuit. The sensor is the SO2-B4,
it's an electrochemical cell with 4 electrodes, that has a
resolution for measuring SO2 of 0.005ppm.
Fig. 15 – SO2-B4 Sulfur Dioxide, Alphasense
CO: E2V manufactures a CO gas sensor suitable to measure
low concentrations of CO that also has a high selectivity, it is
the EC4-500-CO. This sensor is an electrochemical cell, with a
resolution for CO of 1ppm. It also has a size that is compatible
with the station.
Fig. 16 – EC4-500-CO, CO gas sensor, E2V
O3: For the measurement of O3 there is a new design of gas
sensor that is under development and isn't yet as far as I know
on sale, it is based on the resistance variation, the sensor is
made from indium oxide nanoparticles, with an integrated near
ultraviolet LED that stimulates the sensor. This kind of sensor
doesn't requires to be heated, and so the problems related to
temperature change don't exist. In accordance with the
researchers the sensor can read concentrations as low as
30ppb.
These sensors has I know are developed by the Fraunhofer
Institute for Applied Solid State Physics, Freiburg, Germany.
Fig. 17 – New gas sensor, O3 gas sensor
XI. CONCLUSION
The Station is developed to a state that is fully functional,
for the exception of measuring gas concentration, because of
the the problems encountered on gas sensor calibration and on
the sensor itself. Anyway I don't think that is very problematic,
because in future work for the Urbisnet project, there can be
done several changes to solve this issues. The board with
sensors, can be easily replaced with another board because it's
connected to the main board with a flat cable. So different gas
sensors can be used with the current hardware, possibly more
adequate sensors to measure low gas concentrations and with
good selectivity to specify which gases are present in the
atmosphere. Of course such sensors would be much more
expensive, and probability will occupy more volume, but I
don't think that would made the station economically unviable.
ACKNOWLEDGMENT
I would like to thanks to my Thesis Supervisor, Prof.
Francisco Algeria for the guidance and for the opportunity to
work in this project, that I think is an interesting project and of
value for today environmental problems.
I would like also too express a special thanks for Mr. João
Pina dos Santos, for all the support and advice that he has
given to me, and also because a large part of the work requires
the construction of the equipment and of Printed Circuit
Boards, that are only possible for me with the equipment
available at the workshop and PCB laboratory of Instituto
Superior Tecnico, Taguspark, whose he is responsible for the

10
student access.
I would also like to thank the following people:
Prof. Moises Piedade, Eng. José Calhariz, Jorge Candeias,
Ricardo Borges, Prof. Gonçalo Tavares, João Graça, Fabio
Gameiro, Ana Rita Guilherme, João Cabeleira, Carla Duarte,
Engº Luís Miguel de Jesus, Grant Gayed, Hanley Tim.
REFERENCES
[1] Datasheet of MICS-2611, Ozone gas sensor from e2v, A1A-MiCS-2611
Version 1, July 2008,
http://www.e2v.com/assets/media/files/sensors_datasheets/Metal_Oxide
/mics-2611.pdf
[2] Datasheet of MICS-4514, CO and NO2 gas sensor from e2v, A1A-
MiCS-4514 Version 2, July 2008,
http://www.e2v.com/assets/media/files/sensors_datasheets/Metal_Oxide
/mics-4514.pdf
[3] Datasheet of SO2-BF Sulfur Dioxide Sensor,
http://www.alphasense.com/pdf/SO2BF.pdf
[4] Alphasense Application Note AAN 104, How electrochemical gas
sensors work, http://www.alphasense.com/pdf/AAN_104.pdf
[5] Alphasense Application Note AAN 201-05,NDIR: Gas Concentration
Calculation Overview,
http://www.alphasense.com/pdf/NDIR/AAN_201-05.pdf
[6] Telit GE863-PRO3 Linux Software User Guide, 1vv0300781 Rev.5 –
2010-01-25, www.telit.com/module/infopool/download.php?id=1140
[7] Libelium, wireless sensor networks,
http://www.libelium.com/support/waspmote , 27 May 2011
[8] Datasheet of the EC4-500-CO, Carbon Monoxide Electrochemical
Sensor, E2V, A1A-764714 Version 2, October 2009.
[9] Near-UV LEDs for integrated InO-based ozone sensors, Ch. Y. Wang*,
V. Cimalla, M. Kunzer, T. Passow, W. Pletschen, O. Kappeler, J.
Wagner, and O. Ambacher, Fraunhofer Institute for Applied Solid State
Physics, Freiburg, Germany, Published online 12 May 2010.
[10] Datasheet of SO2-B4 Sulfur Dioxide Sensor, Alphasense, Doc. Ref.
SO2B4/JUN11.


