Embed Size (px)
Citation preview

International Journal of Rural Criminology, Volume 1, Issue 1 (December), 2011
1 | P a g e
Predictors of Fear and Risk of Terrorism in a Rural State*
David C. May1, Joe Herbert2, Kelly Cline1, and Ashley Nellis3 1 Department of Criminal Justice
Eastern Kentucky University
521 Lancaster Avenue, Stratton 467
Richmond, KY 40475 2 Department of Safety, Security, and Emergency Management
Eastern Kentucky University
521 Lancaster Avenue; Stratton 205
Richmond, KY 40475-3102 3 The Sentencing Project
1705 DeSales Street, NW- 8th Floor
Washington, DC 20036
Contact author – David May: [email protected]; 010 859 622 6681
Abstract
This article examines attitudes about terrorism utilizing criminological literature
about fear of crime and perceived risk of victimization and data from a statewide
survey of 1,617 adults in Kentucky. Measures of both fear of terrorism and perceived
risk of terrorism were geography based. The demographic variables had minimal
impact on both perceived risk of terrorism and fear of terrorism, although gender was
significantly related to both, suggesting a link based on socialization experiences of
men and women. Although rural residence had a small but statistically significant
relationship to perceived risk, it was not related to fear. The strongest predictor of
fear was perceived risk itself, which mirrors research on the close association of fear
of crime and perceived risk to victimization.
Keywords: Terrorism, Fear of Crime, Perceived Risk
*Data used in this study were collected as part of a victimization survey funded by the Kentucky
Statistical Analysis Center in March, 2008. Any opinions expressed in this study are those of the
authors and not of the Kentucky Justice Cabinet or the Kentucky Statistical Analysis Center.

Predictors of Fear and Risk of Terrorism in a Rural State – May, Herbert, Cline and Nellis
2 | P a g e
Introduction
On September 11, 2001, 2,752 people lost their life in the attacks on the World
Trade Center in New York (Hirschkorn 2007). That single event (perhaps more than
any individual event since the bombing of Pearl Harbor in 1941) reshaped the
mindset of both American citizens and American legislators. This terroristic event
triggered a war on two fronts (Afghanistan and eventually Iraq), created a number of
legislative acts and security procedures that reshaped public behavior throughout the
United States, and, arguably, introduced a realization for many Americans that they
were not as safe in their daily lives in the United States as they thought they were
prior to 9/11. Nevertheless, despite these widespread changes, and despite anecdotal
evidence that suggests Americans are more fearful of terrorism after 9/11 than they
were prior to its occurrence, little scientific literature of which we are aware examines
either the prevalence of fear of terrorism or the perceived likelihood of victimization
by terrorism. Furthermore, practically none examines those perceptions among rural
Americans.
In this article, we attempt to fill that gap in the literature by using data from over
1,600 adult Kentuckians to examine both their perceived risk of terrorism
victimization and their fear of terrorism. By doing so, we hope to determine if (a)
terrorism risk and fear of victimization are more pervasive than risk and fear of
victimization by other types of crime; and (b) if the predictors of elevated perceptions
of risk and fear of terrorism match those that we know predict perceived risk and fear
of crime for other types of crime. By doing so, we hope to provide some
understanding regarding the fear and risk of terrorism in rural communities.
Definition of Terrorism
The United States Federal Code defines terrorism as, “premeditated, politically
motivated violence perpetrated against noncombatant targets by subnational groups or
clandestine agents” (United States Federal Code, 2009, Title 22, Chapter 38, Para.
2656, section f2). However, this is only one of hundreds of definitions of terrorism;
as such, despite the fact that most scholars agree that terrorism exists, not many can
agree on the definition of terrorism. Kushner (2003) states that most definitions of
terrorism hinge on one of three factors: the purpose, the target, and the method. In
other words, most definitions of terrorism suggest that, in some form, terrorism is an
act designed to instill fear through some form of violence that is politically motivated
(Kushner 2003).
Terrorism can be domestic or international. Domestic terrorism is the act of
violence primarily within the United States while international terrorism refers to the
activities that involve violent acts that would be considered criminal if committed
International Journal of Rural Criminology, Volume 1, Issue 1 (December), 2011
3 | P a g e
within the jurisdiction of the United States (National Victim Assistance Academy
2002). Given these components of the definition, terrorism is not only physical
violence, but emotional violence as well. Because there is no single definition of
terrorism, each person or country can hold its own definitions based on their political
or religious orientation.
Terror is a device to control society by means of preventive intimidation under
conditions of mass hysteria (Vasilenko 2004). In fact, Vasilenko (2004: 46) argues
that the word “terror” is of Latin origin and can be translated to mean “fear” or
“horror.” Although terrorism is considered to be one of the most significant social
problems confronting the world community in the 21st century (Vasilenko 2004),
some scholars suggest that before 9/11, there was no nationwide fear of terrorism in
the United States (Victor 2006).
In recent years, the United States has been subject to a number of terrorist attacks,
including the first bombing of the World Trade Center in 1993; attacks on the USS
Cole in 2000; and the aforementioned devastating attacks of September 11, 2001.
Nevertheless, the events of 9/11 brought about a dramatic change. Victor (2006)
reported that in a Gallup Poll conducted in August, 2004, those surveyed were asked
if they believed, “terrorists would target an attack against New York City and other
big cities, or any place in the U.S." The majority of respondents (61 percent) stated
they felt an attack could occur in any area of the United States while 31 percent
reported that an attack could occur in New York City or bigger cities. In the same
article, a national Gallup poll found that 41 percent of Americans said they were very
worried or somewhat worried that they or someone in their family would become a
victim of terrorism.
Since September 11, 2001, the media coverage of terrorist threats and terrorist
groups has increased dramatically. DiMaggio (2008) claims that citizen fears are
often driven by media framing of issues; when the media has a vested interest in an
issue (e.g., terrorism), the reporting of that issue often becomes slanted so that the
factual information is reported through a lens of fear and anxiety. Thus, the constant
media attention to terrorism, its causes, and its consequences may undermine the
larger social order by impacting psychological processes of citizens in the countries
where terrorism is reported as a threat (Fisher, Greitemeyer, Kastenmuller, Frey, &
Oßwald 2007).
Fear is a powerful response to terrorism that may be distorted through media
images and messages (Borgeson & Valeri 2009). Compared to 20 or 30 years ago,
advances in technology today are a leading contributor to the distribution of
information to the public, and therefore, those distorted images. Local and national
news media utilize the television, radio, and Internet as broadcasting tools to convey
Predictors of Fear and Risk of Terrorism in a Rural State – May, Herbert, Cline and Nellis
4 | P a g e
information to citizens in our fast-paced society. The language used by these media
appears to be particularly troubling for certain demographic groups, as it has been
shown to evoke fear in elderly citizens who live in rural areas at greater levels than
those who live in larger cities, making older persons in rural localities more fearful of
violent events and terrorist attacks than older persons in bigger places (Victor 2006).
As with other dramatic events, the media also exaggerates terrorism, in turn
creating the potential to inflate the public’s fear of terrorism and perceived risk of
future attacks (Borgeson & Valeri 2009). The authors go even further to
acknowledge that the media’s treatment of crime is much like that of its treatment of
terrorism. In addition, they point to the fact that viewers reporting their main source
of information as local news are more fearful of crime than those that report the
national news as their main source of information. As such, fear of terrorism can be a
by-product used by terrorist groups in an effort to disrupt society.
Josiger (2009) stated that “terrorism is a form of psychological warfare designed
to maximize publicity and influence audiences significantly larger than the immediate
victims (p. 4).” Josiger argues that the aim of terrorist attacks is to intimidate the
targeted population and suggests that terrorists anticipate that the increased level of
fear and political disaffection will force governments to make compromises that will
ultimately make their attempts more successful. Therefore, the perceptions of the
public are important in simultaneously driving the government’s response to
terrorism. In considering public perceptions in relation to counter-terrorism policies,
the targeted governments that are unable of responding to terrorist acts will lose the
support of the public; likewise, a government that reacts outrageously or restricts the
public will be criticized.
Empirical evidence so far suggests that, despite the fact that several years have
passed since 9/11, public fear of terrorism is still elevated (Nellis 2007). Some
authors suggest that the public overestimates the threat of terrorist attacks (Friedman
2005) and that perceived risks are out of sync with reality. In fact, some authors
suggest that American citizens have overestimated the threat of terrorist attacks given
the decline of such attacks after September 11, 2001 (Friedman 2005) and argue that
Americans are more likely to be struck by lightning or die in a car accident than to die
in a terrorist attack.
Despite the evidence that suggests that terrorism negatively impacts the psyche of
citizens in countries where terrorist attacks occur, and given that one of the goals of
terrorist actions is to increase fear and concern about future terrorist activity,
relatively few studies have examined fear of terrorism and its correlates. Those that
do are discussed in detail below.
International Journal of Rural Criminology, Volume 1, Issue 1 (December), 2011
5 | P a g e
Fear of Terrorism
After the terrorist attacks on September 11, 2001, Boscarino, Figley, and Adams
(2003) addressed terrorism and the fear of terrorism using data collected from a
sample of adults in the state of New York in September 2002. The state was divided
into five regions: New York City, Long Island, Hudson Valley region, Upstate
Eastern region, and Upstate Western region. Respondents were asked about their
levels of concern (very concerned, somewhat concerned, not too concerned, not
concerned at all) related to the following events happening in New York: (a) another
major terrorist attack, (b) a terrorist attack involving biological weapons, such as
smallpox or anthrax, and (c) a terrorist attack involving a “nuclear device” (p. 201).
Boscarino et al. (2003) found that almost half (45.7%) of New Yorkers reported
being “very concerned” about another major attack, 50.4 percent were very concerned
about biological attacks, and 42.5 percent reported being very concerned about
nuclear attacks. Additionally, one in three respondents (33.4%) reported that they
were very concerned about all three events occurring. Their multivariate analyses
determined that women, older respondents, African Americans, Hispanics, and less
educated respondents were all more fearful of terrorism than their counterparts. The
downstate residents also reported higher levels of fear, as 41.7 percent of downstate
respondents were very concerned about a major attack compared to only 22 percent
for upstate respondents. Also, New York City and Long Island residents reported a
higher level of concern and were more likely to report that they would evacuate
immediately following another attack. The authors closed by stating that, overall,
“there was a significant public concern about future terrorist attacks in New York
(Boxcarino et al 2003: 203).”
Boscarino et al. (2003) made a significant contribution to the research in the area
of fear of terrorism. Nevertheless, their research was the exception, not the rule. The
other research that examines fear of terrorism is largely descriptive research and most
of that research is conducted by the Gallup organization. In one Gallup poll, the
questioned was posed, “How worried are you that you or someone in your family will
become a victim of terrorism – very worried, somewhat worried, not too worried, or
not worried at all (p. 128)?” The data collected since 1995 concluded that after the
Oklahoma City bombing, 42 percent were somewhat or very worried. Before
September 11, 2001, only 24 percent were somewhat worried; the day of 9/11, 35
percent were somewhat worried, while 24 percent were very worried (p. 128).
A second Gallup poll found that almost 9 in 10 Americans felt it was likely that
bombings or similar acts of violence would occur elsewhere in the United States in
the near future (Carroll 2009). In another Gallup poll, Carlson (2004) indicated that
the public’s concern regarding terrorism has declined since the September 11 terror

Predictors of Fear and Risk of Terrorism in a Rural State – May, Herbert, Cline and Nellis
6 | P a g e
attack; however, immediately following the attacks, more than half of Americans
expressed concern about being victimized by another act of terrorism. Women were
more worried about terrorism than men (38% v 29%) but another variable of interest,
political affiliation, did not impact one’s fear of terrorism. Republicans, Democrats,
and political independents were all equally likely to indicate they were very worried
or somewhat worried about terrorism.
In a telephone interview of randomly selected national sample of 1,031 adults,
Moore (1999) determined that there was little difference by age, gender, education, or
partisan political orientation; however, individuals with higher incomes were less
likely than those with lower incomes to report a fear of terrorist attacks. Moore found
that, even before 9/11, 58 percent of respondents with a household income of less
than $50,000 per year reported they were less likely to attend a large public event on
New Year’s Day. Saad (2004) determined that although fear of terrorism has
declined since the 9/11 events, fear of terrorism remained higher than pre-9/11 levels.
In sum, then, available evidence suggests that many Americans are fearful of
terrorism and that fear of terrorism has detrimental impacts on their daily lives.
Interestingly, none of the studies reviewed above compared predictors of fear of
terrorism and perceived risk of terrorism to individuals’ fear and perceived risk of
victimization of more “traditional” crimes (e.g., robbery, theft, rape). Consequently,
this relationship remains unexplored. In the following section, we provide a short
summary and review of the available evidence regarding fear of crime, risk of
criminal victimization, and its predictors. We then move to the purpose of this study
and the relationship between fear and perceived risk of terrorism and fear and
perceived risk of more traditional crimes.
Predictors of Fear of Crime
Although relatively few studies have explicitly examined fear of terrorism,
intuitively, predictors of fear of terrorism should be similar to predictors of fear of
other crimes as well. In the following pages, we review the available evidence
regarding predictors of fear of crime and close by offering hypotheses (based on this
literature) regarding how these demographic predictors should impact fear of
terrorism.
There are a number of demographic factors that have demonstrated an association
with fear of criminal victimization, including gender, age, race, income status,
victimization status, and environmental context. For example, gender is a strong
predictor of fear of crime, with women expressing more fear of crime than men even
though they are less likely to be victimized by crime in general than males. This

International Journal of Rural Criminology, Volume 1, Issue 1 (December), 2011
7 | P a g e
discrepancy between fear levels and actual victimization rates is often called the
“gender-fear paradox.”
Several explanations are posed for this paradox, including suggestions that (1)
women feel physically vulnerable because of their generally smaller physical stature
than males; (2) women’s fear of rape and violence from their spouses / partners /
boyfriends “shadows” their fear of all other crimes (in other words, women associate
rape with burglary, robbery and all other personal crimes, thus increasing their fear of
those crimes because they fear they may be raped during that victimization
experience, and (3) women's fear of crime and men’s lack of fear of crime is part of
the gender socialization process (Ferarro 1995; Ferraro 1996; Fisher & Sloan 2003;
Gilchrist et al. 1998; Goodey 1997; Haynie 1998; Killias & Clerici 2000; May 2001a;
May 2001b; Smith & Torstensson 1997; Stanko 1990).
The available research also suggests that age has an important influence on fear,
as older people are often found to fear crime at higher levels than younger people,
although some question the age-fear association (LaGrange and Ferraro 1989; Warr,
1990). In terms of income and race, research suggests that low income individuals
are more likely to report fear of crime than middle to upper income individuals.
Although this finding is intriguing, little work has considered this variable in much
detail (Hale 1996; Vacha and McLaughlin 2004). The connection between a person’s
race and fear of crime is also inconsistent, with some studies finding white
individuals with higher fear of crime levels, and other studies finding non-white
individuals with higher fear of crime levels (Lane & Meeker, 2003; May & Dunaway
2000; Parker, McMorris, Smith, & Murty 1993). This issue is further complicated by
the fact that the racial composition of the neighborhood in which individuals reside
may be more influential than the individual’s race in determining fear of crime level
(Hale 1996).
Since September 11, 2001, the media coverage of terrorist threats and terrorist
groups has increased dramatically and researchers have studied the impact of media
exposure on terrorism fear and perceptions (Nellis 2007; Nellis 2009; Lane, Meeker,
& Nellis 2009). DiMaggio (2008) claims that citizen fears are often driven by media
framing of issues; when the media has a vested interest in an issue (e.g., terrorism),
the reporting of that issue often becomes slanted so that the factual information is
reported through a lens of fear and anxiety. Thus, the constant media attention to
terrorism, its causes, and its consequences may undermine the larger social order by
impacting psychological processes of citizens in the countries where terrorism is
reported as a threat (Fisher, Greitemeyer, Kastenmuller, Frey, & Oßwald 2007) and
may inflate the public’s fear of terrorism and perceived risk of future attacks (Nellis
2009).

Predictors of Fear and Risk of Terrorism in a Rural State – May, Herbert, Cline and Nellis
8 | P a g e
Demographic predictors of crime fear can serve as a template for exploring
correlates of terrorism fear and perceived risk. Extant research findings suggest that
females, older persons, nonwhites, and those with a lower household income are more
fearful of criminal victimization. As such, we expect that they will be more fearful of
terrorism as well. Although not reviewed here, the literature suggests that these
variables should also impact risk of terrorism in much the same way. In the following
pages we explore whether those predictors of fear and risk of criminal victimization
in general apply to fear and risk of terrorism as well.
Predictors of Perceived Risk of Victimization
Ferraro (1995) was one of the first fear of crime researchers to distinguish fear of
criminal victimization from risk of criminal victimization. Ferraro (1995) argued that
perceived risk of victimization differed from fear of crime because perceived risk
involved a cognitive judgment while fear of crime represented an emotional response.
Since that time, most fear of crime researchers now view perceived risk as a cognitive
assessment of their actual risk of criminal victimization that is usually the best
predictor of fear of criminal victimization. A number of researchers now argue that
both risk and fear should be considered in any attempt to understand fear of crime
(see Rader, May, and Goodrum 2007, for review).
Several studies have considered the demographic predictors of perceived risk.
The relationship between demographic variables and perceived risk does not appear
to be as clear as demographic predictors of fear of crime. Although relatively few
studies have considered demographic predictors of risk, among those that have, a
number find that perceptions of risk is crime-specific and that the relationship
between gender, perceived risk, and fear of crime is gender-specific; men have higher
levels of perceived risk for robbery than women but women's perceptions of risk
impacted fear of sexual assault and burglary (Rader et al. 2007). Relationships
between age, income, race, and perceptions of risk of victimization have similar
complexities. As such, while there appear to be fairly clear relationships between
gender, race, age, income, education, and fear of crime, the relationship between
these variables and perceptions of risk of criminal victimization are more complex.
As such, more research is needed to clarify these relationships.
Methods
Sampling
The data used in this study were derived from a victimization survey of adults in
Kentucky conducted in the spring of 2008. In order for the survey to be
representative of the state, our initial request was to the Kentucky Division of Motor
Vehicle Licensing to obtain a randomly selected list of 5,000 licensed drivers to use

International Journal of Rural Criminology, Volume 1, Issue 1 (December), 2011
9 | P a g e
as the sampling frame for this analysis. In early February, we learned that current
technological limitations did not make that a feasible sampling strategy. We then
approached the Kentucky State Board of Elections and requested a list of all
registered voters in the state of Kentucky. Upon receipt of this list, we selected a
random sample of 5,000 registered voters.
Data Collection: In March, 2008, we mailed a postcard to the 5,000 addresses
that we had randomly selected advising them that they would be receiving a mail
questionnaire asking them to share their experience with crime and victimization.
Approximately two weeks later, we mailed a packet containing the questionnaire, a
cover letter explaining the purpose of the project, and a metered return envelope to
each of the 5,000 selected addresses. Approximately two weeks later, we mailed a
reminder postcard to all respondents that had not returned a completed questionnaire
(or for whom we had not been notified by the post office that their address was
incorrect). Two weeks after that, we mailed another packet containing the same
contents as the initial packet. The data collection began in late March and continued
into late May, 2008.
One in eight (11.9%) of the addresses selected were undeliverable to the
respondent drawn through the random sampling strategy described above. Although
we were notified by survivors that five respondents originally selected were deceased,
practically all of the 593 respondents for whom the survey was undeliverable were
not able to be contacted because the address supplied by the voter registration
database was incorrect. Additionally, 15 respondents informed us by sending a letter
or the questionnaire that we sent to them that they did not want to participate in the
study. Three additional respondents returned a questionnaire that contained only
minimal information (e.g., their gender and one or two other completed questions).
Completed, usable questionnaires were received from 1,617 respondents. Using a
total sample of 4,407 respondents as the valid sample from which the respondents
were drawn, the response rate for this study was thus 36.7 percent.
Survey Instrument: Members of the Statistical Analysis Committee met with a
Justice Cabinet representative in December, 2007 to begin the development of a
survey draft and to establish the data collection technique and the sampling strategy
to be used in this effort. Following this meeting, a draft of the survey was presented
to the Statistical Analysis Coordinator for the state of Kentucky, who then sought
input from a number of constituencies in January and February, 2008. Feedback from
these groups was used to revise the survey. The final version of the survey was
completed in March, 2008.

Predictors of Fear and Risk of Terrorism in a Rural State – May, Herbert, Cline and Nellis
10 | P a g e
Table 1 Comparison of Sample and Population Demographic Characteristics*
Demographic Variable Sample
Frequency (Percent)
2000 Census Estimates
Frequency (Percent)
Gender
Male 730 (45.1) 1,975,368 (48.9)
Female 884 (54.7) 2,066,401 (51.1)
Missing Data 3 (0.2) --
Race
White 1524 (94.2) 3,678,740 (91.0)
Black 58 (3.6) 311,000 (7.7)
Other 38 (2.3) 96,581 (2.4)
Missing Data 7 (0.4) --
Education
Less than 12 years 119 (7.3) 685,000 (25.9)
G.E.D./High School Graduate 596 (36.9) 888,277 (33.6)
Some College 300 (18.6) 619,651 (23.4)
College Graduate 406 (25.1) 271,418 (10.3)
Postgraduate Work 152 (9.3) 182,051 (6.9)
Missing Data 44 (2.7) --
Age N (%)
18-24 83 (5.1) 401,858 (13.4)
25-35 192 (12.1) 632,494 (21.0)
36-45 264 (16.4) 637,074 (21.2)
46-55 355 (22.0) 539,033.2 (17.9)
56-65 369 (23.0) 361,716.4 (12.0)
66 and over 335 (20.0) 432,219.4 (14.4)
Missing Data 14 (0.9) --
Marital Status
Married 1059 (65.5) 1,844,628 (57.3)
Widowed 103 (6.4) 231,630 (7.2)
Divorced 165 (10.2) 353,637 (11.0)
Single, Never Married 208 (12.9) 730,035 (22.7)
Opposite Sex partner sharing a home 60 (3.7) --
Same Sex partner sharing a home 5 (0.3) --
Missing Data 17 (1.1) --
Number of children <18 living at current
residence
0 1047 (64.7) --
1-2 426 (26.4) --
3 or more 78 (4.9) --
Missing Data 66 (4.1) --
International Journal of Rural Criminology, Volume 1, Issue 1 (December), 2011
11 | P a g e
Table 1 continued: Comparison of Sample and Population Demographic Characteristics*
Demographic Variable Sample
(Frequency & Percent)
2000 Census Estimates
(Frequency & Percent)
Income
Less than $20,000 258 (16.0) 477,186 (30.0)
$20,000 to less than $50,000 446 (27.6) 604,145 (38.0)
$50,000 to less than $80,000 370 (22.9) 274,530 (17.2)a
$80,000 or more 340 (22.3) 235,878 (14.8)
Missing Data 183 (11.3) --
Place of Residence
Urban (Louisville or Lexington) 390 (24.1) 954,116 (23.6)
Rural (Rest of State) 1222 (75.6) 3,087,653 (76.4)
Missing Data 5 (.3)
aCensus data are categorized from $50,000-$75,000 and over $75,000, rather than $50,000-$80,000 and over
$80,000, as the question measuring household income was worded on the survey instrument for this study. * Due to the differences in the manner in which some of the demographic data were categorized, some
of the categorical data were interpolated.
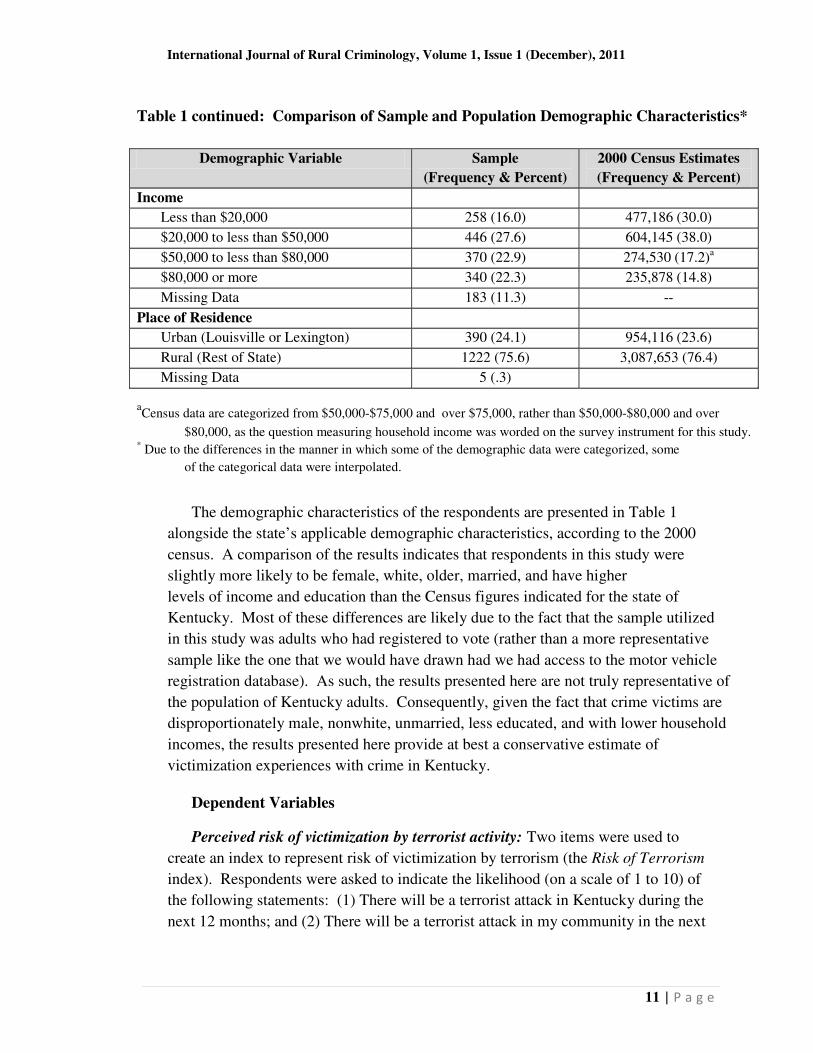
The demographic characteristics of the respondents are presented in Table 1
alongside the state’s applicable demographic characteristics, according to the 2000
census. A comparison of the results indicates that respondents in this study were
slightly more likely to be female, white, older, married, and have higher
levels of income and education than the Census figures indicated for the state of
Kentucky. Most of these differences are likely due to the fact that the sample utilized
in this study was adults who had registered to vote (rather than a more representative
sample like the one that we would have drawn had we had access to the motor vehicle
registration database). As such, the results presented here are not truly representative of
the population of Kentucky adults. Consequently, given the fact that crime victims are
disproportionately male, nonwhite, unmarried, less educated, and with lower household
incomes, the results presented here provide at best a conservative estimate of
victimization experiences with crime in Kentucky.
Dependent Variables
Perceived risk of victimization by terrorist activity: Two items were used to
create an index to represent risk of victimization by terrorism (the Risk of Terrorism
index). Respondents were asked to indicate the likelihood (on a scale of 1 to 10) of
the following statements: (1) There will be a terrorist attack in Kentucky during the
next 12 months; and (2) There will be a terrorist attack in my community in the next
Predictors of Fear and Risk of Terrorism in a Rural State – May, Herbert, Cline and Nellis
12 | P a g e
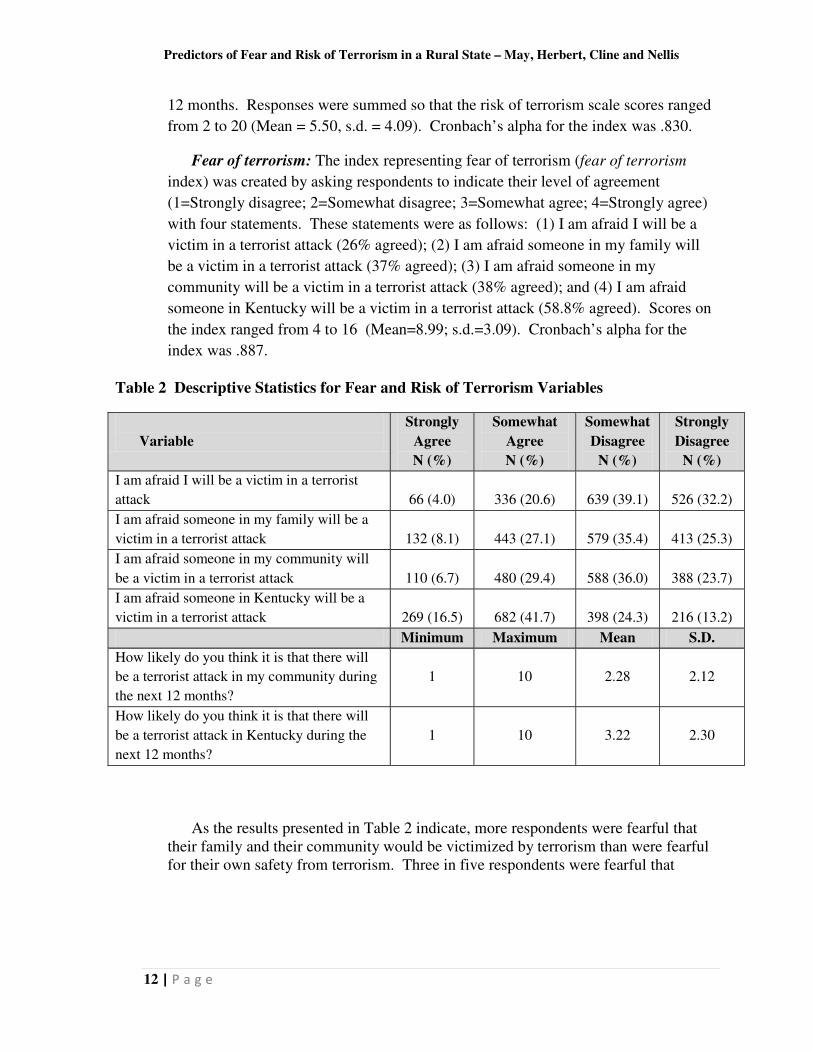
12 months. Responses were summed so that the risk of terrorism scale scores ranged
from 2 to 20 (Mean = 5.50, s.d. = 4.09). Cronbach’s alpha for the index was .830.
Fear of terrorism: The index representing fear of terrorism (fear of terrorism
index) was created by asking respondents to indicate their level of agreement
(1=Strongly disagree; 2=Somewhat disagree; 3=Somewhat agree; 4=Strongly agree)
with four statements. These statements were as follows: (1) I am afraid I will be a
victim in a terrorist attack (26% agreed); (2) I am afraid someone in my family will
be a victim in a terrorist attack (37% agreed); (3) I am afraid someone in my
community will be a victim in a terrorist attack (38% agreed); and (4) I am afraid
someone in Kentucky will be a victim in a terrorist attack (58.8% agreed). Scores on
the index ranged from 4 to 16 (Mean=8.99; s.d.=3.09). Cronbach’s alpha for the
index was .887.
Table 2 Descriptive Statistics for Fear and Risk of Terrorism Variables
Variable
Strongly
Agree
N (%)
Somewhat
Agree
N (%)
Somewhat
Disagree
N (%)
Strongly
Disagree
N (%)
I am afraid I will be a victim in a terrorist
attack
66 (4.0)
336 (20.6)
639 (39.1)
526 (32.2)
I am afraid someone in my family will be a
victim in a terrorist attack
132 (8.1)
443 (27.1)
579 (35.4)
413 (25.3)
I am afraid someone in my community will
be a victim in a terrorist attack
110 (6.7)
480 (29.4)
588 (36.0)
388 (23.7)
I am afraid someone in Kentucky will be a
victim in a terrorist attack
269 (16.5)
682 (41.7)
398 (24.3)
216 (13.2)
Minimum Maximum Mean S.D.
How likely do you think it is that there will
be a terrorist attack in my community during
the next 12 months?
1
10
2.28
2.12
How likely do you think it is that there will
be a terrorist attack in Kentucky during the
next 12 months?
1
10
3.22
2.30
As the results presented in Table 2 indicate, more respondents were fearful that
their family and their community would be victimized by terrorism than were fearful for their own safety from terrorism. Three in five respondents were fearful that

International Journal of Rural Criminology, Volume 1, Issue 1 (December), 2011
13 | P a g e
someone would be a victim of terrorism in Kentucky, indicating that a large number
of respondents fear terrorism in their home state seven years after the terrorist events
of September 11. Additionally, based on the average response for the perceived risk
of terrorism measures, respondents felt relatively little risk of terroristic activity in
both their community and in Kentucky. Nevertheless, respondents were more likely
to perceive that there would be a terrorist action in the state of Kentucky than in their
own community.
Multivariate Results
Because the purpose of this study was to examine the predictors of both fear of
local terrorism and risk of victimization by terrorists in the local community,
multivariate linear regression was used to determine what demographic predictors had
significant associations with both perceived risk of terrorism victimization and fear of
terrorism.
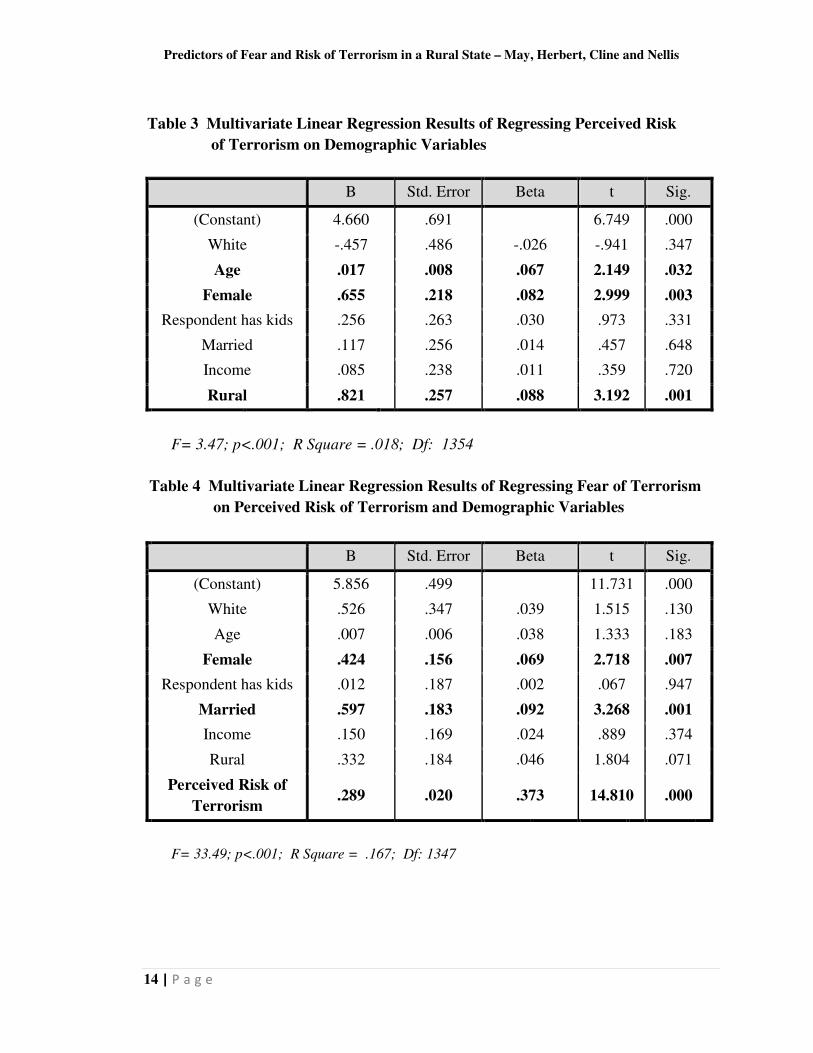
The results of regressing risk of terrorism victimization on the demographic
variables are presented in Table 3 on the next page. The results presented in Table 3
suggest that only age, gender, and place of residence impact perceptions of risk of
terrorism, as older respondents, female respondents, and those respondents living
outside of the large urban areas were significantly more likely to perceive that they
would be victimized by terrorist activity than their younger, male, and urban
counterparts. Neither race, whether the respondents had children, marital status, or
income had an association with risk of terrorism. Additionally, the variables included
in the model explained only two percent of the variation in perceived risk among the
respondents.
The results of regressing fear of terrorism on the demographic variables and
perceptions of risk of terrorism are presented in Table 4 (next page). The results
presented in Table 4 suggest that gender, marital status, and perceived risk of
terrorism all had a significant impact on fear of terrorism, as females, married
respondents, and those with highest levels of perceived risk of terrorism were all
significantly more fearful of terrorism than their counterparts with lower levels of risk
of terrorism and their male and unmarried counterparts. The variables included in the
model explained only 16 percent of the variation in perceived risk among the
respondents.
Discussion
Using data from over 1,600 Kentucky adults, in this study we attempted to
identify demographic predictors of both perceived risk of terrorism and fear of
terrorism victimization. In doing so, we hoped to expand a largely nonexistent
Predictors of Fear and Risk of Terrorism in a Rural State – May, Herbert, Cline and Nellis
14 | P a g e
Table 3 Multivariate Linear Regression Results of Regressing Perceived Risk
of Terrorism on Demographic Variables
B Std. Error Beta t Sig.
(Constant) 4.660 .691 6.749 .000
White -.457 .486 -.026 -.941 .347
Age .017 .008 .067 2.149 .032
Female .655 .218 .082 2.999 .003
Respondent has kids .256 .263 .030 .973 .331
Married .117 .256 .014 .457 .648
Income .085 .238 .011 .359 .720
Rural .821 .257 .088 3.192 .001
F= 3.47; p<.001; R Square = .018; Df: 1354
Table 4 Multivariate Linear Regression Results of Regressing Fear of Terrorism
on Perceived Risk of Terrorism and Demographic Variables
B Std. Error Beta t Sig.
(Constant) 5.856 .499 11.731 .000
White .526 .347 .039 1.515 .130
Age .007 .006 .038 1.333 .183
Female .424 .156 .069 2.718 .007
Respondent has kids .012 .187 .002 .067 .947
Married .597 .183 .092 3.268 .001
Income .150 .169 .024 .889 .374
Rural .332 .184 .046 1.804 .071
Perceived Risk of
Terrorism .289 .020 .373 14.810 .000
F= 33.49; p<.001; R Square = .167; Df: 1347
International Journal of Rural Criminology, Volume 1, Issue 1 (December), 2011
15 | P a g e
literature regarding perceptions of risk of terrorism and fear of terrorism
victimization. Our findings from that effort are discussed in detail below.
First and foremost, the demographic variables included in the model to explain
perceived risk of terrorism have minimal impact on that variable. Although
females, rural respondents, and older respondents were more likely to have elevated
levels of perceived risk of terrorism, the demographic variables included in the model
explained only two percent of the variation in perceived risk of terrorism among the
respondents in this study. Consequently, it is evident that perceptions of risk of
terrorism are not explained by demographic variables normally associated with
perceived risk of other types of crimes. Thus, perceptions of risk of terrorism must be
explained by contextual or theoretical factors rather than demographic factors.
Given the global nature of the questionnaire used to collect data for this study, we
were unable to explore in great detail a number of these factors that may impact risk
of terrorism victimization. Because the questions included in the risk measure were
geographic in nature (e.g., risk of terrorism in the respondent’s community and risk of
terrorism in the state where they lived, Kentucky), demographic characteristics are
probably not as important in predicting risk of terrorism as characteristics of where
the respondent lives. Interestingly, residents of areas outside of Lexington and
Louisville (the two large metropolitan areas in Kentucky) had higher levels of
perceived risk of terrorism than their counterparts in those two cities. This finding
may be due to the unique nature of Kentucky, as most of the targets considered to be
at greatest risk of terrorist activity in Kentucky (e.g., Bluegrass Army Depot, Fort
Campbell, Fort Knox, most of the Interstate system) are in rural areas. As such,
respondents living in Louisville and Lexington may be correct in considering
themselves less at risk of terrorism than their more rural counterparts. Future
research efforts exploring perceptions of risk of terrorism should include questions to
identify whether respondents have a terrorist target in their community to determine if
this relationship is truly the best explanation of levels of perceived risk of terrorism.
A second important finding from this research has to do with the relationship
between perceived risk of terrorism victimization and fear of terrorism victimizations.
Although the demographic variables did little to predict either risk or fear of
terrorism, perceived risk of terrorism was a strong predictor of fear of terrorism; in
other words, those respondents who considered themselves most at risk of terrorism
in their community and state were also most likely to fear terrorism victimization in
their family and community. This relationship mirrors that found in the research
regarding fear of more traditional crimes and provides insight into methods to reduce
fear of terrorism (discussed below).
Predictors of Fear and Risk of Terrorism in a Rural State – May, Herbert, Cline and Nellis
16 | P a g e
A third important finding from this research has to do with the impact of gender
on both perceived risk of terrorism and fear of terrorism. Women were significantly
more likely to perceive themselves at risk of terrorism and to fear terrorism as well.
As such, gender is an important predictor of fear of terrorism, just as it is an important
predictor of fear of more traditional crimes as well. This finding is particularly
interesting because the relationship between gender and fear of crime is often
attributed to the “shadow of sexual assault” hypothesis that suggests that fear of all
crime is colored by fear of sexual assault among females (Ferraro 1995; Warr 1984).
Given that the measures used to estimate fear of crime are geography based rather
than crime-specific (e.g., afraid of a terrorist activity in my community v. afraid of
being robbed), the shadow of sexual assault is probably not associated with fear of
terrorism in the same manner as fear of more traditional crimes.
Given this fact, the fact that females are more fearful than males of terrorism
among their family and in their community, the evidence presented here suggests that
the best explanation of the gender-fear paradox discussed earlier may be that women's
fear of crime and men’s lack of fear is part of the gender socialization process. In
other words, women are socialized to be more open about their emotions and thus
women are more likely than men to admit their fears, even on confidential, self-report
surveys. It may also be that women are reacting to their own reality in which they are
more likely to be the victims of violence by immediate family members, especially
their partners. Future research efforts should continue to explore this phenomenon by
comparing place-based fear with crime-based fear among the same sample of
respondents. By doing so, researchers may eventually understand the gender-fear
paradox in ways that current knowledge does not allow.
A final important finding from this research has to do with the extent of fear of
terrorism victimization among the respondents in this sample. The findings presented
here suggest that, if the respondents in this sample are indicative of the larger
population, concerns about fear of terrorism increase as an individual considers
terroristic activity outside of the environment they can control. As the results in
Table 2 suggest, only one in four respondents agreed that they were afraid they would
personally be a victim in a terrorist action. However, one in three was afraid
someone in their family and or their community would be a victim in a terrorist action
and almost three in five were afraid someone in Kentucky would be victimized by
terrorism. As such, it appears that people may not be as concerned about their
personal victimization by terrorism as they are about their family, community, and
state. Alternatively, it may also be the case that the respondents were making a
somewhat logical, cognitive judgment in that answer. Individuals may realize that
they personally have little chance of terrorism victimization and thus have lower
levels of fear of terrorism when asked about their own victimization but realize that,
International Journal of Rural Criminology, Volume 1, Issue 1 (December), 2011
17 | P a g e
as the size of the population at risk increases, the likelihood of terrorism victimization
increases as well. Thus, the respondent may realize their chance of personal
victimization is less than that of their family, community, and state populations based
on the sheer increase in numbers in those populations. Future research efforts should
build on this finding by including more specific measures of fear and risk of terrorism
victimization with these somewhat general measures to attempt to better understand
these findings.
Conclusion
While we feel this study has made a number of substantive contributions to the
area of fear and perceptions of risk of terrorism victimization, we are aware that there
are a number of limitations that reduce its generalizability. As mentioned earlier, the
first limitation has to do with the sampling frame of this report. Our initial plan was
to obtain 5,000 addresses from the Kentucky Division of Motor Vehicle Licensing.
Nevertheless, current system limitations would not allow us to draw a sample of that
size that was representative of drivers throughout the state. Because that sample was
not available, we then had to use the next most representative set of addresses that we
could find: voter registration records. Because voters rarely update their registration
records when they move across town, however, use of these records uncovered almost
600 (593) addresses at which the survey was undeliverable. This further limited the
potential number of respondents as well.
Additionally, because we were only able to use a sample of registered voters, that
sampling strategy necessarily excludes one group of adults: unregistered voters. A
number of researchers have determined that residents who are young, mobile, less
educated, and of lower socioeconomic status are less likely to both register to vote
and vote than their counterparts (see Knack, & White 2000, for review).
Additionally, in Kentucky, registered voters are more likely to be female (53% of
registered voters) and Democrat (57% of registered voters-- see Kentucky State
Board of Election statistics available at http://www.elect.ky.gov/stats/). As such, a
random sample of registered voters in Kentucky is likely to be slightly older, less
mobile, more educated, of higher socioeconomic status, slightly more female, and
more likely to be Democrats. The demographic statistics presented in Table 1 suggest
that these characteristics are evident in this sample as well.
Another limitation has to do with the type of measures used in this study. As we
pointed out previously, to fully understand fear and risk of terrorism victimization
and its causes and consequences, a number of measures specifically examining those
phenomena need to be included. Given the global nature of the survey from which
we drew our data, we were not able to go to the level of detail necessary to fully
understand these relationships.
Predictors of Fear and Risk of Terrorism in a Rural State – May, Herbert, Cline and Nellis
18 | P a g e
Nevertheless, within the limitations of this sample, we feel that the findings
presented here are informational and relevant and should be considered by those
working in any function that deals with terrorism and its consequences. The research
presented here suggests that there are important steps policymakers and professionals
working in law enforcement and homeland security can take to reduce both fear and
risk of terrorism victimization. The most important of these steps is to educate
American citizens about the reality of terrorism victimization.
Between 2002 and 2011, the Department of Homeland Security (DHS) used a five
level, color-coded scale of terrorism threat levels to attempt to help educate citizens
about their risk of terrorism. After almost a decade, DHS realized the system was not
meeting the goal of providing citizens a realistic assessment of their terror risk (in
virtually all circumstances, the national threat level was yellow (elevated, significant
risk of terrorist attack) and replaced that system with the National Terrorism Advisory
System (available at http://www.dhs.gov/ynews/releases/pr_1303296515462.shtm).
Because these levels remained relatively unchanged between 2002 and 2011,
most citizens ignored them because they felt they were meaningless or there was little
they could do in their daily lives to increase or decrease their chances of terrorism
victimization. While this is probably true to some extent (and probably more for
terrorism than more traditional crimes), this is certainly not always the case.
To combat this problem, local emergency management and criminal justice
agencies should provide more detailed information to the residents of their
community regarding the threat levels of terrorism in that community. Because the
evidence presented here suggests that individuals are more fearful of terrorism as the
population at risk increases, then having good, current information about the
terrorism threat level in their own community will make individuals feel safer from
terrorist activity in their homes and communities where the vast majority of their
activities take place. While we do not know for certain in every community and
every situation, intuitively, a resident of a rural Kentucky community with no
strategic governmental assets is probably at far less risk of terrorist activity than a
Kentucky resident living near a strategic governmental asset. This knowledge should
make residents in those communities realize that they are at less risk of terrorism
victimization and thus less fearful of terrorism in general. Until such a strategy is
considered and implemented, fear of terrorism is likely to present a threat for all.

International Journal of Rural Criminology, Volume 1, Issue 1 (December), 2011
19 | P a g e
References
Borgeson, K. & Valeri, R. 2009. Terrorism in America. Jones and Bartlett
Publishers, LLC, Sudbury, MA.
Boscarino, J.A., Figley, C.R., & Adams, R.E. 2003. Fear of terrorism in New York
after the September 11 terrorist attacks: Implications for emergency mental
health and preparedness. Emergency Mental Health, 199-209. Retrieved
from www.fsu.edu on 02/15/09.
Carlson, D.K. 2004. Terrorism Fears not Partisan; War’s Progress Is. Washington
D.C.: Gallup. Retrieved March 13, 2009 from
http://www.gallup.com/poll/12787/Terrorism-Fears-Partisan-Wars-
Progress.aspx.
Carroll, J. 2009. Terrorism. Washington D.C.: Gallup. Retrieved March 14, 2009
from http://www.gallup.com/poll/10009/Terrorism.aspx
Dimaggio, A.R. 2008. MassMedia, Mass Propaganda: Examining American News in
the ‘War on Terror.’ Lanham, MD: Lexington Books.
Ferraro, K., & LaGrange, R. 1987. The measurement of fear of crime. Sociological
Inquiry 57, 70-101.
Ferraro, K. 1995. Fear of Crime: Interpreting Victimization Risk. Albany, NY: State
University of New York Press.
Ferraro, K. 1996. Women’s fear of victimization: Shadow of sexual assault. Social
Forces, 75, 667-690.
Fischer, P., Greitemeyer, T., Kastenmuller, A., Frey, D., & Oßwald, S. 2007. Terror
salience and punishment: Does terror salience induce threat to social order?
Journal of Experimental Social Psychology, 43, 964-971.
Fisher, B.S., & Sloan, J.J. III. 2003. Unraveling the fear of sexual victimization
among college women: Is the ‘shadow of sexual assault’ hypothesis
supported? Justice Quarterly, 20, 633-659.
Friedman, L.S. 2005. Terrorism. Farmington Hills, MI: Thompson Gale.
Gilchrist, E., Bannister, J., Ditton, J., & Farrall, S. 1998. Women and the fear of
crime: Challenging the accepted stereotype. British Journal of Criminology,
38, 283-98.

Predictors of Fear and Risk of Terrorism in a Rural State – May, Herbert, Cline and Nellis
20 | P a g e
Goodey, J. 1997. Boys don’t cry: Masculinities, fear of crime and fearlessness.
British Journal of Criminology, 37, 401-418.
Hale, C. 1996. Fear of crime: A review of the literature. International Review of
Victimology, 4, 79-150.
Haynie, D.L. 1998. The gender gap in fear of crime, 1973-1994: A methodological
approach. Criminal Justice Review, 23, 29-50.
Hirschkorn, P. 2007. New York Reduces 9/11 Death Toll by 40. New York: Cable
News Network New York Bureau. Retrieved 3/13/09 from
http://www.cnn.com/2003/US/Northeast/10/29/wtc.deaths/
Josiger, W.J. 2009. Fear factor: The impact of terrorism on public opinion. Paper
presented at the annual meeting of the International Sociological
Association’s Annual meetings, New York, NY.
Killias, M., & Clerici, C. 2000. Different measures of vulnerability in their relation to
different dimensions of fear and crime. British Journal of Criminology, 40,
437-450.
Knack, S., & White, J. 2000. Election-day registration and turnout inequality.
Political Behavior, 22, 29-44.
LaGrange, R.L., & Ferraro, K.F. 1989. Assessing age and gender differences in
perceived risk and fear of crime. Criminology, 27, 697-719.
Lane, J., & Meeker, J.W. 2003. Social disorganization perceptions, fear of gang
crime, and behavioral precautions among Whites, Latinos, and Vietnamese.
Journal of Criminal Justice, 32, 49-63.
Lane, J., Meeker, J.W., & Nellis, A. 2009. Perceived risk and fear of terrorism and
willingness to lose personal rights. Paper presented at the American Society of
Criminology Annual Meeting, Philadelphia, PA, November 6, 2009.
May, D.C. 1999. Scared kids, unattached kids, or peer pressure: Why do students
carry firearms to school? Youth and Society, 31, 100-127.
May, D.C. 2001a. Adolescent Fear of Crime, Perceptions of Risk, and Defensive
Behaviors: An Alternative Explanation of Violent Delinquency. Lewiston,
NY: Edwin Mellen Press.
May, D.C. 2001b. The effect of fear of sexual victimization on adolescent fear of
crime. Sociological Spectrum, 21, 141-174.
International Journal of Rural Criminology, Volume 1, Issue 1 (December), 2011
21 | P a g e
May, D.C., & Dunaway, R.G. 2000. Predictors of fear of criminal victimization at
school among adolescents. Sociological Spectrum, 20, 149-168.
Mesch, G.S. 2000. Perceptions of risk, lifestyle activities, and fear of crime. Deviant
Behavior, 21, 47-62.
Moore, D.E. 1999. Fear of Terrorism Affects Many American’s Plans for New Year
Celebration. Washington D.C.: Gallup. Retrieved March 14, 2009 from
http://www.gallup.com/poll/3379/Fear-Terrorism-Affects-Many-Americans-
Plans-New-Year-Celebration.aspx
National Victim Assistance Academy. 2002. National Victim Assistance Academy
Textbook- Chapter 2:9- Terrorism and Victim Assistance Issues. Retrieved
March 23, 2009 from
http://www.ojp.usdoj.gov/ovc/assist/nvaa2002/chapter22_9.html.
Nellis, A. 2007. How does the American public cope with terrorism-related
information? Unpublished doctoral dissertation. American University:
Washington, D.C.
Nellis, A. 2008. Fear of terrorism. In Kevin Borgeson (ed.) Domestic Terrorism (2008).
Boston: Jones and Bartlett Press.
Nellis, A. 2009. Gender differences in fear of terrorism. Journal of Contemporary
Criminal Justice 25, 322-340.
Parker, K.D., McMorris, B.J., Smith, E., & Murty, K.S. 1993. Fear of crime and the
likelihood of victimization: A bi-ethnic comparison. The Journal of Social
Psychology, 133, 723-732.
Rader, N.E., May, D.C., & Goodrum, S. 2007. An empirical assessment of the ‘threat
of victimization:’ Considering fear of crime, perceived risk, avoidance, and
defensive behaviors. Sociological Spectrum, 27, 475-505.
Saad, L. 2004. Three Years after 9/11, Most Americans Carrying on Normally.
Washington D.C.: Gallup. Retrieved March 14, 2009 from
http://www.gallup.com/poll/12991/Three-Years-After-911-Most-Americans-
Carrying-Normally.aspx
Schafer, J.A., Huebner, B., Bynum, T.S. 2006. Fear of crime and criminal
victimization: Gender-based contrasts. Journal of Criminal Justice, 34, 285-
301.

Predictors of Fear and Risk of Terrorism in a Rural State – May, Herbert, Cline and Nellis
22 | P a g e
Smith, B. 2008. A Look at Terrorist Behavior: How They Prepare, Where They
Strike. NIJ Journal, 2-6.
Smith, W.R., & Torstensson, M. 1997. Gender differences in risk perception and
neutralizing fear of crime. British Journal of Criminology, 37, 608-634.
Stanko, E.A. 1990. Everyday Violence. London: Pandora Press.
Stern, J. 2004. Fearing evil. Social Research, 71, 1111-1126.
Vasilenko, V.I. 2004. The concept and typology of terrorism. Statutes and
Decisions, 40, 46-56.
Victor S, J. 2006. Why the terrorism scare is a moral panic. The Humanist, 66, 9-12.
Warr, M. 1984. Fear of victimization: Why are women and the elderly more afraid?
Social Science Quarterly, 65, 681-702.
Warr, M. 1990. Dangerous situations: Social context and fear of victimization. Social
Forces, 68, 891-907.
Warr, M., & Ellison, C. 2000. Rethinking social reactions to crime: Personal and
altruistic fear in family households. American Journal of Sociology, 106(3),
551-578.
Warr, M., & Stafford, M. 1983. Fear of victimization: A look at the proximate
causes. Social Forces, 61, 1033-1043.
Wilcox, P., May, D.C., & Roberts, S.D. 2006. Student weapon possession and the
‘fear of victimization hypothesis;’ Unraveling the temporal order. Justice
Quarterly, 23, 502-529.


![A Tutorial - Knowledge Graph Construction from Text · 2018. 2. 5. · Tutorial Outline 1. Knowledge Graph Primer [Jay] 2. Knowledge Extraction from Text a. ... Entity resolution,](https://img.dokumen.tips/doc/110x75/6043d985afeeb677752343a6/a-tutorial-knowledge-graph-construction-from-text-2018-2-5-tutorial-outline.jpg)