Embed Size (px)
Citation preview

47
Part II Basic Principles
The fundamental physical principle underlying diag-nostic ultrasound as used in a number of medical disciplines is the generation of sound waves at fre-quencies above the range of human hearing (greater than 20,000 Hz or 20 KHz) by the vibration of a thin crystal stimulated by pulses of electric current. The waves of sound then propagate through a medium and are refl ected by tissue surfaces back to the rest-ing crystal that is then made to vibrate, generating electrical impulses that are amplifi ed and processed to show a pattern on an oscilloscope screen.
The following images were created in the 1970s using miles movie fi lm and then condensed into a fi lm of only a few minutes (Figs. 1 and 2 ). Pulsed sound is what is used in ophthalmology because the transducer not only sends out a pulse of focused sound, it also waits and listens for the returned echo signal, hence, the name pulser–receiver system. Each time the pulse of sound strikes an interface, some is refl ected back to be displayed and some goes on to deeper tissues, but with slightly less energy. These refl ections can also reverberate in between various structures and be changed by the surface shape and texture. The eye contains both fl at sheetlike structures such as membranes as well as curved ones such as the cornea, lens, and the globe itself. Some tissues are smooth which will better refl ect echoes than those with a rough tex-ture, like pigment cells on an anterior lens capsule, for example.
The history of ultrasound in ophthalmology is a relatively recent one. The principles of ultrasound were understood in the late 1800s and were utilized
to develop sonar for submarine warfare in World Wars I and II. During this time, industry adapted the technology for the detection of fl aws in materi-
Fig. 1 A pulsed sound beam emitted from the transducer at the top is perpendicular to multiple interfaces. Echoes are refl ected back in the same direction and are “heard” by the same transducer
Fig. 2 The sound beam is oblique to multiple interfaces. Echoes are produced but not heard by the transducer and are therefore not seen on display
This part contains video segments that can be found by accessing the following link: http://www.springerimages.com/videos/978-1-4614-7081-6 .

48
als. The fi rst paper describing the ocular use of the “refl ectoscope” by Mundt and Hughes appeared in the ophthalmic literature in 1956 [ 11 ]. They basi-cally described the use of the A-scan to image vari-ous ocular structures and abnormalities. An adaptation of the instrument was also used about this time to image gallstones in a patient with cholelithiasis.
Diagnostic echography now has widespread application in medicine, mainly in the specialties of obstetrics and gynecology, cardiovascular disease, peripheral vascular disease, gastroenterology, neu-rology, and urology. The frequencies used for non- ophthalmic organ systems usually are in the range of 3–5 MHz to allow deep penetration into such areas of the body as the abdomen. Higher frequen-cies than this provide better resolution but poor penetration into the depths required for the exami-nation of most organ systems. The resolution pos-sible in the examination of the eye is much higher than in other parts of the body. The globe is mostly a fl uid-fi lled structure that is ideal for the propaga-tion of ultrasound. The 8–10-MHz frequencies used mostly for the examination of the posterior segment resolves structures as small as 0.10 mm. The 50-MHz ultrasound biomicroscope (UBM) probe used for anterior segment scans enables reso-lution on the micron scale (less than 40 μm). Such imaging capability allows the diagnosis of lesions on almost a histopathologic level and is refl ected in the 99.7 % diagnostic accuracy for choroidal mela-noma as reported in the Collaborative Ocular Melanoma Study (COMS).
Ophthalmic echography has advantages over other imaging techniques in the clinical practice of ophthalmology. An instrument that is readily avail-able, portable, and cost-effective and provides rapid and accurate diagnosis of intraocular and orbital pathology can be an invaluable aid to the practicing clinician.
The diagnostic A-scan probe (Fig. 3 ) has a wafer-thin ceramic crystal near the tip that is stimulated by bursts of electric current to vibrate at a frequency of 8 MHz (eight million cycles per second). The crystal converts this electrical energy into sound energy, and then the same crystal receives the refl ected sound waves. Its mechanical vibrations are converted to an electric current. This is called the piezoelectric effect, where the same crystal acts as sender and receiver of sound. The transducer
transmits sound waves for about 4 % of the time. Its vibrations are then damped, and it receives the refl ected sound waves for the remaining 96 % of the time. The returning sound wave is amplifi ed and displayed on a screen as vertical lines of vari-ous heights. The amplitude of each spike is related to the strength of the refl ection from tissue inter-faces from which it is refl ected.
The B-scan probe (Fig. 4 ) uses a transducer simi-lar to that of an A probe, but it sweeps back and forth at a rate of 10–25 oscillations per second. It generates sound waves at a frequency of from 10 to 20 MHz (10–20 million cycles per second). The returning echoes are processed to display bright dots on a screen which are combined to generate an image. This generates a series of echoes that are processed like pixels on a computer screen to generate an image. The brightness of the image is correlated to the strength of the sound refl ection corresponding to the height of the vertical spike
Fig. 3 A-scan probe
Fig. 4 B-scan probe
Part II. Basic Principles

49
on the A-scan image. Current generation B-scan probes are sealed and oil fi lled, unlike previous versions that had to be injected with distilled water before each use.
Most ophthalmologic ultrasound units are sold primarily for the B-scan capability. Practitioners are generally most comfortable with B-scan images because of the recognizable topography displayed on the screen, as opposed to the unfamiliar vertical spikes of the A-scan. This is especially true for a generation familiar with the imaging capabilities of CT and MRI scans. These modalities “cut” radio-logic sections through structures, and the medically trained mind is comfortable mentally reconstruct-ing the entire lesion from a compilation of these slices. Three-dimensional (3D) imaging is evolving that does such reconstruction with computer graph-ics, but most CT scans are currently displayed as a series of tissue slices. The ultrasound B-scan is based on the same principle of image processing, although by acoustic instead of radiologic section-ing. An A-scan acts more like penetrating tissue with a needle to take a “core” sample for biopsy versus “slicing” sections of the tissue with the B-scan.
An example of the A- versus B-scan dichotomy is the familiar mushroom shape of a choroidal mel-anoma as it breaks through Bruch’s membrane that is immediately evident to the untrained eye on the B-scan but displays only a series of vertical internal spikes on the A-scan (Fig. 5 ). However, the diag-nostic information contained in all of those “danc-ing” lines on the A-scan is the major reason for the 99.7 % accuracy of the diagnosis of melanomas reported in the recently completed COMS study.
Karl Ossoinig pioneered the concept of standard-ized echography and much of his work concentrated on the A-scan. His criteria for the characterization of numerous intraocular and orbital lesions are based on the use of a standardized A-scan tech-nique, including an S-shaped amplifi er in the unit that combines features of linear and logarithmic amplifi ers. An examiner cannot take the criteria he developed and use them successfully to diagnose pathology unless an A-scan is used based on these principles. There are several units produced that utilize separate A- and B-scan probes that can be reliably used to evaluate lesions based on the crite-ria of Ossoinig. Several companies produce excel-lent ophthalmic ultrasound units that are modular in
design with the option to add features to the basic unit as need and budgets allow. It is highly advanta-geous to have separate diagnostic A- and B-scan probes with individual signal processors.
The A-scan displays the refl ected signals as vertical lines. It is like freezing the B-scan trans-ducer so it does not oscillate and recoding the sig-nals from that point as a line instead of a grayscale dot. The height of the vertical line is a function of the refl ectivity of the interface as is the brightness of the B-scan dot. The physical basis for the inten-sity of the refl ected signal is impedance. The equa-tion Z (impedance) = sound velocity ( v ) × tissue density ( d ) describes the physical basis for ultra-sound refl ection from the interface between tissues. The greater the difference in impedance between two different media, the higher the A-scan spike or the brighter the B-scan dot. The result of this prin-ciple is that there is greater refl ection of sound waves when they are travelling through tissue at a
Fig. 5 Top : A-scan of malignant melanoma of the cho-roid ( arrows ). Bottom : B-scan of the tumor ( arrow )
Part II. Basic Principles
50
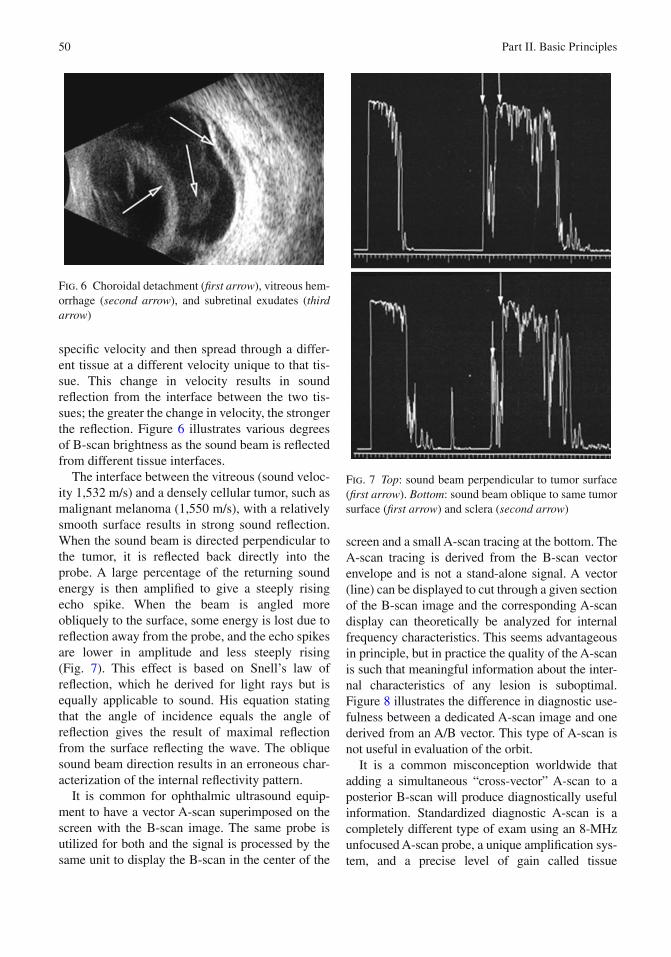
specifi c velocity and then spread through a differ-ent tissue at a different velocity unique to that tis-sue. This change in velocity results in sound refl ection from the interface between the two tis-sues; the greater the change in velocity, the stronger the refl ection. Figure 6 illustrates various degrees of B-scan brightness as the sound beam is refl ected from different tissue interfaces.
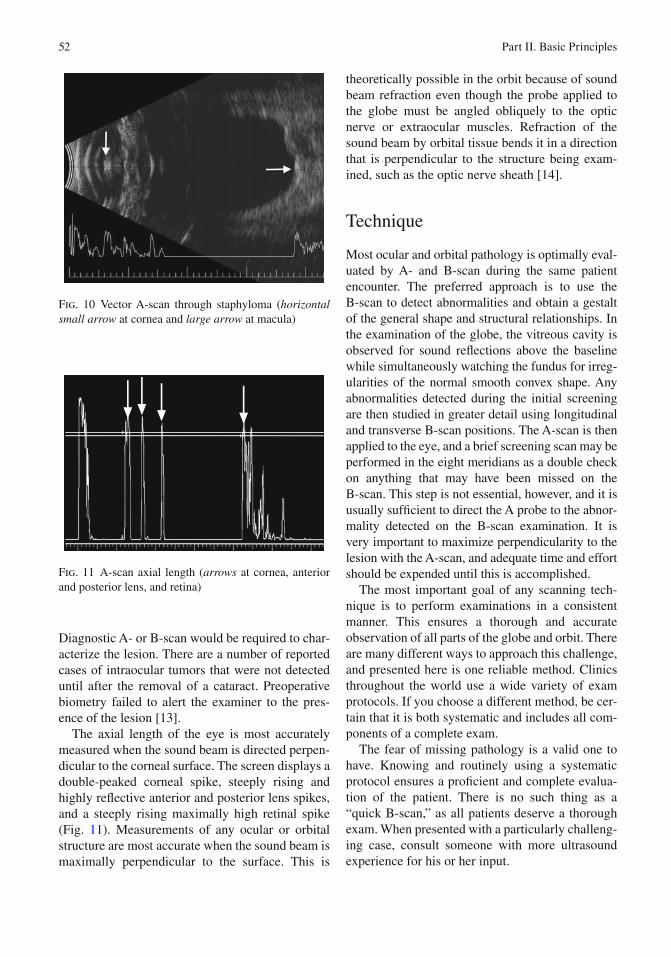
The interface between the vitreous (sound veloc-ity 1,532 m/s) and a densely cellular tumor, such as malignant melanoma (1,550 m/s), with a relatively smooth surface results in strong sound refl ection. When the sound beam is directed perpendicular to the tumor, it is refl ected back directly into the probe. A large percentage of the returning sound energy is then amplifi ed to give a steeply rising echo spike. When the beam is angled more obliquely to the surface, some energy is lost due to refl ection away from the probe, and the echo spikes are lower in amplitude and less steeply rising (Fig. 7 ). This effect is based on Snell’s law of refl ection, which he derived for light rays but is equally applicable to sound. His equation stating that the angle of incidence equals the angle of refl ection gives the result of maximal refl ection from the surface refl ecting the wave. The oblique sound beam direction results in an erroneous char-acterization of the internal refl ectivity pattern.
It is common for ophthalmic ultrasound equip-ment to have a vector A-scan superimposed on the screen with the B-scan image. The same probe is utilized for both and the signal is processed by the same unit to display the B-scan in the center of the
screen and a small A-scan tracing at the bottom. The A-scan tracing is derived from the B-scan vector envelope and is not a stand-alone signal. A vector (line) can be displayed to cut through a given section of the B-scan image and the corresponding A-scan display can theoretically be analyzed for internal frequency characteristics. This seems advantageous in principle, but in practice the quality of the A-scan is such that meaningful information about the inter-nal characteristics of any lesion is suboptimal. Figure 8 illustrates the difference in diagnostic use-fulness between a dedicated A-scan image and one derived from an A/B vector. This type of A-scan is not useful in evaluation of the orbit.
It is a common misconception worldwide that adding a simultaneous “cross-vector” A-scan to a posterior B-scan will produce diagnostically useful information. Standardized diagnostic A-scan is a completely different type of exam using an 8-MHz unfocused A-scan probe, a unique amplifi cation sys-tem, and a precise level of gain called tissue
Fig. 7 Top : sound beam perpendicular to tumor surface ( fi rst arrow ). Bottom : sound beam oblique to same tumor surface ( fi rst arrow ) and sclera ( second arrow )
Fig. 6 Choroidal detachment ( fi rst arrow ), vitreous hem-orrhage ( second arrow ), and subretinal exudates ( third arrow )
Part II. Basic Principles

51
sensitivity used for each and every patient to ensure consistency. Therefore, the vector A-scan produced from a 10 to 12-MHz focused posterior B-scan probe is not considered diagnostic (Fig. 9 ). The incorrect belief is that an unknown membrane (e.g., posterior hyaloid with adherent blood cells or a retinal detach-ment) may be evaluated by adding the vector A-scan. The thought is that seeing a tall echo indicates a reti-nal detachment. Unfortunately, this is not the case. Inconsistent gain levels can make a PVD with hem-orrhage appear as bright as a retina, especially poste-riorly. Similarly, high gain can make a melanoma’s vector A-scan have high internal refl ectivity and look like a hemangioma, whereas low gain could make a hemangioma have low internal refl ectivity and look like a melanoma. Cross-vector A-scan should not be used for tissue characterization. That is the realm of standardized diagnostic A-scan.
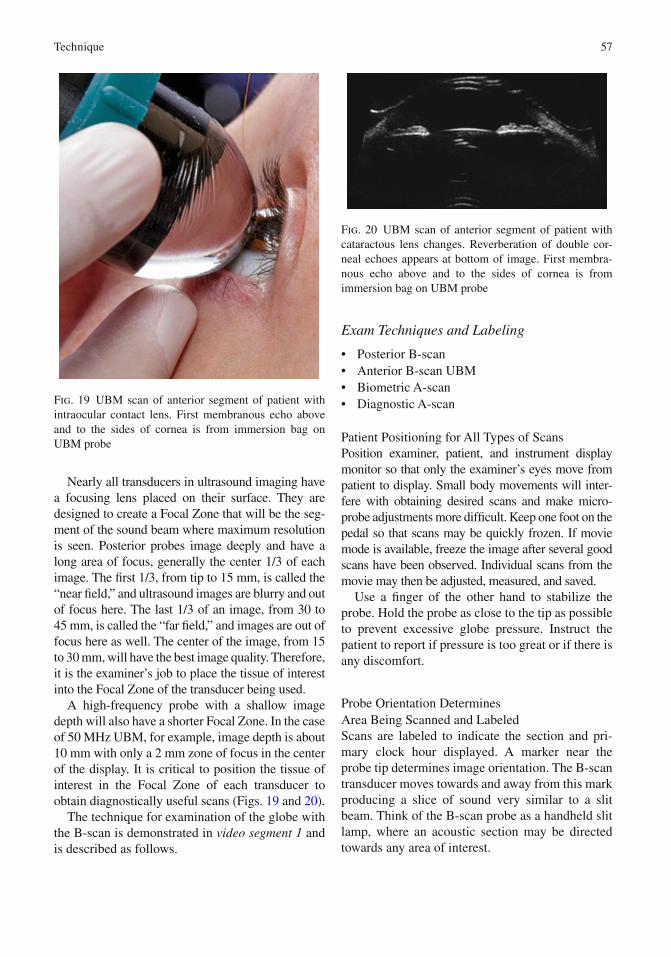
One possible exception to the disadvantage of a superimposed vector A-scan is its use in measuring the axial length of an eye with a posterior staphy-loma. It is diffi cult to be certain that the sound beam of an A-scan biometer is congruent with the fovea on the sloping side of a staphyloma. However, with a combined A- and B-scan unit, the B-scan can be used to image the macula and then the vector A-scan superimposed on it (Fig. 10 ). Roldivar states that the accuracy of this technique is ques-tionable as the fovea’s location in the depths of the staphyloma is diffi cult to determine exactly [ 12 ]. Experienced echographers feel that by aligning the beam with the double-peaked cornea, anterior and posterior lens, and retina spikes, a reasonable esti-mate of the anatomic axial length can be obtained. In addition, many A-scan biometry probes have a fi xation light in the tip that enables the measure-ment of the true visual axis in those patients capa-ble of fi xation on the light.
A-scan biometry units utilize probes optimally focused for measuring from the anterior corneal surface to the retinal surface. Such a probe could detect an abnormality such as a tumor only if a sys-tematic examination of the eye was performed. The standard axial measurement of the globe could only display a lesion such as a tumor if it were large and in the area of the macula. Such pathology would usually result in diffi culty in obtaining axial mea-surements and not be diagnostic of a tumor.
Fig. 8 Top : B-scan with superimposed vector A-scan of choroidal melanoma ( vertical arrows ). Bottom : standard-ized A-scan of the same tumor demonstrating typical internal refl ectivity ( vertical arrows )
Fig. 9 Simultaneous cross-vector A-scan through a retained lens fragment shows medium-to- high refl ectivity but is not considered diagnostic. A-scan amplitude can be misleading because of gain value and amplifi er characteristics
Part II. Basic Principles
52
Diagnostic A- or B-scan would be required to char-acterize the lesion. There are a number of reported cases of intraocular tumors that were not detected until after the removal of a cataract. Preoperative biometry failed to alert the examiner to the pres-ence of the lesion [ 13 ].
The axial length of the eye is most accurately measured when the sound beam is directed perpen-dicular to the corneal surface. The screen displays a double-peaked corneal spike, steeply rising and highly refl ective anterior and posterior lens spikes, and a steeply rising maximally high retinal spike (Fig. 11 ). Measurements of any ocular or orbital structure are most accurate when the sound beam is maximally perpendicular to the surface. This is
theoretically possible in the orbit because of sound beam refraction even though the probe applied to the globe must be angled obliquely to the optic nerve or extraocular muscles. Refraction of the sound beam by orbital tissue bends it in a direction that is perpendicular to the structure being exam-ined, such as the optic nerve sheath [ 14 ].
Technique
Most ocular and orbital pathology is optimally eval-uated by A- and B-scan during the same patient encounter. The preferred approach is to use the B-scan to detect abnormalities and obtain a gestalt of the general shape and structural relationships. In the examination of the globe, the vitreous cavity is observed for sound refl ections above the baseline while simultaneously watching the fundus for irreg-ularities of the normal smooth convex shape. Any abnormalities detected during the initial screening are then studied in greater detail using longitudinal and transverse B-scan positions. The A-scan is then applied to the eye, and a brief screening scan may be performed in the eight meridians as a double check on anything that may have been missed on the B-scan. This step is not essential, however, and it is usually suffi cient to direct the A probe to the abnor-mality detected on the B-scan examination. It is very important to maximize perpendicularity to the lesion with the A-scan, and adequate time and effort should be expended until this is accomplished.
The most important goal of any scanning tech-nique is to perform examinations in a consistent manner. This ensures a thorough and accurate observation of all parts of the globe and orbit. There are many different ways to approach this challenge, and presented here is one reliable method. Clinics throughout the world use a wide variety of exam protocols. If you choose a different method, be cer-tain that it is both systematic and includes all com-ponents of a complete exam.
The fear of missing pathology is a valid one to have. Knowing and routinely using a systematic protocol ensures a profi cient and complete evalua-tion of the patient. There is no such thing as a “quick B-scan,” as all patients deserve a thorough exam. When presented with a particularly challeng-ing case, consult someone with more ultrasound experience for his or her input.
Fig. 10 Vector A-scan through staphyloma ( horizontal small arrow at cornea and large arrow at macula)
Fig. 11 A-scan axial length ( arrows at cornea, anterior and posterior lens, and retina)
Part II. Basic Principles

53
When available, attend B-scan courses and lectures, and watch training videos on the Internet to fi nd new ideas and learn from interesting case studies such as are found in this book. Lastly, whenever possible, examine patients with clear media known pathology, such as PVD, RD, PFV, tear, hemorrhage, asteroid hyalosis, and elevated nevus. Start with a visual knowledge of pathology and its location. Then develop a plan for which probe positions and eye movements are needed to produce diagnostically useful images.
Technology continues to evolve in this important medical fi eld with improvements in transducer design, image quality, and software that require ongoing education. There is no end to learning about ultrasound imaging; even after decades, we often see something new and always learn from the experience.
Some basic principles of ultrasound imaging include the following:
Ultrasound Does Not Travel Through Air
Air is a 100 % refl ector of sound. No image is pro-duced at all if an obstructing bubble is large enough. Small bubbles or poor probe contact with the eye will affect a portion of an image. Interference from air is most likely when a bubble is inside the probe. This could occur if the probe tip membrane has been damaged, allowing fl uid around the transducer to leak out. A second source of air in the sound’s path-way is the coupling medium between probe and globe surface or skin of the eyelids in special cases of recent surgery or trauma. Artifi cial tear gel is the preferred coupling medium and is applied to the probe tip prior to exam and added as needed. Do not use abdominal ultrasound gel because it is toxic to the eye. Thirdly, there could be air inside an eye, as in the case of a pneumatic retinopexy. An ultrasound exam in these cases is severely limited. In a penetrat-ing trauma, a small air bubble may be misinterpreted as a foreign body due to its strong refl ectivity, pro-ducing a bright white dot on B-scan (Fig. 12 ).
Ultrasound Beams Must Be Perpendicular to Tissue for Maximum Refl ection
Similar to light refl ection, when sound encounters tissue in a perpendicular direction, the maximum
refl ection of sound will be produced. The “B” in B-scan stands for brightness because echoes are displayed as dots on a screen with intensities varying from black to white. Images, whether white, black, or some level of gray, contain maxi-mum clinical data when the sound beam is perpen-dicular to an interface between two different tissues. An oblique beam will produce a less clear, there-fore less diagnostic image, and in some cases ren-der the tissue invisible. The “A” in A-scan stands for amplitude because echoes are displayed as tall, short, and of various heights.
When a gray membranous structure is seen, ask two questions: is it gray because the tissue is really a low-refl ective PVD, or is it gray because it is really an RD and the sound beam is not perpen-dicular? When the membrane is bright white ask: is it white because it really is a highly refl ective retinal detachment, or is it white because it is a PVD with adherent blood cells and the gain is high?
Echoes Are Produced when Sound Beams Cross a Tissue Interface
When the sound beam is perpendicular to an inter-face between two different tissues, a refl ection (echo) is produced. The greater the difference between these tissues at the interface, the stronger the echo will be. For example, the difference between vitreous and retina is large, so a bright (B-scan) or tall (A-scan) echo is produced; how-ever, the difference between vitreous and a fresh hemorrhage is low, so the echoes produced are dim (B-scan) or short (A-scan).
Fig. 12 Residual gas bubble from a pneumatic retinopexy
Technique

54
Gain and Sensitivity
Gain is often called the volume control on an ultra-sound instrument. High gain is used to image small differences in tissues at an interface like fresh blood, infl ammatory cells, and fl oaters. Gain is also called sensitivity as in the tissue sensitivity, a spe-cifi c gain value used for standardized diagnostic A-scan exams. Turning down the gain will increase resolution as smaller echoes disappear. Low gain is useful in determining maculopathy and produces a clearer image of vitreoretinal traction and lesions. Lowering the gain will also improve imaging of foreign bodies and calcifi cation (Fig. 13 ). In evalu-ating papilledema, low gain makes optic nerve dru-sen stand out as a bright white spot. Adjust the gain throughout every exam as different areas and tis-sues are examined. Turning the gain up or down
does not change the amount of sound entering the eye; it only changes what strength of echo you choose to display at the moment.
Velocities and Measurements
Ultrasound travels at different speeds through dif-ferent tissues. Standard ocular velocities used to generate measurements in most instruments are:
1,550 m/s Average “soft tissue” (tumor measurements)
1,532 m/s Aqueous and vitreous
1,641 m/s Crystalline lens
1,000 m/s Average silicone oil (ranges from 986 to 1,040 depending upon viscosity)
The correct velocity must be used to obtain accu-rate measurements. Axial measurements are in the same direction as the sound beam, like the height of a tumor or an eye length. They are fundamentally based on a probe’s frequency and the electronic measurement tolerance of an instrument. However, lateral measurements, as in the base of a tumor, are inherently less accurate. This is because they are most directly affected by mechanical probe design as well as the electronic measurement tolerance of the instrument (Fig. 14 ).
There is one more very important factor that infl u-ences accuracy. That is the examiner’s profi ciency in placing each caliper. Particularly in B-scan,
Fig. 13 Top : calcifi ed optic nerve head drusen at full gain ( arrow ). Bottom : calcifi ed drusen at low gain in the same patient
Fig. 14 Choroidal tumor with indistinct lateral borders ( arrows )
Part II. Basic Principles

55
caliper position is subjective. Lowering gain and magnifying the image can help determine optimum caliper position. When following a lesion, always review scans from prior visits to confi rm caliper position and measurements to ensure consistency.
Also remember that there is a difference between precision and accuracy. Precision simply refers to obtaining the same value more than once. Accuracy is obtaining the correct value. A low standard devi-ation does not assure accuracy. Accuracy is only obtained as a result of measuring with optimal echo patterns, correct velocities, and correct caliper positions.
Artifacts Are Created by a Variety of Sources
Artifacts used to be called unwanted signals, but they are an excellent source of information. Shadowing is a complete absence of echoes behind a total refl ector of sound such as calcium, foreign body, or air. Different types of reverberation echoes can indicate what may have caused the extra echoes. For example, spherical and small foreign bodies create a comet’s tail reverberation artifact and are seen when imaging an IOL loop haptic in cross section.
Unique artifacts are seen when scanning a patient with silicone oil as a vitreous substitute. The retina is displayed far to the right making the eye appear extremely myopic. Also the globe shape is unusu-ally fl at. These two artifacts are caused by velocity and refraction. The velocity of sound through oil is 2/3 slower than vitreous, so the retina appears far-ther away. This is because our instruments use 1,550 m/s to generate an anatomically correct image of a normal eye and to calibrate the millime-ter ruler often seen on a display.
Silicone oil also refracts sound, causing an addi-tional distortion in globe shape. Another challenge with scanning these patients is when the oil has emulsifi ed. This makes imaging nearly impossible. The patient’s head position must also be considered because a small amount of sub-oil aqueous will be present. Since oil fl oats, a supine patient will dem-onstrate a very bright curved echo that may be mis-interpreted as retina. This strong echo is produced from the interface between the bottom of the bubble and the sub-oil aqueous (Fig. 15 ). Retina and orbital
signals are dim, even at high gain, due to oil’s absorption of sound. Even if the eye is able to pro-duce an image that shows an attached retina, there is no guarantee that it would not re-detach once oil is removed. Axial eye length measurements, to cal-culate IOL power once a cataract has formed, are also challenging. It is recommended to perform these scans in the older, contact method with the patient seated. This allows the oil to be against the macula and sub-oil aqueous to shift inferiorly and out of the way of the A-scan beam (Fig. 16 ). Eye length in these patients should be automatically measured after oil has been placed in order to be prepared when a cataract develops.
Transducer Frequency and Focusing Determine Image Depth and Resolution
The goal is to select the most appropriate probe for the tissue being imaged. To do this, the relationship between frequency, resolution, and image depth must be considered. As the probe’s transducer fre-quency increases, so does the resolution. But depth of penetration will decrease. Therefore, high fre-quencies produce higher resolution images than
Fig. 15 Patient supine: silicone oil distorts the image due to slower propagation velocity. When the patient is supine, oil fl oats up and sub-oil aqueous fi lls the space between the bottom of the oil bubble and the retina ( short arrow ). A second, large reverberation echo from the pos-terior lens capsule is seen mid-vitreous ( long arrow ). Total axial length appears abnormally long, over 30 mm, due to sound travelling slower in oil. The millimeter ruler is calibrated for 1,550 m/s and so cannot be used to esti-mate eye length
Technique

56
low frequencies. But high frequencies have more shallow imaging depth than low frequencies.
Posterior B-scan probes use a 10–12 MHz range for general globe/orbit imaging, whereas 20 MHz is used for retinal surface imaging. In the 10– 12 MHz range, B-scan systems can image to a depth of about 45 mm. A posterior 20 MHz probe will have better resolution but a more shallow depth of penetration where limited orbital echoes are seen (Figs. 17 and 18 ).
Probes for anterior segment B-scan, also called UBM for ultrasound biomicroscopy, range from 35 MHz to 70 MHz and higher. A 35 MHz probe can routinely see the posterior lens capsule. A 50 MHz can often image the back of the lens, but since sound is absorbed by cataractous changes, it may be diffi cult to observe in some cases. 50 MHz is excellent for analysis of IOL position, iridocor-
neal angle, ciliary body, etc. Using a very high fre-quency (VHF) such as 70 MHz will produce excellent images of the iris and cornea but is too high to adequately and routinely visualize the cili-ary body.
Fig. 16 Seated: silicone oil distorts image due to slower propagation velocity. When patient is seated, oil fl oats up and sub-oil aqueous has shifted to the 6:00 equator region, allowing oil to contact the macula. A second, large reverberation echo from the posterior lens capsule is seen mid-vitreous in this horizontal axial (HAX) scan. Total length appears abnormally long, over 30 mm, due to sound travelling slower in oil. To measure vitreous cavity, place fi rst caliper on inner edge of posterior lens capsule and second caliper on presumed macula location, approximately 4–5 mm from center of optic nerve shadow. Probe marker is nasal, so top of screen is nasal, bottom is temporal, and macula appears below optic nerve shadow. Change velocity to approximately 1,000 m/s to obtain corrected vitreous cavity length. Add ACD and lens thickness from axial length A-scan to complete measurement (For more information, see “ Silicone oil-fi lled eyes ” in the Biometry section)
Fig. 17 Posterior 12 MHz provides good penetration depth for imaging both vitreous and orbit. A suspicious macular elevation ( arrow ) and PVD are seen in this lon-gitudinal macula scan. Optic nerve shadow is at the bot-tom and long section of lateral rectus muscle with inserting tendon is seen near top of display. Those two landmarks confi rm the acoustic section was directed through the macula
Fig. 18 The same patient as above imaged with posterior 20 MHz provides less penetration but much higher reso-lution, especially at the vitreoretinal interface where an ERM is clearly seen ( arrow ). Optic nerve insertion and lateral rectus inserting tendon also appear sharper, but orbital signals are signifi cantly reduced. A 20 MHz pos-terior B-scan is also very helpful to evaluate the choroid and sclera by providing more detail
Part II. Basic Principles
57
Nearly all transducers in ultrasound imaging have a focusing lens placed on their surface. They are designed to create a Focal Zone that will be the seg-ment of the sound beam where maximum resolution is seen. Posterior probes image deeply and have a long area of focus, generally the center 1/3 of each image. The fi rst 1/3, from tip to 15 mm, is called the “near fi eld,” and ultrasound images are blurry and out of focus here. The last 1/3 of an image, from 30 to 45 mm, is called the “far fi eld,” and images are out of focus here as well. The center of the image, from 15 to 30 mm, will have the best image quality. Therefore, it is the examiner’s job to place the tissue of interest into the Focal Zone of the transducer being used.
A high-frequency probe with a shallow image depth will also have a shorter Focal Zone. In the case of 50 MHz UBM, for example, image depth is about 10 mm with only a 2 mm zone of focus in the center of the display. It is critical to position the tissue of interest in the Focal Zone of each transducer to obtain diagnostically useful scans (Figs. 19 and 20 ).
The technique for examination of the globe with the B-scan is demonstrated in video segment 1 and is described as follows.
Exam Techniques and Labeling
• Posterior B-scan • Anterior B-scan UBM • Biometric A-scan • Diagnostic A-scan
Patient Positioning for All Types of Scans Position examiner, patient, and instrument display monitor so that only the examiner’s eyes move from patient to display. Small body movements will inter-fere with obtaining desired scans and make micro-probe adjustments more diffi cult. Keep one foot on the pedal so that scans may be quickly frozen. If movie mode is available, freeze the image after several good scans have been observed. Individual scans from the movie may then be adjusted, measured, and saved.
Use a fi nger of the other hand to stabilize the probe. Hold the probe as close to the tip as possible to prevent excessive globe pressure. Instruct the patient to report if pressure is too great or if there is any discomfort.
Probe Orientation Determines Area Being Scanned and Labeled Scans are labeled to indicate the section and pri-mary clock hour displayed. A marker near the probe tip determines image orientation. The B-scan transducer moves towards and away from this mark producing a slice of sound very similar to a slit beam. Think of the B-scan probe as a handheld slit lamp, where an acoustic section may be directed towards any area of interest.
Fig. 19 UBM scan of anterior segment of patient with intraocular contact lens. First membranous echo above and to the sides of cornea is from immersion bag on UBM probe
Fig. 20 UBM scan of anterior segment of patient with cataractous lens changes. Reverberation of double cor-neal echoes appears at bottom of image. First membra-nous echo above and to the sides of cornea is from immersion bag on UBM probe
Technique

58
In posterior B-scan, the probe marker indicates the top of the display (Fig. 21 ). In anterior B-scan UBM, it usually indicates the left of the display but in some instruments may indicate the right . It is critical to know where the mark on each probe is oriented. To confi rm, gently touch the probe mem-brane on the edge nearest the marker with a wet fi ngertip or small bead of tear gel. Observe move-ment on the top of display in posterior scans. Gently sliding a fi ngertip from the mark to the opposite side will display movement from top to bottom of the display.
For UBM probes that use a fl uid-fi lled bag, per-form an orientation test by touching the membrane on the same side as the marker (Fig. 22 ). Observe where on the display movement is seen. Most instru-ments orient the probe mark to the left side of the display, but some orient to the right. If using a scleral shell for exams, test orientation by fi lling a container with water, and then image a submerged fi ngertip or other small object to determine which side of the screen relates to the probe marker (Fig. 23 ).
Exam Techniques and Labeling
• Posterior B-scan • Anterior B-scan UBM • Biometric A-scan • Diagnostic A-scan
Patient Positioning for All Types of Scans Position examiner, patient, and instrument display monitor so that only the examiner’s eyes move from patient to display. Small body movements will inter-fere with obtaining desired scans and makes micro-probe adjustments more diffi cult. Keep one foot on the pedal so that scans may be quickly frozen. If movie mode is available, freeze the image after
Fig. 21 Posterior B-scan probe orientation marker indi-cates top of display
Fig. 22 Fluid-fi lled fi nger cot or tonometer pen cover is used to move tissue of interest farther from probe tip to be in the Focal Zone of transducer. Particularly useful for pediatric patients and to evaluate the anterior segment when UBM is not available
Part II. Basic Principles

59
several good scans have been observed. Individual scans from the movie may then be adjusted, mea-sured, and saved.
Use a fi nger of the other hand to stabilize the probe. Hold the probe as close to the tip as possible to prevent excessive globe pressure. Instruct the patient to report if pressure is too great or if there is any discomfort.
Posterior B-Scan
Components of a thorough exam:• Patient eye stationary, probe moves • Patient eye moves, probe stationary • Patient eye and probe both stationary • Systematic protocol and labeling for OD and OS
Patient Eye Stationary, Probe Moves
Begin each scan plane having the patient fi xate in a certain direction while the probe is moved to sweep the acoustic section through each aspect of the globe. Images that best represent normal structures or pathology are labeled and saved.
Patient Eye Moves, Probe Stationary
When a structure is identifi ed that may be mobile, hold the probe still and ask the patient to direct their gaze in a very specifi c way as outlined in the protocol described in section Exam techniques and labeling .
Patient Eye and Probe Both Stationary
When both patient and probe are stationary, it allows observation of blood fl ow in a tumor, detached choroid, or edematous macula. Convection currents from sub-hyaloid heme, post-vitrectomy heme, or infl ammatory cells are also observed.
Systematic Protocol and Labeling for OD and OS
A systematic protocol is a series of scans performed on each and every patient, with additional scans added as the pathology or special circumstances indicate. This ensures a complete exam of the globe and orbit. The original method of performing this protocol is as follows; however, some examiners perform scans in a different order. It is important only to be certain that all aspects of the globe and orbit are examined by performing a minimum num-ber of scans in a systematic way.
Holding the probe in certain ways allows three types of B-scan images to be produced (Figs. 24 , 25 , 26 , 27 , 28 , and 29 ): 1. Axial, a specifi c type of transverse 2. Transverse 3. Longitudinal (radial)
Transverse and longitudinal scans are used to obtain diagnostically useful images. Directing the sound beam around a crystalline lens is how most scans are performed. In this way, artifact echoes created by refractive properties of a lens are avoided. Sound and light waves are both affected by lenses. Only in axial scans is the sound pur-posely directed through the lens. Determination of retinal lesions in an axial scan is questionable due to peripheral pseudo-elevations, called Baum’s bumps, caused by the lens.
Transverse scans image more than one clock hour. They are labeled with the center clock hour followed by a notation of whether the scan was from near the optic nerve (P), between nerve and equator (PE), from the equator (E), or from ante-rior (A) with additional position indicators as needed.
Longitudinal scans image one clock hour at a time, from optic nerve, through equator, to ciliary body. Longitudinal is the most useful scan plane for documenting maculopathy, retinal tear, and the anterior-posterior extent of a lesion or membrane.
Fig. 23 Scleral shells of various diameters are fi lled with saline and used to perform UBM exams. They are also helpful when a posterior probe is used to examine the anterior segment
Posterior B-Scan

60
Systematic Protocol and Labeling for OD
Probe Position # 1 (OD) Horizontal Transverse of Superior Aspect with Probe Marker Nasal
• Patient looks superiorly and holds gaze. • The farther away from the probe the patient
looks, the more anterior periphery is imaged.
Fig. 24 Horizontal axial B-scan, probe marker is nasal. Image from this probe position produces a fundus scan through lens, optic nerve, and macula. The macula appears below nerve shadow on display and is labeled HAX (Photo courtesy of Byrne and Green [18)
Fig. 25 Plane of fundus imaged with horizontal axial probe orientation. This is same area of fundus imaged with initial horizontal scans of both superior and inferior aspects of globe but without the posterior lens echo (Photo courtesy of Byrne and Green [ 18 ])
Fig. 26 Transverse B-scan of several clock hours. In this case marker is superior, probe placed temporally at 9:00 to image nasal quadrant. This superonasal/inferonasal scan, from 1:00 to 5:00, has 3:00 in the center of the dis-play. Image from this probe position produces a fundus scan posterior to the equator and is labeled 3PE (Photo courtesy of Byrne and Green [ 18 ])
Fig. 27 Plane of fundus imaged with vertical transverse of nasal quadrant posterior to equator (Photo courtesy of Byrne and Green [ 18 ])
Part II. Basic Principles

61
• Probe is initially placed at 6:00 limbus directed posteriorly.
• Image the optic nerve shadow as starting place of every transverse scan.
• Probe is shifted on sclera in an arc inferiorly towards fornix maintaining globe contact.
• Sound beam is shifted from optic nerve then superiorly to the periphery.
• Top of screen is nasal, bottom of screen is tem-poral, and center of screen is 12:00.
• Scans are labeled 12P (posterior/optic nerve), 12E (equator), and 12A (anterior), with other notations made for positions such as 12 PE (closer to the optic nerve than to the equator) and 12 EP (closer to the equator than to the optic nerve).
• To observe movement, ask patient to look up and left as well as up and right.
Probe Position # 2 (OD) Vertical Transverse of Nasal Aspect with Probe Marker Superior
• Patient looks nasally and holds gaze. • The farther away from the probe the patient
looks, the more anterior periphery is imaged. • Probe is initially placed at 9:00 limbus and
directed posteriorly. • Image the optic nerve shadow as starting place
of every transverse scan. • Probe is shifted on sclera in an arc temporally
towards lateral canthus maintaining globe contact.
• Sound beam is shifted from optic nerve then nasally to the periphery.
• Top of screen is superior, bottom of screen is inferior, and center of screen is 3:00.
• Scans are labeled 3P (posterior/optic nerve), 3E (equator), and 3A (anterior), with other nota-tions made for positions such as 3PE (closer to the optic nerve than to the equator) and 3EP (closer to the equator than to the optic nerve).
• To observe movement, ask patient to look up and left as well as down and left.
Probe Position # 3 (OD) Horizontal Transverse of Inferior Aspect with Probe Marker Nasal
• Patient looks down and holds gaze. • The farther away from the probe the patient
looks, the more anterior periphery is imaged. • Probe is initially placed at 12:00 limbus directed
posteriorly. • Image the optic nerve shadow as starting place
of every transverse scan. • Probe is shifted on sclera in an arc superiorly
towards fornix maintaining globe contact. • Sound beam is shifted from optic nerve then
inferiorly to the periphery.
Fig. 28 Longitudinal B-scan images one clock hour from posterior to anterior. In this example, probe is placed temporally with marker directed towards 3:00. This position produces an image from optic nerve dis-played at bottom, through equator, to anterior periphery/ciliary body of 3:00. Image is labeled L3 (Photo courtesy of Byrne and Green [ 18 ])
Fig. 29 Plane of fundus imaged with longitudinal of 3:00 probe orientation (Photo courtesy of Byrne and Green [ 18 ])
Posterior B-Scan

62
• Top of screen is nasal, bottom of screen is tem-poral, and center of screen is 6:00.
• Scans are labeled 6P (posterior/optic nerve), 6E (equator), and 6A (anterior), with other nota-tions made for positions such as 6PE (closer to the optic nerve than to the equator) and 6EP (closer to the equator than to the optic nerve).
• To observe movement, ask patient to look down and left as well as down and right.
Probe Position # 4 (OD) Vertical Transverse of Temporal Aspect with Probe Marker Superior
• Patient looks temporally and holds gaze. • The farther away from the probe the patient
looks, the more anterior periphery is imaged. • Probe is initially placed at 3:00 limbus and
directed posteriorly. • In this gaze, patient’s optic nerve is shifted more
nasally than normal, so move probe slightly over cornea in order to locate nerve shadow.
• Image the optic nerve shadow as starting place of every transverse scan.
• Probe is shifted on sclera in an arc nasally towards medial canthus maintaining globe contact.
• Sound beam is shifted from optic nerve through macula, then temporally to the periphery.
• Top of screen is superior, bottom of screen is inferior, and center of screen is 9:00.
• Scans are labeled 9P (posterior/optic nerve), 9E (equator), and 9A (anterior), with other nota-tions made for positions such as 9PE (closer to the optic nerve than to the equator) and 9EP (closer to the equator than to the optic nerve).
• To observe movement, ask patient to look up and right as well as down and right.
Probe Position # 5 (OD) Longitudinal Macula
• A macula scan does not require such extreme gaze and is best imaged with the patient in a slightly temporal gaze.
• Turn probe 90°, marker pointed towards 9:00, and keep probe close to limbus.
• Image of optic nerve near bottom of screen and inserting tendon of lateral rectus muscle anterior to equator with macula centered in display.
• Top of screen is anterior periphery of 9:00; bot-tom of screen is the optic nerve with macula located just above the optic nerve shadow on display.
• Scan is labeled L9 MAC. • To observe movement, ask patient to look in pri-
mary gaze then back to the right.
Systematic Protocol and Labeling for OS
Probe Position # 1 (OS) Horizontal Transverse of Superior Aspect with Probe Marker Nasal
• Patient looks superiorly and holds gaze. • The farther away from the probe the patient
looks, the more anterior periphery is imaged. • Probe is initially placed at 6:00 limbus directed
posteriorly. • Image the optic nerve shadow as starting place
of every transverse scan. • Probe is shifted on sclera in an arc inferiorly
towards fornix to maintain contact with globe. • Sound beam is shifted from optic nerve then
superiorly to the periphery. • Top of screen is nasal, bottom of screen is tem-
poral, and center of screen is 12:00. • Scans are labeled 12P (posterior/optic nerve),
12E (equator), and 12A (anterior), with other notations made for positions such as 12 PE (closer to the optic nerve than to the equator) and 12 EP (closer to the equator than to the optic nerve).
• To observe movement, ask patient to look up and left as well as up and right.
Probe Position # 2 (OS) Vertical Transverse of Nasal Aspect with Probe Marker Superior
• Patient looks nasally and holds gaze. • The farther away from the probe the patient
looks, the more anterior periphery is imaged. • Probe is initially placed at 3:00 limbus and
directed posteriorly. • Image the optic nerve shadow as starting place
of every transverse scan. • Probe is shifted on sclera in an arc temporally
towards lateral canthus maintaining globe contact.
Part II. Basic Principles

63
• Sound beam is shifted from optic nerve then nasally to the periphery.
• Top of screen is superior, bottom of screen is inferior, and center of screen is 9:00.
• Scans are labeled 9P (posterior/optic nerve), 9E (equator), and 9A (anterior), with other nota-tions made for positions such as 9PE (closer to the optic nerve than to the equator) and 9EP (closer to the equator than to the optic nerve).
• To observe movement, ask patient to look up and left as well as down and left.
Probe Position # 3 (OS) Horizontal Transverse of Inferior Aspect with Probe Marker Nasal
• Patient looks down and holds gaze. • The farther away from the probe the patient
looks, the more anterior periphery is imaged. • Probe is initially placed at 12:00 limbus directed
posteriorly. • Image the optic nerve shadow as starting place
of every transverse scan. • Probe is shifted on sclera in an arc superiorly
towards fornix maintaining globe contact. • Sound beam is shifted from optic nerve through
macula, then inferiorly to the periphery. • Top of screen is nasal, bottom of screen is tem-
poral, and center of screen is 6:00. • Scans are labeled 6P (posterior/optic nerve),
6E (equator), and 6A (anterior), with other notations made for positions such as 6PE (closer to the optic nerve than to the equator) and 6EP (closer to the equator than to the optic nerve).
• To observe movement, ask patient to look down and left as well as down and right.
Probe Position # 4 (OS) Vertical Transverse of Temporal Aspect with Probe Marker Superior
• Patient looks temporally and holds gaze. • The farther away from the probe the patient
looks, the more anterior periphery is imaged. • Probe is initially placed at 9:00 limbus and
directed posteriorly. • In this gaze, patient’s optic nerve is shifted more
nasally than normal, so move probe slightly over cornea in order to locate nerve shadow.
• Image the optic nerve shadow as starting place of every transverse scan.
• Probe is shifted on sclera in an arc nasally towards medial canthus maintaining globe contact.
• Sound beam is shifted from optic nerve then nasally to the periphery.
• Top of screen is superior, bottom of screen is inferior, and center of screen is 3:00.
• Scans are labeled 3P (posterior/optic nerve), 3E (equator), and 3A (anterior), with other nota-tions made for positions such as 3PE (closer to the optic nerve than to the equator) and 3EP (closer to the equator than to the optic nerve).
• To observe movement, ask patient to look up and left as well as down and left.
Probe Position # 5 (OS) Longitudinal Macula
• A macula scan does not require such extreme gaze and is best imaged with the patient in a slightly temporal gaze.
• Turn probe 90°, marker pointed towards 3:00, and keep probe close to limbus.
• Image of optic nerve near bottom of screen and inserting tendon of lateral rectus muscle anterior to equator with macula centered in display.
• Top of screen is anterior periphery of 9:00; bot-tom of screen is the optic nerve with macula located just above the optic nerve shadow on display.
• Scan is labeled L3 MAC. • To observe movement, ask patient to look in pri-
mary gaze then back to the left.
Systematic Protocol and Labeling for Axial and Oblique Transverse Scans
Transverse Axial Scans with Probe Marker Nasal
An axial B-scan is performed with copious cou-pling gel between probe tip and corneal apex. Image will show a short double line representing anterior–posterior cornea, centered posterior lens capsule, and optic nerve shadow in one view. Standard positions are horizontal (HAX) and verti-cal (VAX). Because the probe marker is directed nasally in an HAX view, the macula will be just below the optic nerve shadow. Shift the probe in an
Posterior B-Scan

64
arc to the left and right in order to position the optic nerve shadow above center. The macula will then be centered in the scan.
In a VAX scan, the macula is not imaged. Oblique axial scans are used to document the relationship of pathology to the posterior lens capsule and optic nerve. These are labeled with the clock hour where the probe marker is directed. For example, a lesion is located at the 1:30 equator. With marker directed at 1:30, an axial scan is obtained and labeled 1:30 AX. The lesion will appear on the top half of the display. For lesions from 3:00 through 6:00 to 9:00, the probe marker is positioned as far up as possible. For example, for a lesion at 7:30, the probe marker is also at 1:30, and the pathology will appear on the bottom half of the display with lens and optic nerve centered. This scan is also labeled 1:30 AX.
Transverse Oblique Scans
When pathology extends through several clock hours, an oblique transverse is often needed to completely document lesion borders. For a lesion at 1:30 equator, place probe at the 7:30 limbus with marker as up as possible, in this case towards 11:30, and sweep from optic nerve to anterior to locate maximum lesion elevation. The lesion should be centered in the display that spans from 11:30 at top of screen to 3:30 at bottom of screen. Scan is labeled 1:30 E. As with axial scans, the probe marker is positioned as far up as possible, but no lens is seen. For a lesion at 7:30 equator, the probe is placed at 1:30 with marker at 9:30. Scan will image from 9:30 inferiorly to 5:30.
Many echographers also include four oblique transverse scans to their systematic protocol. The four oblique scans image superonasal, superotem-poral, inferonasal, and inferotemporal quadrants.
Systematic Protocol and Labeling for Longitudinal Scans
Longitudinal Scans for Membranes and Retinal Tears
This is the most powerful scan position for fi nding and documenting the anterior–posterior extent of mem-branes. Longitudinal scans demonstrate posterior attachment or detachment of a membrane, and follows it to the anterior periphery. This signifi cantly helps to differentiate posterior hyaloid with blood from retinal detachment. Choroidal detachments are clearly seen
inserting at the vascular arcades, not all the way back to the optic nerve as is seen with many retinal detach-ments. A PVD with heme will be brighter and thicker posteriorly where it attaches near the nerve but will be thinner and grayer out at the periphery where fewer cells are adherent to the hyaloid.
To create a longitudinal scan, have the patient look at the clock hour to be imaged, direct the probe marker towards that same clock hour, and place the probe on the opposite sclera near the limbus. Moving the probe in an arc closer to and farther from the cornea will center pathology in the dis-play. In order to observe membrane movement, have the patient look in primary gaze and then back to the clock hour of interest.
This is the only scan plane that permits visualiza-tion of peripheral retinal tears, often with vitreous seen attached to the fl ap. It is also extremely valu-able to evaluate vitreoretinal traction. A complete screening for tears and traction includes a mini-mum of 8 positions—L12:00, L1:30, L3:00, L4:30, L6:00, L7:30, L9:00, and L10:30. Examine all 12 clock hours if needed.
Longitudinal Scans for Lesions
This scan position documents the anterior–poste-rior extent of a lesion. From the earlier example of a lesion near the equator at 1:30, the transverse scan showed how many clock hours are involved. A lon-gitudinal scan will demonstrate the anterior–poste-rior dimension of pathology. It shows how close the posterior aspect of the lesion is to the optic nerve and how close the anterior aspect of the lesion is to the ciliary body. To create an L1:30 scan, have the patient look at 1:30, direct the probe marker towards 1:30, and place probe on opposite sclera near limbus at 7:30. Moving the probe in an arc closer to and far-ther from the cornea will center pathology in the dis-play for best resolution and measurements. Lower gain will reduce vitreous echoes, increase resolu-tion, and raise confi dence in caliper positioning.
Globe Versus Through-the-Lid Exams
Due to many factors, results from an exam with the probe placed on a closed upper lid will be compro-mised. There are times where through-the-lid exams are required, such as recent surgery or a challenging patient, but that is an exception. Closed lids prevent knowing direction of patient gaze. Patients already have diffi culty looking where needed with open
Part II. Basic Principles
65
eyes, for example. It is exceptionally diffi cult for a patient to properly look up and left with closed eyes. The lids, especially the upper, also attenuate an ultrasound signal reducing image quality. Also, it is impossible to image the superior periphery with a probe on the upper lid. In order to image superior peripheral retina when a through-the-lid exam is to be performed, have the patient look up with open eyes and place the probe on the lower lid.
For best image quality and assurance of a com-plete exam, instill topical anesthesia, place tear gel or 2.5 % methylcellulose on probe tip, and apply probe directly to the sclera. Axial scans are the only time a B-scan probe is on the corneal apex. If using methylcellulose, be certain to irrigate remaining gel from the eye to reduce irritation. It is not necessary to irrigate tear gel used as coupling medium from the eye.
3-Dimensional Thinking
A three-dimensional image of pathology is envi-sioned from the series of two-dimensional images observed. When thinking through what is seen on an image, ask these four questions: 1. In what direction was the patient looking? 2. In what direction was the probe’s orientation
marker? 3. Where on the globe was the probe placed: near
limbus, fornix, or canthus? 4. Where on the fundus was the acoustic section
directed: posterior, equatorial, or anterior? Answers to these questions are the foundation for
mapping intraocular and orbital structures as well as accurately labeling sonograms, also called echo-grams. There is no substitute for taking the time to logically think through each examination. Allocating the needed time to practice and learn builds confi -dence and diagnostic ability. Knowledge, combined with a thorough and systematic exam protocol, produces valuable information leading to earlier detections of subtle pathologies such as retinal tear, maculopathy, and minimally elevated lesions.
Anterior B-Scan (Using Posterior Probe)
The anterior segment of the eye from the pars plana forward can only be viewed echographically when some sort of immersion technique is used to move
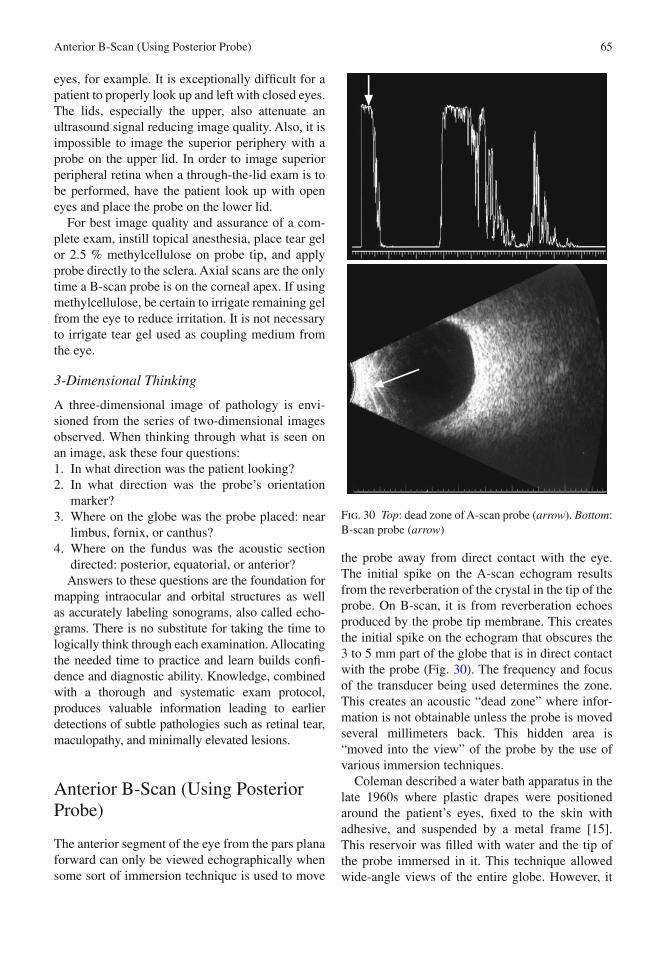
the probe away from direct contact with the eye. The initial spike on the A-scan echogram results from the reverberation of the crystal in the tip of the probe. On B-scan, it is from reverberation echoes produced by the probe tip membrane. This creates the initial spike on the echogram that obscures the 3 to 5 mm part of the globe that is in direct contact with the probe (Fig. 30 ). The frequency and focus of the transducer being used determines the zone. This creates an acoustic “dead zone” where infor-mation is not obtainable unless the probe is moved several millimeters back. This hidden area is “moved into the view” of the probe by the use of various immersion techniques.
Coleman described a water bath apparatus in the late 1960s where plastic drapes were positioned around the patient’s eyes, fi xed to the skin with adhesive, and suspended by a metal frame [ 15 ]. This reservoir was fi lled with water and the tip of the probe immersed in it. This technique allowed wide- angle views of the entire globe. However, it
Fig. 30 Top : dead zone of A-scan probe ( arrow ). Bottom : B-scan probe ( arrow )
Anterior B-Scan (Using Posterior Probe)

66
was logistically cumbersome, and many patients became claustrophobic during the examination. The contact B-scan pioneered by Bronson has gen-erally replaced this method [ 16 ]. However, the water bath technique continues to be used in a few centers specializing in ocular oncology.
A modifi cation of the water bath method has evolved with the development of various types of plastic shells. They fi t between the eyelids and are fi lled with a conducting medium such as methylcel-lulose, tear gel, or saline (Fig. 31 ).
The probe tip is placed within the shell, and this allows scanning of anterior structures. An alternate technique is to cut off the fi nger of a latex examina-tion glove and fi ll it with water. The B-scan probe is placed about 1 / 2 to 2 / 3 depth within the glove con-taining the liquid, and this creates an enclosed immersion chamber for examination of the anterior structures of the eye as the glove fi nger tip is placed in contact with the globe; because the probe itself is removed from the ocular surface, this part of the eye is moved out of the probe’s dead zone, allowing visualization of an otherwise inaccessible area. Biometric A-scan probes are built with the piezo-electric crystal directly on the tip just under the focusing lens. They may be used for both contact and immersion techniques.
Since most ophthalmic equipment was designed for adult-sized eyes, the ultrasound beams for pos-terior B-scan are set up to have the best image between 15 and 30 mm from the probe tip, where we expect to fi nd an adult eye’s vitreoretinal inter-face and where we need the best resolution to dif-ferentiate small retinal lesions.
Since pediatric patients generally have much smaller eyes, it requires a modifi ed exam technique.
This may be easily accomplished by placing a tonometer cover or fi nger cot fi lled with bubble- free water on the probe tip creating a water balloon (see Fig. 22 ). Use warmed drops, water, and coupling gel on babies and children who are awake to attain the best possible diagnostic information from the exam.
The use of a bag of fl uid on a probe is called a modifi ed immersion or fl uid standoff technique. It accomplishes the need to move the tissue of interest, mainly the vitreoretinal interface in a tiny eye, farther from the probe tip. This positions a pediatric retina in the Focal Zone of the transducer and will produce a useful, high-resolution image. The water- fi lled mem-brane will be seen on the screen prior to applying the probe to an eye. Fluid may be added or removed in order to accommodate the desired imaging depth.
Long before high-frequency probes were avail-able, anterior segment imaging was performed using this type of fl uid standoff or an immersion scleral shell. This allows the iris/ciliary body region to be placed far enough away from the probe, so tissue will be in the transducer’s Focal Zone. It served echographers well for two decades, but now a wide range of transducer frequencies are avail-able to meet the ever-expanding need to know more about ocular anatomy and pathology. This tech-nique is still used when UBM is not available.
Anterior UBM Examination
Components of a thorough exam:• Patient eye stationary, probe moves • Patient eye moves, probe stationary • Patient eye and probe both stationary • Systematic protocol and labeling for OD and OS
Patient Eye Stationary, Probe Moves
Most UBM exams are made with patient’s eye sta-tionary, while the probe is moved in order to obtain desired images. Movements with UBM probes are far more sensitive than with posterior B-scan. Echoes are very magnifi ed on the screen, and a steady hand is required.
Patient Eye Moves, Probe Stationary
In UBM exams, eye movement is usually not required in order to make a determination of pathology.
Fig. 31 Scleral shell for immersion scanning
Part II. Basic Principles
67
Patient Eye and Probe Both Stationary
An eye and probe stationary position is used to observe spontaneous movement such as pupil con-striction and dilation. It is also helpful in analyzing accommodative IOL movement where patient fi x-ates with the fellow eye on a near, then far target while a UBM movie is captured.
Systematic Protocol and Labeling for OD and OS
The protocol is similar to that of posterior B-scan exams with one big difference. In posterior B-scan, images are labeled opposite of probe placement because the area being examined is on the other side of the eye from the probe. In anterior B-scan, it must be noted that labeling is opposite. Scans are labeled by the clock hour where the probe is placed because images are produced from tissue directly beneath the probe. Placing a probe at 6:00 will image 6:00 and is labeled 6:00.
Longitudinal scans are obvious because the image shows the iridocorneal angle. Usually these scans are only labeled with the clock hour. Transverse UBM scans are similar to a gonio view of the angle and are useful to analyze iridociliary cysts and IOL haptic location. Horizontal axial UBM scans are used to measure the diameter of the ciliary sulcus for sizing of specialty lenses.
Biometric A-Scan
Axial eye length measurements are primarily made to calculate IOL power in a cataract patient. It is also important when calculating external beam radiation treatments of ocular tumors.
To obtain accurate eye length values interpreta-tion of four key elements is required: 1. Echo pattern 2. Eye type (velocities) 3. Caliper (gate) position 4. Correlation with patient visual history
A repeatable number with a low standard devia-tion may initially appear accurate, but if any one of the above 4 interpretations is not made, the patient could receive the wrong IOL and unfortu-nately many have. When in doubt, repeat all scans of eye length and corneal power. Remember that a
0.30- mm error in length produces approximately 1 diopter of postoperative error. Also a 1-diopter error in keratometry produces approximately 1 diopter of postoperative error. Small errors may cancel each other out but sometimes add up to cre-ate an even larger error. This is called tolerance stacking. Double- and triple-check preoperative data to ensure a predictable outcome.
Attend courses and request assistance from oth-ers, including an ultrasound manufacturer’s clinical applications specialist.
Echo Pattern
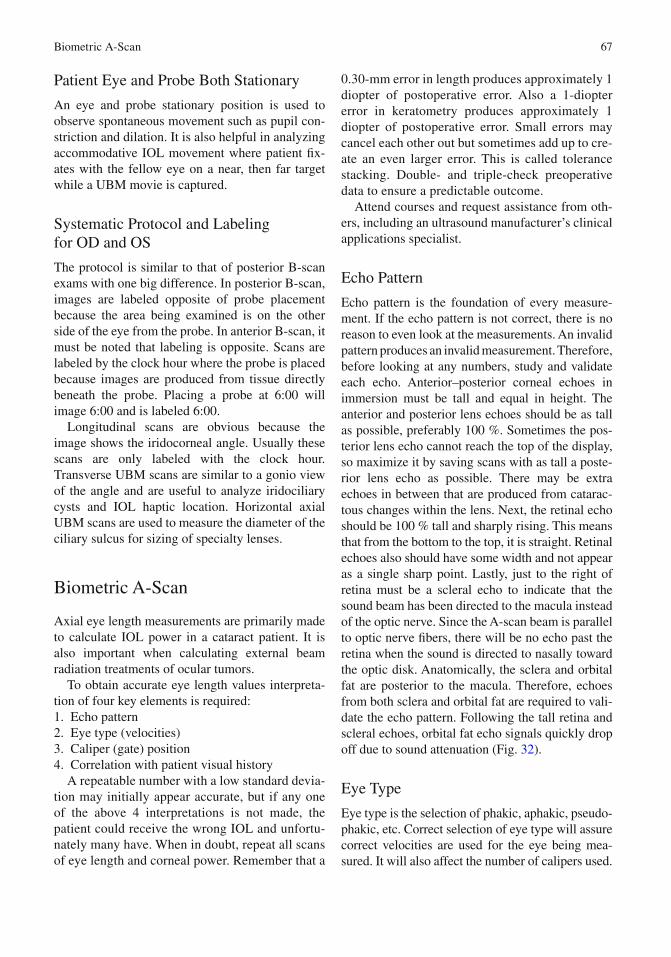
Echo pattern is the foundation of every measure-ment. If the echo pattern is not correct, there is no reason to even look at the measurements. An invalid pattern produces an invalid measurement. Therefore, before looking at any numbers, study and validate each echo. Anterior–posterior corneal echoes in immersion must be tall and equal in height. The anterior and posterior lens echoes should be as tall as possible, preferably 100 %. Sometimes the pos-terior lens echo cannot reach the top of the display, so maximize it by saving scans with as tall a poste-rior lens echo as possible. There may be extra echoes in between that are produced from catarac-tous changes within the lens. Next, the retinal echo should be 100 % tall and sharply rising. This means that from the bottom to the top, it is straight. Retinal echoes also should have some width and not appear as a single sharp point. Lastly, just to the right of retina must be a scleral echo to indicate that the sound beam has been directed to the macula instead of the optic nerve. Since the A-scan beam is parallel to optic nerve fi bers, there will be no echo past the retina when the sound is directed to nasally toward the optic disk. Anatomically, the sclera and orbital fat are posterior to the macula. Therefore, echoes from both sclera and orbital fat are required to vali-date the echo pattern. Following the tall retina and scleral echoes, orbital fat echo signals quickly drop off due to sound attenuation (Fig. 32 ).
Eye Type
Eye type is the selection of phakic, aphakic, pseudo-phakic, etc. Correct selection of eye type will assure correct velocities are used for the eye being mea-sured. It will also affect the number of calipers used.
Biometric A-Scan
68
Confi rm that the proper eye type has been selected for the patient. When performing pseudophakic scans where the IOL material is not known, save one scan using each of the options offered in the instru-ment, and then correlate with patient’s visual history and/or fellow eye measurements to confi rm. It is dif-fi cult to differentiate a silicone IOL from an acrylic IOL by their echo patterns, but PMMA lenses will produce many strong artifact echoes seen in the vit-reous space and are more easily identifi ed.
Caliper Position
Caliper position is critical. Validate each caliper as attached to the correct echo. Even with a perfect echo pattern, a 10-diopter error can occur if the cali-pers are set for contact A-scan when immersion technique is used. Another problem arises if the posterior lens caliper has mistakenly attached to an interior cataract echo or to a strong reverberation echo past the actual lens. Not only will lens thick-ness be incorrect, but the entire axial length is also compromised. This is because the lens has a differ-ent velocity than aqueous and vitreous, so unless each caliper is correct, the total length cannot be validated. Before saving an A-scan, fi rst confi rm correct echo pattern, caliper positions, and eye type.
Correlation with Patient History
Correlation with history is the fi nal analysis. If a patient is hyperopic, and their eye measures 21 mm,
that would makes sense, assuming they had normal Ks. Conversely, if the eye measures 25 mm and the patient is myopic, that also makes sense. If one eye has had a scleral buckle, we expect it to be longer than the fellow eye. Therefore, look at surgical his-tory, oldest known refraction before cataract devel-opment, and correlate eye length and keratometry values to be certain that everything makes sense for the patient (Figs. 33 , 34 , and 35 ).
ProbeTip
C A R S OrbitalFat
P
Fig. 32 Immersion axial eye length A-scan of a normal eye with primary echoes labeled. Probe tip; C, cornea; A, anterior lens capsule; P, posterior lens capsule; R, retina; S, sclera; and orbital fat. Anterior–posterior double-peaked corneal echoes are equal in height and tall, ante-rior and posterior lens echoes are tall, retina is sharply rising and has suffi cient thickness, sclera echo is also tall, and orbital fat echoes drop off
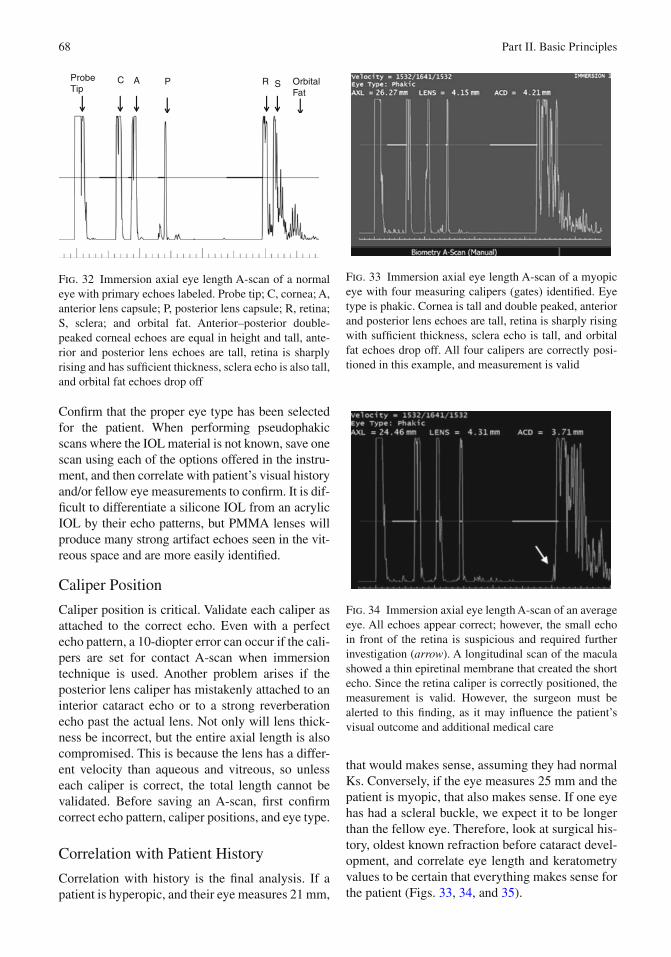
Fig. 33 Immersion axial eye length A-scan of a myopic eye with four measuring calipers (gates) identifi ed. Eye type is phakic. Cornea is tall and double peaked, anterior and posterior lens echoes are tall, retina is sharply rising with suffi cient thickness, sclera echo is tall, and orbital fat echoes drop off. All four calipers are correctly posi-tioned in this example, and measurement is valid
Fig. 34 Immersion axial eye length A-scan of an average eye. All echoes appear correct; however, the small echo in front of the retina is suspicious and required further investigation ( arrow ). A longitudinal scan of the macula showed a thin epiretinal membrane that created the short echo. Since the retina caliper is correctly positioned, the measurement is valid. However, the surgeon must be alerted to this fi nding, as it may infl uence the patient’s visual outcome and additional medical care
Part II. Basic Principles

69
When these four steps are routinely and carefully followed, the chance of a postoperative refractive error from an incorrect IOL calculation is signifi -cantly reduced.
Silicone Oil-Filled Eyes
Silicone oil-fi lled eyes are a challenge for ultra-sound. Modern instruments have an eye-type set-ting for oil, but that alone is not enough to assure an accurate measurement.
Today the standard of care for performing axial length measurements is the noncontact immersion technique. However, just as seen on previous B-scans examples of an eye fi lled with oil, there is a large difference between a supine and seated patient. When supine, as is usually the case with immersion A-scan and with B-scan, an oil bubble fl oats up against posterior lens, and there are a few millimeters of sub-oil aqueous between the bottom of the bubble and the retina. Immersion A-scan instruments will choose the fi rst tall echo in the vicinity of retina and that results in a false short value. This is because the retina caliper is attached to the bubble echo, not the actual retina that is a few mm further posterior on the scan. Often the
retinal echo is short due to sound attenuation that occurs when travelling through oil. Therefore, if an immersion scan is desired, separately measure sub-oil aqueous by changing eye type to aphakic. In aphakic mode, there are only two calipers and the velocity is correctly set to 1,532 m/s. Position one caliper on the bubble echo and the other on the real retinal echo. Add this amount to the total length obtained with the eye-type set for silicone oil. On average, the amount of sub-oil aqueous is 2.0–3.0 mm.
A second somewhat easier method may be to have the patient seated with his or her back straight and perform a contact A-scan. In a seated patient, the oil bubble has again shifted up, and sub-oil aqueous will be in the inferior aspect of the globe and out of the way of the central A-scan beam. The oil bubble is against the macula, so the strong echo interface between oil and retina will produce a reasonably accurate measurement. The obvious problem of corneal compression that occurs in contact A-scan methods will cause a shortening of the globe. On average, this is 0.30 mm or about 1 diopter of error. Lastly, major consideration has to be given when calculating IOL power if oil will remain in the eye or be removed at time of cataract extraction. If oil remains in the eye, the power needed is many diopters stronger. This is due to refractive prop-erties of silicone oil.
Special Considerations for Pediatric Patients
With axial eye length biometry, as with B-scan, care must be taken to assure proper measurements. Ultrasound instruments are designed for adult- sized eyes. In A-mode, the software will begin looking for a retinal signal about 20 mm from the cornea. Infants may have much smaller eyes, and retina caliper placement on the actual retina must be confi rmed. There have been cases where an incorrect IOL power was implanted due to using an adult retinal caliper position. The caliper was then positioned in the baby’s orbital fat echoes producing a false long axial length measurement. Carefully validating every echo, and its corre-sponding caliper, is the only way produce an accu-rate result. Pediatric immersion shells with very small diameters are available to accommodate small fi ssures.
Fig. 35 Immersion axial eye length A-scan of a long, myopic eye. Anterior segment echoes appear correct; however, the retina is suspiciously short and thin and required further investigation. A horizontal axial B-scan showed a staphyloma. Because the macula is on a slope, sound cannot be perpendicular and a correct retinal echo is not possible to obtain. One method to resolve this problem is to perform an HAX B-scan to measure the vitreous cavity. Place fi rst caliper on left edge of poste-rior lens echo and second caliper on the assumed macula. Assumed macula position is about 4–5 mm from the cen-ter of optic nerve shadow. Use a velocity of 1,532 m/s, and then add ACD plus lens thickness from the A-scan for a total axial length
Biometric A-Scan

70
Standardized A-Scan Examination
All of the published A-scan ultrasound criteria for the optimal differential diagnosis of an intraocular lesion are dependent upon useful information obtained from good echographic images. It is com-mon for beginning echographers to leap to diagnos-tic conclusions based on insuffi cient and inadequate information. The excitement of detecting a lesion and then recording A- and B-scan images of it can override the need for meticulous attention to detail. If the proper information is obtained while scan-ning and documenting the pathology, the differen-tial diagnosis follows logically. Just as in clinical examination of the eye by the slit lamp or ophthal-moscope, the echographer is best advised to not jump to a diagnosis based on initial cursory impres-sions, but to describe what is seen. The systematic description of a lesion includes the B-scan criteria of shape, location, and relation to intraocular struc-tures. The A-scan criteria are then added, including the characteristics of height, surface mobility, and the internal features of refl ectivity including regu-larity, spike height, and spontaneous vascularity as described by Ossoinig [ 17 ].
It is important to examine the eye and orbit in a systematic way. It is tempting to point the probe “where the action is,” such as at an enlarged lacri-mal gland or an intraocular tumor, but other pathology can be overlooked with such an approach. Both the globe and the orbit should be examined in a consistent and repetitive manner for each patient. Each examiner needs to ulti-mately decide which system is best for him/her,
but it should be standardized for each examination setting.
The technique for the diagnostic A-scan exami-nation is presented in video segment 2 .
The A-scan probe is held between the thumb and the forefi nger much like a pen is held when writing. In the examination of the globe, the display on the screen is continually watched as the probe is moved in small side-to-side and back-and-forth move-ments to display the retinal spike as steeply rising and as high as possible. This insures perpendicular-ity to the retina and allows for the detection of sub-tle abnormalities. This technique, as with any motor skill, will improve with practice. It is advisable to start with examination of the normal eye. The probe is placed so that the sound beam is directed perpen-dicular to the retina and the globe is systematically scanned in eight quadrants (45° sections), which results in a complete scan of the posterior segment. The gain for the A-scan is set at tissue sensitivity. This setting is available in several models of ultra-sound units. It requires the use of a “tissue model” supplied by the dealer with which to calibrate the A-scan probe for optimal sensitivity in scanning the globe for pathology. This probe calibration in com-bination with certain internal adjustments inside the unit before the unit leaves the factory is an important part of standardized echography as described by Ossoinig. Once a lesion is detected, the gain can be reduced for measuring purposes (Fig. 36 ), or it can be increased to demonstrate mild vitreous opacities, such as in early endophthalmitis (Fig. 37 ).
The probe at the 6:00 limbus is then slowly slid along the globe towards the inferior fornix of the lid while trying to keep it as perpendicular to the inner
Fig. 36 Left : A-scan of lesion ( vertical arrows ). Right : reduced gain for measuring ( vertical arrows )
Part II. Basic Principles

71
wall of the eye as possible. The screen is watched and slight adjustments are made with the hand to keep the retinal spike maximally high while the probe is moved posteriorly. This allows scanning of the fundus more and more anteriorly as the probe is moved. The limit of the scan is reached when the fundus signal starts to drop away and perpendicu-larity cannot be maintained as evidenced by a reti-nal spike that becomes lower in height and is jagged instead of steeply rising (Fig. 38 ).
This maneuver is then repeated every 1.5 clock hours around the globe. For example, it is moved from the 6:00 position to the 7:30 position on the limbus and moved posteriorly along the globe in this quadrant. It is then moved to the 9:00 position, the 10:30 position, and so on until it is back at the 6:00 position. This succession of probe positions will allow a complete scan of the globe except for its most anterior part beginning at the ciliary body.
A-scan of the orbit is performed at the orbit expansion as indicated by the designated settingon the instrument control panel. The examination of
the orbit by echography is the converse of the intra-ocular examination. Instead of watching for refl ec-tivity above the baseline level of the vitreous gel, the orbit is observed for refl ectivity lower than the adjacent high-refl ective orbital tissue. The normal orbit contains many different tissue interfaces because of the different structures present. These include orbital fat that has a septate microstructure, extraocular muscles, blood vessels, the optic nerve and its sheaths, and connective tissue. This multi-plicity of tissue interfaces results in strong refl ec-tion of the sound waves so that much of the normal orbit is highly refl ective with maximally high spikes on the A-scan and echodensity on the B-scan (Fig. 39 ).
The extraocular muscles are more homogenous in internal structure than the surrounding orbital tissue, so the echo refl ectivity becomes relatively lower (Fig. 40 ).
These muscles are best examined sequentially by A-scan in a transocular view. Placing the probe at the 6:00 limbus and directing it towards the supe-rior orbit image the superior rectus. It is aimed at
Fig. 37 A-scan of vitreous opacities ( vertical arrows ) demonstrating increased amplifi er gain of six decibels above the tissue sensitivity setting
Fig. 38 A-scan demonstrating the breakdown of signals towards the peripheral retina ( vertical arrow )
Fig. 39 Orbit ( arrows ) A- and B-scan
Standardized A-Scan Examination

72
the 12:00 position just behind the superior orbital rim and moved side to side and back and forth in small movements. When the refl ectivity begins to become lower than normal orbital tissue, the probe is kept in that same horizontal plane and angled posteriorly while attempting to display the anterior and posterior muscle sheaths by maximizing their height. The muscle is followed posteriorly until the two steeply rising maximally high spikes begin to drop off towards the apex of the orbit. The anterior tendinous part is imaged by angling the probe ante-riorly towards the orbital rim and watching the space between the two muscle sheaths that become narrower and closer to the globe (Fig. 41 ).
It is often diffi cult to visualize the tendon in a normal muscle, but demonstrating it is an important differential point in distinguishing infl ammatory myositis from other causes of muscle thickening, such as Graves’ disease. The tendon is usually thickened in myositis and not the other myopathies (Fig. 42 ).
The B-scan can be especially helpful in imaging the tendon near its attachment to the globe, whereas the tendon can “get lost” near the high refl ectivity of the sclera on the A-scan. The B-scan can image the extraocular muscles both in a longitudinal (long section) and in a transverse (cross section), as seen in Fig. 43 .
The gain should be reduced to increase the con-trast between the lesser echodensity of the muscle
Fig. 40 A-scan of extraocular muscle ( vertical arrows )
Fig. 41 A-scan of normal rectus muscle ( vertical arrows )
Fig. 42 Top : A-scan of normal rectus tendon ( arrow ). Middle : muscle in mid-orbit ( arrows ). Bottom : apex ( arrows )
Part II. Basic Principles
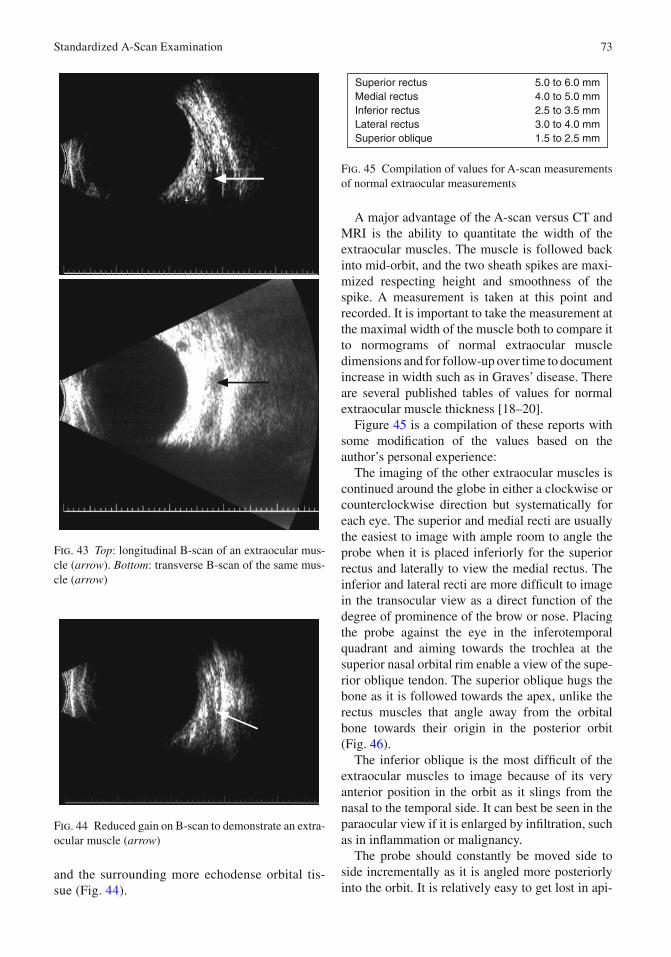
73
and the surrounding more echodense orbital tis-sue (Fig. 44 ).
A major advantage of the A-scan versus CT and MRI is the ability to quantitate the width of the extraocular muscles. The muscle is followed back into mid-orbit, and the two sheath spikes are maxi-mized respecting height and smoothness of the spike. A measurement is taken at this point and recorded. It is important to take the measurement at the maximal width of the muscle both to compare it to normograms of normal extraocular muscle dimensions and for follow-up over time to document increase in width such as in Graves’ disease. There are several published tables of values for normal extraocular muscle thickness [ 18 – 20 ].
Figure 45 is a compilation of these reports with some modifi cation of the values based on the author’s personal experience:
The imaging of the other extraocular muscles is continued around the globe in either a clockwise or counterclockwise direction but systematically for each eye. The superior and medial recti are usually the easiest to image with ample room to angle the probe when it is placed inferiorly for the superior rectus and laterally to view the medial rectus. The inferior and lateral recti are more diffi cult to image in the transocular view as a direct function of the degree of prominence of the brow or nose. Placing the probe against the eye in the inferotemporal quadrant and aiming towards the trochlea at the superior nasal orbital rim enable a view of the supe-rior oblique tendon. The superior oblique hugs the bone as it is followed towards the apex, unlike the rectus muscles that angle away from the orbital bone towards their origin in the posterior orbit (Fig. 46 ).
The inferior oblique is the most diffi cult of the extraocular muscles to image because of its very anterior position in the orbit as it slings from the nasal to the temporal side. It can best be seen in the paraocular view if it is enlarged by infi ltration, such as in infl ammation or malignancy.
The probe should constantly be moved side to side incrementally as it is angled more posteriorly into the orbit. It is relatively easy to get lost in api-
Fig. 43 Top : longitudinal B-scan of an extraocular mus-cle ( arrow ). Bottom : transverse B-scan of the same mus-cle ( arrow )
Fig. 44 Reduced gain on B-scan to demonstrate an extra-ocular muscle ( arrow )
5.0 to 6.0 mm4.0 to 5.0 mm2.5 to 3.5 mm3.0 to 4.0 mm1.5 to 2.5 mm
Superior rectusMedial rectusInferior rectusLateral rectusSuperior oblique
Fig. 45 Compilation of values for A-scan measurements of normal extraocular measurements
Standardized A-Scan Examination

74
cal structures, such as the superior and inferior orbital fi ssures, and mistake nonmuscular tissues for the muscle being followed. To reorient oneself, the probe should be angled slightly anteriorly to confi rm the two high septal spikes bordering the relatively lower refl ective muscle. Once this is con-fi rmed, the probe is then directed posteriorly again while minimizing its lateral movement in an attempt to stay within the plane of the muscle.
Imaging the optic nerve requires the same con-stant probe “minimovements” as the nerve is fol-lowed from its exit behind the globe towards the optic foramen. The probe is fi rst placed on the tem-poral globe and directed towards the medial rectus muscle and medial orbital wall. The medial rectus is used as a reference point, and the optic nerve is seen lateral to it (closer to the globe on the screen). The steeply rising twin sheath spikes of the optic nerve are detected as the probe is angled up and down and side to side (Fig. 47 ).
The nerve is followed posteriorly until the sheath spikes drop away near the apex. The same orientation techniques applied to the extraocular muscles are used where the probe is angled posteriorly and slightly superiorly/inferiorly to insure that that the nerve is being imaged and not confused with adjacent
structures. The widest dimension of the nerve is found, and this location is selected to measure the sheath-to-sheath width.
The ease of imaging the optic nerve is highly dependent on how it curves as it goes through the orbit. In some patients, the nerve is seen almost as soon as the probe is placed on the temporal globe and is easily followed along its course posteriorly towards the apex. In others, it can be very diffi cult no matter how the probe is manipulated. In these patients, it is advisable to try placing the probe on the nasal globe and aiming it temporally. The nerve may be more easily seen from this position. If it is still diffi cult to image the nerve, the patient is asked to adduct or abduct the eye a little. This maneuver will sometimes rotate the nerve into a position where it is more readily seen.
It is important to examine the eye and orbit in a systematic way. It is tempting to point the probe “where the action is,” such as at an enlarged lacri-mal gland or an intraocular tumor, but other pathol-ogy can be overlooked with such an approach. Both the globe and the orbit should be examined in a consistent and repetitive manner for each patient. Each examiner needs to ultimately decide which system is best for her, but it should be standardized for each examination setting.
Fig. 46 A-scan of superior oblique muscle ( arrows )
Fig. 47 A-scan of normal optic nerve ( vertical arrows )
Part II. Basic Principles