Embed Size (px)
Citation preview

Supplementary Materials
ISPRS Journal of Photogrammetry and Remote SensingAccepted for Publication: 12 September 2017http://dx.doi.org/10.1016/j.isprsjprs.2017.09.008
Article Title
Monitoring Surface Urban Heat Island Formation in a Tropical Mountain City Using
Landsat Data (1987-2015)
Ronald C. Estoque a,*, Yuji Murayama b
a National Institute for Environmental Studies, 16-2 Onogawa, Tsukuba City, Ibaraki 305-8506, Japan
b Faculty of Life and Environmental Sciences, University of Tsukuba, 1-1-1 Tennodai, Tsukuba City, Ibaraki
305-8572, Japan
* Corresponding author (Email address: [email protected], [email protected])
Table S1. Land cover changes in the study area (1987-2015).
Land Cover
Area Changes
Hectare (ha) Percentage (%) 1987-2001 2001-2015 1987-20151987 2001 2015 1987 2001 2015 ha % ha % ha %
Impervious Surface 1288.4 3115.6 5667.7 4.9 11.9 21.7 1827.2 7.0 2552.0 9.8 4379.2 16.7
Green Space 1 13957.2 12662.1 11580.5 53.4 48.4 44.3 -1295.1 -5.0 -1081.6 -4.1 -2376.7 -9.1
Green Space 2 7780.1 6702.8 7042.1 29.8 25.6 26.9 -1077.3 -4.1 339.3 1.3 -738.0 -2.8
Bareland 2582.9 2979.3 794.4 9.9 11.4 3.0 396.4 1.5 -2184.8 -8.4 -1788.5 -6.8
Water 1.3 17.7 11.3 0.0 0.1 0.0 16.5 0.1 -6.5 0.0 10.0 0.0
Shadow 442.2 657.0 1051.0 1.7 2.5 4.0 214.8 0.8 394.0 1.5 608.9 2.3
Cloud 94.9 12.4 0.0 0.4 0.0 0.0 -82.4 -0.3 -12.4 0.0 -94.9 -0.4
Note: % is expressed relative to the whole landscape.
1

Table S2. Bivariate correlations (Pearson’s r) of the variables (N = 5929).
1987 Mean LST
Mean Aspect
Mean Elevation
Mean Hillshade
Mean Slope
Fraction of IS
Fraction of GS1
Mean LST 1
Mean Aspect -.268** 1
Mean Elevation -.303** -.063** 1
Mean Hillshade -.471** .600** -0.022 1
Mean Slope -.194** .027* -.216** -.124** 1
Fraction of IS .324** -0.010 .174** .038** -.342** 1
Fraction of GS1 -.426** .170** -.152** .287** .291** -.425** 1
2001 Mean LST
Mean Aspect
Mean Elevation
Mean Hillshade
Mean Slope
Fraction of IS
Fraction of GS1
Mean LST 1
Mean Aspect -.254** 1
Mean Elevation -.233** -.063** 1
Mean Hillshade -.454** .600** -0.022 1
Mean Slope -.380** .027* -.216** -.124** 1
Fraction of IS .541** 0.018 .232** .078** -.472** 1
Fraction of GS1 -.737** .124** -.145** .268** .395** -.568** 1
2015 Mean LST
Mean Aspect
Mean Elevation
Mean Hillshade
Mean Slope
Fraction of IS
Fraction of GS1
Mean LST 1
Mean Aspect -.196** 1
Mean Elevation -0.020 -.063** 1
Mean Hillshade -.381** .600** -0.022 1
Mean Slope -.485** .027* -.216** -.124** 1
Fraction of IS .670** .039** .254** .126** -.549** 1
Fraction of GS1 -.678** .071** -.238** .144** .373** -.654** 1
** Correlation is significant at the 0.01 level (2-tailed).
* Correlation is significant at the 0.05 level (2-tailed).
Note: ‘Mean Elevation’ was excluded in the OLS MLR analysis for the 2015 dataset due to its very low, insignificant correlation with ‘Mean LST’ (Section 2.7).
2
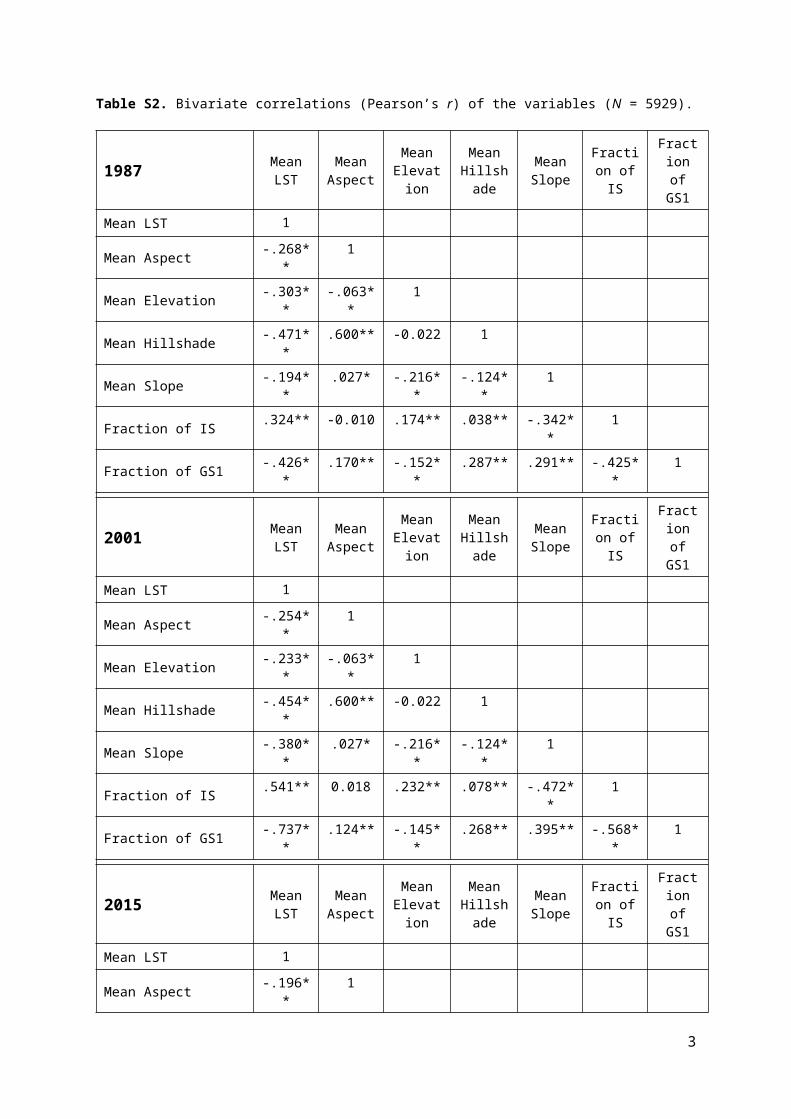
Fig. S1. Illustrations of the multi-directional UHI profiling method and the URZs used for measuring surface
UHI intensity (SUHII) along the urban-rural gradient based on the inter-buffer zone comparison method.
3

Fig. S2. Rasterized maps of the variables used in the OLS MLR and relative weight (RW) analyses based on the
analytical grid unit (210 m × 210 m).
4


![(35 B b) o O r I got rhythm] 77äV— -15- -F338-8506 ) -6103](https://img.dokumen.tips/doc/110x75/61aac70119672e458e27c307/35-b-b-o-o-r-i-got-rhythm-77v-15-f338-8506-6103.jpg)