Embed Size (px)
Citation preview

ARROW ENERGY GROUNDWATER MODELLING INFORMATION
October 2011

GROUNDWATER MODELLINGPRESENTATION SUMMARY
• What is groundwater modelling?
• What did the peer review say?
• What were the predictions from the model?
• What are we doing to understand more?
2

3

ObjectivesWhat are “groundwater models”?
What do we mean by: “conceptual model”
“water balance”
“numerical groundwater flow model”
Calibration
Prediction and uncertainty
4

First, a refresher… Groundwater occurs in pores and fractures in rock and
soil. Aquifers are layers that transmit groundwater, mainly
horizontally. Aquitards impede the movement of groundwater.
Flow in aquitards is mainly vertical. Groundwater flow is driven by differences in head,
which is a measure of potential energy The rate of flow of groundwater is controlled by
hydraulic conductivity, which can be different in different directions.
5

Shale (aquitard)
Alluvium
Aquifers, aquitards, pressure, head
Groundwater flows due to differences in “head”
water table elevation
piezometric head
6
Water tableWater table

What is a groundwater model?A “groundwater model” is a representation in
computer software of a regional scale hydrogeological system: based on a complete description of the natural
system (geometry, material properties, recharge etc.)
including proposed changes (e.g. pumping)with which we can predict water levels,
piezometric heads and flows in space and time
7

Purpose of modellingModelling is the only methodology that allows
us predict future behaviour
Models can have different levels of detail (“complexity”) To illustrate or explain
To predict potential environmental impacts
To predict short-term operational response (an “aquifer simulator”)
8

Stages in modelling1. Conceptual model Sketch how a hydrogeological system is believed to
work
2. Mathematical model Use equations to represent the physics of
groundwater flow
3. Numerical model Convert to a form suitable for computers
9

Conceptual model The first stage in understanding a
hydrogeological system is the development of a conceptual model Regional geology, including faults and shear zones
Layering, and hydrostratigraphy
Hydrogeological properties (Sy, S0, Kh, Kv)
Recharge, pumping, rivers, streams
Initial heads
10

Water balance numerical modelConsider a small volume of aquifer or aquitard:
Qin Qout
Qin
Qout Qin
Qout
Water balance allows us to compute
h(x,y,z,t) at any time

Calibration versus prediction Important distinction between simulating
the past and the future
12
PresentPast Future
Calibration: adjust parameters until simulated heads match historical observations
Prediction: simulate future behaviour

Calibration
13
Time series plot
Contour plot

Results of Peer Review
14
The conceptual hydrogeological model is supported by a detailed geological model
Some aspects of calibration are very good
Predicted impacts are of the right order of magnitude
Consistent with models developed by other CSG proponents
Model needs to evolve from an “impact assessment model” towards an “aquifer simulator”

Recommendations
15
Some aspects require further testing/refinement: Representation of regional faults
Representation of connections between key hydrostratigraphic units
Representation of recharge and evapotranspiration

SURAT GAS PROJECT EIS GROUNDWATER MODELLING
October 2011

ARROW ENERGYOVERVIEW
17
Scope of groundwater impact assessment
Key assumptions
Projected groundwater abstractions from Walloon Coal Measures
Modelled impacts of depressurisation
Proposed mitigation measures and studies

ARROW ENERGYSCOPE OF GROUNDWATER IMPACT ASSESSMENT
18
Develop a regionalgroundwater model based on most accurate data
Calibration to the best available data
Predict groundwater abstraction that simulates the operations of Arrow and other CSG proponents
To understand the resilience of groundwater systems and how they will recover
Area 120,000 km2 15 layers
1.8 million cells

ARROW ENERGYKEY ASSUMPTIONS
19
Deeper aquifers Comprise extensive thicknesses of
consolidated rock Mainly sub-artesian through project
study area Recharged through infiltration along
Great Dividing RangeCondamine Alluvium
Forms a surface unconfined aquifer in some parts of the basin
Recharged mainly from Condamine River seepage
Groundwater movement Movement of groundwater will occur
based upon the properties of the aquifers and aquitards.

ARROW ENERGYABSTRACTION VOLUMES
20
Groundwater abstraction from coal measures (Walloons)
Model development scenarios for proposed CSG projects
• Arrow only 25GL/yr
• Condamine 40~60 GL/yr “allocated”
• Walloons 7~13 GL/yr “allocated”
Aquifers influenced by multiple CSG projects.
Arrow Surat Gas Project only
Arrow , Origin, QGC & Santos Projects (cumulative)

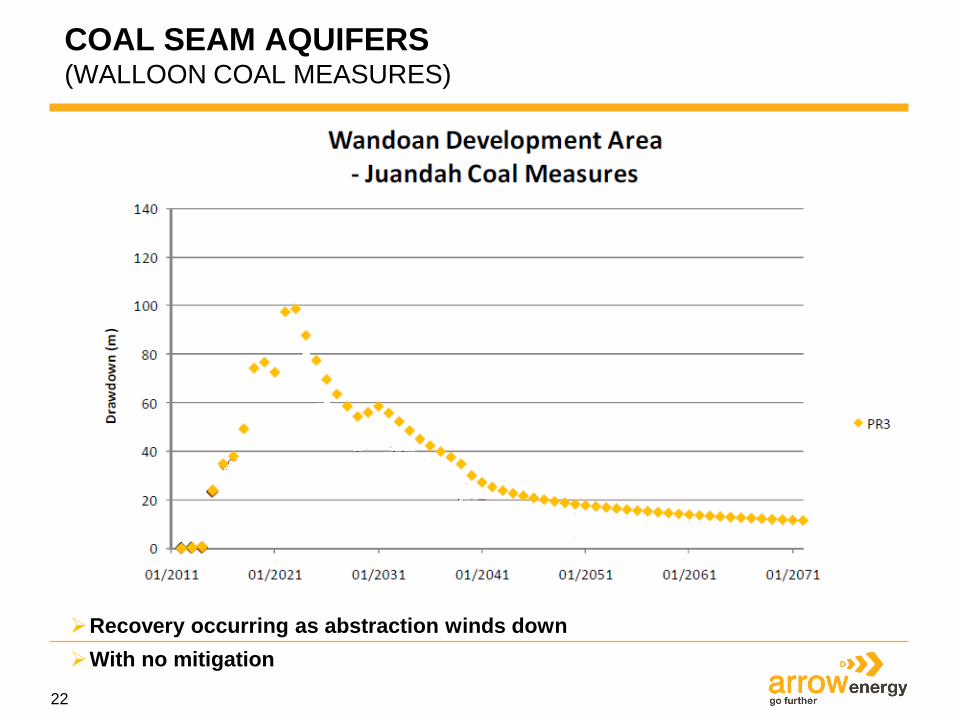
COAL SEAM AQUIFERS (WALLOON COAL MEASURES)
Peak impact in 2024 with recovery occurring as abstraction winds downWith no mitigation
22
Recovery occurring as abstraction winds downWith no mitigation
COAL SEAM AQUIFERS (WALLOON COAL MEASURES)

23
INTERMEDIATE AQUIFERS (SPRINGBOK SANDSTONE)
Peak drawdown of 40 to 50 m
Recovery so that drawdown is generally reduced to 20 m by 2061
With no mitigation

24
DEEP AQUIFERS(HUTTON SANDSTONE)
Peak drawdown of 50 to 75 m Recovery to 20 to 30 m by 2061 With no mitigation

25
DEEP AQUIFERS(PRECIPICE SANDSTONE)
Peak drawdown of 30 to 40 m in 2042 Recovery to 20 to 30 m by 2061 With no mitigation

ARROW ENERGYSTUDIES TO ADDRESS POTENTIAL IMPACTS
26
Preventative Measures Recovery Actions
Impaired capacity
?
Monitor changes in
groundwater vs
predictions
Substitute InjectLower pump
Modify pump
Deepen bore
Replace water supply
New bore

SHALLOW AQUIFERS(CONDAMINE ALLUVIUM)
Cumulative impact of all CSG proponents without mitigation
Maximum incremental impact in 2065 of ~2.5m (potential uncertainty range of 1 to 4 m)
Impact in western portion of Condamine Alluvium
With no mitigation

Substitution to maintain water balance
28
CONDAMINE ALLUVIUM HIGH LEVEL STUDIES
Past Future?
Recharge Landholder off-take Recharge Net off-take after substitution
CSG Leakage
46.4 GL/yr1
1. DERM 2010, central Condamine Alluvium data availability review2. CSIRO 2008, upper Condamine groundwater model calibration report
Average of 1.8 GL/y
A cumulative volume of 90 GL by 2065
< 46.4 GL/yr?
12-20 GL/yr1
36 GL/yr2
Alluvium Alluvium
12-20 GL/yr1
36 GL/yr2

29
Monitor abstraction from bores
Measurement at base of Alluvium and below
Measurement within Alluvium
CONDAMINE ALLUVIUM DETAILED STUDIESCONNECTIVITY TO THE WALLOON COAL MEASURES
Monitor: Abstractions in the Condamine Responses in water levels Alluvium Underlying coal measures
Geochemistry including: Naturally occurring Isotopes:
Rn 222, Kr, Sr, Ar, delta O18 CFC, SF6 Anion/cation ratios
Isotope and isotope/ion ratios to assess mixing of waters
The rate of exchange can be used in future model simulations

HIGH LEVEL STUDIESOTHER AQUIFERS
Modelling expanding calibration datasets & including allocations for aquifer
simulation modelling substitution & injection scenarios uncertainty analysis
Analysis of model predictions to 90-95% confidence intervals assess both the rate of change and the scale of future changes via hypothesis testing
30

Hydrochemistry Use of hydrochemistry and isotope hydrology to test hydraulic
connectivity between aquifers and Walloon Coal Measures
Connectivity studies of Walloons and intermediate and deep aquifers via hydraulic testing
Deep injection - Tipton injection study scanning electron microscope results
31
DETAILED STUDIESOTHER AQUIFERS

HUTTON SANDSTONESCANNING ELECTRON MICROSCOPE IMAGES
32
PP = pore spaceK = kaolinite
PP
K
K
PP

PRECIPICE SANDSTONESCANNING ELECTRON MICROSCOPE IMAGES
33
PP = pore spaceQO = quartz
PP
QO

SUMMARY
Initial Impact Assessment Model results completed for EIS
Aquifer Simulation Model for mitigation scenarios in preparation
Field studies are progressing to support mitigation development
Overarching mitigation measure planning is progressing
34

Questions
35