Embed Size (px)
Citation preview
Application note
Arrhythmia monitoring algorithmIntroductionThe ST/AR (ST and Arrhythmia Recognition) algorithm
is an ECG algorithm that Philips monitor/defibrillators
utilize for basic and cardiotach arrhythmia monitoring.
This application note provides a detailed description
of the arrhythmia monitoring portion of the algorithm.
The capabilities are presented in general terms as
they are implemented in Philips monitor/defibrillators.
Refer to the Instructions for Use for specific
information on the algorithm’s capabilities.
*For the purpose of this application note the HeartStart Intrepid, MRx, XL+, and Efficia DFM 100 will be referred to as Philips monitor/defibrillators, except when a specific device is called out.
2
What is an algorithm?An algorithm is a set of rules and instructions that
computers use to analyze data. The arrhythmia
monitoring algorithm analyzes one channel of surface
ECG signals, from either paced or non-paced patients.
As it does so, the QRS complexes are detected,
labeled and classified. Based on the classification,
the algorithm then generates alarms for the monitor/
defibrillator to communicate.
For your information, paced indicates that the
patient has an implantable pacemaker or is being
paced by a separate external source. The default
Pacer setting for the Intrepid is paced, MRx and
DFM 100 is non-paced, and unknown for the XL+.
To optimize the ST/AR algorithm, the Pacer setting
should be set according to the patient’s status.
How to get the best performance from computerized arrhythmia monitoring
There are several steps you can take to get the best
possible performance during arrhythmia monitoring:
1. Optimize Signal Quality:
• Skin preparation is especially important when
using gel electrodes.
• Change electrodes every 24 hours. Increased
baseline wander is the first indication that
electrodes are dry and need to be changed.
• Support cable and electrode wires. Artifact
and wander may increase if the skin under the
electrode is stretched. Taping the electrode and
lead may reduce this if your patient is active.
2. Choose the Best Lead:
Choose a lead where QRS amplitude is stable
and has adequate amplitude (recommended
amplitude is greater than 0.5 mV).
3. Ensure the Best QRS Complex:
Size and shape of the QRS are very important for
proper beat detection and classification. Use the
following guidelines to choose leads which
produce the best QRS morphology for analysis
by the arrhythmia system:
• The Normal Beat
– R-wave is tall, not clipped or biphasic.
– T-wave is less than 1/3 the R-wave height.
– P-wave is less than 1/5 the R-wave height.
• The Ectopic Beat
– Height is at least 1/5 the normal QRS height.
– Beat should not be clipped.
– Shape is distinctly different than the normal.
• The Paced Beat
– Pace pulse not much larger than the QRS complex.
– Ventricular paced beat is wider than the normal
QRS complex.
– Pace pulse has no visible re-polarization.
3
How the arrhythmia monitoring algorithm worksThe incoming ECG waveform undergoes several
distinct processing steps:
• First, the algorithm checks the quality of the ECG, to
detect noisy signals and other problems.
• Then, the actual analysis begins (see “ECG Analysis”).
During analysis, the algorithm filters the digitized
ECG, detects and classifies the QRS complexes,
calculates the heart rate, identifies ectopic events
and rhythms, and generates alarms.
Each of these steps is explained in more detail in the
sections that follow.
Quality check of the ECG signalBefore any analysis begins, the ECG signal quality is
checked for electrical noise and for other inoperative
(INOP) or technical conditions.
Electrical Noise“Noise” refers to any degradation of the ECG signal
that makes it difficult to accurately detect and classify
beats. Causes of noise, such as artifact and electrical
interference, should be avoided whenever possible.
Some common causes of noisy ECG signals include:
• Poor skin preparation
• Dried electrode gel
• Muscle artifact caused by shivering, movement,
or tremors
• Baseline wander caused by excessive chest movement
or the electrical differences between two brands of
electrodes
• Respiration artifact caused by thoracic or abdominal
movement of both spontaneous and ventilated
breathing patterns
• Nearby electrical equipment
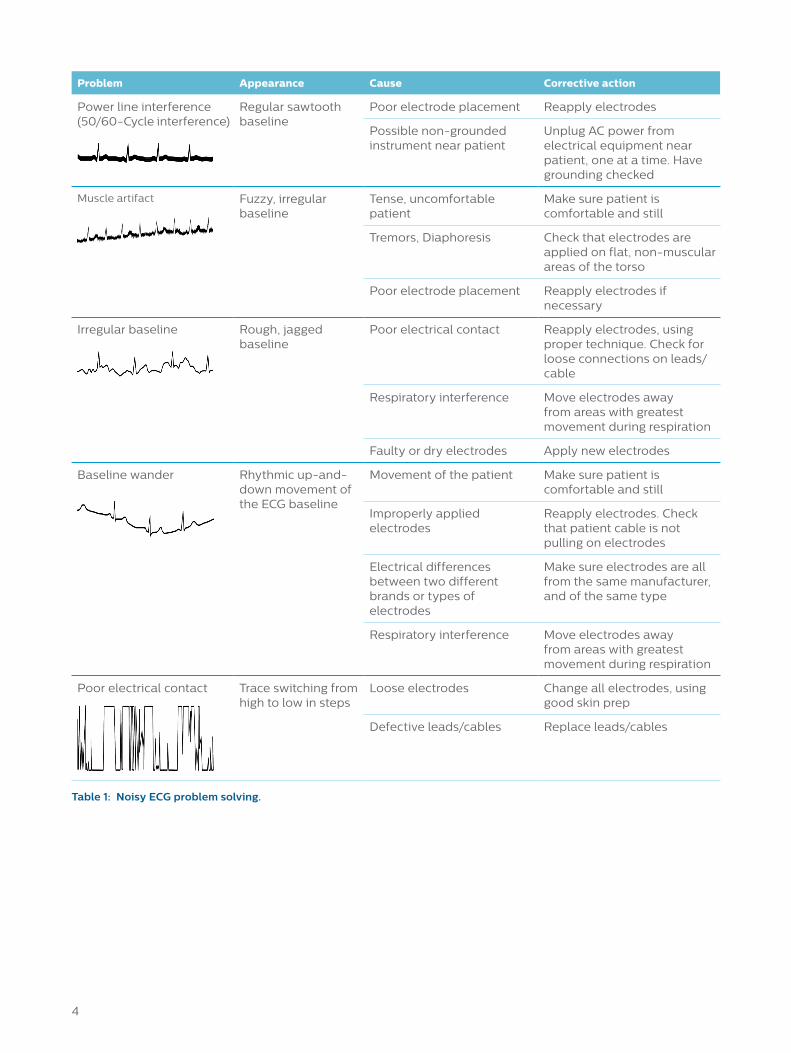
Prompt attention by the clinician to any ECG
interference increases the accuracy of the algorithm
and decreases the incidence of false alarms. Types of
noisy signals, their possible causes, and recommended
corrective actions are shown in Table 1 on page 4.
INOP (Technical) ConditionsINOP conditions (as classified in the Intrepid and
MRx), technical conditions (as classified in the XL+),
or technical alarms (as classified by the DFM 100) are
those most likely involving an equipment issue, such as:
• Detached electrodes
• Broken lead wires
A “lead off” or “cannot analyze ECG” condition, which
results in the loss of ECG monitoring, will also inhibit
arrhythmia monitoring until the condition is corrected
and the lead has been restored.
You may need to select a different lead or change the
electrodes or electrode position if there is excessive
noise, unstable voltage, low amplitude QRS, or large
P- or T-waves.
ECG analysisThe algorithm now begins to analyze the ECG signal.
Following a five step sequence, it:
1. Prepares the digitized ECG for analysis. See below
“Step 1: Digital Sampling”.
2. Detects and processes pacemaker pulses (if the
Pacer setting is paced), and filters the ECG to
compensate for muscle artifact and baseline
wander. See “Step 2: ECG Signal Filtering” on page 5.
3. Detects beats by detecting P waves, T waves, and
QRS complexes. See “Step 3: Beat Detection” on
page 5.
4. Measures features of the detected beat, classifies
its morphology, and applies a label to the
detected beat. Meanwhile, it continuously checks
for ventricular fibrillation. See “Step 4: Feature
Measurement and Labeling” on page 6.
5. Measures the heart rate, determines the underlying
rhythm, and identifies ectopic events. Alarms are
then generated as needed. See “Step 5: Rhythm
and Alarm Detection” on page 9.
Step 1: Digital samplingThe patient’s incoming ECG waveform is digitally
sampled at 8,000 samples/second. This high
ECG sampling rate is used to preserve the narrow
pacemaker pulses (spikes) for accurate pacing
analysis. After some initial analyses, the signal is
passed to the arrhythmia monitoring algorithm
at a rate of 500 samples/second. Full diagnostic
bandwidth is used for signals from ECG leads even if
another bandwidth is selected for display or recording.
Monitoring bandwidth is used for signals from hands-
free pads because of signal limitations from the size of
the pads. Within the arrhythmia monitoring algorithm,
a lower sampling rate of 125 samples/second is used
for QRS detection, QRS classification, and ventricular
fibrillation detection, where high sampling rates are
not needed.
4
Problem Appearance Cause Corrective action
Power line interference (50/60-Cycle interference)
Regular sawtooth baseline
Poor electrode placement Reapply electrodes
Possible non-grounded instrument near patient
Unplug AC power from electrical equipment near patient, one at a time. Have grounding checked
Muscle artifact Fuzzy, irregular baseline
Tense, uncomfortable patient
Make sure patient is comfortable and still
Tremors, Diaphoresis Check that electrodes are applied on flat, non-muscular areas of the torso
Poor electrode placement Reapply electrodes if necessary
Irregular baseline Rough, jagged baseline
Poor electrical contact Reapply electrodes, using proper technique. Check for loose connections on leads/cable
Respiratory interference Move electrodes away from areas with greatest movement during respiration
Faulty or dry electrodes Apply new electrodes
Baseline wander Rhythmic up-and-down movement of the ECG baseline
Movement of the patient Make sure patient is comfortable and still
Improperly applied electrodes
Reapply electrodes. Check that patient cable is not pulling on electrodes
Electrical differences between two different brands or types of electrodes
Make sure electrodes are all from the same manufacturer, and of the same type
Respiratory interference Move electrodes away from areas with greatest movement during respiration
Poor electrical contact Trace switching from high to low in steps
Loose electrodes Change all electrodes, using good skin prep
Defective leads/cables Replace leads/cables
Table 1: Noisy ECG problem solving.
5
Step 2: ECG signal filteringPacemaker pulse processingPace pulse artifact is eliminated before the ECG
waveforms are processed by the QRS detector. In this
way the accidental detection of the pace pulse as a
QRS is prevented.
NOTE: The removal of pace pulses is done only on
the signal that is used by the algorithm for arrhythmia
analysis. The pace pulses remain available for viewing
on the display or printed strips.
FilteringNext, the digitized ECG waveform(s) are processed by
two digital filters: a detection filter and a classification
filter. These filters are optimized individually to
enhance the performance of QRS detection and
classification. They operate simultaneously on the ECG.
The detection filter removes low frequency noise
(baseline wander) and muscle artifact, and accentuates
the QRS complexes. P-waves and T-waves are
diminished. This filter makes it easier to accurately
detect the QRS and helps avoid erroneously detecting
tall T-waves or artifact as beats. Since it distorts the
true shape of the QRS, the output from the detection
filter is used only for beat detection.
The classification filter also removes signal
irregularities, but it preserves the important features of
the QRS. Since this filter does not distort the complex,
the resulting ECG output can be used for feature
measurements and beat classification.
Step 3: Beat detectionThe algorithm’s challenge in QRS detection is to first
locate R-wave peaks that become “candidate peaks”
and then to make sure that they are not actually noise,
or P- or T-wave peaks.
The effect of ECG amplitude and gainAAMI Standard EC-13 requires that the detection
threshold for the QRS cannot be less than 0.15
mV. This specification is aimed at preventing the
detection of P-waves or baseline noise as QRS
complexes during complete heart block or asystole.
To conform with these requirements, ST/AR analyzes
the ECG of the patient before any size adjustments are
made to enhance the display of the wave. Thus, keep
in mind that increasing or decreasing the ECG size
displayed on the defibrillator has no effect on the ECG
used for QRS detection and classification. For optimal
beat detection, ensure good lead placement and
contact, and select the lead with the best signal.
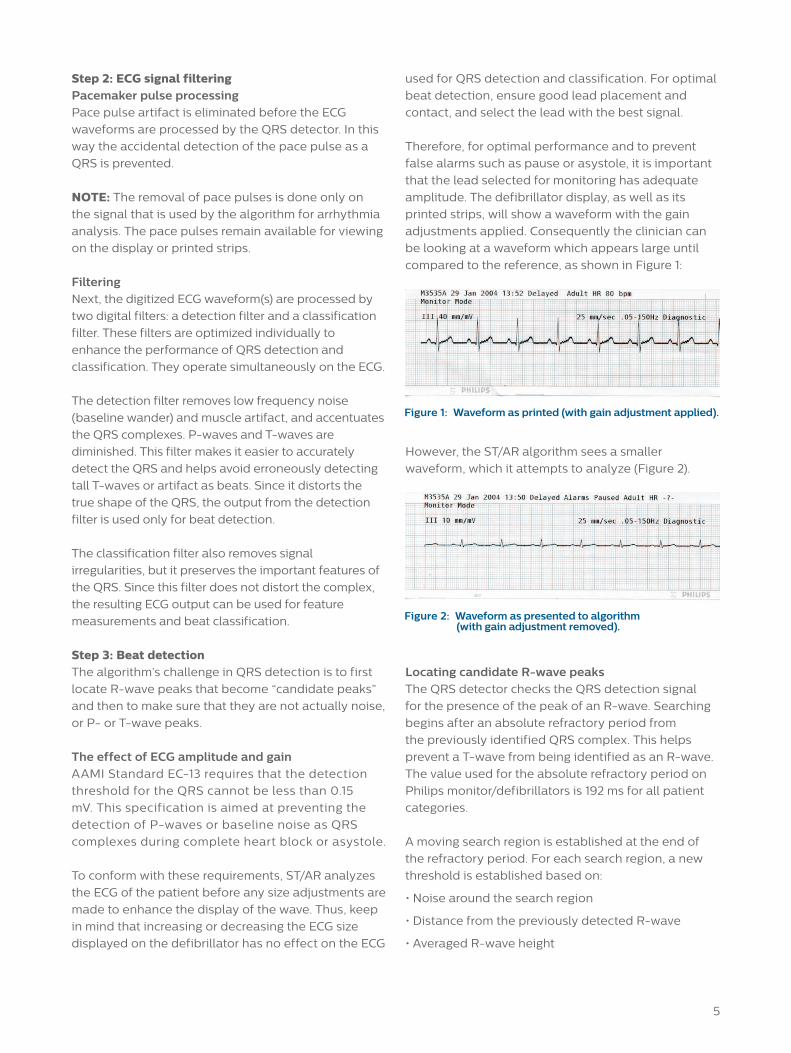
Therefore, for optimal performance and to prevent
false alarms such as pause or asystole, it is important
that the lead selected for monitoring has adequate
amplitude. The defibrillator display, as well as its
printed strips, will show a waveform with the gain
adjustments applied. Consequently the clinician can
be looking at a waveform which appears large until
compared to the reference, as shown in Figure 1:
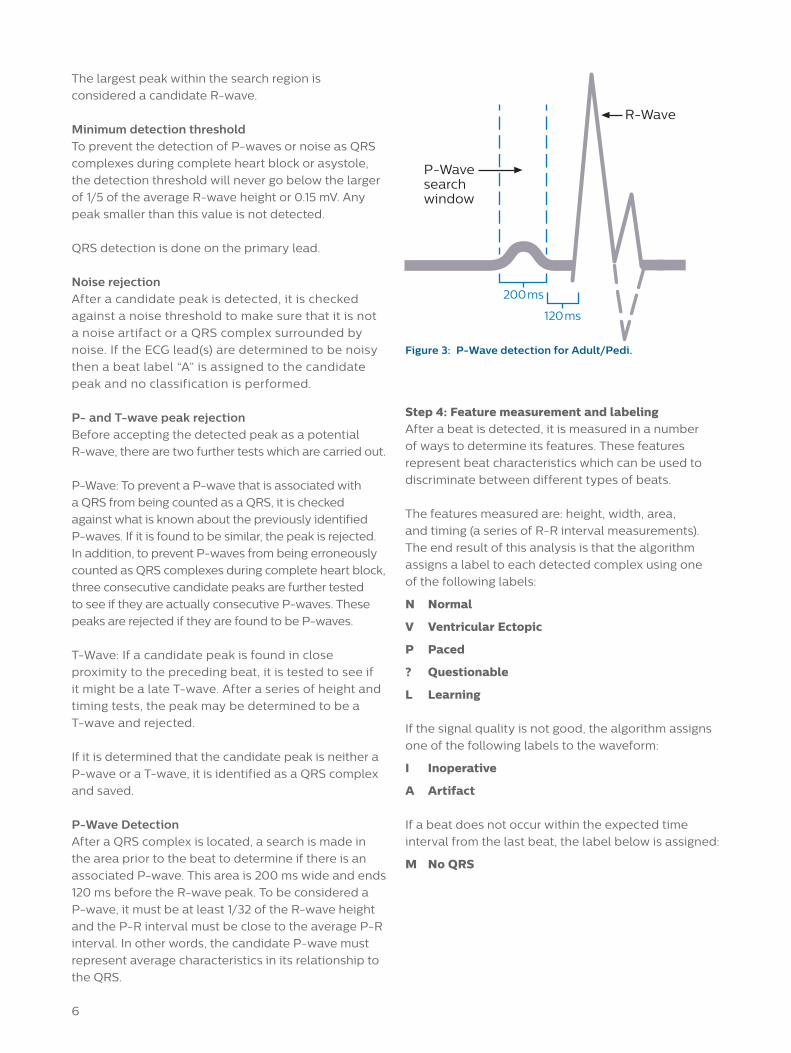
However, the ST/AR algorithm sees a smaller
waveform, which it attempts to analyze (Figure 2).
Locating candidate R-wave peaksThe QRS detector checks the QRS detection signal
for the presence of the peak of an R-wave. Searching
begins after an absolute refractory period from
the previously identified QRS complex. This helps
prevent a T-wave from being identified as an R-wave.
The value used for the absolute refractory period on
Philips monitor/defibrillators is 192 ms for all patient
categories.
A moving search region is established at the end of
the refractory period. For each search region, a new
threshold is established based on:
• Noise around the search region
• Distance from the previously detected R-wave
• Averaged R-wave height
Figure 1: Waveform as printed (with gain adjustment applied).
Figure 2: Waveform as presented to algorithm (with gain adjustment removed).
6
The largest peak within the search region is
considered a candidate R-wave.
Minimum detection thresholdTo prevent the detection of P-waves or noise as QRS
complexes during complete heart block or asystole,
the detection threshold will never go below the larger
of 1/5 of the average R-wave height or 0.15 mV. Any
peak smaller than this value is not detected.
QRS detection is done on the primary lead.
Noise rejectionAfter a candidate peak is detected, it is checked
against a noise threshold to make sure that it is not
a noise artifact or a QRS complex surrounded by
noise. If the ECG lead(s) are determined to be noisy
then a beat label “A” is assigned to the candidate
peak and no classification is performed.
P- and T-wave peak rejectionBefore accepting the detected peak as a potential
R-wave, there are two further tests which are carried out.
P-Wave: To prevent a P-wave that is associated with
a QRS from being counted as a QRS, it is checked
against what is known about the previously identified
P-waves. If it is found to be similar, the peak is rejected.
In addition, to prevent P-waves from being erroneously
counted as QRS complexes during complete heart block,
three consecutive candidate peaks are further tested
to see if they are actually consecutive P-waves. These
peaks are rejected if they are found to be P-waves.
T-Wave: If a candidate peak is found in close
proximity to the preceding beat, it is tested to see if
it might be a late T-wave. After a series of height and
timing tests, the peak may be determined to be a
T-wave and rejected.
If it is determined that the candidate peak is neither a
P-wave or a T-wave, it is identified as a QRS complex
and saved.
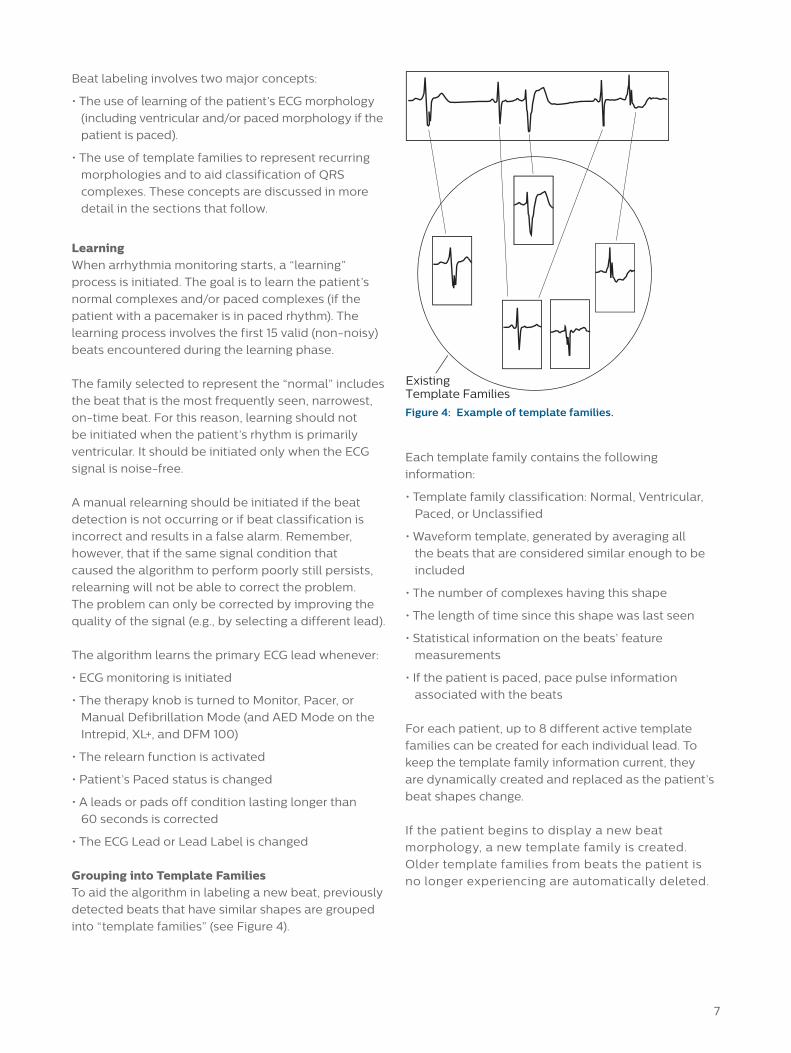
P-Wave DetectionAfter a QRS complex is located, a search is made in
the area prior to the beat to determine if there is an
associated P-wave. This area is 200 ms wide and ends
120 ms before the R-wave peak. To be considered a
P-wave, it must be at least 1/32 of the R-wave height
and the P-R interval must be close to the average P-R
interval. In other words, the candidate P-wave must
represent average characteristics in its relationship to
the QRS.
Step 4: Feature measurement and labelingAfter a beat is detected, it is measured in a number
of ways to determine its features. These features
represent beat characteristics which can be used to
discriminate between different types of beats.
The features measured are: height, width, area,
and timing (a series of R-R interval measurements).
The end result of this analysis is that the algorithm
assigns a label to each detected complex using one
of the following labels:
N Normal
V Ventricular Ectopic
P Paced
? Questionable
L Learning
If the signal quality is not good, the algorithm assigns
one of the following labels to the waveform:
I Inoperative
A Artifact
If a beat does not occur within the expected time
interval from the last beat, the label below is assigned:
M No QRS
P-Wave search window
R-Wave
200ms
120ms
Figure 3: P-Wave detection for Adult/Pedi.
7
Beat labeling involves two major concepts:
• The use of learning of the patient’s ECG morphology
(including ventricular and/or paced morphology if the
patient is paced).
• The use of template families to represent recurring
morphologies and to aid classification of QRS
complexes. These concepts are discussed in more
detail in the sections that follow.
LearningWhen arrhythmia monitoring starts, a “learning”
process is initiated. The goal is to learn the patient’s
normal complexes and/or paced complexes (if the
patient with a pacemaker is in paced rhythm). The
learning process involves the first 15 valid (non-noisy)
beats encountered during the learning phase.
The family selected to represent the “normal” includes
the beat that is the most frequently seen, narrowest,
on-time beat. For this reason, learning should not
be initiated when the patient’s rhythm is primarily
ventricular. It should be initiated only when the ECG
signal is noise-free.
A manual relearning should be initiated if the beat
detection is not occurring or if beat classification is
incorrect and results in a false alarm. Remember,
however, that if the same signal condition that
caused the algorithm to perform poorly still persists,
relearning will not be able to correct the problem.
The problem can only be corrected by improving the
quality of the signal (e.g., by selecting a different lead).
The algorithm learns the primary ECG lead whenever:
• ECG monitoring is initiated
• The therapy knob is turned to Monitor, Pacer, or
Manual Defibrillation Mode (and AED Mode on the
Intrepid, XL+, and DFM 100)
• The relearn function is activated
• Patient’s Paced status is changed
• A leads or pads off condition lasting longer than
60 seconds is corrected
• The ECG Lead or Lead Label is changed
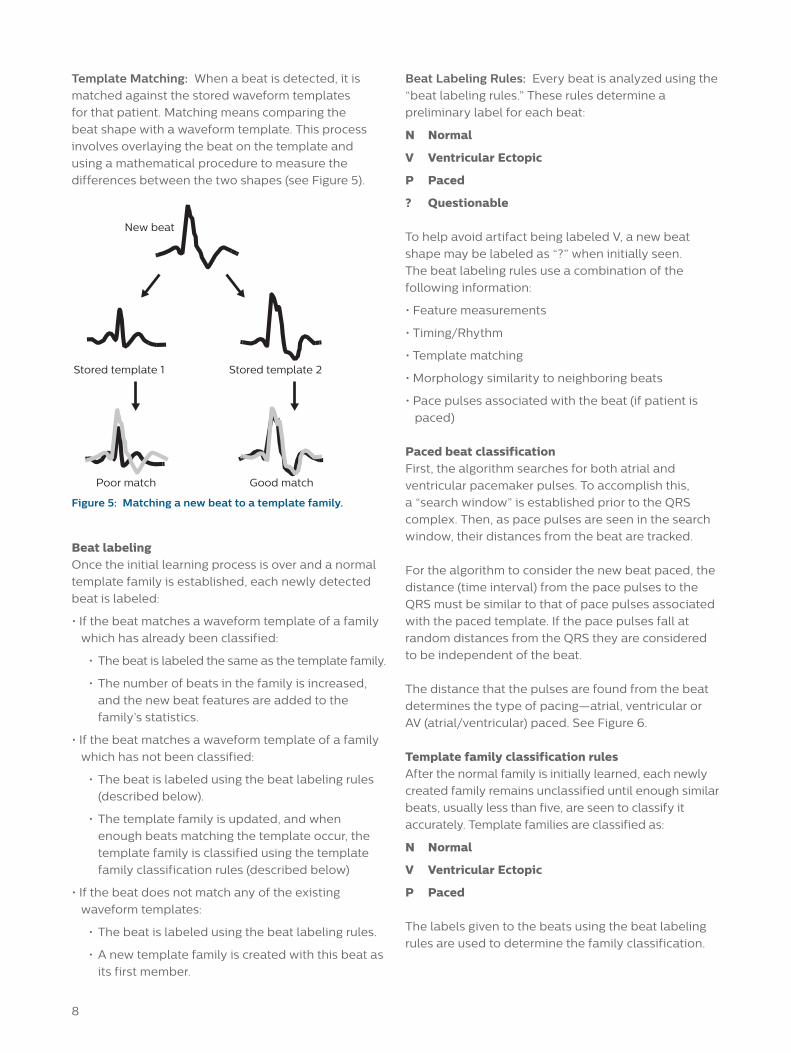
Grouping into Template FamiliesTo aid the algorithm in labeling a new beat, previously
detected beats that have similar shapes are grouped
into “template families” (see Figure 4).
Each template family contains the following
information:
• Template family classification: Normal, Ventricular,
Paced, or Unclassified
• Waveform template, generated by averaging all
the beats that are considered similar enough to be
included
• The number of complexes having this shape
• The length of time since this shape was last seen
• Statistical information on the beats’ feature
measurements
• If the patient is paced, pace pulse information
associated with the beats
For each patient, up to 8 different active template
families can be created for each individual lead. To
keep the template family information current, they
are dynamically created and replaced as the patient’s
beat shapes change.
If the patient begins to display a new beat
morphology, a new template family is created.
Older template families from beats the patient is
no longer experiencing are automatically deleted.
Existing Template Families
Figure 4: Example of template families.
8
Template Matching: When a beat is detected, it is
matched against the stored waveform templates
for that patient. Matching means comparing the
beat shape with a waveform template. This process
involves overlaying the beat on the template and
using a mathematical procedure to measure the
differences between the two shapes (see Figure 5).
Beat labelingOnce the initial learning process is over and a normal
template family is established, each newly detected
beat is labeled:
• If the beat matches a waveform template of a family
which has already been classified:
• The beat is labeled the same as the template family.
• The number of beats in the family is increased,
and the new beat features are added to the
family’s statistics.
• If the beat matches a waveform template of a family
which has not been classified:
• The beat is labeled using the beat labeling rules
(described below).
• The template family is updated, and when
enough beats matching the template occur, the
template family is classified using the template
family classification rules (described below)
• If the beat does not match any of the existing
waveform templates:
• The beat is labeled using the beat labeling rules.
• A new template family is created with this beat as
its first member.
Beat Labeling Rules: Every beat is analyzed using the
“beat labeling rules.” These rules determine a
preliminary label for each beat:
N Normal
V Ventricular Ectopic
P Paced
? Questionable
To help avoid artifact being labeled V, a new beat
shape may be labeled as “?” when initially seen.
The beat labeling rules use a combination of the
following information:
• Feature measurements
• Timing/Rhythm
• Template matching
• Morphology similarity to neighboring beats
• Pace pulses associated with the beat (if patient is
paced)
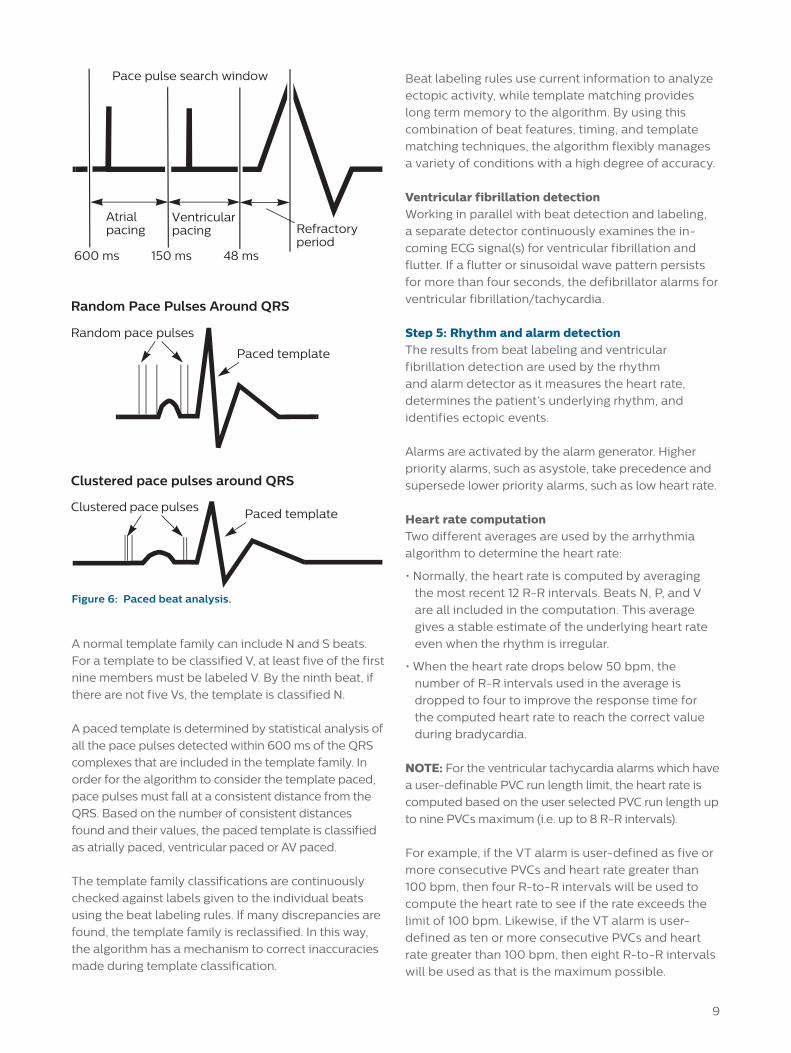
Paced beat classificationFirst, the algorithm searches for both atrial and
ventricular pacemaker pulses. To accomplish this,
a “search window” is established prior to the QRS
complex. Then, as pace pulses are seen in the search
window, their distances from the beat are tracked.
For the algorithm to consider the new beat paced, the
distance (time interval) from the pace pulses to the
QRS must be similar to that of pace pulses associated
with the paced template. If the pace pulses fall at
random distances from the QRS they are considered
to be independent of the beat.
The distance that the pulses are found from the beat
determines the type of pacing—atrial, ventricular or
AV (atrial/ventricular) paced. See Figure 6.
Template family classification rulesAfter the normal family is initially learned, each newly
created family remains unclassified until enough similar
beats, usually less than five, are seen to classify it
accurately. Template families are classified as:
N Normal
V Ventricular Ectopic
P Paced
The labels given to the beats using the beat labeling
rules are used to determine the family classification.
Figure 5: Matching a new beat to a template family.
New beat
Good matchPoor match
Stored template 2Stored template 1
9
Pace pulse search window
Atrial pacing Refractory
period
Random pace pulses
Random Pace Pulses Around QRS
Clustered pace pulses around QRS
Clustered pace pulses Paced template
Paced template
600 ms 150 ms 48 ms
Ventricular pacing
Figure 6: Paced beat analysis.
A normal template family can include N and S beats.
For a template to be classified V, at least five of the first
nine members must be labeled V. By the ninth beat, if
there are not five Vs, the template is classified N.
A paced template is determined by statistical analysis of
all the pace pulses detected within 600 ms of the QRS
complexes that are included in the template family. In
order for the algorithm to consider the template paced,
pace pulses must fall at a consistent distance from the
QRS. Based on the number of consistent distances
found and their values, the paced template is classified
as atrially paced, ventricular paced or AV paced.
The template family classifications are continuously
checked against labels given to the individual beats
using the beat labeling rules. If many discrepancies are
found, the template family is reclassified. In this way,
the algorithm has a mechanism to correct inaccuracies
made during template classification.
Beat labeling rules use current information to analyze
ectopic activity, while template matching provides
long term memory to the algorithm. By using this
combination of beat features, timing, and template
matching techniques, the algorithm flexibly manages
a variety of conditions with a high degree of accuracy.
Ventricular fibrillation detectionWorking in parallel with beat detection and labeling,
a separate detector continuously examines the in-
coming ECG signal(s) for ventricular fibrillation and
flutter. If a flutter or sinusoidal wave pattern persists
for more than four seconds, the defibrillator alarms for
ventricular fibrillation/tachycardia.
Step 5: Rhythm and alarm detectionThe results from beat labeling and ventricular
fibrillation detection are used by the rhythm
and alarm detector as it measures the heart rate,
determines the patient’s underlying rhythm, and
identifies ectopic events.
Alarms are activated by the alarm generator. Higher
priority alarms, such as asystole, take precedence and
supersede lower priority alarms, such as low heart rate.
Heart rate computationTwo different averages are used by the arrhythmia
algorithm to determine the heart rate:
• Normally, the heart rate is computed by averaging
the most recent 12 R-R intervals. Beats N, P, and V
are all included in the computation. This average
gives a stable estimate of the underlying heart rate
even when the rhythm is irregular.
• When the heart rate drops below 50 bpm, the
number of R-R intervals used in the average is
dropped to four to improve the response time for
the computed heart rate to reach the correct value
during bradycardia.
NOTE: For the ventricular tachycardia alarms which have
a user-definable PVC run length limit, the heart rate is
computed based on the user selected PVC run length up
to nine PVCs maximum (i.e. up to 8 R-R intervals).
For example, if the VT alarm is user-defined as five or
more consecutive PVCs and heart rate greater than
100 bpm, then four R-to-R intervals will be used to
compute the heart rate to see if the rate exceeds the
limit of 100 bpm. Likewise, if the VT alarm is user-
defined as ten or more consecutive PVCs and heart
rate greater than 100 bpm, then eight R-to-R intervals
will be used as that is the maximum possible.
10
Arrhythmia monitoring for the paced patientSince the pace pulses are detected and eliminated
before the ECG waveform is processed by the QRS
beat detector, accidental detection of the pace
pulse as a QRS is prevented. The pace pulses
remain available for viewing on the display or
printed strips. The pace pulses appear at the point
in the waveform where they actually occurred.
Proper application of the paced patient algorithmCareful observation during the arrhythmia system’s
analysis of the paced patient is vitally important.
The clinician must always verify that paced pulse
detection is indeed taking place.
First, patient information must be entered,
confirming the patient is being paced. With the XL+,
you activate the pacing status by specifying the
appropriate patient category. With the MRx and
DFM 100, the default pacing status is non-paced or
Pacing Paused. With the Intrepid, the default pacing
status is paced or Pacing Paused. In any case,
pacing detection should always be turned on when
monitoring patients with any type of pacemaker.
The device then relearns the patient’s rhythm using
the paced patient algorithm.
While learning, the user should observe the delayed,
annotated wave to be certain pace pulse tic marks
are properly associated with pace pulses.
Up to two pace pulse tic marks are displayed
regardless whether they are associated with the
following beat or not. Thus for a dual-chamber
paced beat there will be two separate marks (one
for each pace pulse).
Paced alarmsAlthough not designed to detect pacemaker sensing
problems, the alarm system incorporates two
specific alarms for paced rhythms:
• “Pacer-Not-Capture” is determined when a QRS
does not occur for 1.76 times the average R-to_r
interval and pace pulse is detected in the time
interval.
• “Pacer-Not-Pacing” is initiated if a QRS does not
occur for 1.75 times the average R-to R interval and
no pace pulse is detected in the time interval.
NOTE: “M” beat label will appear when a QRS does
not occur.
NOTE: “Pacer-Not-Capture” and “Pacer-Not-
Pacing” alarms are not active during transcutaneous
pacing.
The following application points can greatly improve
the results of the paced patient algorithm:
• Pacing detection should always be turned on when
monitoring patients with any type of pacemaker
• Paced complexes should be between 1 and 2 mV in
size and taller than the pace pulse
• Cardiac response of ventricularly paced beats should
be wider than the normal QRS complex
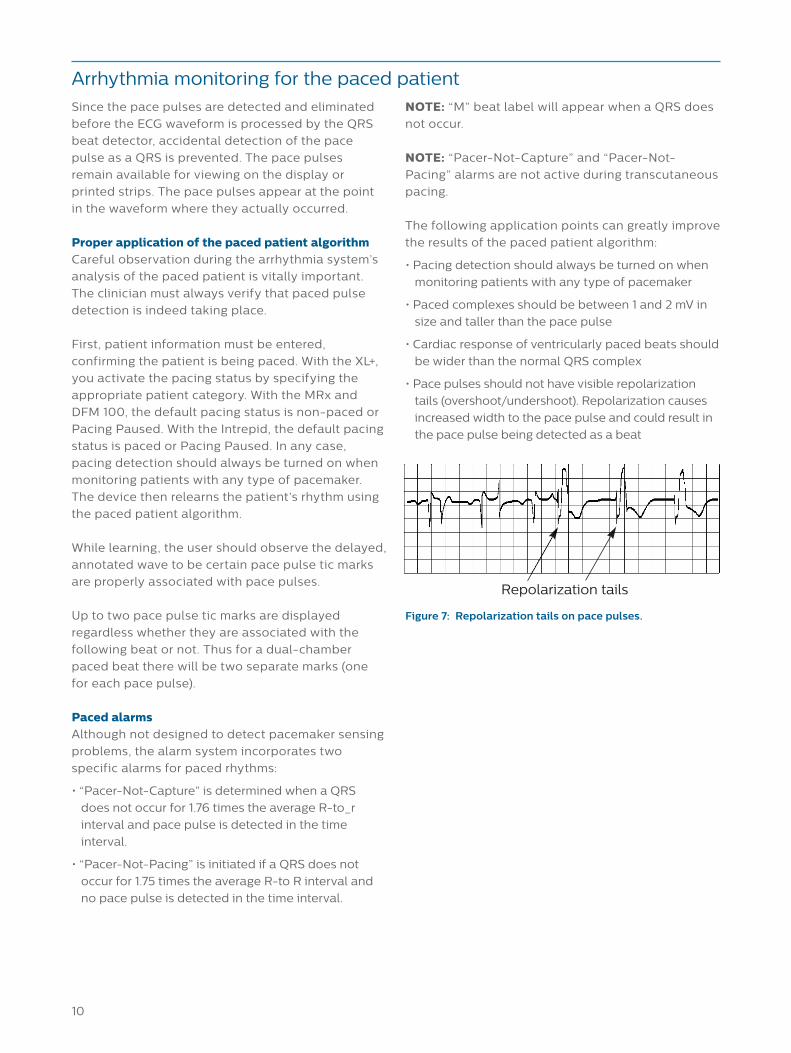
• Pace pulses should not have visible repolarization
tails (overshoot/undershoot). Repolarization causes
increased width to the pace pulse and could result in
the pace pulse being detected as a beat
Figure 7: Repolarization tails on pace pulses.
Repolarization tails

11
Computerized arrhythmia monitoringIt is impossible to design a computerized
arrhythmia algorithm that accurately analyzes
100% of all patients. In the following sections,
several conditions that can cause difficulty for the
algorithm are described.
Tall P- and T-wavesThe algorithm is designed to selectively recognize
and filter out P- and T-waves to prevent classification
as beats. However, if a T-wave is much larger than
the R-wave’s height, correct classification is difficult.
The T-wave might be detected and incorrectly
classified as a PVC, and a “High Heart Rate” alarm
could be activated.
Large P-waves may also be detected and
incorrectly classified as an R-wave, causing the
algorithm to generate incorrect high heart rate or
PVC-related false alarms.
In most instances, large T- and P-waves can be
addressed by selecting different leads. However,
in conditions such as extreme atrial hypertrophy,
hyperkalemia, or decreased ventricular voltage,
the P- and T-waves may be as large as the R-wave
despite careful lead selection. In these cases,
select the lead that shows the lowest P- and
T-wave height.
Aberrantly conducted beatsSince P-waves are not analyzed, it is difficult and
sometimes impossible for a monitoring system
to distinguish between an aberrantly conducted
supraventricular beat and a ventricular beat. If the
aberrant beat resembles a ventricular morphology,
it is classified as ventricular.
Atrial fibrillation and flutterSince P-wave morphology is not analyzed, there is no
method to discriminate atrial rhythms. In some cases
of atrial dysrhythmias, the erratic baseline fibrillations
and flutters may be greater than the algorithm’s
detection threshold, causing erroneous detection and
false alarms.
Intermittent bundle branch blockThe phenomenon of bundle branch or any of the
other fascicular blocks creates a challenge for the
arrhythmia algorithm. If the QRS during the block
changes considerably from the learned normal,
the blocked beat may be incorrectly classified as
ventricular, causing false PVC alarms.
Figure 8: Tall P- and T-waves.
Figure 10: Atrial fibrillation.
Figure 11: Intermittent bundle branch block.
Figure 9: Aberrantly conducted beat.
Detects as RDetects as R
Detects as R Detects as R
Large T-waves
Atrial hypertrophy
N V
NN
VV V
V
VVVV
N VV
12
The arrhythmia system’s alarm structureAlarm detectionThe ST/AR Basic arrhythmia monitoring algorithm is
designed to analyze up to 10 rhythm disturbances
and irregularities. Each of these must pass a set
of tests before an alarm is generated. The system
generates ten alarms.
After an alarm sounds and a more serious alarm is
detected, the lesser alarm message is superseded
and the higher priority alarm is activated.
Tables 2 and 3 describe each alarm and the
conditions required to generate the alarm.
Alarm activation and structureThe ST/AR arrhythmia system’s alarm structure is
based on priorities, with a system of *** Red, ** Yellow,
and INOP alarms for the Intrepid and MRx and high,
medium, and low priority physiological, technical
alarms for the XL+ and DFM 100. See the tables
for red (high priority) and yellow (medium priority)
descriptions. Each type has a distinctive visual and
audible alarm, enabling quick recognition of the
severity of the alarm event.
Once an alarm is detected, it is immediately activated.
An alarm message appears on the display, and a
distinctive audible alarm is annunciated.
*** Red (high priority) alarmsRed alarms, the most critical and life-threatening,
always take priority over lesser arrhythmia alarms.
They can never be individually turned off. All red and
yellow alarms will be turned off if:
• Alarms are suspended
• ECG alarms are turned off (HR alarms off )
** Yellow (medium priority) alarmsYellow alarms are considered lower in priority than red
alarms, but still may indicate serious rhythm or rate
disturbance. A yellow alarm can be superseded by a
more serious yellow alarm event, or a red alarm.
INOP (technical) alarmsINOP (or technical) alarms occur whenever the ECG
signal cannot be properly analyzed due to noise or
INOP (or technical) conditions. If more than 2/3 of
the time over the last 30 seconds beats are classified
as either noisy or questionable, a Cannot Analyze
INOP (or technical) alarm is generated. When active,
the INOP (or technical) alarm continues, visually and
audibly, as long as the condition exists, and stops
automatically when the condition terminates.
Since the INOP (or technical) alarm is a lower priority
alarm, it will not override a red or yellow alarm should
it occur during the same time a red or yellow alarm is
occurring. Similarly, if an arrhythmia event is detected
while the INOP (or technical) alarm is active, the red
or yellow arrhythmia alarm will override the INOP (or
technical) alarm.
Since the Cannot Analyze INOP (or technical) alarm
indicates that the effectiveness of the arrhythmia
monitoring for the patient is compromised, a quick
response to this high priority alarm is recommended.
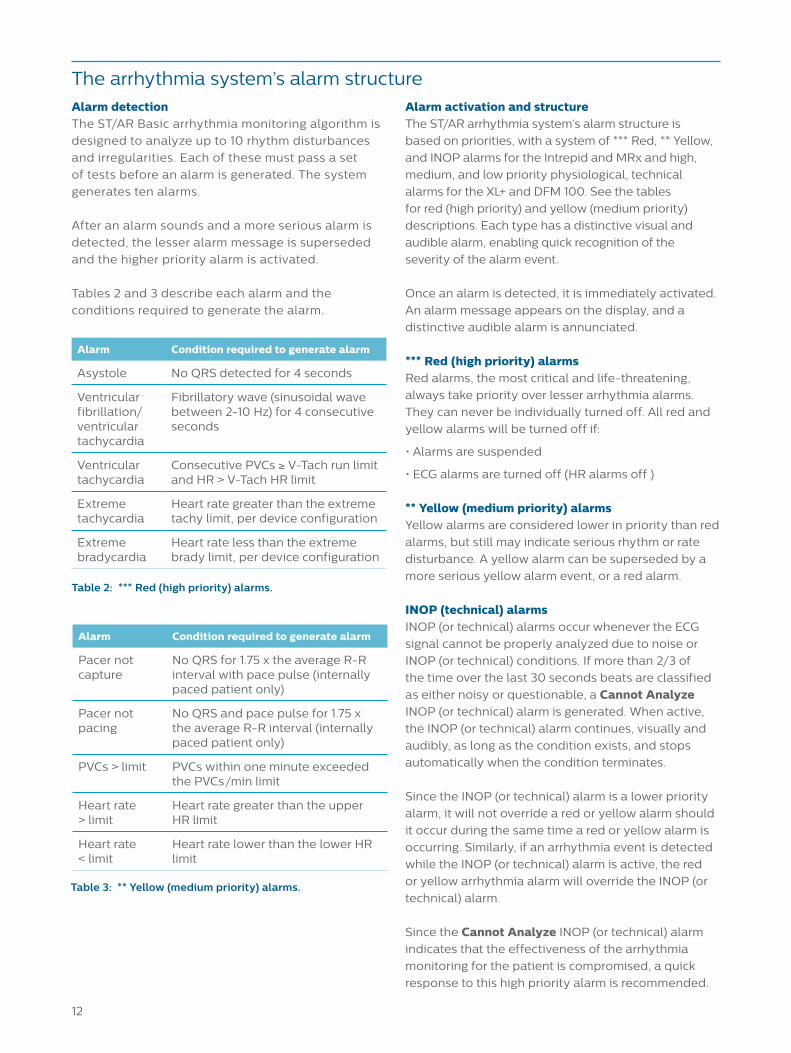
Alarm Condition required to generate alarm
Asystole No QRS detected for 4 seconds
Ventricular fibrillation/ventricular tachycardia
Fibrillatory wave (sinusoidal wave between 2-10 Hz) for 4 consecutive seconds
Ventricular tachycardia
Consecutive PVCs ≥ V-Tach run limit and HR > V-Tach HR limit
Extreme tachycardia
Heart rate greater than the extreme tachy limit, per device configuration
Extreme bradycardia
Heart rate less than the extreme brady limit, per device configuration
Alarm Condition required to generate alarm
Pacer not capture
No QRS for 1.75 x the average R-R interval with pace pulse (internally paced patient only)
Pacer not pacing
No QRS and pace pulse for 1.75 x the average R-R interval (internally paced patient only)
PVCs > limit PVCs within one minute exceeded the PVCs/min limit
Heart rate > limit
Heart rate greater than the upper HR limit
Heart rate < limit
Heart rate lower than the lower HR limit
Table 2: *** Red (high priority) alarms.
Table 3: ** Yellow (medium priority) alarms.

13
Alarm chainingTo prevent the confusion of redundant alarms
or the activation of less important alarms while
acknowledging serious alarms, the arrhythmia
algorithm sets alarm priorities through an “alarm
chaining” system.
Related events, such as ventricular alarms, are
grouped in a “chain.” The most critical alarms occupy
the top of the chain and are followed by events in
logical, descending order (see Figure 12).
Philips monitor/defibrillators use the basic arrhythmia
monitoring alarm chain for Monitor, Manual
Defibrillation, Synchronized Cardioversion, and
Pacer Modes. With the exception of the MRx, Philips
monitor/defibrillators use the cardiotach mode
arrhythmia alarm chain for AED Mode (see Figure 13).
The manner in which the alarms are grouped and
prioritized define how the alarms are announced:
• *** Red alarms having the highest priority are
announced first if present
• If there are no *** Red alarms detected, then the
highest priority ** Yellow alarm detected in any given
alarm chain is announced
• If alarms of the same priority in different alarm
chains are detected, the most recent alarm is
announced.
Points to remember about alarmsAfter a red or yellow alarm is acknowledged, the
alarm is paused for the configured pause period while
the patient is attended to. If the alarming condition
continues to exist, it re-alarms after the configured
pause period ends. When the alarm reminder is
triggered, the alarm sound associated with the alarm
is sounded, however the visual alarm indicator always
remains present while the alarm condition exists.
• If an alarm condition exists, it is always announced
unless it is turned off, there is a higher priority alarm
in effect, acknowledge by the user, or the two-minute
timeout period is in effect
• *** Red ECG/arrhythmia alarms never automatically
reset
• All arrhythmia alarm audio tones and visual
messages are disabled on the MRx if alarms are
paused or HR/ECG alarms are off, whereas only the
audio tones are disabled on the Intrepid, DFM 100,
and XL+ (i.e., visual messages are enabled).
Figure 12: Alarm chain for basic arrhythmia monitoring.
Figure 13: Cardiotach mode arrhythmia alarm priority chain.
(RED ALARMS)
Asystole
V-Fib/V-Tach
V-Tach
Extreme Tachy Extreme Brady
(YELLOW ALARMS)
Frequent PVCs PNC* PNP* High HR Low HR
First level timeout period
Second level timeout period
PVCs > xx/Min * PNC = Pacer Not Capture PNP = Pacer Not Pacing
(RED ALARMS)
Asystole
V-Fib/V-Tach
Extreme Tachy Extreme Brady
(YELLOW ALARMS)
High HR Low HR
AED Mode only
14
ConclusionComputerized arrhythmia monitoring is a tool the
clinician can use to continuously monitor and evaluate
the patient. In order to fully make use of this tool, it
is important to understand the computer algorithm’s
capabilities and limitations.

4535 647 71351 * NOV 2019© 2019 Koninklijke Philips N.V. All rights reserved.
www.philips.com