Embed Size (px)
Citation preview

Around the World In
30 MinutesOctober 2011

Beech Island South Carolina

Industrial Pipes


U.S. Economy: Employment

16-19
20-24
25-54
55+
65+


Illegal Aliens Apprehended

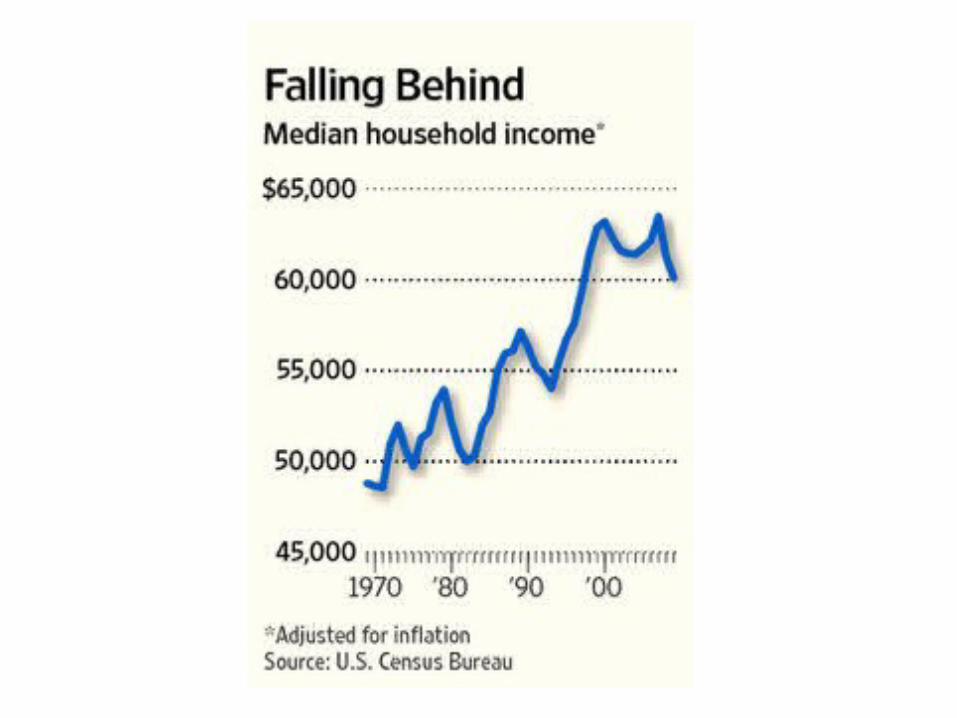
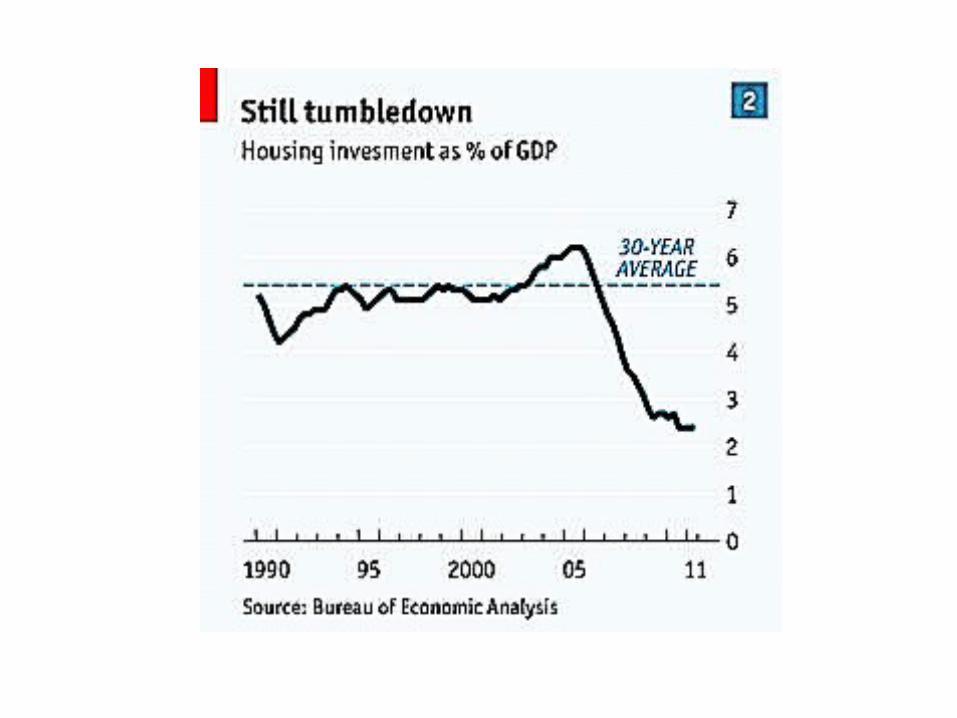
Real Estate Dip?


Mortgage Originations by Investors

Refinancing Hard To Do
Buy Back Bad Loans
Higher Fees
Second Mortgages

Housing: What to Do?
Refi 22.5 mil Houses
Leftover TARP
Bank Equity Ownership

Fiscal Drag from Federal, State, Local Gov’ts

Small Businesses
Loans
Training
Gov’t Regulation

Operation Twist?

Short-term Stimulus

Medium-term: Spending Cuts

Corporate Taxes
12.5/25/35
Loopholes

0
0.5
1
1.5
2
2.5
3
3.5
2009 2010 2011 2012
U.S. Economic Growth: Lost Decade? (% Change Year over Year)
Forecast
Zero

Double Dip?
External

Save the Euro?

Unit Labor Costs


Breakup Euro?

What Are Businesses to
Do?

IGER.csuci.edu

Why IGER?
Bridge to Pacific Rim
Export


Asia: Where Action Is
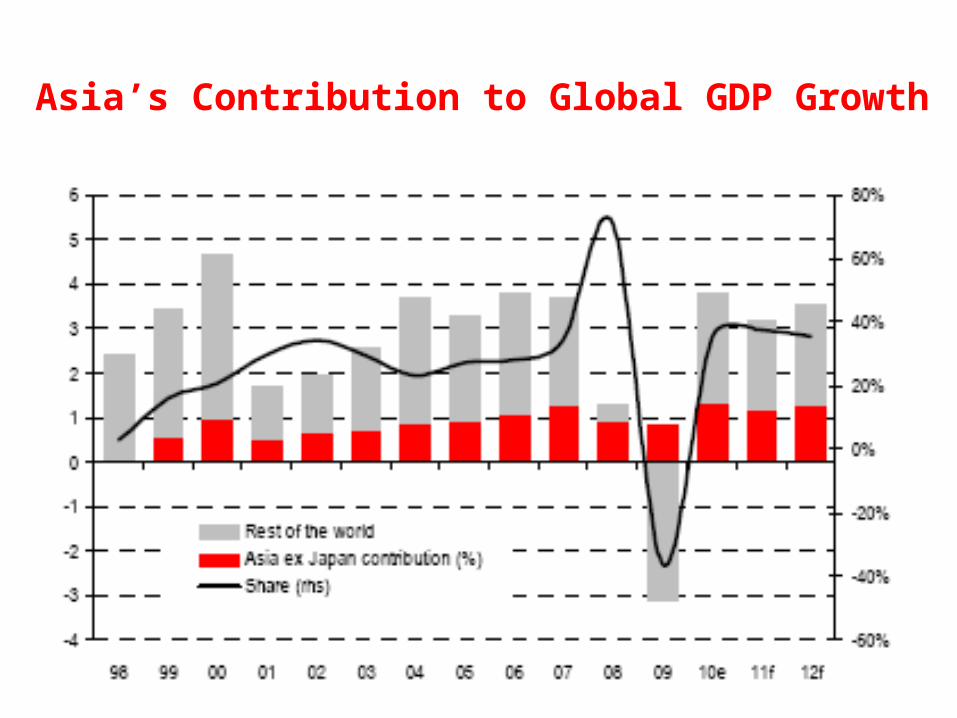
Asia’s Contribution to Global GDP Growth

Investments in Asia

Asia Place to
Produce
Invest
Sell

Asia
Not Just Cheap Goods

Computational Photography

Video
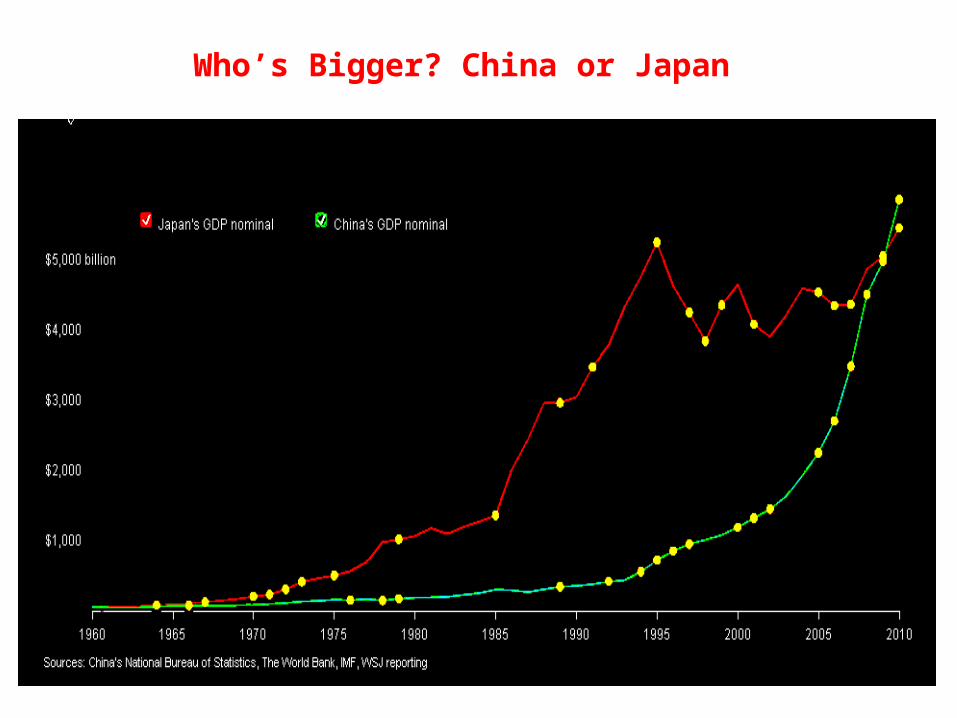
Who’s Bigger? China or Japan


U.S. Treasury Securities
8% of all
25% of foreign owned

China
Big Consumer

China’s Love Affair with Cars

Buy a Car and Buy a Flat


House Prices for Asian Cities

Gov’t Policies
Purchase Restrictions
Property Taxes
Higher Interest Rates

China Outlook ?
ST: RE Bubble
MT: Healthy Growth

Santa Barbara County

Data Source: Labor Market Information Division, State of California and Bureau of Labor Statistics
Aug-05
Dec-05
Apr-06
Aug-06
Dec-06
Apr-07
Aug-07
Dec-07
Apr-08
Aug-08
Dec-08
Apr-09
Aug-09
Dec-09
Apr-10
Aug-10
Dec-10
Apr-11
Aug-11
0.0
2.0
4.0
6.0
8.0
10.0
12.0
14.0
Seasonally AdjustedUnemployment Rate
Santa Barbara County United States CA
% U
nem
ploy
ed

2000 2001 2002 2003 2004 2005 2006 2007 2008 2009 2010-4,000
-3,000
-2,000
-1,000
0
1,000
2,000
3,000
Santa Barbara CountyNet Migration
Num
ber o
f Net
Mig
rant
s
Source: CA Department of Finance
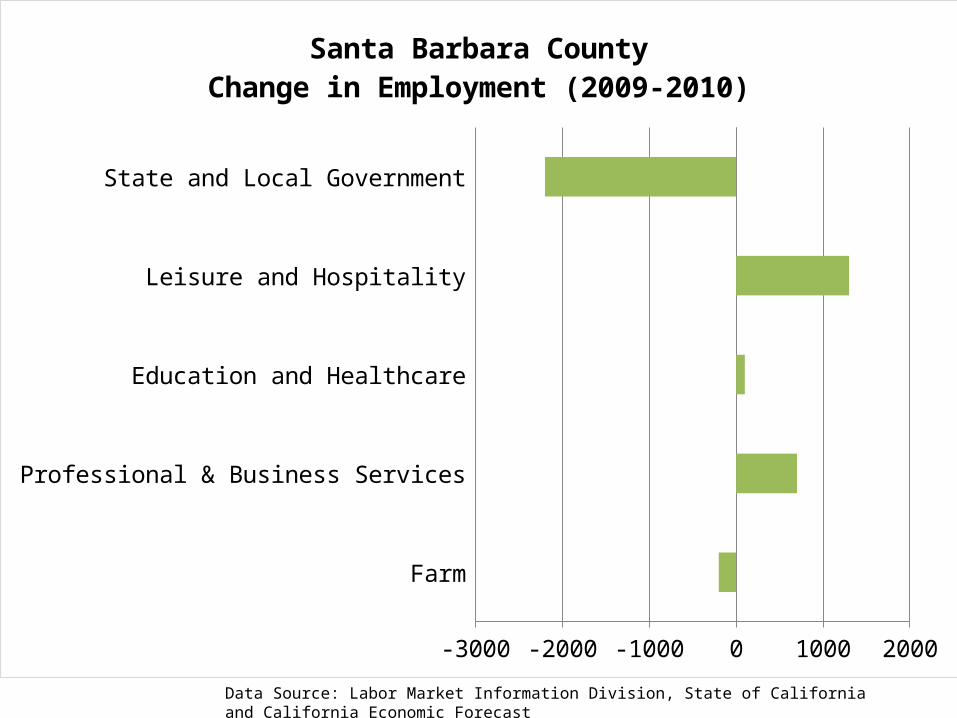
Data Source: Labor Market Information Division, State of California and California Economic Forecast
Farm
Professional & Business Services
Education and Healthcare
Leisure and Hospitality
State and Local Government
-2500 -2000 -1500 -1000 -500 0 500 1000 1500
Santa Barbara CountyChange in Employment (2009-2010)
Aug-05
Dec-05
Apr-06
Aug-06
Dec-06
Apr-07
Aug-07
Dec-07
Apr-08
Aug-08
Dec-08
Apr-09
Aug-09
Dec-09
Apr-10
Aug-10
Dec-10
Apr-11
Aug-11
-60.0%
-40.0%
-20.0%
0.0%
20.0%
40.0%
60.0%
80.0%
100.0%
120.0%
140.0%
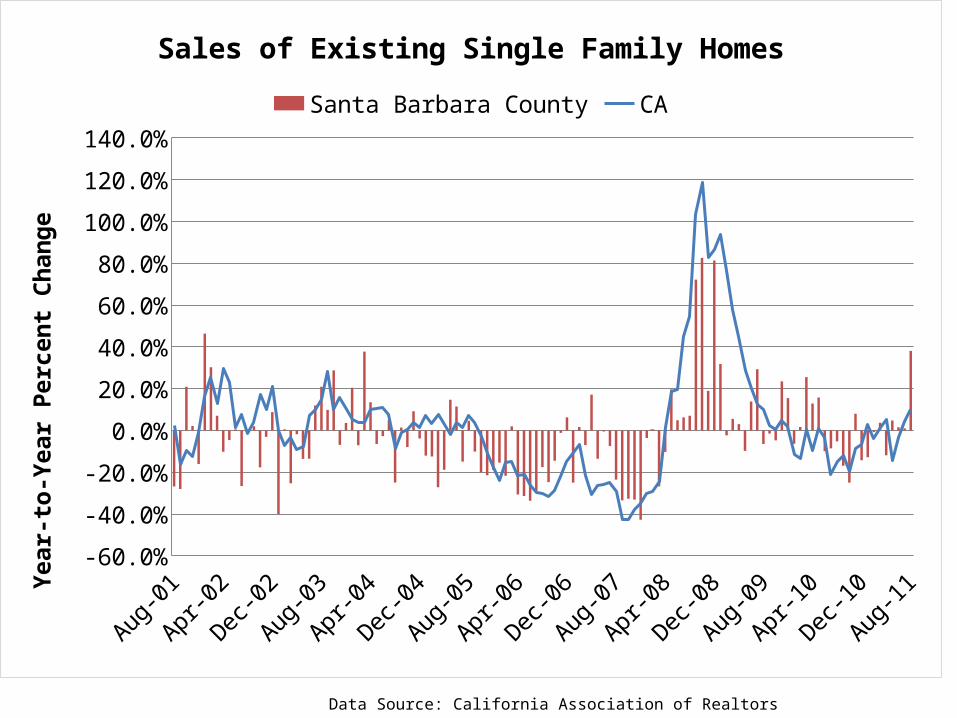
Sales of Existing Single Family Homes
Santa Barbara County CA
Year
-to-
Year
Per
cent
Cha
nge
Data Source: California Association of Realtors

Data Source: California Association of Realtors
Aug-05
Dec-05
Apr-06
Aug-06
Dec-06
Apr-07
Aug-07
Dec-07
Apr-08
Aug-08
Dec-08
Apr-09
Aug-09
Dec-09
Apr-10
Aug-10
Dec-10
Apr-11
Aug-11
$0
$100,000
$200,000
$300,000
$400,000
$500,000
$600,000
$700,000
$800,000
$900,000
$1,000,000
Median Price of Existing Single Family HomesSeasonally Adjusted
Santa Barbara County CA

Aug 2005
Dec 2005
Apr 2006
Aug 2006
Dec 2006
Apr 2007
Aug 2007
Dec 2007
Apr 2008
Aug 2008
Dec 2008
Apr 2009
Aug 2009
Dec 2009
Apr 2010
Aug 2010
Dec 2010
Apr 2011
Aug 2011
0.0%
0.1%
0.2%
0.3%
0.4%
Santa Barbara CountyForeclosures
Santa Barbara Metro California
Perc
ent o
f Sin
gle
Fam
ily H
omes
Source: Zillow.com

Source: Radius Commercial Real Estate and California Economic Forecast
%
Source: Radius Commercial Real Estate and California Economic Forecast

DrSohn.com
(not Dr.Sohn.com)