Embed Size (px)
Citation preview

Arms Race
David Levinson
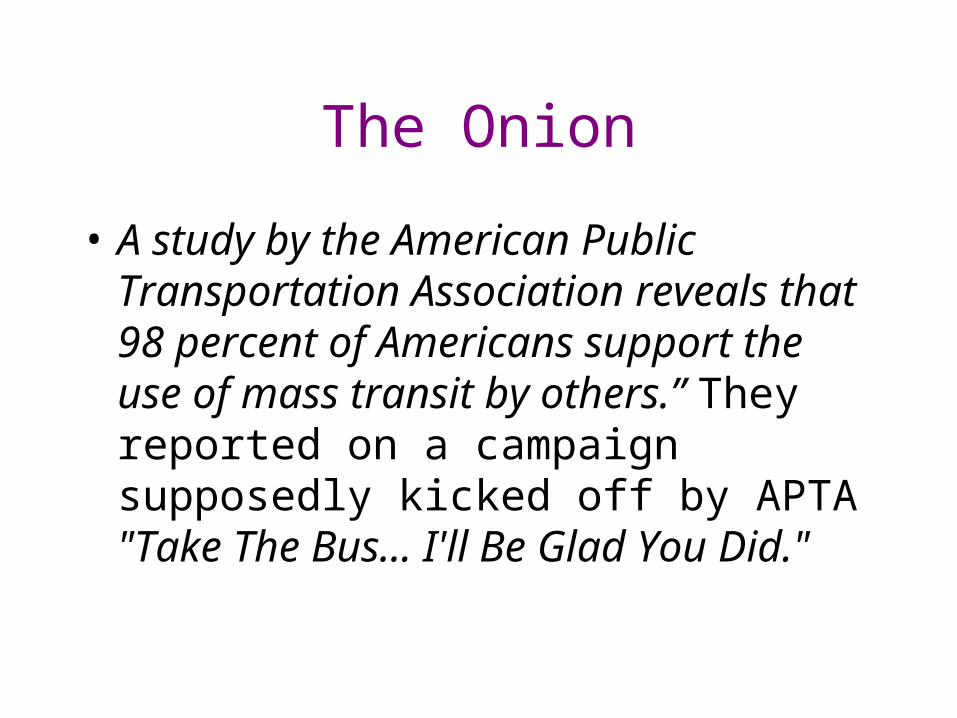
The Onion
• A study by the American Public Transportation Association reveals that 98 percent of Americans support the use of mass transit by others.” They reported on a campaign supposedly kicked off by APTA "Take The Bus... I'll Be Glad You Did."
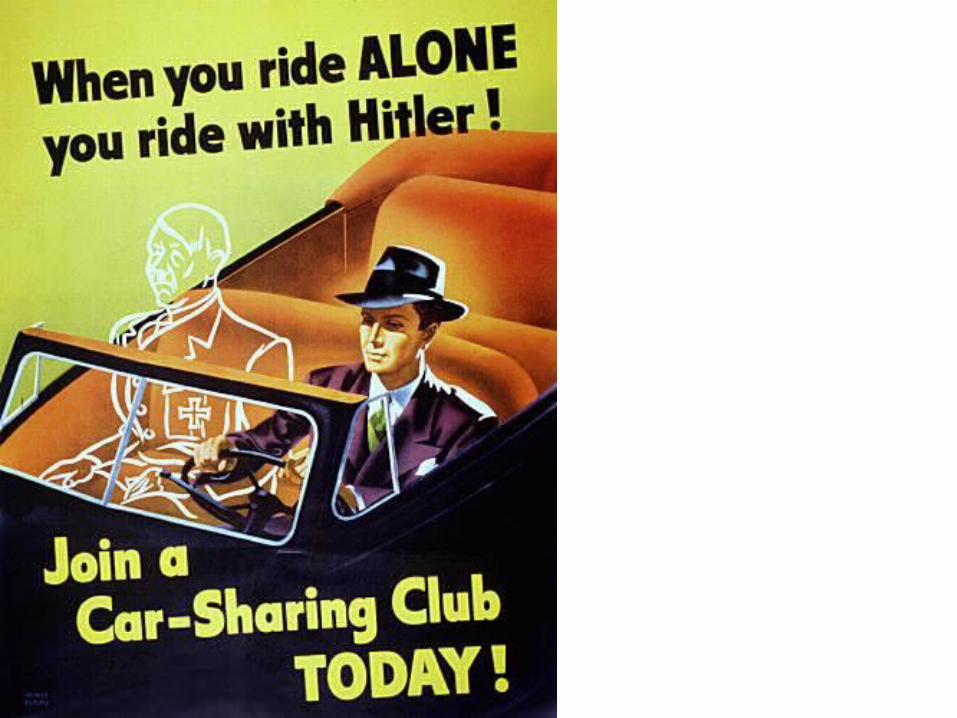
Richardson Arms Race Model
• Lewis Frye Richardson, a Quaker physicist, suggested that an arms race can be understood as an interaction between two states with three motives.
• Grievances between states cause them to acquire arms to use against one another.
• States fear each other and so acquire arms to defend themselves against the others’ weapons.
• Because weapons are costly, their expense creates fatigue that decreases future purchases.

Example
• ArmsRace.xls

How Does This Relate To Transport/Land Use
• Arms Races• Bicycle vs. Car• Bus vs. Car• SUV vs. Car• Communities fighting for development, • Communities building infrastructure
(competitive advantage/disadvantage)
Caveat Planner
• Richardson’s (or any abstract) model is obviously a simplification. We can relax assumptions and make it more realistic (e.g. (dis)economies of scale associated with arms … does fatigue per unit of armament increase or decrease with total level of armaments?)

Prisoner’s Dilemma
Player B
Player A
Cooperate
Defect
Cooperate
[10,10] [-15,15]
Defect [15,-15] [5,5]

Repeated Prisoner’s Dilemma
• If 2 players, and game repeated indefinitely, the incentive is to cooperate.
• However if the end is known, the incentive is to defect on the previous turn.
• Also, if there are multiple players, cooperation becomes much more difficult to achieve

Modal Arms Races

Modal Arms Races (payoffs are time, try to minimize)
Commuter 2
Commuter 1
Bus Car
Bus [10,10]Good bus service
[20, 5]Poor bus service
Car [5,20]Car takes advantage of empty roads
[15,15] congestion sets in

Travel Time as Mode Share Changes
Private vs. Social Effects
1
1.2
1.4
1.6
1.8
2
2.2
2.4
2.6
2.8
0% 10% 20% 30% 40% 50% 60% 70% 80% 90% 100%
Auto Mode Share
Travel Time
System Average Time Auto Time Bus Time

Model 1
• Here we assumed the following:
• MA = Auto Mode Share
• MB = Bus Mode Share = 1 – Auto Mode Share
• TA = Auto Travel Time
• TB = Bus Travel Time
€
TA = 1+ 0.15MA
0.75
⎛
⎝ ⎜
⎞
⎠ ⎟4
€
TB = TA +MA + 0.1
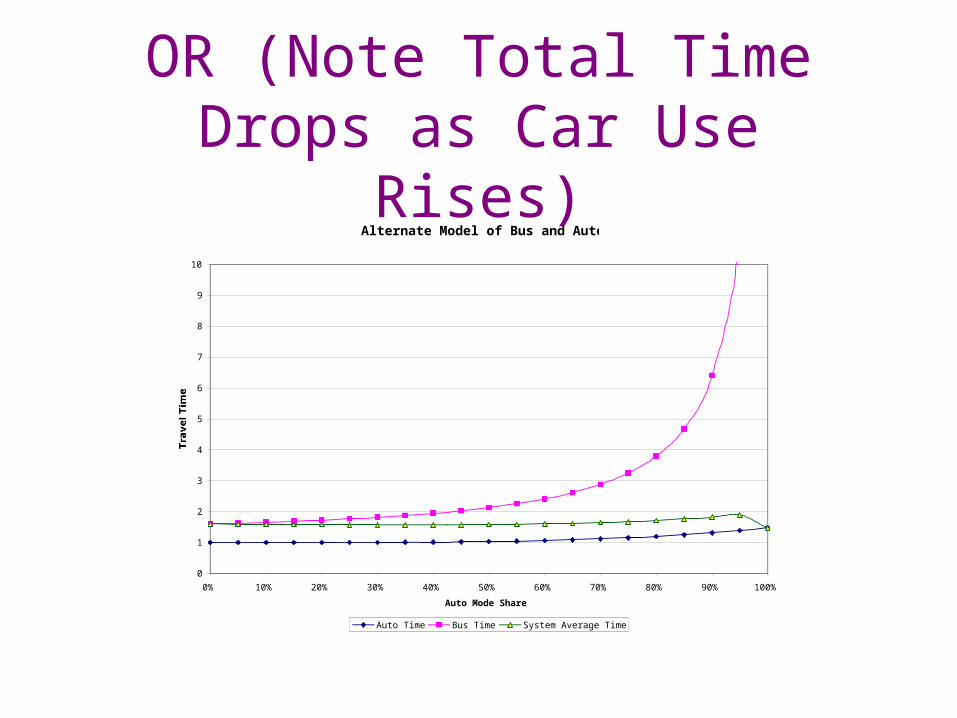
OR (Note Total Time Drops as Car Use Rises)
Alternate Model of Bus and Auto
0
1
2
3
4
5
6
7
8
9
10
0% 10% 20% 30% 40% 50% 60% 70% 80% 90% 100%
Auto Mode Share
Travel Time
Auto Time Bus Time System Average Time

• D = Schedule Delay
€
TB = TA +D + 0.1
Model 2
€
D =0.5
MB

Implications
• Driving is always faster than riding the bus.
• Total travel time would be minimized if everyone rode the bus. Buses could operated frequently and more directly.
• However, in the absence of cooperation, the rational outcome is for everyone to drive.
• Cooperation is difficult to achieve in multi-player games.

Cooperation
• How can cooperation be achieved?
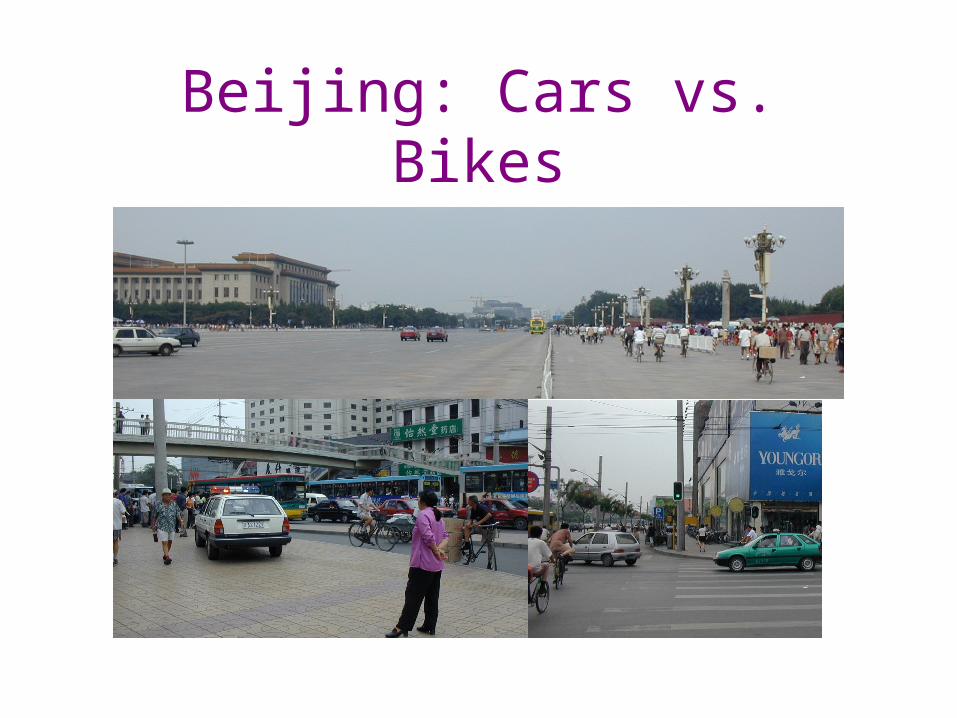
Beijing: Cars vs. Bikes

Individual Rationality
• Assumption: Individuals will do what is in their own long term interest.
• This can’t always be measured.• Max U = f( time, money,
socioeconomics, demographics, etc.)• Probability of taking a mode: Pm =
eUm/∑eUm
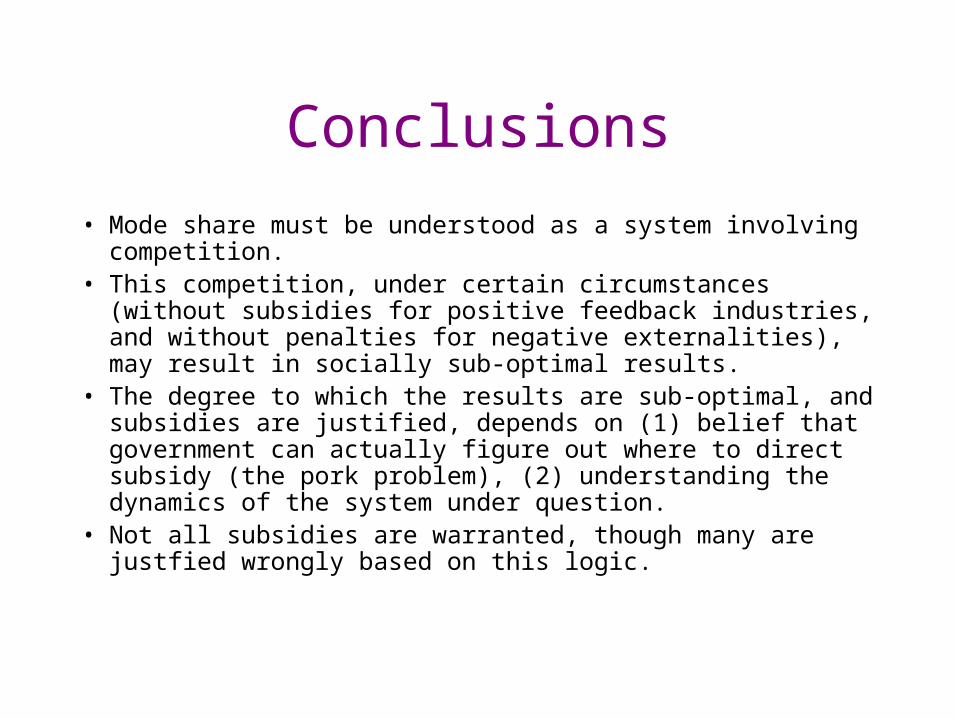
Conclusions
• Mode share must be understood as a system involving competition.
• This competition, under certain circumstances (without subsidies for positive feedback industries, and without penalties for negative externalities), may result in socially sub-optimal results.
• The degree to which the results are sub-optimal, and subsidies are justified, depends on (1) belief that government can actually figure out where to direct subsidy (the pork problem), (2) understanding the dynamics of the system under question.
• Not all subsidies are warranted, though many are justfied wrongly based on this logic.