Embed Size (px)
Citation preview

1
Arlington Police DepartmentCrime Management
Ron Andrews
Blake Robinson
Advisors: Bill Edmonds, Jim Mallard & Chief Bowman

2
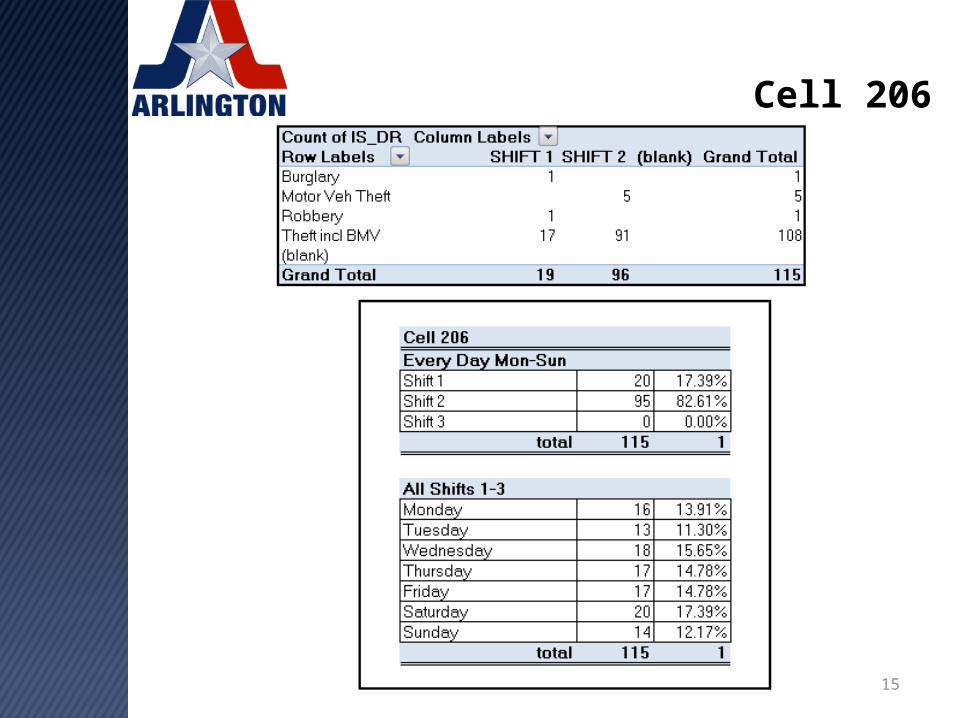
Perplexing the mind?• Where would crime incidences only occur during the day (up till 10:00pm) ?
and• At a rate of four times the surrounding areas?
and• Mostly affect motor vehicles?
– Hint: Data Analysis Intuition & cell 206

3
Agenda• Executive Summary
– Nature of Project
• APD Overview– Primary Goals
• Current Operations• Geographical Information System• Cell & Grid Development• Statistical & Data Analysis
– Incident Concentration
• Model Development– Assignment Network (Pure Network)
• Recommendations & Results

4
Executive Summary
• Management of Crime• Goal: Reduction of Crime Incidents by
25% over the next 3 years• Insight into class one crimes (burglary,
theft, murder, homicides and rape) and raw data
5
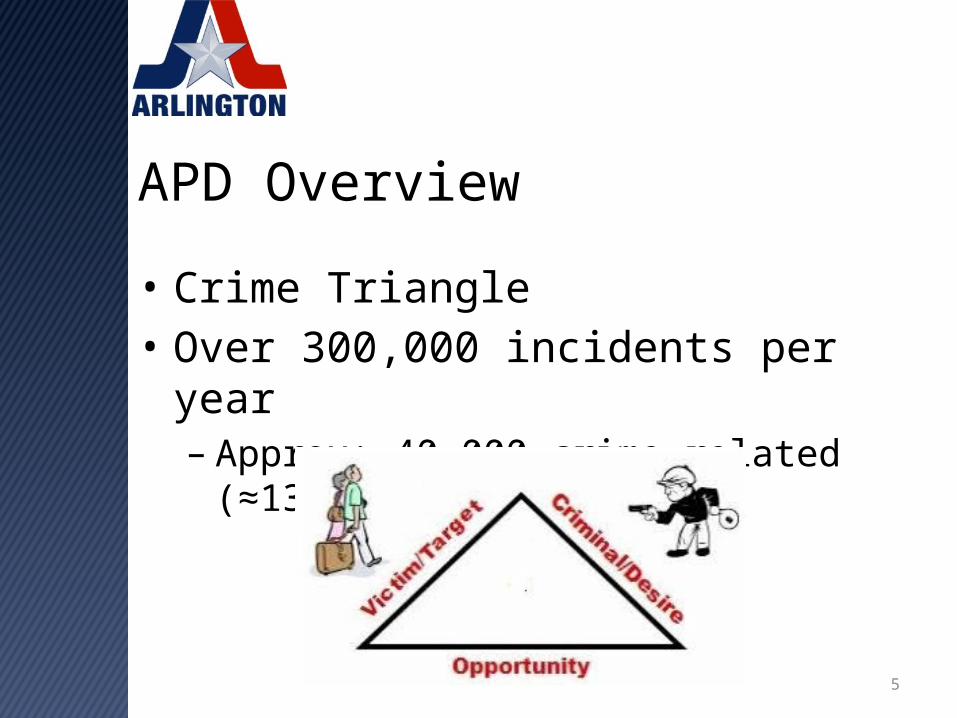
APD Overview
• Crime Triangle• Over 300,000 incidents per year– Approx: 40,000 crime related (≈13%)

6
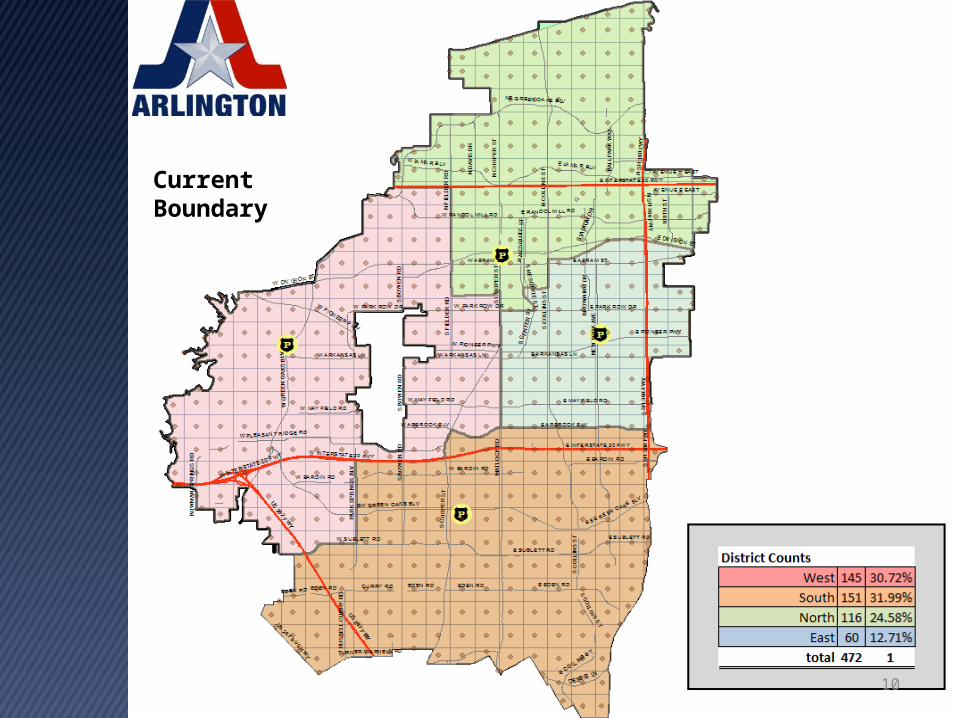
Current Operations
• 4 Police Districts– North, South, East, West– Police Station
• How police incidences are recorded • Incidences are assigned priorities • Insight into crime by location limited

7
Geographical Information System• G.I.S is a system that captures, stores, analyzes, manages
and presents data with reference to geographic location• Provides detailed information which is mapable • How do you effective redraw each district boundary line
to effectively serve each area?

8
Grid & Cell Development
• Total Cells: 472 • ½ Mile cell structure • 1000 feet cell Structure• Euclidean distance at centroid

9
ArcGIS
10
Current Boundary

11
Statistical & Data Analysis
• Bar Chart• Scatter Chart• Arlington total cell statistics• Outlier Cell 206• Incident Concentration

12
1 17 33 49 65 81 97 1131291451611771932092252412572732893053213373533693854014174334494650
20
40
60
80
100
120
140
Bar Chart: Incident Totals
Series1
Cell Number
Incid
ents
Per
Cel
l

13
0 50 100 150 200 250 300 350 400 450 5000
20
40
60
80
100
120
Scatter Plot: Incident Totals
Series1
Cell Number
Num
ber o
f Inc
iden
ts

14
Combined Cells 1-472
15
Cell 206

16
Incident ConcentrationCells: 181, 180, 179, 207, 206, 205, 234, 233, 232, 263, 262, & 261

17
Incident ConcentrationCells: 181, 180, 179, 207, 206, 205, 234, 233, 232, 263, 262, & 261

18
Model Development
• District Boundaries• Constraints (can be ambiguous)– Distance– Time– Volume– Political – Operational

19
Model Development Cont.
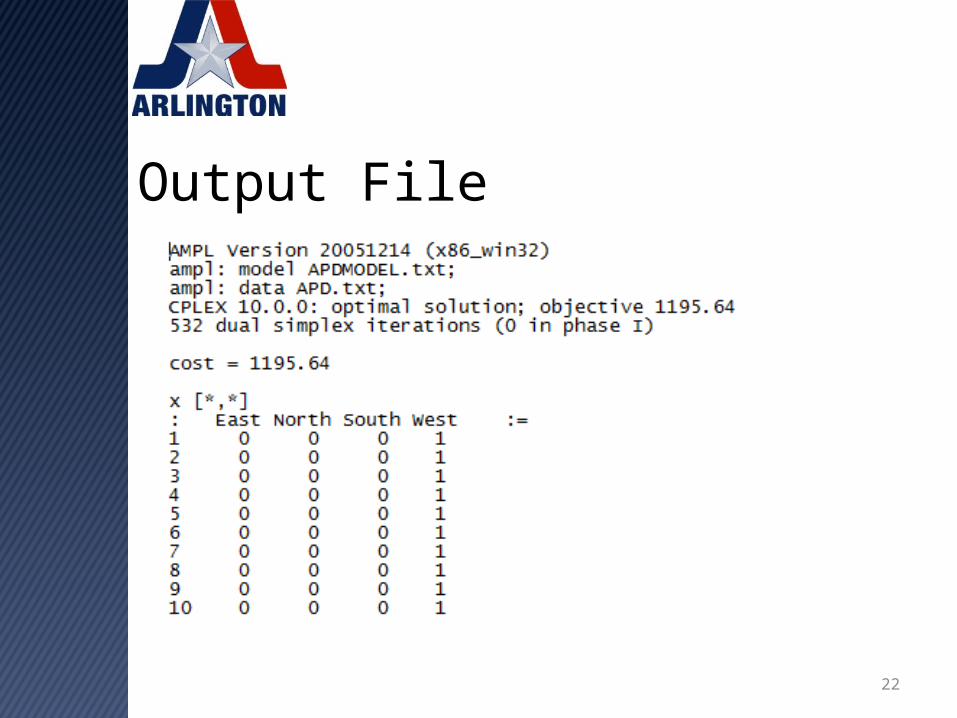
• Assignment Network (Pure Network)• 1888 Variables• 476 Constraints• 1 Objective Function

20
Model File

21
Data File
22
Output File

23
District Boundary Changes

24*New Boundaries not placed accordingly to scale*
New Boundary

25
Recommendations & Results• Plans to help reduce crime incidents in target
location:– Immediate Impact
• Police towers• Higher Police presence• Reminding safety cards on vehicle windshields
– Long Term• Centralized and monitored entrance to mall• Parking Garage vs Parking Lot

26
Recommendations & Results Cont.
• Plans for utilization of assignment network model:–Minor changes in district boundaries

27
Questions


![Mallard -v- The Queen - [2003] WASCA 296 - Polygraphantipolygraph.org/litigation/mallard/mallard-v-the-queen.pdf · committed by the killer - Whether genuine "confession" or mere](https://img.dokumen.tips/doc/110x75/5a86f9c27f8b9afc5d8d7bcc/mallard-v-the-queen-2003-wasca-296-po-by-the-killer-whether-genuine-confession.jpg)