Embed Size (px)
Citation preview

Arlington County
The State of Affordable Housing
May 14, 2014
Housing Affordability– Building a Sustainable Future

Rental Housing Trends and Projections
Analyzed existing trends over past 10 years Committed Affordable Units (CAFS) Market Rate Affordable Units (MARKS)
60% Area Median Income (AMI) 80% AMI
Market Rate Units
Projections over next 10 years Straight-line projections
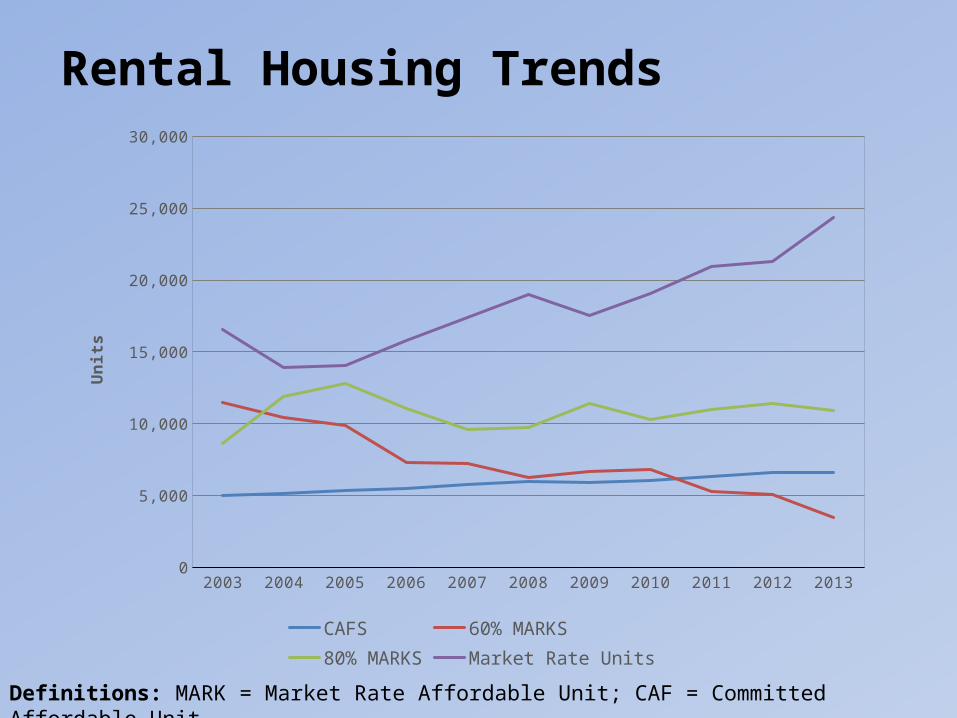
Rental Housing Trends
Definitions: MARK = Market Rate Affordable Unit; CAF = Committed Affordable Unit
2003 2004 2005 2006 2007 2008 2009 2010 2011 2012 20130
5,000
10,000
15,000
20,000
25,000
30,000
CAFS 60% MARKS 80% MARKS Market Rate Units
Uni
ts

So Where Have the MARKS Gone?
1,218Condo Conversion
10.5%
1,367 Net Rede-
velopment 11.8% 581
Redevel-opment
CAFs 5.0%
1,948Preserved as CAFs 16.9%
1,419Renovation
12.3%
5,014Rent In-
crease43.4%

Rental Housing Trends & Projections
Note: Straight-line projection assuming 4-year avg. percent growth/decline continues into future
Projections
2003 2004 2005 2006 2007 2008 2009 2010 2011 2012 2013 2014 2015 2016 2017 2018 2019 2020 2021 2022 20230
5,000
10,000
15,000
20,000
25,000
30,000
35,000
CAFS 60% MARKS 80% MARKS Market Rate Units
Uni
ts
Trends

Regional Home Ownership Trends
Year Avg. Sales Price
Avg. Annual % Change in
Price
Total Sales
Historical/Cultural Notes of Interest
1980 $90,744 -- 19,527 Pac-Man video game released
1985 $113,120 5% 22,422 ‘Cosby’ is top TV show
1990 $174,616 11% 23,278 Milli Vanilli admit to lip-synching
1995 $211,098 4% 13,783 Bullets change name to Wizards
2000 $252,374 4% 26,062 Y2K - The world does not end!
2005 $537,116 23% 29,235 Madonna ties Elvis for most Top 10 singles
2010 $469,018 -3% 17,858 Apple releases Ipad
2013 $540,034 3% 20,355 ‘Selfie’ and ‘Twerk’ added to dictionary
Includes Arlington, Alexandria, Fairfax, and Falls ChurchSource: Sun Gazette - April 2014 Spring Real Estate Guide

Arlington Home Ownership TrendsYear Avg. Sales Price Percent Change in
PriceTotal Sales
SINGLE FAMILY
Aug ‘10 to July ‘11 $770,600 -- 915
Aug ‘11 to July ‘12 $786,332 2% 1,078
Aug ‘12 to July ‘13 $826,705 5% 1,118
TOWNHOUSE
Aug ‘10 to July ‘11 $684,318 -- 248
Aug ‘11 to July ‘12 $692,050 1% 242
Aug ‘12 to July ‘13 $731,728 6% 243
CONDOMINIUM
Aug ‘10 to July ‘11 $434,125 -- 1,288
Aug ‘11 to July ‘12 $440,680 2% 1,291
Aug ‘12 to July ‘13 $439,810 -0.2% 1,550

8
Who are we Housing?

9
Who Needs our Housing?

10
Who Needs our Housing?

11
Who Needs our Housing?

12
Who Needs our Housing?

“Out of the Box” Thinking
Modular units?

“Out of the Box” Thinking
Public Land for
Public Good?

“Out of the Box” Thinking
Infill Development?

“Out of the Box” Thinking
Pop Ups?

Sneak Peak - 2015 State of Affordable Housing
Affordable Arlington
An overview of the newest
Comprehensive Plan element
Coming Soon