Embed Size (px)
Citation preview

Prepared for
The Association of Residential Letting Agents
ARLA Members Survey
of the Private Rented Sector
Fourth Quarter 2013
Prepared by:
O M Carey Jones 5 Henshaw Lane
Yeadon Leeds
LS19 7RW
December, 2013

Page 2
CONTENTS
Page
1. INTRODUCTION & BACKGROUND 4
2. METHODOLOGY 5
3. SUMMARY 6
4. RESULTS 8
4.1 Geographic location (Q.1) 9
4.2 Proportion of portfolio made up of investment property (Q.3) 10
4.3 Number of purely investment properties managed (Q.4) 13
4.4 Average value of rented residential properties (Q.5) 17
4.5 Average rental return on rented residential property (Q.6) 25
4.6 Average void period per year (Q.7) 33
4.7 Number of new tenancies (not renewals) signed up in the last three months (Q.8) 36
4.8 Balance of supply & demand in the rented residential property sector (Q.9) 39
4.9 Average length of continuous stay in property (Q.10) 43
4.10 Change in achievable rent levels over last 6 months (Q.11) 46
4.11 Are you seeing an increase in rental property coming onto the market because it cannot be sold? (Q.12) 51
4.12 For which types of property are you seeing an increase in rental properties coming onto the market because they cannot be sold? (Q.13) 54
4.13 Have you seen an increase in the number of tenants struggling to meet rental payments in the last six months? (Q.14) 57

Page 3
4.14 Are you aware of an increase in tenants asking lenders for references on potential landlords to ensure they are financially viable? (Q.15) 59
4.15 Have you seen an increase in tenants haggling with landlords over rents in the last six months? (Q.16) 61
4.16 What proportion of potential/existing landlord & tenant clients ask if you are licensed? (Q.17) 63
4.17 Have you seen an increase in the last twelve months in the proportion of potential/existing landlord and tenant clients asking if you are licensed? (Q.18) 68
4.18 Regarding the proposal in the Government’s Immigration Bill that prospective tenants’ immigration status be checked, would you feel confident that you could make those checks? 70
4.18 How are landlords currently acting over their net investment in residential property (Q.19) 72
4.19 Types of new prospective tenants currently encountered most often (Q.20) 77

Page 4
1. INTRODUCTION & BACKGROUND
ARLA is keen to ensure that the service it provides to its members is relevant to their needs and takes account of the specific and unique requirements of residential letting agents and their investor landlords.
In order to help achieve this, ARLA has commissioned research to ensure that they are kept up to date with agents’ requirements and concerns as they change with economic conditions, hopes and fears.
The research is conducted by Owen Carey Jones who specialises in the UK mortgage market and currently conducts several regular quarterly surveys of residential landlords and financial advisers on behalf of a number of clients.

Page 5
2. METHODOLOGY
ARLA members were emailed during November with the URL for the on-line survey and asked to go on-line to complete the survey and by the closing date 643 members had completed the survey on-line. These responses were analysed and tables of data produced upon which this report is based.

Page 6
3. SUMMARY
• Compared with three months ago, the average weighted rental return for houses is down from 5.2% to 5.0% and the average weighted rental return for flats is down from 5.4% to 5.2%. These changes do no more than reverse the changes seen three months ago.
• On balance ARLA members report increased achievable rent levels over the last six months on all types of rented property. However, the average proportion of respondents across all property types who say they think achievable rent levels have increased over the last six months has fallen from 44% to 39%.
• The overall average capital asset value of rented houses has risen by 3.7% over the last three months, more than reversing the fall seen three months ago. This increase has come as a result of substantial increases in the average value of rented houses for those in the Rest of the South East (up by 8.2%) and those in the Rest of the UK (up by 9.6%). These increases outweighed a decrease of 1.2% for those managing properties in Prime Central London.
• Over the same period, the overall average value of rented flats rose by 1.7%, the fourth increase in succession. This increase has come as a result of increases in the average value of rented flats for those in the Rest of the South East (up by 5.8%) and those in the Rest of the UK (up by 7.2%). These increases outweighed a decrease of 2.6% for those managing properties in Prime Central London.
• Since the last survey three months ago, demand in the rented residential property sector has weakened a little in terms of the overall proportion of respondents saying that there are more tenants than there are properties available for them, with the figure falling quite sharply from 52% to 46%, the third fall in succession. This overall decline was reflected in the figures for all the broad geographic areas.
• The proportion of ARLA members who think landlords are currently increasing their net investment in residential property by buying properties rose this quarter from 37% to 43%, more than wiping out the fall seen three months ago and again taking the figure to its highest level since the question was first asked more than nine years ago. The proportion of respondents who think landlords are currently decreasing their net investment by selling properties is down from 16% to 15%. As a result of these changes, the margin between the proportion saying landlords are buying and the proportion saying they are selling is now the widest we have ever seen.
• Compared with three months ago, the average void period is up from 2.9 weeks to 3.0 weeks, yet again reversing the increase seen in the previous quarter, whilst the average number of new tenancies signed up in the preceding three months is up slightly from 34 to 35 tenancies.
• The average proportion of ARLA members’ offices’ portfolios which are made up of investment property is almost unchanged compared with three months ago at 56% and the average number of purely investment properties which are managed by ARLA members’ offices is also almost unchanged at 140 properties.

Page 7
• On average, ARLA members say that tenants remain in the same property for a period of 19.4 months, a figure which is down a little from 19.6 months in the third quarter.
• The proportion of ARLA members’ offices who believe that they are seeing an increase in rental property coming onto the market because it cannot be sold has fallen yet again over the last three months, this time from 21% to 18%, taking the figure to it’s lowest level since this question was first asked more than 5 years ago, when it stood at 93%. Detached and semi-detached houses are still the types of property most likely to be coming onto the market for this reason.
• There has been another fall in the proportion of ARLA members’ offices saying that they have seen an increase in the number of tenants struggling to meet rental payments in the last six months with the figure dropping from 35% to 27%, an all time low compared with when the question was first asked in 2009 at which time the figure stood at 65%. However, there has been a rise in the proportion saying that they have seen an increase in tenants haggling with landlords over rents in the last six months with that figure rising from 45% to 48%, partially reversing the decrease seen last quarter.
• Over the last three months, there has been no change in the proportion of ARLA members’ offices saying that they are aware of an increase in tenants asking lenders for references on potential landlords to ensure they are financially viable, with the figure remaining at 10%.
• Half of ARLA members’ offices (50%, down from 52% three months ago) say that none of their potential or existing tenant clients ask them if they are licensed, a figure which falls to little more than a third when it relates to potential or existing landlord clients (36%, unchanged compared with three months ago). Nevertheless, a small minority say that most or all of their potential and existing tenant and landlord clients ask this question (2% and 6% respectively). Little more than one in twenty ARLA members’ offices (6%, down from 8% three months ago) think that the proportion of potential or existing clients asking if they are licensed has increased over the last 12 months.
• With regard to the proposal in the Government’s Immigration Bill that prospective tenants’ immigration status be checked, half of ARLA members’ offices (50%) say that they feel confident that they could make those checks with only a little over a quarter (27%) saying they do not. This leaves less than a quarter (22%) who are unsure whether or not they would feel confident making the necessary checks.
• ARLA members’ offices are currently most likely to encounter, as new prospective tenants, people who have been renting for some years because they prefer renting to buying (average ranking of 1.7) with those who would be first time buyers except that they cannot get a mortgage coming a close second (average ranking of 1.8). This reverses the situation seen three months ago, which put these two tenant types the other way round. Least likely to be encountered are people who are having or have had their house repossessed (average ranking of 3.7) with those who are selling or have sold their house because they can no longer afford the mortgage being in third place (average ranking of 2.9).

Page 8
4. RESULTS
The following sections detail the results of the survey for the fourth quarter of 2013. The results have been broken down into three broad geographic areas which are Prime Central London (comprising London & South East based respondents who manage properties in Prime Central London), the Rest of the South East and the Rest of the UK.
Data has also been included for each of the regions making up the UK as shown in the table in section 4.1 below but it should be remembered that the number of respondents from some regions is relatively small and data for these regions should therefore be treated with a degree of caution as it will tend to vary quarter by quarter quite independently of any actual changes which may have taken place. For this reason, we have used comparative data averaged over three quarters. This is known as a three quarter moving average and helps to iron out any temporary fluctuations occurring quarter by quarter because of relatively small sample sizes.

Page 9
4.1 Geographic Location (Q.1)
The South East, including London, was the region with the highest proportion of ARLA member offices responding, accounting for six out of ten respondents (60%).
After the South East, the South West and the Midlands (12% and 11% respectively) were the regions with the most respondents.
Geographic Percent of Respondents (%) Region Q2.13 Q3.13 Q4.13
Central London 15.0 14.1 16.6 Rest of London (inside M25) 14.6 12.4 13.1 South East (excl. London) 30.6 33.7 30.0 South West 11.8 11.1 11.8 Midlands 12.0 11.1 11.4 North West 4.9 6.3 5.9 North East 3.7 4.6 4.2 Scotland/Wales/NI 7.3 6.7 7.0
Base: All respondents (507) (524) (643)
Compared with the third quarter survey, there were higher proportions of respondents from Central London, the Rest of London, the South West, the Midlands and Scotland, Wales & Northern Ireland and there were lower proportions from the South East, the North West and the North East.
Page 10
4.2 Proportion of Portfolio Made Up of Investment Property (Q.3)
More than eight out of ten respondents (85%) said that more than a quarter of their portfolio is investment property with more than a quarter (26%) saying that more than three quarters of theirs is investment property. Investment properties comprise a tenth or less of their portfolio for just one in twenty offices (5%).
Analysis of the responses to this question reveals that, on average, investment properties account for 56% of ARLA member offices’ portfolios.
Proportion Percent of Respondents (%) of Portfolio Prime Rest Rest All London of SE of UK Regions
None 0.6 1.4 - 0.6 Up to 10% 2.5 2.3 6.6 4.0 11% to 25% 8.0 12.2 8.1 9.5 26% to 50% 24.5 23.1 23.2 23.5 51% to 75% 36.2 36.2 33.6 35.1 Over 75% 27.6 24.0 27.4 26.3 Not stated 0.6 0.9 1.2 0.9
Base: All respondents (163) (221) (259) (643)
Differences between the broad geographic areas are very small with investment properties making up between 54% and 58% of portfolios.
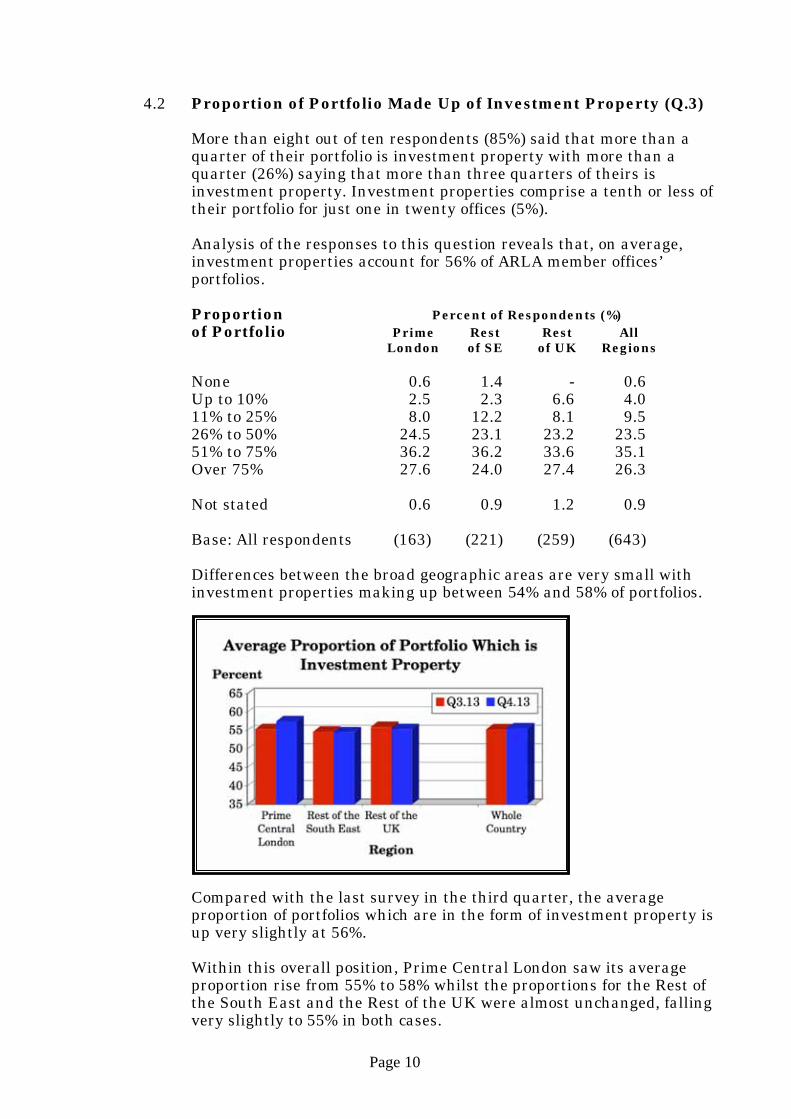
Compared with the last survey in the third quarter, the average proportion of portfolios which are in the form of investment property is up very slightly at 56%. Within this overall position, Prime Central London saw its average proportion rise from 55% to 58% whilst the proportions for the Rest of the South East and the Rest of the UK were almost unchanged, falling very slightly to 55% in both cases.
Page 11
Geographic Average Proportion of Portfolio (%) Area Q1.13 Q2.13 Q3.13 Q4.13
Prime Central London 60.8 59.7 55.4 57.5 South East 54.1 53.0 54.7 54.5 Rest of UK 53.4 55.0 56.0 55.4
All Regions 55.3 55.5 55.3 55.6
Base: All respondents (527) (507) (524) (643)
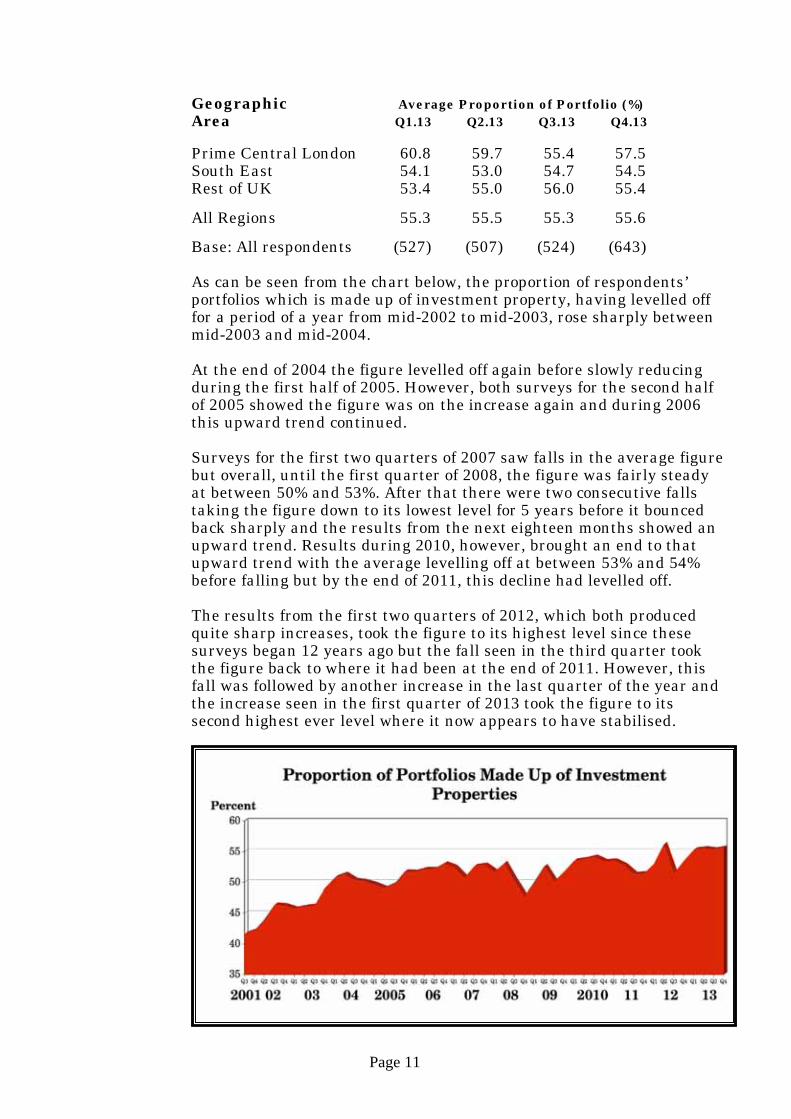
As can be seen from the chart below, the proportion of respondents’ portfolios which is made up of investment property, having levelled off for a period of a year from mid-2002 to mid-2003, rose sharply between mid-2003 and mid-2004.
At the end of 2004 the figure levelled off again before slowly reducing during the first half of 2005. However, both surveys for the second half of 2005 showed the figure was on the increase again and during 2006 this upward trend continued.
Surveys for the first two quarters of 2007 saw falls in the average figure but overall, until the first quarter of 2008, the figure was fairly steady at between 50% and 53%. After that there were two consecutive falls taking the figure down to its lowest level for 5 years before it bounced back sharply and the results from the next eighteen months showed an upward trend. Results during 2010, however, brought an end to that upward trend with the average levelling off at between 53% and 54% before falling but by the end of 2011, this decline had levelled off. The results from the first two quarters of 2012, which both produced quite sharp increases, took the figure to its highest level since these surveys began 12 years ago but the fall seen in the third quarter took the figure back to where it had been at the end of 2011. However, this fall was followed by another increase in the last quarter of the year and the increase seen in the first quarter of 2013 took the figure to its second highest ever level where it now appears to have stabilised.

Page 12
Regional Analysis The three quarter moving average proportions for each of the regions of the UK are shown in the table below from which it can be seen that there is not a great deal of difference between the regions on this question although, for offices in Central London, investment properties do form a higher proportion of their portfolios than they do for any other region. In the Midlands, the proportions of investment properties are also slightly higher than for the rest of the country excluding Central London.
Geographic Average Proportion of Portfolio (%) Region (three quarter moving average) Q1.13 Q2.13 Q3.13 Q4.13
Central London 64.6 65.4 64.2 62.4 Rest of London 53.2 55.0 55.3 54.1 Rest of South East 51.7 53.0 53.8 54.0 South West 51.2 52.2 53.7 54.7 Midlands 57.8 58.8 60.2 59.8 North West 57.4 56.6 55.0 56.0 North East 51.2 52.4 54.1 55.2 Scotland/Wales/NI 50.5 54.2 53.1 54.1
Base: All respondents (527) (507) (524) (643)
Compared with the three quarter moving average from three months ago, there have been mixed changes with some regions seeing an increase and others a decrease. Central London and the Rest of London were the only regions to see noticeable decreases with all bar two of the other regions seeing noticeable increases. The exceptions were the Rest of the South East which saw a marginal increase and the Midlands which saw a marginal decrease.
Page 13
4.3 Number of Purely Investment Properties Managed (Q.4)
By and large, ARLA members’ offices manage substantial numbers of purely investment properties with nearly half (46%) saying that they manage over a hundred properties and more than eight out of ten (84%) managing in excess of 20 properties.
Analysis of these responses shows that the average number of purely investment properties managed by ARLA members’ offices is currently 140.
Number of Percent of Respondents (%) Properties Prime Rest Rest All London of SE of UK Regions
Up to 5 3.1 2.7 2.7 2.8 6 to 10 8.6 2.3 3.5 4.4 11 to 20 11.0 7.2 3.9 6.8 21 to 50 23.3 19.9 13.9 18.4 51 to 100 20.2 18.6 21.6 20.2 Over 100 31.9 47.5 52.9 45.7 Not stated 1.8 1.8 1.5 1.7
Base: All respondents (163) (221) (259) (643)
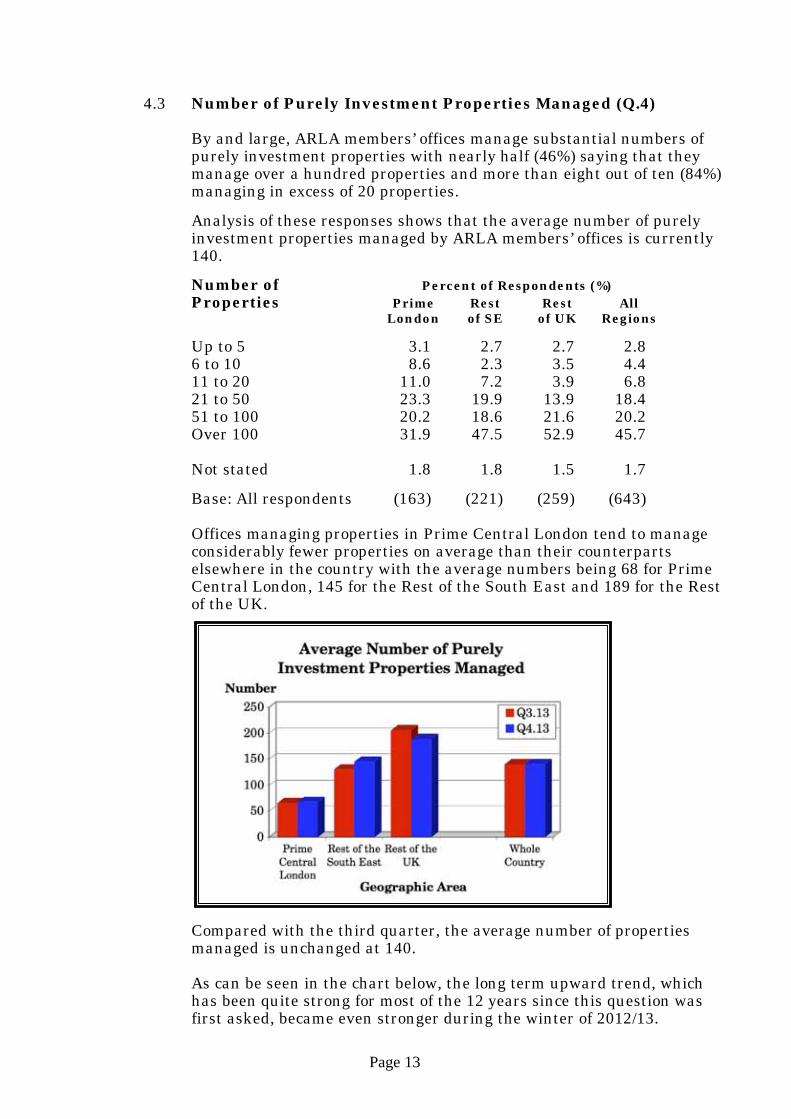
Offices managing properties in Prime Central London tend to manage considerably fewer properties on average than their counterparts elsewhere in the country with the average numbers being 68 for Prime Central London, 145 for the Rest of the South East and 189 for the Rest of the UK.
Compared with the third quarter, the average number of properties managed is unchanged at 140. As can be seen in the chart below, the long term upward trend, which has been quite strong for most of the 12 years since this question was first asked, became even stronger during the winter of 2012/13.
Page 14
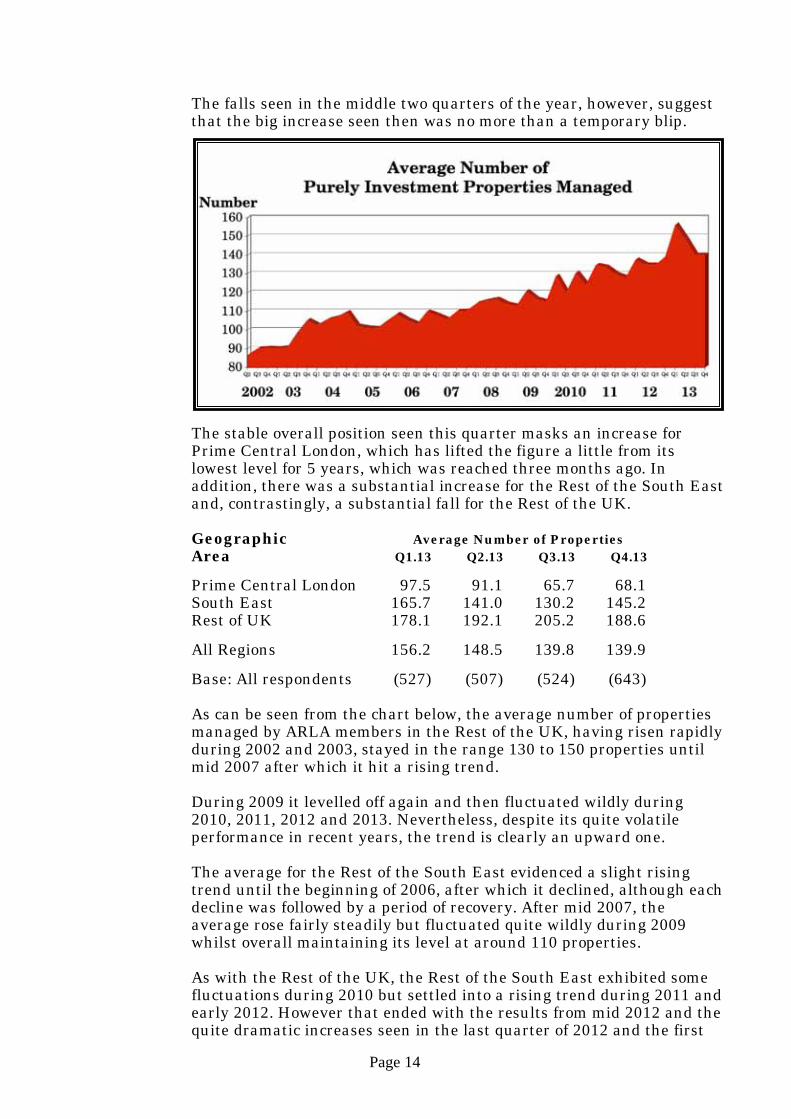
The falls seen in the middle two quarters of the year, however, suggest that the big increase seen then was no more than a temporary blip.
The stable overall position seen this quarter masks an increase for Prime Central London, which has lifted the figure a little from its lowest level for 5 years, which was reached three months ago. In addition, there was a substantial increase for the Rest of the South East and, contrastingly, a substantial fall for the Rest of the UK. Geographic Average Number of Properties Area Q1.13 Q2.13 Q3.13 Q4.13
Prime Central London 97.5 91.1 65.7 68.1 South East 165.7 141.0 130.2 145.2 Rest of UK 178.1 192.1 205.2 188.6
All Regions 156.2 148.5 139.8 139.9
Base: All respondents (527) (507) (524) (643)
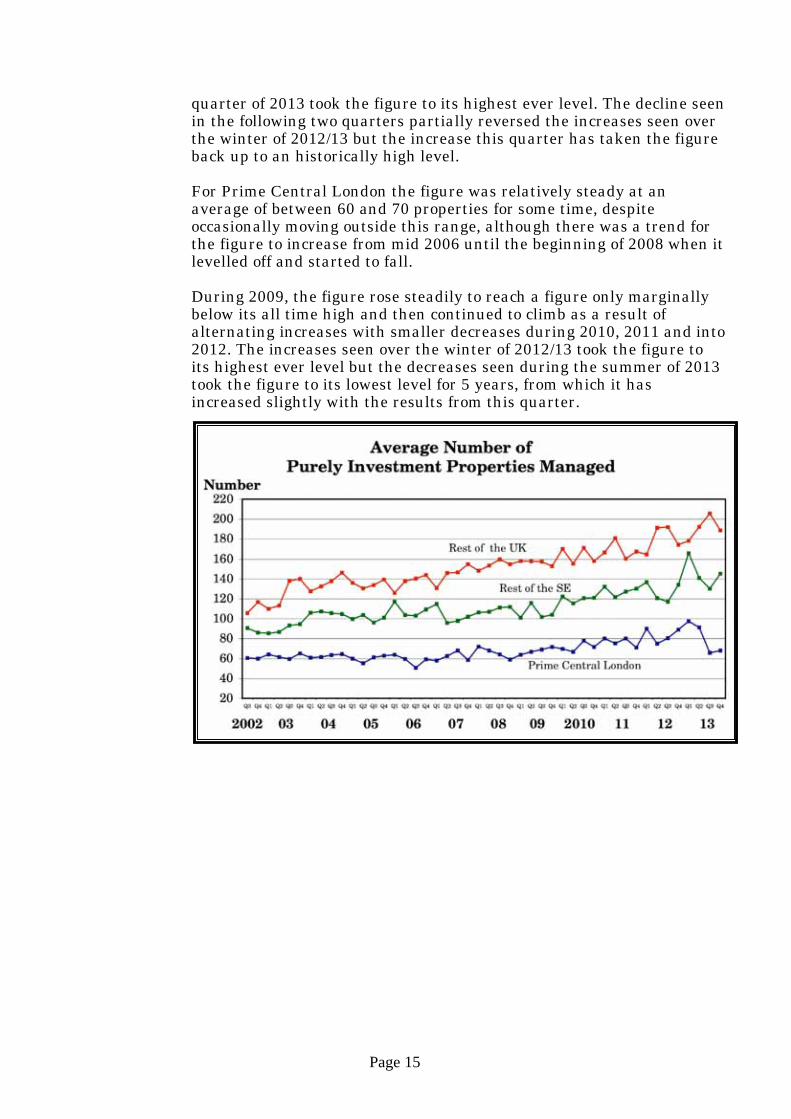
As can be seen from the chart below, the average number of properties managed by ARLA members in the Rest of the UK, having risen rapidly during 2002 and 2003, stayed in the range 130 to 150 properties until mid 2007 after which it hit a rising trend. During 2009 it levelled off again and then fluctuated wildly during 2010, 2011, 2012 and 2013. Nevertheless, despite its quite volatile performance in recent years, the trend is clearly an upward one. The average for the Rest of the South East evidenced a slight rising trend until the beginning of 2006, after which it declined, although each decline was followed by a period of recovery. After mid 2007, the average rose fairly steadily but fluctuated quite wildly during 2009 whilst overall maintaining its level at around 110 properties. As with the Rest of the UK, the Rest of the South East exhibited some fluctuations during 2010 but settled into a rising trend during 2011 and early 2012. However that ended with the results from mid 2012 and the quite dramatic increases seen in the last quarter of 2012 and the first
Page 15
quarter of 2013 took the figure to its highest ever level. The decline seen in the following two quarters partially reversed the increases seen over the winter of 2012/13 but the increase this quarter has taken the figure back up to an historically high level.
For Prime Central London the figure was relatively steady at an average of between 60 and 70 properties for some time, despite occasionally moving outside this range, although there was a trend for the figure to increase from mid 2006 until the beginning of 2008 when it levelled off and started to fall. During 2009, the figure rose steadily to reach a figure only marginally below its all time high and then continued to climb as a result of alternating increases with smaller decreases during 2010, 2011 and into 2012. The increases seen over the winter of 2012/13 took the figure to its highest ever level but the decreases seen during the summer of 2013 took the figure to its lowest level for 5 years, from which it has increased slightly with the results from this quarter.

Page 16
Regional Analysis Looking at the results for the individual regions of the UK reveals that the three quarter moving average number of purely investment properties managed by respondents’ offices appears to be lower in the southern half of England than elsewhere, with the highest number (320) being found in the North East and the lowest number (72) in Central London.
Geographic Average Number of Properties Region (three quarter moving average) Q1.13 Q2.13 Q3.13 Q4.13
Central London 93 85 81 72 Rest of London 108 121 112 93 Rest of South East 132 141 140 137 South West 136 120 127 135 Midlands 196 211 224 243 North West 172 185 208 193 North East 268 310 318 320 Scotland/Wales/NI 212 191 188 179
Base: All respondents (527) (507) (524) (643)
Compared with the results from the third quarter, there have been some changes with noticeable decreases for Central London, the Rest of London, the North West and Scotland, Wales & Northern Ireland. Conversely, the South West and The Midlands both had noticeable increases with the biggest increase being for the Midlands (up from 224 to 243). The other two regions, the Rest of the South East and the North East saw hardly any change at all.

Page 17
4.4 Average Value of Rented Residential Properties (Q.5)
Houses
More than four out of ten respondents (43%) said that the average value of a rented house in their area is between £150,000 and £350,000.
Less than one in thirty offices (3%) said that the average is below £100,000 but for more than one in ten respondents (12%), the average in their area is in excess of £1 million.
Analysis of these figures gives an overall weighted average value for a rented house of £464,100.
Average Percent of Respondents (%) Value of Houses Prime Rest Rest All London of SE of UK Regions
Up to £100,000 0.6 0.9 6.6 3.1 £100,001 to £150,000 0.6 6.8 25.9 12.9 £150,001 to £200,000 1.2 18.6 35.9 21.2 £200,001 to £350,000 11.7 32.1 18.9 21.6 £350,001 to £500,000 6.7 20.8 5.4 11.0 £500,001 to £750,000 19.6 9.5 3.5 9.6 £750,001 to £1 Million 16.0 5.4 0.4 6.1 Over £1 Million 38.7 2.7 1.9 11.5 Not stated 4.9 3.2 1.5 3.0
Base: All respondents (163) (221) (259) (643)
There are big differences between the values of rented houses in the different geographical areas with the average for those managing properties in Prime Central London being £952,900 compared with £378,000 for the Rest of the South East and £232,700 for the Rest of the UK.
Compared with the last survey three months ago, the overall weighted average value of rented houses has risen by 3.7% from £447,700 to £464,100, more than reversing the decrease seen three months ago.

Page 18
Within this overall change, the average value of a rented house in Prime Central London has fallen by 1.2%, the second quarterly fall in succession, whilst the average for the Rest of the South East has risen by 8.2%, reversing the fall seen in the third quarter. The average for the Rest of the UK rose even more, by 9.6%, its third increase in succession, and is now at its highest level for more than 6 years. Geographic Average Value of Rented Houses (000s) Area Q1.13 Q2.13 Q3.13 Q4.13
Prime Central London 980.2 973.8 964.7 952.9 South East 373.2 376.8 349.5 378.0 Rest of UK 203.7 210.1 212.3 232.7
All Regions (weighted) 458.7 460.9 447.7 464.1
Base: All respondents (527) (507) (524) (643)
As can be seen from the chart below, between May 2003 and August 2004 the average value of a rented house increased by 16% from £306,100 to £353,800 and, after stabilising for a couple of years, continued rising until the summer of 2007 when it peaked at £442,600. After that, the average fell by 16% before stabilising during 2008 but then fell sharply in mid 2009 to reach a three year low before bouncing back equally sharply in the following two quarters. The results from the surveys in the first half of 2010 confirmed that these increases were not temporary blips but, in the second half of 2010, the average value turned down, ending the upward trend which had run from mid 2009 to mid 2010. Since the beginning of 2011, there have been frequent quarterly fluctuations in the average value of a rented house but, overall, the trend has been upwards and the average is now at it’s highest level since this question was first asked 11 years ago.

Page 19
Regional Analysis Data relating to individual regions of the UK shows that, not surprisingly, by and large the further away from London rented houses are located, the lower is their average value with properties from the Midlands northwards having a similar average value, well below those in the south east of the country. Geographic Average Value of Rented Houses (000s) Region (three quarter moving average) Q1.13 Q2.13 Q3.13 Q4.13
Central London 1,216 1,243 1,255 1,212 Rest of London 560 550 554 584 Rest of South East 357 351 341 342 South West 260 260 276 301 Midlands 174 173 165 167 North West 220 230 217 230 North East 177 177 167 164 Scotland/Wales/NI 196 197 192 192
Base: All respondents (527) (507) (524) (643) Compared with three months ago, the three quarter moving average values of rented houses for some regions have changed noticeably with a noticeable decrease in Central London (3.4%). Conversely, there were noticeable increases for the South West (9.3%), the North West (5.8%) and the Rest of London (5.4%). For the other four regions there was relatively little or no change in the average value of a rented house.

Page 20
Flats
More than four out of ten respondents (41%) said that the average value of a rented flat in their area is between £100,000 and £200,000.
However, nearly one in seven respondents (14%), said that the average value of a rented flat in their area is below £100,000 compared with little more than one in thirty (3.6%) who said that the average value is in excess of £1 million.
Analysis of these figures gives an overall weighted average value for a rented flat of £298,700.
Average Percent of Respondents (%) Value of Flats Prime Rest Rest All London of SE of UK Regions
Up to £100,000 1.8 6.3 27.4 13.7 £100,001 to £150,000 1.8 22.6 42.1 25.2 £150,001 to £200,000 8.0 22.6 14.7 15.7 £200,001 to £350,000 12.9 23.5 5.4 13.5 £350,001 to £500,000 20.2 12.2 1.5 10.0 £500,001 to £750,000 19.0 0.9 1.9 5.9 £750,001 to £1 Million 13.5 0.9 0.4 3.9 Over £1 Million 13.5 0.5 - 3.6 Not stated 9.2 10.4 6.6 8.6 Base: All respondents (163) (221) (259) (643)
As with rented houses, there are big differences between the values of rented flats in the different geographical areas with the average for Prime Central London being £637,200 compared with £234,000 in the Rest of South East and £145,200 in the Rest of the UK.
Compared with the third quarter, the overall weighted average value of a rented flat is up by 1.7% from £293,800 to £298,700. Within that overall position, the average value of rented flats for Prime Central London fell by 2.6% whilst the average for Rest of the South East rose by 5.8% and the average for the Rest of the UK rose by 7.2%.

Page 21
Geographic Average Value of Rented Flats (000s) Area Q1.13 Q2.13 Q3.13 Q4.13
Prime Central London 597.6 618.1 653.9 637.2 South East 212.5 220.9 221.1 234.0 Rest of UK 130.8 136.9 135.5 145.2 All Regions (weighted) 275.3 285.8 293.8 298.7
Base: All respondents (527) (507) (524) (643)
As can be seen from the chart below, between 2003 and 2007, the average value of a rented flat increased by 46% from £189,100 in the second quarter of 2003 to £275,800 in the third quarter of 2007 despite the occasional temporary downturn. However, after that, average values of flats fell by 15%, reaching a three year low of £234,900 in the second quarter of 2009 before bouncing back sharply. The first three quarters of 2010 saw small falls in the average value of rented flats but these were reversed in the next three quarters to leave the figure at an historically high level. Against this backdrop, despite the sharp fluctuations seen in the second half of 2011 and the first two quarters of 2012, the overall trend remained upwards but the fall seen in the third quarter of 2012 brought that to an end. The increases seen during 2013, however, have more than reversed that fall and taken the figure to its highest ever level, restoring the long term upward trend seen over the last four years.

Page 22
Regional Analysis As was the case for values of rented houses, results for individual regions of the UK show that, not unexpectedly, by and large, the further north rented flats are located, the lower is their average value. The chart below, showing the three quarter moving average values, shows this quite clearly. Geographic Average Value of Rented Flats (000s) Region (three quarter moving average) Q1.13 Q2.13 Q3.13 Q4.13
Central London 797 798 831 838 Rest of London 321 321 313 334 Rest of South East 201 200 198 200 South West 165 161 168 180 Midlands 107 110 109 112 North West 157 157 142 150 North East 129 120 116 111 Scotland/Wales/NI 132 132 128 124
Base: All respondents (527) (507) (524) (643) Compared with three months ago, there were some noticeable changes in the three quarter moving average values of rented houses for each region with all but two regions seeing changes of 2.6% or more. The regions with decreases were the North East (down by 4.0%), and Scotland, Wales & Northern Ireland (down by 2.6%). The regions with the biggest increases were the South West (up by 7.6%), the Rest of London (up by 6.7%) and the North West (up by 5.6%).

Page 23
Summary
As was to be expected, average values of rented houses are much higher than those of rented flats with the overall weighted average value of a rented house being 55% higher than that of a rented flat. With regard to differences for the three broad geographic areas, the smallest difference was seen by those managing properties in Prime Central London where the average figure for houses is now 50% higher than that for flats. The differences between the values of houses and flats for those in the Rest of the South East and for those in the Rest of the UK are higher with the figures being 62% and 60% respectively.
Geographic Average Value of Properties (000s) Area Houses Flats
Prime Central London 952.9 637.2 Rest of the South East 378.0 234.0 Rest of the UK 232.7 145.2 All Regions (weighted) 464.1 298.7
Base: All respondents (643)
Compared with the third quarter, the average value of rented houses has risen by 3.7% and the average value of rented flats has risen by 1.7%. In both cases, these increases have taken the averages to all time highs. With regard to the broad geographic areas, Prime Central London has seen a decrease in the average value of houses (down by 1.2%) and in the average value of flats (down by 2.6%). Conversely, the Rest of the South East saw quite big rises in the average values of rented houses (up by 8.2%) and rented flats (up by 5.8%) but the Rest of the UK saw the biggest increases for both rented houses (up by 9.6%) and rented flats (up by 7.2%).

Page 24
Regional Analysis Looking at average values of rented houses compared with average values of rented flats within individual regions confirms, not surprisingly, that across all regions, houses command higher prices than flats. However, more interestingly, the data for the three quarter moving average shows that the relative difference is much more marked in the south of England (excluding Central London) where rented house values are between 67% and 75% higher than rented flat values and much less marked in the Midlands and north of England where rented house values are only between 48% and 53% higher than rented flat values. Against this geographical trend, the difference for Central London was just 45% whilst the difference in Scotland, Wales & Northern Ireland (54%) is similar to the north of England. Compared with three months ago, the differences between average prices for rented houses and those for rented flats are similar. Geographic Average Value of Properties (000s) Region (three quarter moving average) Houses Flats
Central London 1,212 838 Rest of London 584 334 Rest of South East 342 200 South West 301 180 Midlands 167 112 North West 230 150 North East 164 111 Scotland/Wales/NI 192 124
Base: All respondents (643)

Page 25
4.5 Average Rental Return on Rented Residential Property (Q.6)
Houses
According to ARLA members’ offices, a rental return of 4% to 5% appears to be the norm for rented houses with getting on for half of respondents (45%) saying that this applies to their area. Analysis of these results reveals a weighted average rental return on rented houses of 5.0%.
Average Percent of Respondents (%) Return Prime Rest Rest All London of SE of UK Regions
Less than 4% 44.2 8.6 7.7 17.3 4% to 5% 25.8 55.2 47.5 44.6 6% 11.7 19.0 19.7 17.4 7% 4.9 5.9 9.3 7.0 8% 0.6 1.4 5.4 2.8 9% to 10% 4.3 4.1 6.6 5.1 11% to 12% 1.8 0.9 0.4 0.9 12% to 15% - - 0.8 0.3 Over 15% 0.6 0.5 0.4 0.5 Not stated 6.1 4.5 2.3 4.0
Base: All respondents (163) (221) (259) (643)
There is considerable difference in rates of return between the three broad geographic areas with the average for those managing properties in Prime Central London being the lowest at 4.2% compared with 5.1% for the Rest of the South East and 5.5% for the Rest of the UK.
Geographic Average Rental Return (%) Area Q1.13 Q2.13 Q3.13 Q4.13 Prime Central London 4.4 4.4 4.5 4.2 South East 5.0 5.1 5.3 5.1 Rest of UK 5.5 5.5 5.6 5.5
All Regions (weighted) 5.0 5.0 5.2 5.0
Base: All respondents (527) (507) (524) (643)
Compared with the third quarter, the overall average weighted rental return on houses is down from 5.2% to 5.0%, reversing the change seen then. This overall change was reflected in the changes seen for each of the broad geographic areas with Prime Central London seeing a fall from 4.5% to 4.2%, the Rest of the South East a fall from 5.3% to 5.1% and the Rest of the UK a fall from 5.6% to 5.5%.

Page 26
Regional Analysis Results for individual regions of the UK show that there is some correlation between where in the UK houses are located and the average rental return earned from them with regions in the north doing better than those in the south. The lowest three quarter moving average rental return (3.8%) was found in Central London and the highest (6.0%) in the North West. Geographic Average Rental Return on Houses (%) Region (three quarter moving average) Q1.13 Q2.13 Q3.13 Q4.13
Central London 3.9 3.5 3.6 3.8 Rest of London 5.2 5.2 5.2 5.1 Rest of South East 5.1 5.1 5.2 5.2 South West 5.0 5.1 4.9 5.0 Midlands 5.7 5.7 5.6 5.7 North West 6.3 6.0 6.0 6.0 North East 6.0 5.8 5.5 5.6 Scotland/Wales/NI 5.9 6.0 6.0 5.9
Base: All respondents (527) (507) (524) (643) Compared with three months ago, there have been some changes with Central London, the South West, the Midlands and the North East all having noticeably higher averages this quarter whilst the Rest of London and Scotland, Wales & Northern Ireland both had lower averages this time. The Rest of the South East and the North West both had unchanged averages. There was no clear correlation between where the regions were located and the change in their average rental return on residential houses.

Page 27
Flats
A rental return of between 4% and 6% appears to be the norm for rented flats with more than six out of ten respondents (61%) saying that this applies to their area. Analysis of these results reveals a weighted average rental return on rented flats of 5.2%.
Average Percent of Respondents (%) Return Prime Rest Rest All London of SE of UK Regions
Less than 4% 29.4 2.7 7.7 11.5 4% to 5% 37.4 43.9 40.2 40.7 6% 9.8 28.5 19.3 20.1 7% 4.9 5.0 9.7 6.8 8% 1.2 2.3 7.3 4.0 9% to 10% 3.1 2.3 3.9 3.1 11% to 12% 0.6 0.9 0.4 0.6 12% to 15% 0.6 - 0.8 0.5 Over 15% 0.6 - - 0.2 Not stated 12.3 14.5 10.8 12.4 Base: All respondents (163) (221) (259) (643)
Compared with rented houses, there are similar differences in the rental rates of return for rented flats between the different geographical areas, with the average for those managing properties in Prime Central London being the lowest (4.4%) and that for the Rest of the UK the highest (5.5%) with that for the Rest of the South East falling between these two extremes (5.4%).
Geographic Average Rental Return (%) Area Q1.13 Q2.13 Q3.13 Q4.13
Prime Central London 4.7 4.8 5.0 4.4 South East 5.3 5.2 5.5 5.4 Rest of UK 5.5 5.5 5.7 5.5
All Regions (weighted) 5.2 5.2 5.4 5.2
Base: All respondents (527) (507) (524) (643)
Compared with the last survey in the third quarter, the overall weighted average rental return on flats is down from 5.4% to 5.2%.
As was the case with rented houses, this overall change was reflected in the changes seen for each of the broad geographic areas. The average for Prime Central London was down the most, from 5.0% to 4.4% whilst that for the Rest of the South East was down from 5.5% to 5.4% and that for the Rest of the UK was down from 5.7% to 5.5%.
Page 28
Regional Analysis
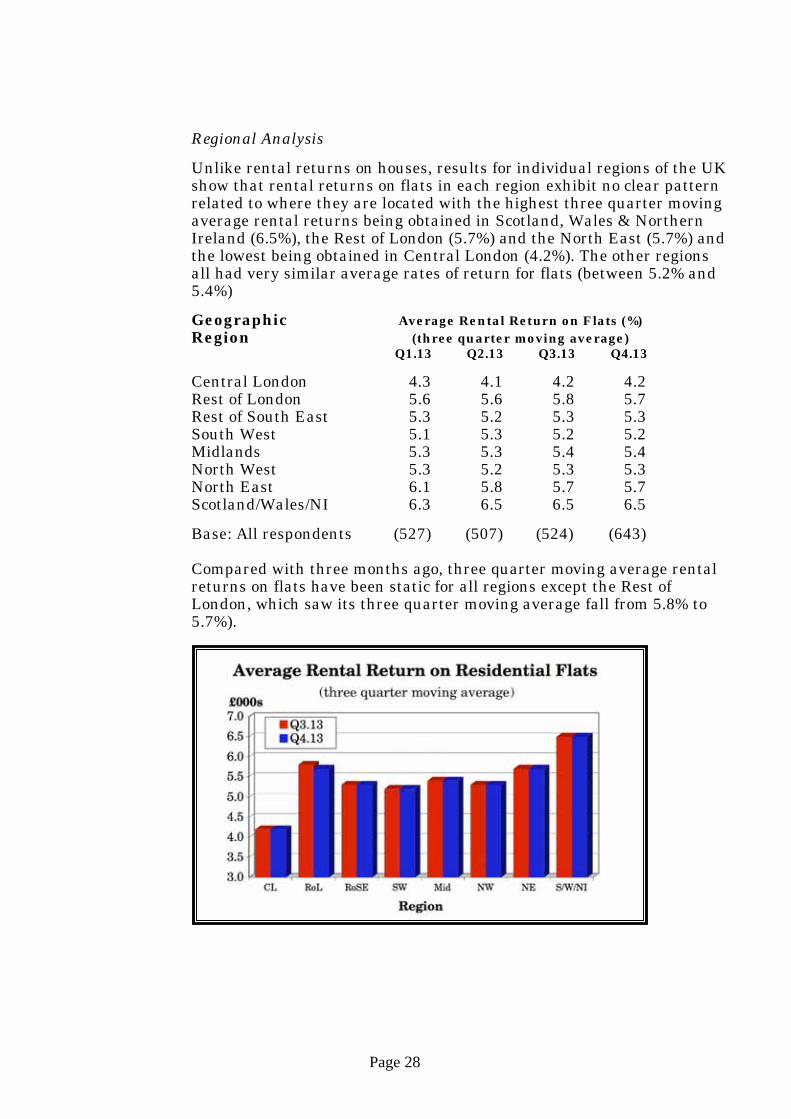
Unlike rental returns on houses, results for individual regions of the UK show that rental returns on flats in each region exhibit no clear pattern related to where they are located with the highest three quarter moving average rental returns being obtained in Scotland, Wales & Northern Ireland (6.5%), the Rest of London (5.7%) and the North East (5.7%) and the lowest being obtained in Central London (4.2%). The other regions all had very similar average rates of return for flats (between 5.2% and 5.4%) Geographic Average Rental Return on Flats (%) Region (three quarter moving average) Q1.13 Q2.13 Q3.13 Q4.13
Central London 4.3 4.1 4.2 4.2 Rest of London 5.6 5.6 5.8 5.7 Rest of South East 5.3 5.2 5.3 5.3 South West 5.1 5.3 5.2 5.2 Midlands 5.3 5.3 5.4 5.4 North West 5.3 5.2 5.3 5.3 North East 6.1 5.8 5.7 5.7 Scotland/Wales/NI 6.3 6.5 6.5 6.5
Base: All respondents (527) (507) (524) (643) Compared with three months ago, three quarter moving average rental returns on flats have been static for all regions except the Rest of London, which saw its three quarter moving average fall from 5.8% to 5.7%).
Page 29
Summary
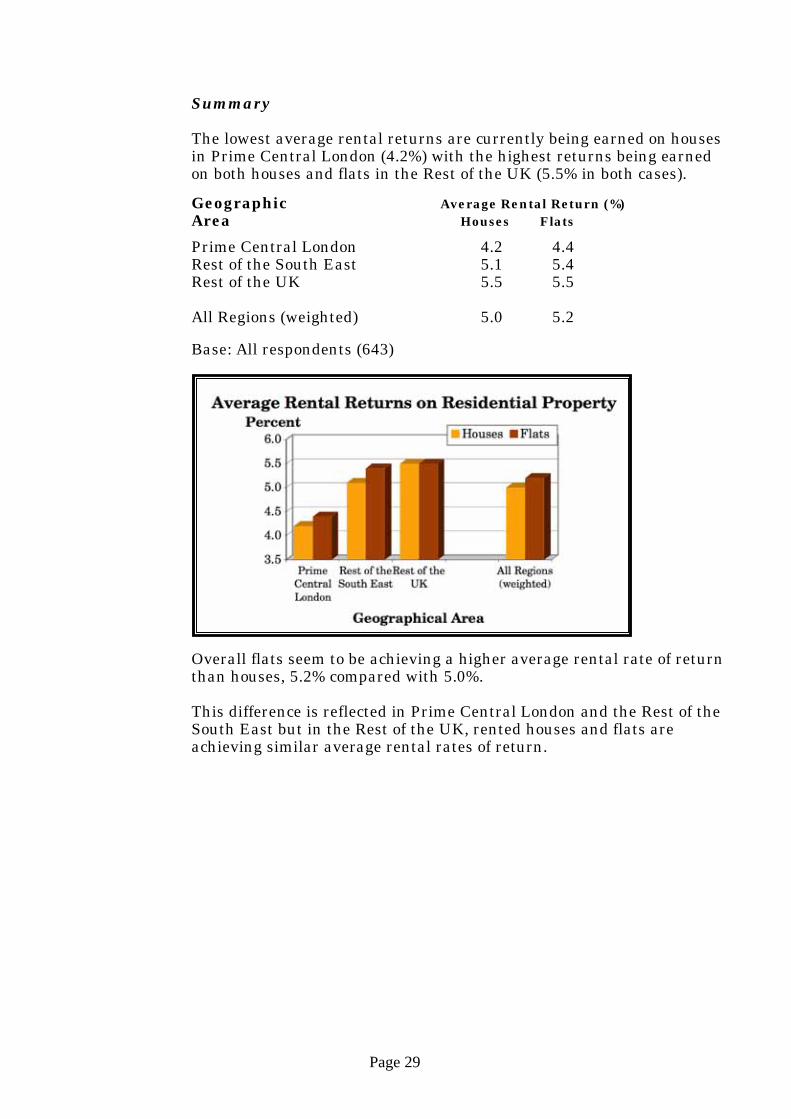
The lowest average rental returns are currently being earned on houses in Prime Central London (4.2%) with the highest returns being earned on both houses and flats in the Rest of the UK (5.5% in both cases).
Geographic Average Rental Return (%) Area Houses Flats
Prime Central London 4.2 4.4 Rest of the South East 5.1 5.4 Rest of the UK 5.5 5.5 All Regions (weighted) 5.0 5.2
Base: All respondents (643)
Overall flats seem to be achieving a higher average rental rate of return than houses, 5.2% compared with 5.0%. This difference is reflected in Prime Central London and the Rest of the South East but in the Rest of the UK, rented houses and flats are achieving similar average rental rates of return.

Page 30
Regional Analysis
As can be seen from the table and chart below, which show the three quarter moving average rental returns for houses and flats for each region in the UK, flats tend to outperform houses on rental return in all regions with the exceptions of the Midlands and, most noticeably, the North West.
Geographic Average Rental Return Region Three Quarter Moving Average (%) Houses Flats
Central London 3.8 4.2 Rest of London 5.1 5.7 Rest of South East 5.2 5.3 South West 5.0 5.2 Midlands 5.7 5.4 North West 6.0 5.3 North East 5.6 5.7 Scotland/Wales/NI 5.9 6.5
Base: All respondents (643)

Page 31
Average Rents
The table below shows the average rents being received by landlords based on the average rental returns and average property values above.
Average Rents – Q4.13 Geographic HOUSES FLATS Area Week Month Year Week Month Year (£) (£) (£000) (£) (£) (£000)
Prime Central London 770 3,335 40.0 539 2,336 28.0 Rest of the South East 371 1,607 19.3 243 1,053 12.6 Rest of the UK 246 1,067 12.8 154 666 8.0 Whole Country 423 1,831 22.0 283 1,224 14.7 Base: All respondents (643)
For those managing properties in Prime Central London, the average rent for a house is currently 43% more than that for a flat. For those in the Rest of the South East and the Rest of the UK, however, the difference is considerably greater at 53% and 60% respectively.
Compared with the last survey, weighted average rents for houses are down by 0.7% as a result of a quite big decrease for those managing properties in Prime Central London (down by 7.8%) which just outweighed the increases in the Rest of the South East (up by 4.1%) and the Rest of the UK (up by 7.7%).
The picture for average rents for flats was similar to that for houses with an overall fall of 5.1% being accounted for by a big fall for Prime Central London (down by 14.2%) which outweighed the increases for the Rest of the South East (up by 3.9%) and the Rest of the UK (up by 3.4%).
Average Rents – Q3.13 Geographic HOUSES FLATS Area Week Month Year Week Month Year (£) (£) (£000) (£) (£) (£000)
Prime Central London 835 3,618 43.4 629 2,725 32.7 Rest of the South East 356 1,544 18.5 234 1,013 12.2 Rest of the UK 229 991 11.9 149 644 7.7 Whole Country 426 1,845 22.1 298 1,290 15.5 Base: All respondents (524)

Page 32
Regional Analysis Further analysis of the responses to this question enables three quarter
moving average rents to be derived for each of the geographic regions included in the survey and these are shown for this quarter and last quarter in the tables below.
Average Rents – Q4.13 Three Quarter Moving Average (%)
Geographic HOUSES FLATS Region Week Month Year Week Month Year (£) (£) (£000) (£) (£) (£000) Central London 878 3,805 45.7 682 2,956 35.5 Rest of London 572 2,481 29.8 364 1,576 18.9 Rest of South East 344 1,490 17.9 203 878 10.5 South West 288 1,247 15.0 181 786 9.4 Midlands 182 787 9.4 115 499 6.0 North West 264 1,142 13.7 154 667 8.0 North East 176 762 9.1 122 529 6.3 Scotland/Wales/NI 216 937 11.2 155 670 8.0
Base: All respondents (643)
Compared with three months ago, there have been mixed fortunes with the South West and the North West seeing the largest increases in average rents for both houses (up by 10.0% and 5.8% respectively) and flats (up by 8.2% and 5.6% respectively). Also seeing a larger than average increase for flats, was the Rest of London (up by 4.9%).
With two exceptions, all the other regions also saw increases in average
rents for both houses and flats but these were much smaller, ranging from 0.2% to 2.8%.
The exceptions were the North East and Scotland, Wales & Northern
Ireland, which saw falls for both houses (down by 0.6% and 2.8% respectively) and flats (down by 4.0% and 3.1% respectively).
Average Rents – Q3.13 Three Quarter Moving Average (%)
Geographic HOUSES FLATS Region Week Month Year Week Month Year (£) (£) (£000) (£) (£) (£000) Central London 877 3,799 45.6 666 2,887 34.6 Rest of London 558 2,416 29.0 347 1,503 18.0 Rest of South East 341 1,478 17.7 202 876 10.5 South West 262 1,133 13.6 168 727 8.7 Midlands 177 767 9.2 112 486 5.8 North West 249 1,079 12.9 146 631 7.6 North East 177 767 9.2 127 551 6.6 Scotland/Wales/NI 222 964 11.6 160 692 8.3
Base: All respondents (524)

Page 33
4.6 Average Void Period Per Year (Q.7)
Average void periods for rented residential properties tend to be quite short with more than three quarters of ARLA members’ offices (77%) reporting averages of 4 weeks or less per year and, in addition, a further one in six (17%) saying the average is between 5 and 6 weeks.
These figures indicate an overall average void period of 3.0 weeks (21 days) per year.
Average Percent of Respondents (%) Void Period Prime Rest Rest All London of SE of UK Regions
Less than 2 weeks 31.3 35.7 23.9 29.9 2 to 4 weeks 37.4 47.5 51.7 46.7 5 to 6 weeks 20.9 13.1 17.4 16.8 7 to 8 weeks 6.7 0.9 4.6 3.9 More than 8 weeks 1.2 - 0.4 0.5
Don't know 1.8 1.4 1.5 1.6
Not stated 0.6 1.4 0.4 0.8
Base: All respondents (163) (221) (259) (643)
Those in the Rest of the South East appear currently to be experiencing the shortest average void period at 2.6 weeks (18 days) compared with 3.2 weeks (22 days) for those in the Rest of the UK and 3.3 weeks (23 days) for those managing properties in Prime Central London. Compared with the third quarter, the average void period for the whole country is up a little from 2.9 weeks to 3.0 weeks, once again reversing the change seen three months earlier. As can be seen from the chart and table below, on this occasion, average void periods for those managing properties in Prime Central London were unchanged with those for the Rest of the South East and the Rest of the UK both being up a little, for the second time in succession.
Page 34
Geographic Average Void Period (weeks) Area Q1.13 Q2.13 Q3.13 Q4.13
Prime Central London 3.2 3.6 3.3 3.3 South East 2.5 2.4 2.5 2.6 Rest of UK 3.2 3.0 3.1 3.2
Whole Country 2.9 3.0 2.9 3.0
Base: All respondents (527) (507) (524) (643)
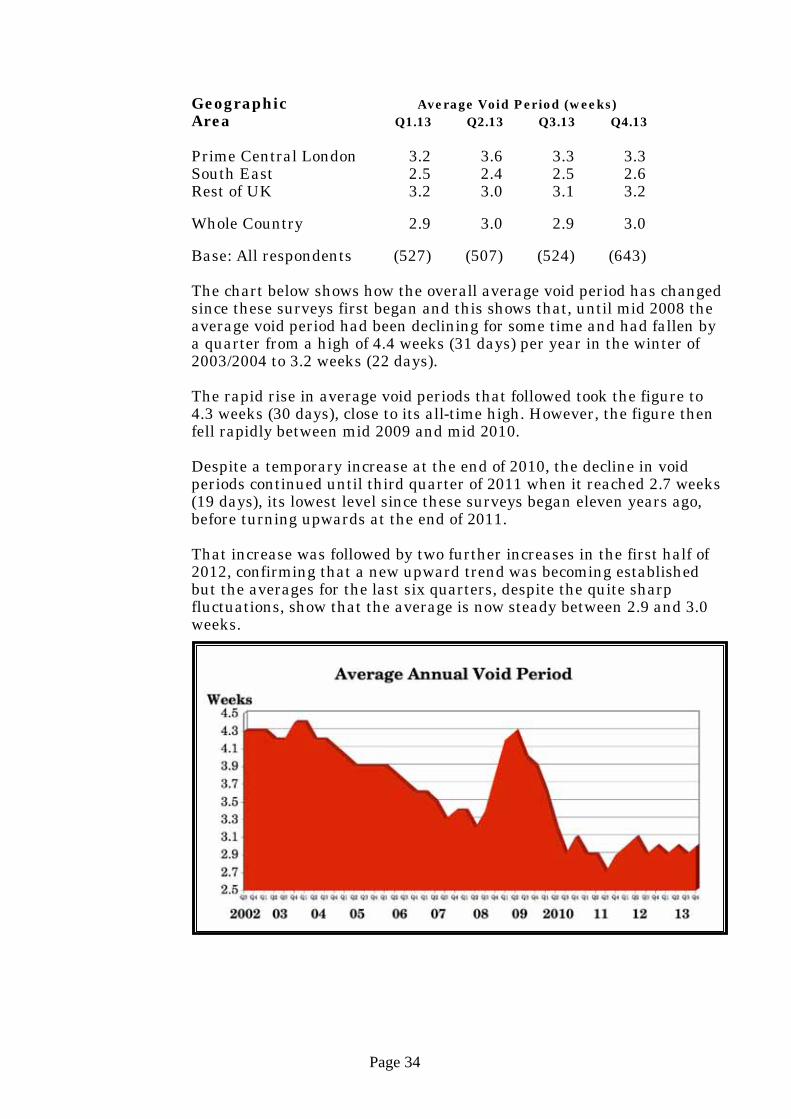
The chart below shows how the overall average void period has changed since these surveys first began and this shows that, until mid 2008 the average void period had been declining for some time and had fallen by a quarter from a high of 4.4 weeks (31 days) per year in the winter of 2003/2004 to 3.2 weeks (22 days). The rapid rise in average void periods that followed took the figure to 4.3 weeks (30 days), close to its all-time high. However, the figure then fell rapidly between mid 2009 and mid 2010. Despite a temporary increase at the end of 2010, the decline in void periods continued until third quarter of 2011 when it reached 2.7 weeks (19 days), its lowest level since these surveys began eleven years ago, before turning upwards at the end of 2011. That increase was followed by two further increases in the first half of 2012, confirming that a new upward trend was becoming established but the averages for the last six quarters, despite the quite sharp fluctuations, show that the average is now steady between 2.9 and 3.0 weeks.

Page 35
Regional Analysis As can be seen from the table below, showing figures for each region of the UK, the three quarter moving average void period is lower in the Rest of London and the Rest of the South East (2.6 weeks in both cases) than anywhere else in the country with the average tending to increase as one moves away from London although Central London and Scotland, Wales & Northern Ireland are notable exceptions to this. Geographic Average Void Period (weeks) Region (three quarter moving average) Q1.13 Q2.13 Q3.13 Q4.13
Central London 4.1 4.1 4.0 3.8 Rest of London 2.3 2.5 2.4 2.6 Rest of South East 2.7 2.6 2.5 2.6 South West 2.7 2.9 2.9 2.9 Midlands 3.1 3.0 2.9 2.8 North West 3.3 3.4 3.4 3.5 North East 3.5 3.9 4.0 4.0 Scotland/Wales/NI 3.2 3.0 3.0 3.2
Base: All respondents (527) (507) (524) (643)
Compared with three months ago, the figures for the three quarter moving average void periods for all of the regions have changed very little, if at all (up or down by 0.2 weeks or less) with no clear correlation between these changes and the location of the region within the UK.

Page 36
4.7 Number of New Tenancies (Not Renewals) Signed Up in the Last Three Months (Q.8)
Nearly eight out of ten ARLA members’ offices (78%) have signed up more than 10 new tenancies (other than renewals) in the last three months with nearly six out of ten (57%) having signed up more than 20 and a quarter (25%) more than 50.
Analysis of these results reveals that, on average, ARLA members’ offices have each signed up 35 new tenancies in the last three months.
Number of Percent of Respondents (%) Tenancies Prime Rest Rest All London of SE of UK Regions
None 1.8 - - 0.5 Up to 5 4.9 9.5 4.2 6.2 6 to 10 12.3 17.2 12.0 13.8 11 to 20 28.2 22.2 17.4 21.8 21 to 50 35.6 25.3 33.6 31.3 Over 50 16.0 24.4 32.0 25.3 Not stated 1.2 1.4 0.8 1.1 Base: All respondents (163) (221) (259) (643)
Offices in the Rest of the UK have fared better than those managing properties in Prime Central London and those in the Rest of the South East with the average figures being 40 for the Rest of the UK, 33 for the Rest of the South East and 30 for Prime Central London.
Compared with the last survey, the average number of new tenancies signed up in the preceding three months is up slightly from 34 to 35. Respondents managing properties in Prime Central London and those in the Rest of the South East both saw small falls of less than 1 new tenancy but these falls were outweighed by the increase seen in the Rest of the UK where the average rose from 37 to 40 new tenancies in the last three months.

Page 37
Geographic Number of New Tenancies Area Q1.13 Q2.13 Q3.13 Q4.13
Prime Central London 29.0 31.0 30.7 30.3 South East 34.4 31.7 33.4 32.7 Rest of UK 31.3 38.2 37.4 39.9
All Regions 32.0 34.1 34.4 35.0
Base: All respondents (527) (507) (524) (643)
The increase seen this quarter is in accordance with the seasonal trend for the fourth quarter which over the previous 10 years has delivered both increases (2003 to 2007 and 2012) and decreases (2008 to 2011).
Looking past these seasonal variations, as can be seen in the graph of the three quarter moving average below, the trend up to 2008 was for the average number of new tenancies being signed up to increase but the shorter term trend over the last four years has been fairly static.
Page 38
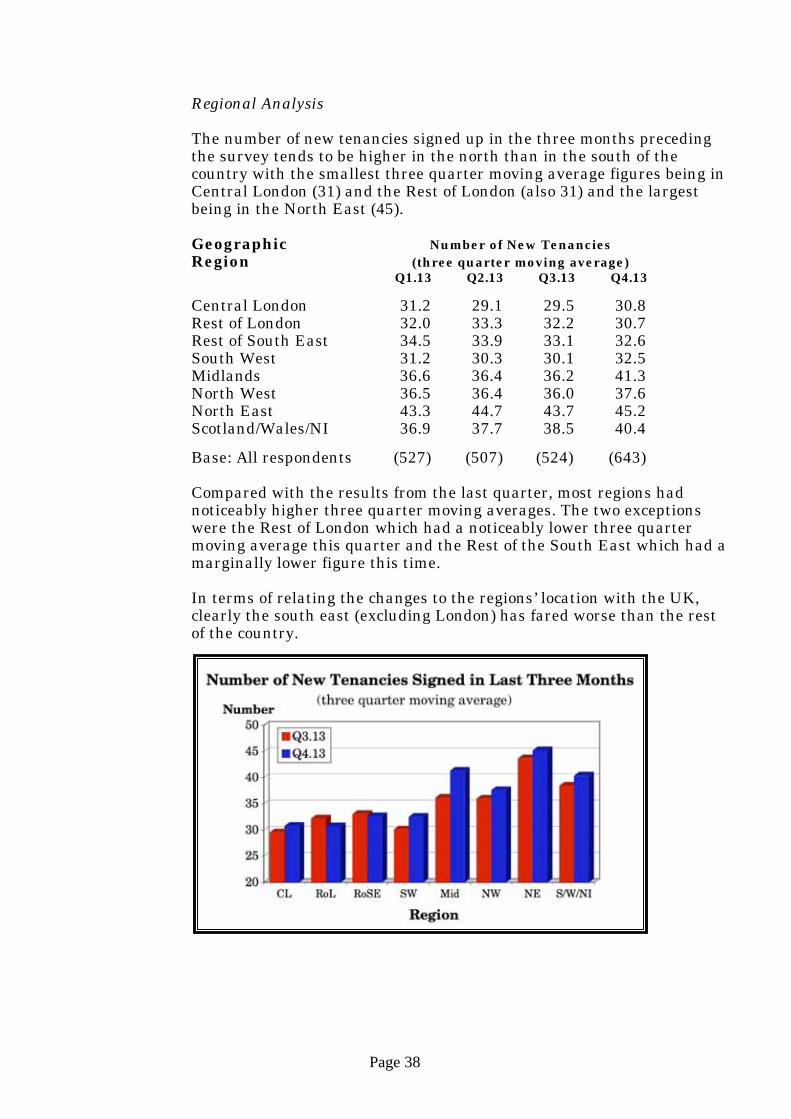
Regional Analysis The number of new tenancies signed up in the three months preceding the survey tends to be higher in the north than in the south of the country with the smallest three quarter moving average figures being in Central London (31) and the Rest of London (also 31) and the largest being in the North East (45).
Geographic Number of New Tenancies Region (three quarter moving average) Q1.13 Q2.13 Q3.13 Q4.13
Central London 31.2 29.1 29.5 30.8 Rest of London 32.0 33.3 32.2 30.7 Rest of South East 34.5 33.9 33.1 32.6 South West 31.2 30.3 30.1 32.5 Midlands 36.6 36.4 36.2 41.3 North West 36.5 36.4 36.0 37.6 North East 43.3 44.7 43.7 45.2 Scotland/Wales/NI 36.9 37.7 38.5 40.4
Base: All respondents (527) (507) (524) (643)
Compared with the results from the last quarter, most regions had noticeably higher three quarter moving averages. The two exceptions were the Rest of London which had a noticeably lower three quarter moving average this quarter and the Rest of the South East which had a marginally lower figure this time. In terms of relating the changes to the regions’ location with the UK, clearly the south east (excluding London) has fared worse than the rest of the country.

Page 39
4.8 Balance of Supply & Demand in the Rented Residential Property Sector (Q.9)
Nearly half of ARLA members’ offices (46%) say that there are currently more tenants than there are properties available for them. This compares with only two thirds as many (31%) who now believe that there are more residential properties available for rent than there are tenants to fill them. However, more than two out of ten (21%) believe that supply of and demand for rented residential properties is in balance.
These figures suggest that, overall, the supply of rented residential properties is currently insufficient to meet demand for them with demand being strongest in the Rest of the South East where only 24% of respondents say there are more properties than tenants compared with 54% saying there are more tenants than properties. The picture in Prime Central London is much less positive with 52% saying there are more properties than tenants compared with 31% saying there are more tenants than properties. For those in the Rest of the UK the picture is similar to that for the Rest of the South East, although a little less positive, with 25% saying there are more properties than tenants and 49% saying there are more tenants than properties.
Balance of Percent of Respondents (%) Supply and Prime Rest Rest All Demand London of SE of UK Regions
Lot more props than tenants 25.2 5.4 6.2 10.7 Few more props than tenants 26.4 18.6 18.9 20.7 Equal nos of props & tenants 17.2 19.5 25.5 21.3 Few more tenants than props 11.7 29.0 23.6 22.4 Lot more tenants than props 19.6 25.3 25.1 23.8
Not stated - 2.3 0.8 1.1
Base: All respondents (163) (221) (259) (643)

Page 40
Compared with the third quarter, there has been quite a sharp change in the overall balance of supply and demand with the proportion of all respondents who now say there are more tenants than properties falling from 52% to 46%, the third fall in succession. This overall change is accounted for by decreases in all of the broad geographic areas.
Proportion Saying There Are Geographic More Tenants than Properties (%) Area Q1.13 Q2.13 Q3.13 Q4.13
Prime Central London 35.1 32.3 33.1 31.3 South East 68.5 65.7 61.4 54.3 Rest of UK 57.7 56.9 54.1 48.6
All Regions 56.9 53.6 52.1 46.2
Base: All respondents (527) (507) (524) (643)
As the chart below shows, the large decline during 2008 in the proportion of respondents saying that there are more tenants than properties bottomed out during the first half of 2009 before bouncing back strongly to reach its highest ever level in the third quarter of 2010. The two falls that followed over the winter of 2010/2011 suggested that a downward trend was becoming established but the increases seen in the second and third quarters of 2011 produced a fairly static position. Against this backdrop, the large fall seen in the last quarter of 2011 represented quite a dramatic change. Although the results for 2012 did not continued the decline, the figure remained at a much reduced level. In 2013, however, the decline has resumed and the figure is now at its lowest level for 4 years.
Looking at changes for each of the broad geographic areas over the last eleven years, as can be seen from the chart below, the most dramatic changes have taken place in Prime Central London where the

Page 41
proportion of respondents saying that there are more tenants than there are properties available for them rose massively, from a low of 6% in the last quarter of 2002 to 72% in the second quarter of 2007.
After that, it fell back even more dramatically to 6% in the last quarter of 2008 before starting to rise again and it reached its highest ever figure (83%) at the end of 2010 before falling back a little at the start of 2011 and then hitting its second highest ever figure (82%) three months later. The falls seen in the second half of 2011, followed by further falls throughout 2012 suggested that the balance of supply and demand had changed quite significantly during 2011 and 2012 and the results from 2013, despite seeing smaller reductions, have done little to change this.
In the Rest of the South East, the figure also rose, though not as dramatically, growing nearly six fold from a low of 10% in the last quarter of 2003 to a high of 59% in the Spring of 2008. The huge fall during the second half of 2008 placed the Rest of the South East in a similar situation to the rest of the country where it remained until mid 2010 when it again took the lead. However, the reduction seen at the end of 2010 put it in second place behind Prime Central London and the results from the following two quarters showed it to be neck and neck with Prime Central London. The results for the last quarter of 2011 showed a sharp fall but the results from all four quarters of 2012 resulted in a sustained, if slight, upward trend. The decline seen this time, the fourth in succession, suggests that the trend is now downwards.
In the Rest of the UK, whilst the figure remained relatively steady at between 30% and 40% for most of the period between 2002 and 2008, it too declined sharply in the second half of 2008 before bouncing back in 2009 and proceeding to reach a new high each quarter until the end of 2010 when it declined for the first time in more than a year, something which continued with the results from the first quarter of 2011 but which then halted. During 2012, despite some sharp fluctuations, the trend was slightly upward but it is clear that in 2013 the trend has turned downwards.

Page 42
Regional Analysis
The balance of supply and demand in terms of the percentage of respondents saying there are more tenants than there are properties for them appears to be slightly tilted in favour of residential landlords in the south east of the country, excluding Central London which is a notable exception. This can be seen from the chart below, which shows the three quarter moving average proportion of respondents saying there are more tenants than properties.
Proportion Saying There Are Geographic More Tenants than Properties (%) Region (three quarter moving average) Q1.13 Q2.13 Q3.13 Q4.13
Central London 20.1 16.2 16.7 17.5 Rest of London 60.3 58.5 55.6 52.2 Rest of South East 67.9 68.7 67.3 62.5 South West 54.2 52.1 53.5 45.9 Midlands 61.6 61.3 62.3 62.1 North West 52.8 56.7 56.4 54.8 North East 60.9 60.2 55.4 44.3 Scotland/Wales/NI 44.9 49.2 52.5 55.2
Base: All respondents (527) (507) (524) (643) Compared with the three quarter moving average figures from three months ago, only Central London and Scotland, Wales & Northern Ireland saw an increase in the proportion of respondents saying there are more tenants than properties, with all the other regions seeing falls. The largest fall in the three quarter moving average proportion saying there are more tenants than properties was in the North East (down from 55% to 44%).

Page 43
4.9 Average Length of Continuous Stay in Property (Q.10)
Nearly three quarters of respondents (73%) say that the average length of a tenancy is between 13 and 24 months with similar proportions saying it is between 13 and 18 months (36%) and between 19 and 24 months (37%). Based on these figures, tenants tend to stay in the same property for an average of 19.4 months.
Average Length of Percent of Respondents (%) Continuous Stay Prime Rest Rest All London of SE of UK Regions
6 to 9 months 0.6 0.5 1.2 0.8 10 to 12 months 7.4 6.3 15.1 10.1 13 to 18 months 33.7 29.9 41.3 35.5 19 to 24 months 42.3 44.3 28.2 37.3 More than 24 months 13.5 17.2 12.4 14.3
Don't know 2.5 - 1.2 1.1
Not stated - 1.8 0.8 0.9
Base: All respondents (163) (221) (259) (643)
The average time a tenant stays in the same property is longest for those in the Rest of the South East at 20.6 months, compared with 19.7 months for those managing properties in Prime Central London and 18.3 months for those in the Rest of the UK.
Geographic Average Continuous Stay (months)
Area Q1.13 Q2.13 Q3.13 Q4.13
Prime Central London 21.6 20.8 20.1 19.7 South East 20.0 20.2 19.9 20.6 Rest of UK 18.3 18.9 19.0 18.3
All Regions 19.7 19.8 19.6 19.4
Base: All respondents (527) (507) (524) (643)
Compared with the last survey, the average length of a tenancy is down a little from 19.6 to 19.4 months and this is reflected in the figures for

Page 44
those managing properties in Prime Central London (down from 20.1 to 19.7 months) and for those in the Rest of the UK (down from 19.0 to 18.3 months). Contrastingly, there was an increase in the average for those in the Rest of the South East (up from 19.9 to 20.6 months).
As can be seen from the chart below, the overall average length of stay in a property had been on a rising trend for some time with 2010 showing the strongest period of increase. During 2011 and 2012, the trend levelled off and in 2013, the figure has been fairly steady in the range 19.4 months to 19.8 months although a gently declining trend is now establishing itself.

Page 45
Regional Analysis As with most of the other regional analysis of results from this survey, there is a clear progression as one moves away from London. In this case, looking at the three quarter moving average figures, the progression is from relatively long continuous stays of more than 20 months in Central London, the Rest of London and the Rest of the South East to a relatively short stay of 17 months in Scotland, Wales & Northern Ireland.
Geographic Average Continuous Stay (months) Region (three quarter moving average) Q1.13 Q2.13 Q3.13 Q4.13
Central London 20.2 20.7 20.6 20.2 Rest of London 21.0 21.2 21.2 20.6 Rest of South East 19.8 19.9 20.4 20.5 South West 19.1 19.4 19.7 19.5 Midlands 19.2 19.4 19.1 19.0 North West 18.1 18.7 19.3 19.1 North East 17.5 17.8 17.7 17.7 Scotland/Wales/NI 17.3 17.1 17.1 17.1
Base: All respondents (527) (507) (524) (643)
Compared with three months ago, there have been some noticeable falls in the three quarter moving average length of tenancies, particularly in the Rest of the London (down from 21.2 to 20.6 months). Only one region had an increase and that was the Rest of the South East (up from 20.4 to 20.5 months) and the figure for the North East was the only one that was unchanged (staying at 17.7 months).

Page 46
4.10 Change in Achievable Rent Levels Over Last 6 Months (Q.11)
Whole Country
In the case of each of the listed property types, between 32% and 44% of ARLA members’ offices believe that achievable rent levels have increased over the last six months whilst only between 15% and 17% believe they have fallen.
Percent of Respondents (%) Response Det Semi Terr Conv PB Studio House House House Flat Flat Flat
Increased a lot 3.6 4.7 5.0 5.0 6.1 5.3 Increased a little 32.7 39.5 38.6 33.3 35.9 26.6 Stayed the same 32.5 29.9 35.0 37.2 38.7 36.5 Decreased a little 14.2 13.7 13.8 14.9 14.6 14.6 Decreased a lot 2.8 1.4 1.7 1.6 1.4 1.9
Don't know 12.6 9.0 4.4 6.2 1.9 13.1 Not stated 1.7 1.9 1.6 1.9 1.4 2.0
Base: All respondents (643)
These figures tend to suggest that, on average, achievable rent levels have increased significantly over the past six months.
Prime Central London
Within the overall figures, the situation in Prime Central London is considerably weaker than that for the whole country with between 17% and 36% saying that achievable rent levels for each type of property have risen compared with between 31% and 39% saying they have fallen.
Percent of Respondents (%)
Response Det Semi Terr Conv PB Studio House House House Flat Flat Flat
Increased a lot 2.5 3.1 3.1 3.7 5.5 4.9 Increased a little 14.1 17.2 23.3 29.4 30.7 25.2 Stayed the same 19.6 17.8 22.7 28.8 28.8 27.6 Decreased a little 27.6 34.4 33.7 29.4 27.6 28.2 Decreased a lot 8.0 4.3 5.5 3.1 4.9 2.5
Don't know 27.0 22.1 9.2 3.7 1.2 9.8 Not stated 1.2 1.2 2.5 1.8 1.2 1.8
Base: All respondents (163)
It would appear from these figures that, on average, achievable rent levels in Prime Central London have fallen a little over the past six months.

Page 47
Rest of the South East
With regard to the Rest of the South East, the picture is a little stronger than that for the whole country with between 39% and 56% of respondents saying that achievable rent levels have increased compared with between 5% and 11% saying they have decreased.
Percent of Respondents (%) Response Det Semi Terr Conv PB Studio House House House Flat Flat Flat
Increased a lot 4.1 4.1 7.7 7.7 9.0 6.8 Increased a little 40.7 51.6 49.8 40.7 45.7 32.6 Stayed the same 33.0 31.2 33.9 35.7 36.7 35.7 Decreased a little 9.5 5.0 4.5 5.4 5.4 7.7 Decreased a lot 1.4 0.5 - - - 0.5
Don't know 9.0 5.4 2.7 8.6 1.8 14.5 Not stated 2.3 2.3 1.4 1.8 1.4 2.3 Base: All respondents (221)
These figures tend to suggest that achievable rent levels in the South East have increased substantially in the last six months.
Rest of the UK
For the Rest of the UK, the position is similar to that for the whole country with between 27% and 49% of offices saying that achievable rent levels for each type of property have increased compared with between 9% and 16% saying achievable rent levels have decreased over the last six months.
Percent of Respondents (%) Response Det Semi Terr Conv PB Studio House House House Flat Flat Flat
Increased a lot 3.9 6.2 3.9 3.5 3.9 4.2 Increased a little 37.5 43.2 38.6 29.3 30.9 22.4 Stayed the same 40.2 36.3 43.6 43.6 46.7 42.9 Decreased a little 9.7 8.1 9.3 13.9 14.3 12.0 Decreased a lot 0.8 0.4 0.8 1.9 0.4 2.7
Don't know 6.6 3.9 2.7 5.8 2.3 13.9 Not stated 1.5 1.9 1.2 1.9 1.5 1.9 Base: All respondents (259)
Again, from these figures, it appears that achievable rent levels in the Rest of the UK have increased significantly over the last six months.

Page 48
Summary
The table and chart below show the proportion of ARLA members’ offices from each of the broad geographical areas who say they believe achievable rent levels have increased over the last six months for each type of property.
Percent Saying Achievable Rents Levels Geographic Have Increased (%) Area Det Semi Terr Conv PB Studio House House House Flat Flat Flat
Prime Central London 16.6 20.2 26.4 33.1 36.2 30.1 Rest of the South East 44.8 55.7 57.5 48.4 54.8 39.4 Rest of the UK 41.3 49.4 42.5 32.8 34.7 26.6
Whole country 36.2 44.2 43.5 38.3 42.0 31.9 Base: All respondents (643)
Compared with three months ago, the average proportion of respondents saying achievable rents, across all property types, have increased has fallen from 44% to 39%, the second fall in succession.
Percent Saying Achievable Rents Geographic Have Increased (%) Area Q1.13 Q2.13 Q3.13 Q4.13
Prime Central London 34.4 34.7 31.6 27.1 Rest of the South East 52.5 57.6 53.0 50.1 Rest of the UK 38.1 38.5 41.2 37.9
All regions 42.8 44.1 43.5 39.3
Base: All respondents (527) (507) (524) (643) The overall decline in the proportion of respondents saying achievable rent levels across all property types have increased is reflected in the figures for all of the three broad geographic areas. The average for those managing properties in Prime Central London is down from 32% to 27%

Page 49
whilst that for the Rest of the South East has fallen, from 53% to 50% and that for the Rest of the UK has fallen from 41% to 38%.
Having been fairly settled at around 32% until the last quarter of 2005, the figure for the overall average proportion of respondents saying that achievable rent levels have risen increased steadily during 2006 and 2007 and into early 2008.
However, the proportion of respondents in the second quarter of 2008 saying that achievable rent levels had increased fell from 56% to 53% and this was followed by three successive big declines with another smaller decline in the following quarter. As a result, between the first quarter of 2008 and the second quarter of 2009, the figure fell from 56% to 7%. From mid 2009, however, the figure rose steadily to reach 55% in the third quarter of 2010 before levelling off with the results from the next two surveys. This was followed by two small increases but these were wiped out by the fall seen at the end of 2011 and the falls seen in the first two quarters of 2012 continued that decline, confirming that a downward trend had become established. The increase seen in the third quarter of 2012 ended that downward trend but the declines seen in the following two quarters more than reversed that increase. Despite the increase seen six months ago, the falls seen in the last two quarters confirm that the trend is still downwards.

Page 50
Regional Analysis
Looking at the three quarter moving averages for each region within the UK, the proportion of respondents saying that achievable rent levels in their region across all property types have increased is highest for respondents in the Rest of the South East (55%), the Midlands (48%) and the Rest of London (48%) and lowest for the those in Central London (20%). As can be seen from the chart below, the proportion of respondents saying that achievable rent levels have increased tends to decline as one moves away from London and the south although Central London and the Midlands would appear to be exceptions to this.
Percent Saying Achievable Rents Geographic Have Increased (%) Region (three quarter moving average) Q1.13 Q2.13 Q3.13 Q4.13
Central London 27.7 23.0 20.2 19.5 Rest of London 52.8 49.9 49.1 47.5 Rest of South East 52.5 55.3 56.5 55.1 South West 44.5 42.7 38.7 38.7 Midlands 49.5 47.7 47.6 48.3 North West 27.1 28.0 30.6 32.7 North East 39.3 30.3 29.7 24.3 Scotland/Wales/NI 36.3 34.2 39.0 38.8
Base: All respondents (527) (507) (524) (643)
Compared with the third quarter survey, the main changes are that the proportion of respondents saying achievable rent levels have increased has fallen in five regions (but only marginally in the case of Central London and Scotland, Wales & Northern Ireland) and increased in two regions with the remaining region, the South West, seeing no change.

Page 51
4.11 Are You Seeing an Increase in Rental Property Coming Onto the Market Because It Cannot Be Sold? (Q.12)
Nearly two out of ten of ARLA members’ offices (18%) say that they are seeing an increase in rental property coming onto the market because it cannot be sold.
Percent of Respondents (%) Response Prime Rest Rest All London of SE of UK Regions
Yes 9.8 10.9 30.1 18.4 No 73.6 76.9 56.0 67.7
Don't know 8.6 5.4 8.5 7.5 Not stated 8.0 6.8 5.4 6.5
Base: All respondents (163) (221) (259) (643)
There were quite big differences between the three broad geographic areas on this question with those managing properties in Prime Central London being the least likely to say they are seeing an increase in rental property coming onto the market because it cannot be sold (10%) and those in the Rest of the UK being the most likely to do so (30%) with those in the Rest of the South East (11%) falling close to the Central London figure.
Response Percent of Respondents (%) Q1.13 Q2.13 Q3.13 Q4.13
Yes 28.7 26.4 21.4 18.4 No 59.2 58.8 61.6 67.7
Don't know 9.3 10.3 8.6 7.5
Not stated 2.8 4.5 8.4 6.5
Base: All respondents (527) (507) (524) (643)
Compared with the third quarter, there has been another fall in the proportion of respondents saying they think there has been an increase in rental property coming onto the market because it cannot be sold with the figure falling from 21% to 18%, the fourth fall in succession. As can be seen from the chart below, in 2009 and the first half of 2010 there was a big drop in the proportion saying they were seeing an increase in rental property coming onto the market because it cannot be sold. After that, the figure bounced back in the second half of 2010 before stabilising around the 40% mark. However, in the first two quarters of 2012, there was quite a marked fall in the proportion saying they had seeing an increase in rental property coming onto the market because it could not be sold. The increases seen in the second half of 2012 partially reversed that decline but the results from the first quarter of 2013 returned to the

Page 52
downward trend which has continued during the rest of 2013 and the results from this quarter have taken the figure to its lowest level since this question was first asked more than 5 years ago.

Page 53
Regional Analysis
The three quarter moving average figures for the individual regions making up the UK show that the North West remains the region with the largest proportion of respondents (38%) saying that they are seeing an increase in rental property coming onto the market because it cannot be sold with Central London having the smallest proportion (12%). There is a clear bias towards a higher proportion of respondents believing this to be the case the further away from London they are. Geographic Percent Seeing an Increase (%) Region (three quarter moving average) Q1.13 Q2.13 Q3.13 Q4.13
Central London 18.5 12.8 10.4 12.2 Rest of London 23.4 19.8 15.8 12.6 Rest of South East 33.6 30.3 23.4 19.0 South West 36.1 31.3 25.0 25.3 Midlands 48.6 40.6 31.6 29.7 North West 67.3 65.5 52.8 37.9 North East 56.8 49.1 36.2 35.0 Scotland/Wales/NI 62.7 56.5 45.3 37.4
Base: All respondents (527) (507) (524) (643)
Compared with three months ago, the three quarter moving average proportion of respondents saying there had been an increase in rental property coming onto the market because it could not be sold was down in all but two regions, with the sharpest reductions being in the North West (down from 53% to 38%), Scotland, Wales & Northern Ireland (down from 45% to 37%) and the Rest of the South East (down from 23% to 19%). The exceptions were Central London (up from 10% to 12%) and, to a much lesser extent, the South West (up marginally from 25.0% to 25.3%).
Page 54
4.12 For Which Types of property Are You Seeing an Increase in Rental Properties Coming Onto the Market Because They Cannot Be Sold? (Q.13)
For those respondents who said they were seeing an increase in property coming onto the rental market because it could not be sold, the types of property which the highest proportions thought were increasingly coming onto the rental market because they could not be sold were detached houses (68%) and semi-detached houses (60%). These were followed by terraced houses (47%) and purpose built flats/maisonettes (42%) with converted flats/maisonettes (30%) lagging some way behind but not as much as studio flats (15%) which respondents did not think were coming onto the rental market for this reason anything like as much as other property types.
Type of Percent of Respondents (%) Property Prime Rest Rest All London of SE of UK Regions
Detached houses 50.0 66.7 71.8 67.8 Semi-detached houses 37.5 66.7 62.8 60.2 Terraced houses 37.5 58.3 44.9 46.6 Flats/maisonettes (conv) 87.5 20.8 20.5 29.7 Flats/maisonettes (PB) 87.5 33.3 34.6 41.5 Studio flats 31.3 20.8 10.3 15.3
Base: All seeing increase (16) (24) (78) (118)
There are some big differences in responses to this question as between offices managing properties in Prime Central London and those in the rest of the country with respondents from offices managing properties in Prime Central London being much less likely to think there has been an increase in all types houses coming onto the rental market because they cannot be sold and much more likely to think there has been an increase in flats of all types doing so. Type of Percent of Respondents (%)
Property Q1.13 Q2.13 Q3.13 Q4.13 Detached houses 55.0 66.4 72.3 67.8 Semi-detached houses 60.9 64.2 69.6 60.2 Terraced houses 49.0 43.3 50.9 46.6 Flats/maisonettes (conv) 26.5 24.6 29.5 29.7 Flats/maisonettes (PB) 39.7 40.3 49.1 41.5 Studio flats 15.2 14.9 16.1 15.3
Base: All seeing increase (151) (134) (112) (118) Compared with the last survey in the third quarter, with one exception, fewer respondents said they thought there had been an increase in all types of property coming onto the market because they could not be sold. The largest decreases were for semi detached houses (down from 70% to 60%) and purpose built flats (down from 49% to 42%). The only

Page 55
property type to see an increase in respondents saying they were increasingly coming onto the market because they could not be sold was converted flats (up marginally from 29.5% to 29.7%).

Page 56
Regional Analysis It should be noted that the number of respondents within individual regions saying that they thought there had been an increase in properties coming onto the rental market because they could not be sold is quite small and the results from this question should, therefore, be treated with a high degree of caution.
Nevertheless, with regard to regional differences in the types of property which respondents are increasingly seeing coming onto the rental market because they cannot be sold, Central London tends to show the lowest proportions of respondents saying this is the case for houses of all types, with the exception of terraced houses in the North West, and the highest proportions of respondents saying it is the case for all types of flats, with the exceptions of purpose built flats and studio flats in the Rest of London.
Percent of Respondents (%) Type of Property Region CL RoL SE SW Mid NW NE S/W/NI
Detached 16.7 100.0 75.0 60.9 95.2 60.0 87.5 56.3 Semi-detached 16.7 75.0 70.8 65.2 71.4 50.0 50.0 62.5 Terraced 33.3 50.0 58.3 56.5 42.9 30.0 50.0 37.5 Flat/maisonette (conv.) 91.7 50.0 16.7 34.8 14.3 20.0 25.0 6.3 Flat/maisonette PB) 91.7 100.0 16.7 47.8 19.0 30.0 62.5 25.0 Studio flat 33.3 50.0 16.7 8.7 23.8 10.0 - -
Base: All seeing increase (12) (4) (24) (23) (21) (10) (8) (16) With regard to individual property types, detached houses are most likely to be seen to be increasingly coming onto the rental market by respondents in the Rest of London (100%), the Midlands (95%) and the North East (88%), semi-detached house by respondents in the Rest of London (100%), the Midlands (71%) and the North East (71%) and terraced houses in the South East (58%) and the South west (57%). Both detached and semi-detached houses are least likely to be seen to be increasingly coming onto the rental market because they cannot be sold in the Central London (17% in both cases) whilst terraced houses are least likely to be seen to be doing so in the North West (30%). When it comes to flats, they are most likely to be seen to be increasingly coming onto the market by respondents in either Central London (92% for converted flats) or the Rest of London (100% for purpose built flats and 50% for studio flats). The regions where flats are least likely to be seen to be increasingly coming onto the market because they cannot be sold are, in the case of conversions, the Midlands (14%) and, in the case of purpose built flats, the South East (17%). In the case of studio flats, the regions where they are least likely to be seen to be increasingly coming onto the market because they cannot be sold are the North East and Scotland, Wales & Northern Ireland where, in both cases, no respondents thought they were increasingly coming onto the market because they could not be sold.
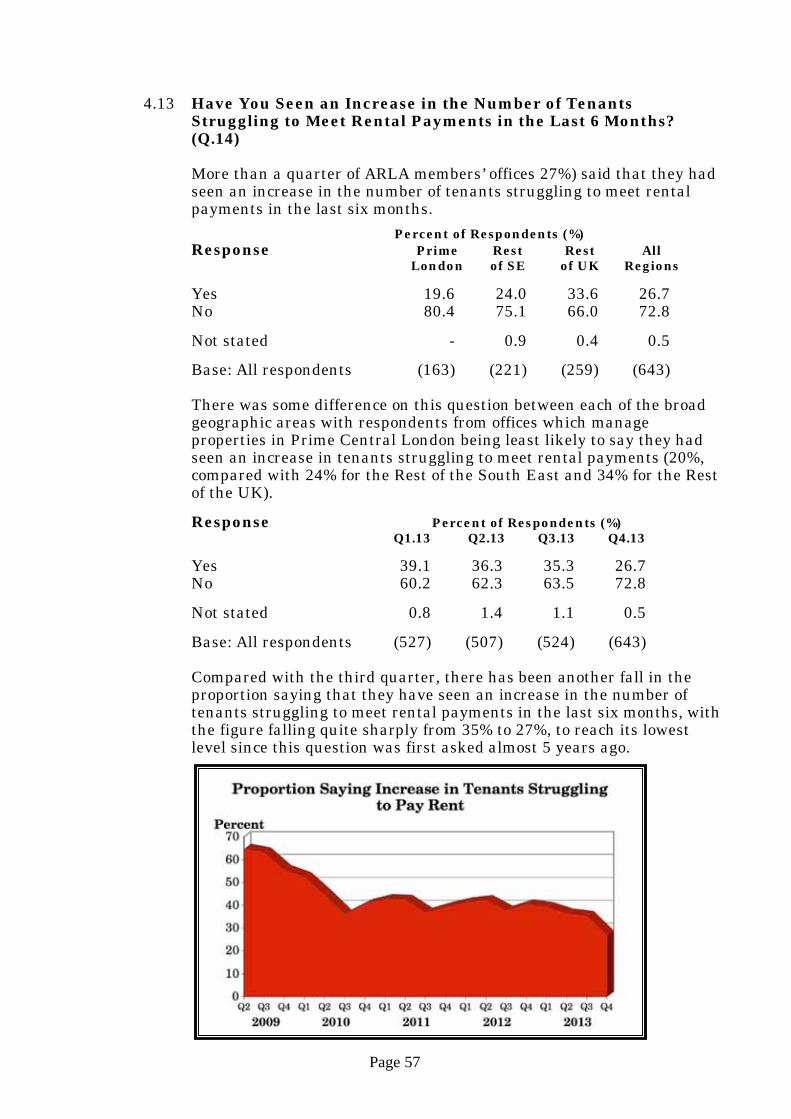
Page 57
4.13 Have You Seen an Increase in the Number of Tenants Struggling to Meet Rental Payments in the Last 6 Months? (Q.14)
More than a quarter of ARLA members’ offices 27%) said that they had seen an increase in the number of tenants struggling to meet rental payments in the last six months.
Percent of Respondents (%) Response Prime Rest Rest All London of SE of UK Regions
Yes 19.6 24.0 33.6 26.7 No 80.4 75.1 66.0 72.8
Not stated - 0.9 0.4 0.5
Base: All respondents (163) (221) (259) (643)
There was some difference on this question between each of the broad geographic areas with respondents from offices which manage properties in Prime Central London being least likely to say they had seen an increase in tenants struggling to meet rental payments (20%, compared with 24% for the Rest of the South East and 34% for the Rest of the UK).
Response Percent of Respondents (%) Q1.13 Q2.13 Q3.13 Q4.13
Yes 39.1 36.3 35.3 26.7 No 60.2 62.3 63.5 72.8
Not stated 0.8 1.4 1.1 0.5
Base: All respondents (527) (507) (524) (643)
Compared with the third quarter, there has been another fall in the proportion saying that they have seen an increase in the number of tenants struggling to meet rental payments in the last six months, with the figure falling quite sharply from 35% to 27%, to reach its lowest level since this question was first asked almost 5 years ago.

Page 58
Regional Analysis The three quarter moving average figures for individual regions show a slight tendency for the proportion saying they have seen an increase in the last 6 months in tenants struggling to meet rental payments to be higher the further away from London the region is, with the figure rising from a low of 19% in Central London to a high of 40% in the North East.
Percent Who Have Seen an Increase in Tenants Geographic Struggling to Meet Rental Payments (%) Region (three quarter moving average) Q1.13 Q2.13 Q3.13 Q4.13
Central London 26.3 24.6 23.1 19.4 Rest of London 36.9 41.1 39.4 32.7 Rest of South East 38.7 36.9 35.9 31.4 South West 44.1 44.9 40.9 38.7 Midlands 40.6 44.6 43.9 39.6 North West 45.2 38.8 39.0 36.8 North East 48.0 52.3 44.7 40.3 Scotland/Wales/NI 46.3 41.3 40.9 39.3
Base: All respondents (527) (507) (524) (643)
Compared with three months ago, all regions saw falls with the largest falls being seen in the Rest of London (down from 39% to 33%), the Rest of the South East (down from 36% to 31%), the North East (down from 45% to 40%) and the Midlands (down from 44% to 40%) and

Page 59
4.14 Are You Aware of an Increase in Tenants Asking Lenders for References on Potential Landlords to Ensure They Are Financially Viable? (Q.15)
One in ten ARLA members’ offices (10%) said that they were aware of an increase in tenants asking lenders for references on potential landlords to ensure they were financially viable with the vast majority (89%) saying they were not aware of any such increase.
Percent of Respondents (%) Response Prime Rest Rest All London of SE of UK Regions
Yes 8.6 10.9 9.7 9.8 No 91.4 87.3 90.0 89.4
Not stated - 1.8 0.4 0.8
Base: All respondents (163) (221) (259) (643)
There was some difference between the broad geographic areas on this question with respondents in the Rest of the South East being the most likely to say they had seen an increase in tenants asking lenders for references on potential landlords (11% compared with 10% for the Rest of the UK and 9% for Prime Central London).
Response Percent of Respondents (%) Q1.13 Q2.13 Q3.13 Q4.13
Yes 10.1 8.7 9.7 9.8 No 89.4 89.2 88.7 89.4
Not stated 0.6 2.2 1.5 0.8
Base: All respondents (527) (507) (524) (643)
Compared with the last survey, there has been virtually no change in the proportion saying they are aware of an increase in tenants asking lenders for references on potential landlords with the figure rising very slightly from 9.7% to 9.8%. As can be seen from the chart below, despite the fluctuations, the figure appears to have been fairly stable over the last year and a half.

Page 60
Regional Analysis There was a lot of variation between regions on this question with a slight tendency to increase with distance from London.
The region with the highest three quarter moving average proportion of respondents saying they were aware of an increase in tenants asking for references on landlords was the North West (15%) whilst the region with the lowest proportion was Central London (7%). The other regions varied between these two extremes.
Percent Aware of Increase in Tenants Geographic Asking for References on Landlords (%) Region (three quarter moving average) Q1.13 Q2.13 Q3.13 Q4.13
Central London 12.4 9.0 7.4 6.5 Rest of London 8.9 8.3 10.2 11.9 Rest of South East 6.7 6.1 6.6 8.2 South West 10.0 9.7 8.5 8.9 Midlands 8.9 11.4 11.6 8.1 North West 19.1 15.1 18.5 14.7 North East 14.0 10.8 10.9 11.9 Scotland/Wales/NI 9.9 14.2 14.9 13.1
Base: All respondents (527) (507) (524) (643)
Compared with the results from the survey in the third quarter, four regions saw an increase in the three quarter moving average saying they were aware of an increase in tenants asking for references on landlords and four saw a decrease. The regions with the biggest increases were the Rest of London (up from 10% to 12%) and the Rest of the South East (up from 7% to 8%).
The regions with the biggest falls in the three quarter moving average saying they were aware of an increase in tenants asking for references on landlords were the North West (down from 19% to 15%) and the Midlands (down from 12% to 8%).

Page 61
4.15 Have You Seen an Increase in Tenants Haggling With Landlords Over Rents in the Last 6 Months? (Q.16)
Nearly half of ARLA members’ offices (48%) said that they had seen an increase in tenants haggling with landlords over rents in the last six months but slightly more (51%) said they had not.
Percent of Respondents (%) Response Prime Rest Rest All London of SE of UK Regions
Yes 67.5 38.9 42.9 47.7 No 31.9 59.7 56.0 51.2 Not stated 0.6 1.4 1.2 1.1
Base: All respondents (163) (221) (259) (643)
Those managing properties in Prime Central London were much more likely than those elsewhere in the country to have seen an increase in tenants haggling with landlords over the rent (68%, compared with 39% of those in the Rest of the South East and 43% of those in the Rest of the UK).
Response Percent of Respondents (%) Q1.13 Q2.13 Q3.13 Q4.13
Yes 49.9 48.9 44.8 47.7 No 49.1 49.7 54.0 51.2
Not stated 0.9 1.4 1.1 1.1
Base: All respondents (527) (507) (524) (643)
Compared with the last survey, there has been a rise in the proportion
of respondents saying they have seen an increase in tenants haggling with landlords over rents in the last six months, with the figure rising from 45% to 48%, largely reversing the fall seen then.

Page 62
Regional Analysis The region with the highest three quarter moving average proportion of respondents saying they had seen an increase in tenants haggling with landlords over rents in the preceding six months was Central London (63%) and the region with the lowest proportion was the North East (35%). The other regions varied between these two extremes with a slight tendency for the figure to fall as distance from London increased.
Percent Who Have Seen an Increase in Tenants Geographic Haggling With Landlords Over Rents (%) Region (three quarter moving average) Q1.13 Q2.13 Q3.13 Q4.13
Central London 62.4 61.8 63.1 62.7 Rest of London 43.6 52.2 51.3 54.6 Rest of South East 45.3 42.5 41.6 41.2 South West 58.2 56.2 56.9 53.9 Midlands 40.1 43.6 41.0 36.6 North West 52.7 55.5 50.4 47.0 North East 53.0 45.4 36.5 34.9 Scotland/Wales/NI 43.7 44.4 43.2 40.0
Base: All respondents (527) (507) (524) (643) Compared with the three quarter moving average figures from the last survey, one region, the Rest of London, had a noticeably higher proportion this quarter (up from 51% to 55%), and two, Central London and the Rest of the South East, had almost unchanged proportions. All the other regions had noticeably lower proportions saying they had seen an increase in tenants haggling with landlords over rents in the preceding six months. The region with the biggest decrease was the Midlands (down from 41% to 37%) followed by the North West (down from 50% to 47%), the South West (down from 57% to 54%) and Scotland, Wales & Northern Ireland (down from 43% to 40%).

Page 63
4.16 What Proportion of Potential/Existing Landlord & Tenant Clients Ask If You Are Licensed? (Q.17) Landlords
More than a quarter of ARLA members’ offices (26%) said that at least some of their potential and existing landlord clients ask them if they are licensed with more than one in twenty (6%) saying that all or most of them do.
However, a higher proportion, amounting to more than a third (36%), said that none of theirs do and a similar proportion (38%) said that hardly any of theirs do.
Percent of Respondents (%) Proportion Prime Rest Rest All London of SE of UK Regions
All 0.6 1.4 0.4 0.8 Most 4.3 4.1 5.8 4.8 Some 19.6 20.4 20.5 20.2 Hardly any 37.4 43.4 33.6 37.9 None 37.4 29.9 39.4 35.6
Not stated 0.6 0.9 0.4 0.6
Base: All respondents (163) (221) (259) (643)
There was some difference between the broad geographic areas on this question with those managing properties in Prime Central London being less likely than their counterparts elsewhere to encounter landlords asking them if they are licensed (25% saying at least some do compared with 26% for those in the Rest of the South East and 27% for those in the Rest of the UK).
Tenants
When it comes to their potential or existing tenants, fewer respondents said that any of theirs asked them if they were licensed with less than one in seven (14%) saying at least some of their potential and existing tenant clients ask them if they are licensed and just 2% saying that most or all of them do. Conversely, half (50%) said that none of theirs do and more than a third (35%) said that hardly any of theirs do.
Percent of Respondents (%) Proportion Prime Rest Rest All London of SE of UK Regions
All 0.6 0.5 - 0.3 Most 2.5 2.3 0.4 1.6 Some 14.1 12.7 10.4 12.1 Hardly any 35.0 36.2 33.6 34.8 None 46.6 47.1 54.8 50.1
Not stated 1.2 1.4 0.8 1.1
Base: All respondents (163) (221) (259) (643)

Page 64
There was also some difference between the broad geographic areas on this question with more respondents from offices managing properties in Prime Central London saying that at least some of their potential and existing tenant clients ask them if they are licensed (17% compared with 16% for those in the Rest of the South East and 11% for those in the Rest of the UK). Summary
It would appear that relatively few ARLA members’ offices’ potential and existing landlord and tenant clients ask them if they are licensed and whilst some clearly do ask this question, for the majority of respondents it comes up only rarely, if at all.
Looking at differences between landlords and tenants, it seems that landlord clients are more likely to ask the question with 26% of respondents saying at least some of them do compared with only about half as many (14%) saying that at least some of their tenant clients ask them this question.
Proportion Percent of Respondents (%) Landlords Tenants
All 0.8 0.3 Most 4.8 1.6 Some 20.2 12.1 Hardly any 37.9 34.8 None 35.6 50.1 Not stated 0.6 1.1
Base: All respondents (643)
Compared with three months ago, as can be seen from the table and chart below showing the average for both landlords and tenants, there

Page 65
has been virtually no change in the proportion saying that at least some of their clients ask them if they are licensed with the figure remaining at 20%.
Proportion Average For Landlords & Tenants (%) Q1.13 Q2.13 Q3.13 Q4.13 All 0.7 0.6 0.4 0.5 Most 3.2 3.6 3.4 3.2 Some 16.1 15.1 16.6 16.2 Hardly any 37.5 36.3 34.0 36.4 None 41.7 43.3 44.2 42.8 Not stated 0.8 1.2 1.4 0.9
Base: All respondents (527) (507) (524) (643)

Page 66
Regional Analysis
The region with the highest three quarter moving average proportion of respondents saying that at least some of their potential or existing landlord clients ask them if they are licensed was the North East (40%) and the region with the lowest three quarter moving average proportion was the Midlands (20%). The other regions varied between these two extremes.
With regard to potential or existing tenant clients, far fewer respondents said that at least some of theirs ask the question with the highest three quarter moving average proportion being in the Rest of London (18%) and the lowest in the Midlands (7%).
Geographic Percent of Respondents Saying Region At Least Some Clients(%) (three quarter moving average) Landlords Tenants
Central London 21.8 15.3 Rest of London 28.2 18.3 Rest of South East 28.6 13.7 South West 27.7 10.5 Midlands 19.7 7.3 North West 22.2 11.2 North East 39.6 12.8 Scotland/Wales/NI 28.4 13.2
Base: All Respondents (643)
With regard to differences between the three quarter moving average proportion of landlords asking if respondents are licensed and the three quarter moving average proportion of tenants doing so, the region with the largest difference was the North East (40% of landlords and 13% of tenants). The region with the smallest difference was Central London (22% of landlords and 15% of tenants).
Compared with three months ago, looking at the three quarter moving average for both landlords and tenants combined, three regions had a

Page 67
larger proportion saying this was the case this quarter, four regions had a smaller proportion and one region had an unchanged proportion. The region showing the largest increase was the South West (up from 15% to 19%) and the region showing the largest decrease was Scotland, Wales & Northern Ireland (down from 25% to 21%).
Geographic Percent of Respondents Saying Region At Least Some Clients (%) (3Q moving average for Landlords & Tenants) Q1.13 Q2.13 Q3.13 Q4.13
Central London 19.4 17.3 18.5 18.5 Rest of London 24.2 25.0 24.5 23.2 Rest of South East 17.8 19.9 20.9 21.2 South West 11.4 13.8 15.4 19.1 Midlands 13.8 14.0 15.0 13.5 North West 19.2 16.5 17.3 16.7 North East 13.6 22.5 24.1 26.2 Scotland/Wales/NI 20.6 20.9 24.7 20.8
Base: All respondents (527) (507) (524) (643)

Page 68
4.17 Have You Seen an Increase in the Last 12 Months in the Proportion of Potential/Existing Landlord and Tenant Clients Asking if You Are Licensed? (Q.18)
Little more than one in twenty ARLA members’ offices (6%) said that they had seen an increase in the proportion of landlord and tenant clients asking them if they are licensed in the last twelve months with the vast majority (88%) saying they had not.
Percent of Respondents (%) Response Prime Rest Rest All London of SE of UK Regions
Yes 5.5 7.2 3.9 6.1 No 75.5 78.7 80.3 88.4
Don't know/not sure 12.3 - - 3.5
Not stated 6.7 - - 1.9
Base: All respondents (163) (221) (259) (643)
There was a slight difference between the broad geographic areas on this question with those managing properties in the Rest of the South East being the most likely to say they had seen an increase (7% compared with 6% for those in Prime Central London and 4% for those in the Rest of the UK). Compared with three months ago, there has been a decrease in the proportion of respondents saying they have seen an increase in landlords and tenants asking if they are licensed with the figure falling from 8% to 6%. Response Percent of Respondents (%)
Q1.13 Q2.13 Q3.13 Q4.13 Yes 9.5 11.0 8.0 6.1 No 77.8 79.5 79.0 88.4
Don't know/not sure 11.4 8.5 8.6 3.5
Not stated 1.3 1.0 4.4 1.9
Base: All respondents (527) (507) (524) (643)
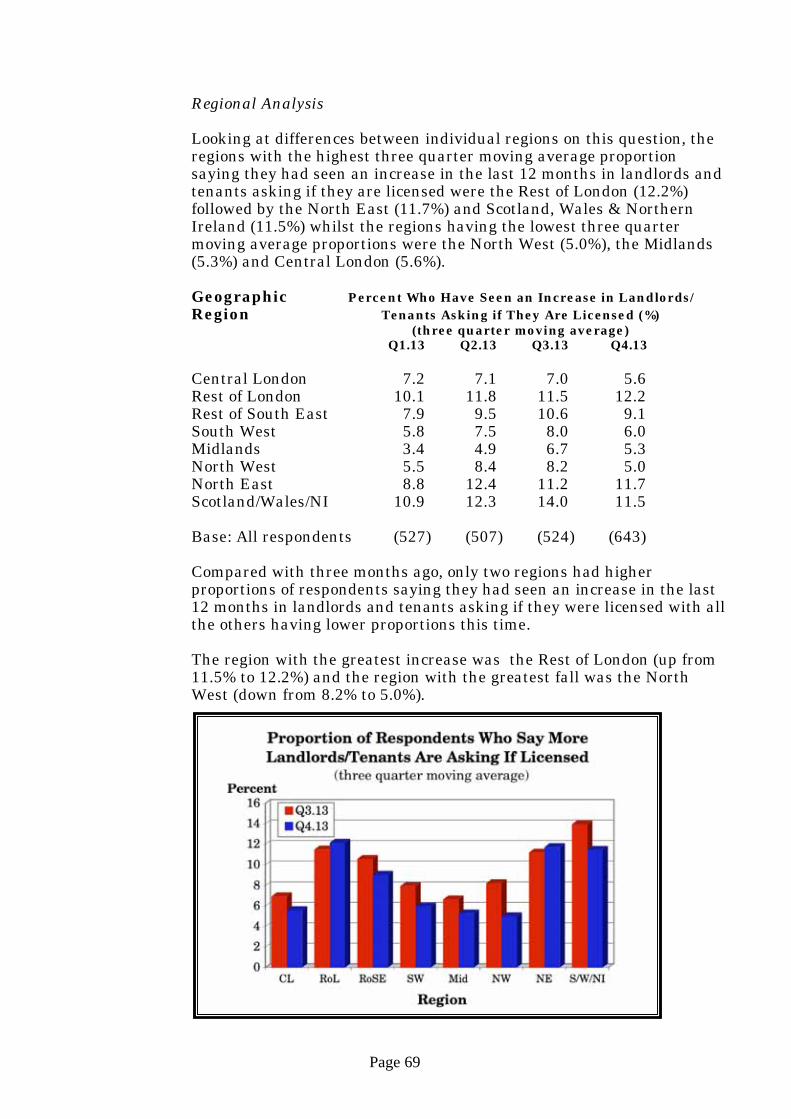
Page 69
Regional Analysis Looking at differences between individual regions on this question, the regions with the highest three quarter moving average proportion saying they had seen an increase in the last 12 months in landlords and tenants asking if they are licensed were the Rest of London (12.2%) followed by the North East (11.7%) and Scotland, Wales & Northern Ireland (11.5%) whilst the regions having the lowest three quarter moving average proportions were the North West (5.0%), the Midlands (5.3%) and Central London (5.6%).
Geographic Percent Who Have Seen an Increase in Landlords/ Region Tenants Asking if They Are Licensed (%) (three quarter moving average) Q1.13 Q2.13 Q3.13 Q4.13
Central London 7.2 7.1 7.0 5.6 Rest of London 10.1 11.8 11.5 12.2 Rest of South East 7.9 9.5 10.6 9.1 South West 5.8 7.5 8.0 6.0 Midlands 3.4 4.9 6.7 5.3 North West 5.5 8.4 8.2 5.0 North East 8.8 12.4 11.2 11.7 Scotland/Wales/NI 10.9 12.3 14.0 11.5
Base: All respondents (527) (507) (524) (643)
Compared with three months ago, only two regions had higher proportions of respondents saying they had seen an increase in the last 12 months in landlords and tenants asking if they were licensed with all the others having lower proportions this time. The region with the greatest increase was the Rest of London (up from 11.5% to 12.2%) and the region with the greatest fall was the North West (down from 8.2% to 5.0%).

Page 70
4.18 Regarding the Proposal in the Government’s Immigration Bill that Prospective Tenants’ Immigration Status be Checked, Would You Feel Confident That You Could Make Those Checks (i.e. check their documentation and ascertain their right to be in the UK)? (Q.19)
Half of ARLA members’ offices (50%) said that they would feel confident that they could make the checks required by the proposal in the Government’s Immigration Bill concerning prospective tenants’ immigration status. However, more than two out of ten respondents (22%) were unsure whether or not they would feel confident about fulfilling that function.
Percent of Respondents (%) Response Prime Rest Rest All London of SE of UK Regions
Yes 59.5 47.5 44.8 49.5 No 24.5 30.3 25.9 27.1 Don't know/not sure 15.3 20.4 28.6 22.4 Not stated 0.6 1.8 0.8 1.1
Base: All respondents (163) (221) (259) (643)
There was some difference between the broad geographic areas on this question with those managing properties in Prime Central London being the most likely to say they would feel confident that they could make the checks required concerning prospective tenants’ immigration status (60% compared with 48% for those in the Rest of the South East and 45% for those in the Rest of the UK).

Page 71
Regional Analysis Looking at differences between individual regions on this question, as this is the first time this question has been asked, the only figures available are for this one quarter. Nevertheless, there appears to be a clear division between regions in the south of the country and those in the north with respondents from regions in the south being more likely to say they feel confident that they could make the checks required concerning prospective tenants’ immigration status than those from regions in the north of the country. The regions with the highest proportions saying they would feel confident that they could make the checks required by the proposal in the Government’s Immigration Bill concerning prospective tenants’ immigration status were Central London (60%) and the South West (59%). The region with the lowest proportion was the North West (32%).
Geographic Percent Who Would Feel Confident Region Q4.13
Central London 59.8 Rest of London 54.8 Rest of South East 47.7 South West 59.2 Midlands 39.7 North West 31.6 North East 44.4 Scotland/Wales/NI 40.0
Base: All respondents (643)

Page 72
4.19 How Are Landlords Currently Acting Over Their NET Investment in Residential Property (Q.20)
More than four out of ten ARLA members’ offices (41%) think that residential landlords are currently marking time with regard to their net investment in residential property.
However, a higher proportion (43%) think landlords are currently increasing their net investment by buying more properties whilst only about a third as many (15%) think that landlords are currently decreasing their net investment by selling properties.
How Landlords Percent of Respondents (%) Are Currently Prime Rest Rest All Acting London of SE of UK Regions
Buying 46.0 47.5 37.1 42.9 Marking time 34.4 36.2 49.0 40.9 Selling 17.2 14.5 13.9 14.9 Not stated 2.5 1.8 - 1.2
Base: All respondents (163) (221) (259) (643)
Looking at the broad geographic areas, those in the Rest of the South East are the most likely to believe that landlords are increasing their net investment by buying properties (48% compared with 46% of those managing properties in Prime Central London and 37% of those in the Rest of the UK). Those managing properties in Prime Central London are more likely than their counterparts elsewhere to think landlords are currently decreasing their net investment (17% compared with 15% for the Rest of the South East and 14% for those the Rest of the UK). Compared with the last survey, the proportion saying that landlords are now buying properties has risen from 37% to 43% to reach its highest level since this question was first asked more than 9 years ago. The proportion saying they are now selling properties has fallen from 16% to
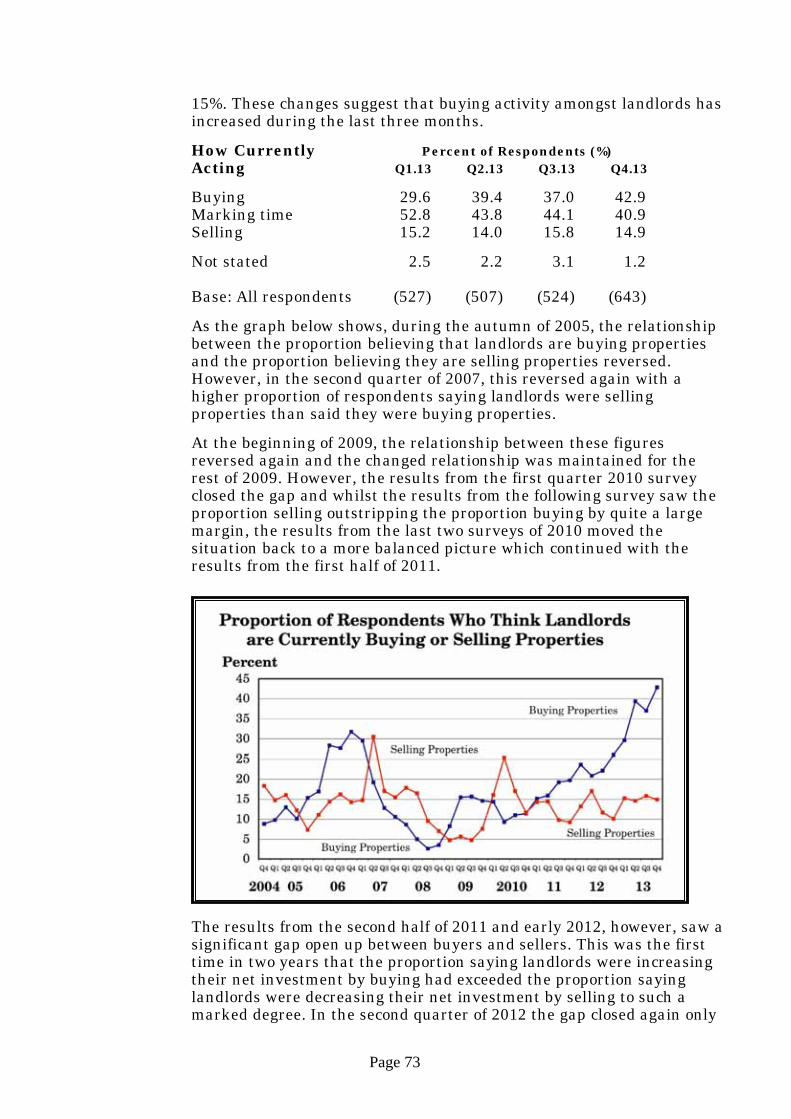
Page 73
15%. These changes suggest that buying activity amongst landlords has increased during the last three months.
How Currently Percent of Respondents (%) Acting Q1.13 Q2.13 Q3.13 Q4.13
Buying 29.6 39.4 37.0 42.9 Marking time 52.8 43.8 44.1 40.9 Selling 15.2 14.0 15.8 14.9
Not stated 2.5 2.2 3.1 1.2
Base: All respondents (527) (507) (524) (643)
As the graph below shows, during the autumn of 2005, the relationship between the proportion believing that landlords are buying properties and the proportion believing they are selling properties reversed. However, in the second quarter of 2007, this reversed again with a higher proportion of respondents saying landlords were selling properties than said they were buying properties.
At the beginning of 2009, the relationship between these figures reversed again and the changed relationship was maintained for the rest of 2009. However, the results from the first quarter 2010 survey closed the gap and whilst the results from the following survey saw the proportion selling outstripping the proportion buying by quite a large margin, the results from the last two surveys of 2010 moved the situation back to a more balanced picture which continued with the results from the first half of 2011.
The results from the second half of 2011 and early 2012, however, saw a significant gap open up between buyers and sellers. This was the first time in two years that the proportion saying landlords were increasing their net investment by buying had exceeded the proportion saying landlords were decreasing their net investment by selling to such a marked degree. In the second quarter of 2012 the gap closed again only

Page 74
to reopen with the results from the third quarter and to widen even more with the results from the fourth quarter. The dramatic results from the second quarter of 2013 pushed the proportion saying landlords are currently increasing the size of their portfolios by buying property to its highest ever level and the gap between those saying landlords are buying and those saying landlords are selling reached it’s widest expanse. Against this backdrop, the decline seen in the third quarter of 2013 in the proportion saying landlords are currently expanding their portfolios by buying properties was small and the large increase seen this quarter has more than reversed that fall, again taking the figure to an all time record level.

Page 75
Regional Analysis There was a wide variation in the three quarter moving average figures for the different regions on this question with the regions showing the greatest margin of respondents saying landlords are increasing their net investment by buying over those saying they are decreasing their net investment by selling being the North East (43% for buying compared with 9% for selling), the Rest of the South East (44% for buying compared with 13% for selling), the Rest of London (41% for buying compared with 15% for selling) and the Central London (43% for buying compared with 17% for selling). The regions showing the smallest difference were the South West (32% for buying compared with 22% for selling), the North West (37% for buying compared with 20% for selling) and Scotland, Wales & Northern Ireland (30% for buying compared with 14% for selling).
Geographic Percent of Respondents – Q4.13 (%) Region (three quarter moving average) Buying Selling
Central London 42.5 17.1 Rest of London 41.4 15.0 Rest of South East 43.9 13.4 South West 31.8 21.7 Midlands 38.0 10.8 North West 36.9 19.7 North East 42.9 9.4 Scotland/Wales/NI 29.8 14.1
Base: All respondents (643)
Compared with three months ago, all regions bar one saw an increase in the three quarter moving average proportion of respondents saying that they thought landlords were increasing their net investment by buying properties, the exception being Scotland, Wales & Northern Ireland.

Page 76
The largest increases in the three quarter moving average proportion saying landlords are buying were those for the Rest of the South East (where the figure rose from 38% to 44%), Central London (up from 35% to 43%) and the North West (up from 32% to 37%).
Percent Saying Landlords Geographic Are Currently Buying (%) Region (three quarter moving average) Q1.13 Q2.13 Q3.13 Q4.13
Central London 23.9 32.8 35.3 42.5 Rest of London 29.3 35.2 38.8 41.4 Rest of South East 28.5 33.9 37.6 43.9 South West 19.6 23.8 29.6 31.8 Midlands 26.2 30.8 33.9 38.0 North West 20.2 30.1 31.9 36.9 North East 29.9 35.6 38.8 42.9 Scotland/Wales/NI 22.3 25.6 30.5 29.8
Base: All respondents (527) (507) (524) (643)

Page 77
4.20 Types of New Prospective Tenants Currently Encountered Most Often (Q.21)
Analysis of the results for this question enables average rankings for each type of new prospective tenant to be calculated. Clearly, two types of new prospective tenant are encountered more often than the others with these being those who have been renting for some years because they prefer renting to buying (average ranking of 1.7) and those who would be first time buyers except that they cannot get a mortgage (average ranking of 1.8). Behind these, those who are having to, or have had to sell their house because they can no longer afford the mortgage (average ranking of 2.9) are more often encountered by respondents than those who are having or have had their house repossessed (average ranking of (3.7)
Average Ranking Type of Tenant Prime Rest Rest All London of SE of UK Regions
FTBs who can't get mortgage 1.9 1.7 1.8 1.8 Can no longer afford the mortgage 3.0 3.0 2.8 2.9 Had/having house repossessed 3.8 3.8 3.6 3.7 Prefer renting to buying 1.6 1.7 1.8 1.7
Base: All respondents (163) (221) (259) (643)
Looking at the broad geographic areas, there is very little difference in the average rankings with the exception that those managing properties in Prime Central London were more likely to encounter tenants who preferred renting to buying (ranking of 1.6) than those who would be first time buyers but who could not get a mortgage (ranking of 1.9). However, when it comes to respondents in the Rest of the South East and the Rest of the UK, a different situation emerges in that respondents from these geographic areas were equally likely to encounter tenants who would be first time buyers but who could not get a mortgage and those who preferred renting to buying (average rankings of 1.7 in both cases for the Rest of the South east and of 1.8 in both cases for the Rest of the UK). Compared with three months ago, there has been a significant change in the average rankings of the listed buyer types with the two most commonly encountered prospective tenant types changing places.
Geographic Average Ranking Region Q1.13 Q2.13 Q3.13 Q4.13
FTBs who can't get mortgage 1.7 1.7 1.6 1.8 Can no longer afford the mortgage 2.9 2.8 2.8 2.9 Had/having house repossessed 3.7 3.8 3.7 3.7 Prefer renting to buying 1.9 1.8 1.9 1.7
Base: All respondents (527) (507) (524) (643)

Page 78
Those who would be first time buyers except that they cannot get a mortgage were ranked lower this time (1.8 compared with 1.6) and those who preferred renting to buying were ranked higher (1.7 compared with 1.9) suggesting that potential first time buyers are now less likely to be encountered as prospective tenants than those who prefer renting to buying.

Page 79
Regional Analysis There was more variation between the individual regions on this question with the main one being that respondents in Central London were more likely to encounter those who have been renting for some years because they prefer renting to buying (average ranking of 1.5) than they were to encounter those who would be first time buyers except that they cannot get a mortgage (average ranking of 2.0). A similar situation prevailed for respondents in the South West (1.8 for prefer renting to buying compared with 1.9 for those who would be first time buyers) and respondents in Scotland, Wales & Northern Ireland (also 1.8 for prefer renting to buying compared with 1.9 for those who would be first time buyers). Respondents in all the other regions except two ranked them the other way round, the exceptions being the Rest of the South East and the North West, where they were ranked equally. Average Ranking – Q4.13 Type of Tenant Region CL RoL SE SW Mid NW NE S/W/NI
FTBs who can't get mortgage 2.0 1.7 1.7 1.9 1.7 1.9 1.6 1.9 Prefer renting to buying 1.5 1.8 1.7 1.8 1.8 1.9 1.8 1.8 Can no longer afford the mortgage 3.0 3.1 2.9 2.8 2.9 2.7 2.9 2.9 House repossessed 3.9 3.7 3.8 3.6 3.7 3.5 3.5 3.6
Base: All respondents (643) In the table below are the results from this question for the third quarter from which it can be seen that there has been some change in the ranking of the different types of tenant in terms of why they are choosing to rent property. Principally, the ranking of those who would be first time buyers except that they cannot get a mortgage has, in all but three cases, declined, the exceptions being Central London and the Midlands, where its ranking is unchanged and the North East where its ranking has improved. Average Ranking – Q3.13 Type of Tenant Region CL RoL SE SW Mid NW NE S/W/NI
FTBs who can't get mortgage 2.0 1.5 1.5 1.4 1.7 1.6 1.9 1.6 Prefer renting to buying 1.6 1.9 2.0 2.0 1.7 1.9 1.7 1.9 Can no longer afford the mortgage 2.9 3.0 2.8 2.9 2.8 2.8 2.7 2.8 House repossessed 3.8 3.7 3.7 3.7 3.7 3.6 3.7 2.7
Base: All respondents (524) This change tends to suggest that those who would be first time buyers except that they cannot get a mortgage are now finding it easier to get a mortgage and are therefore less likely to be prospective tenants.