Embed Size (px)
Citation preview

ARKANSAS EDUCATION REPORT Volume 13, Issue 4
OUTSTANDING EDUCATIONAL PERFORMANCE AWARDS: HIGHLIGHTING HIGH-ACHIEVING ARKANSAS SCHOOLS,
2016
BEATING THE ODDS: HIGH-ACHIEVING SCHOOLS BASED ON THE ACT ASPIRE
EXAMINATIONS, SERVING LOW-INCOME COMMUNITIES
March 15, 2017 By:
Charlene A. Reid Gary W. Ritter
Office for Education Policy University of Arkansas
211 Graduate Education Building Fayetteville, AR 72701 Phone: (479) 575-3773
Fax: (479) 575-3196 E-mail: [email protected]
Outstanding Educational Performance Awards 2016 Page ii
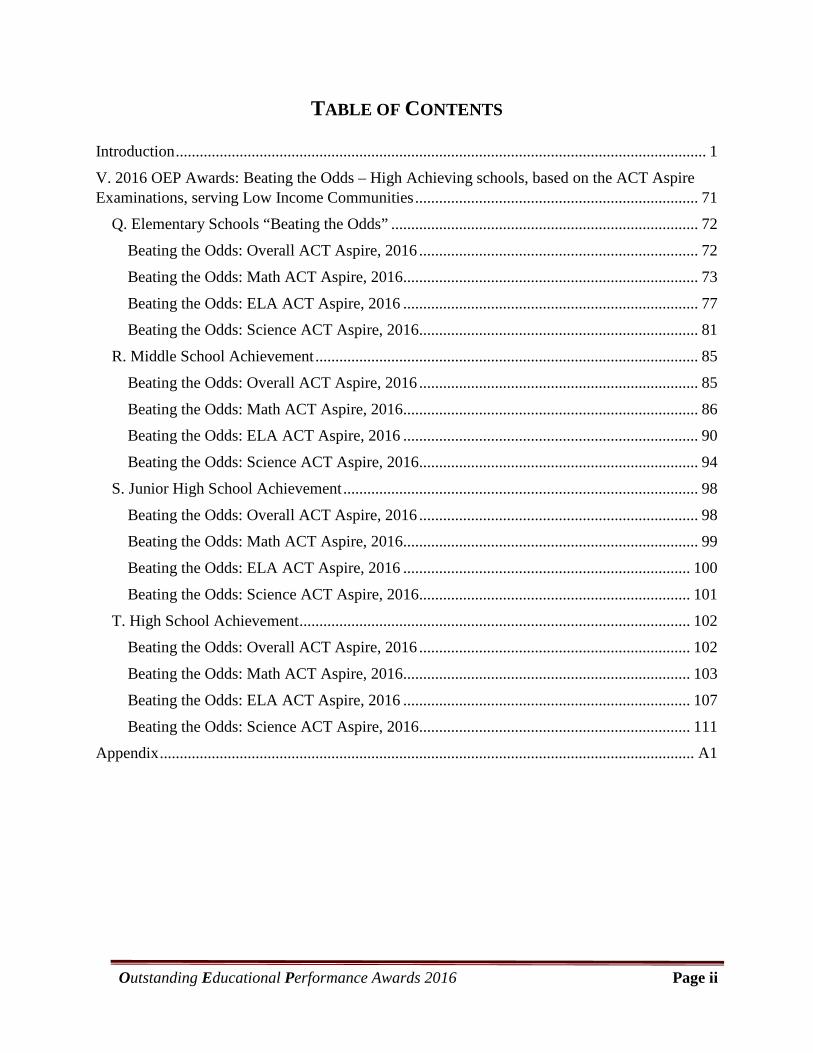
TABLE OF CONTENTS
Introduction ..................................................................................................................................... 1
V. 2016 OEP Awards: Beating the Odds – High Achieving schools, based on the ACT Aspire Examinations, serving Low Income Communities ....................................................................... 71
Q. Elementary Schools “Beating the Odds” ............................................................................. 72
Beating the Odds: Overall ACT Aspire, 2016 ...................................................................... 72
Beating the Odds: Math ACT Aspire, 2016.......................................................................... 73
Beating the Odds: ELA ACT Aspire, 2016 .......................................................................... 77
Beating the Odds: Science ACT Aspire, 2016...................................................................... 81
R. Middle School Achievement ................................................................................................ 85
Beating the Odds: Overall ACT Aspire, 2016 ...................................................................... 85
Beating the Odds: Math ACT Aspire, 2016.......................................................................... 86
Beating the Odds: ELA ACT Aspire, 2016 .......................................................................... 90
Beating the Odds: Science ACT Aspire, 2016...................................................................... 94
S. Junior High School Achievement ......................................................................................... 98
Beating the Odds: Overall ACT Aspire, 2016 ...................................................................... 98
Beating the Odds: Math ACT Aspire, 2016.......................................................................... 99
Beating the Odds: ELA ACT Aspire, 2016 ........................................................................ 100
Beating the Odds: Science ACT Aspire, 2016.................................................................... 101
T. High School Achievement .................................................................................................. 102
Beating the Odds: Overall ACT Aspire, 2016 .................................................................... 102
Beating the Odds: Math ACT Aspire, 2016........................................................................ 103
Beating the Odds: ELA ACT Aspire, 2016 ........................................................................ 107
Beating the Odds: Science ACT Aspire, 2016.................................................................... 111
Appendix ...................................................................................................................................... A1

Outstanding Educational Performance Awards 2016 Page 1
INTRODUCTION
Since our founding in 2003, the mission of the Office for Education Policy has examined pressing issues through the lens of academic research and disseminating our findings to educators, policymakers, and other stakeholders around Arkansas. Every once in a while, however, we think it is okay to stray from issue analysis and simply share some good news!
In this Arkansas Education Report (AER), we aim to highlight excellent performance and offer our congratulations. To that end, we are happy to highlight many excellent schools around the state in our now-annual AER, entitled the Outstanding Educational Performance Awards, or the OEP awards.
In the 2015-16 academic year, Arkansas students have yet again undergone a change in their assessment of student performance to replace the Partnership for Assessment of Readiness for College Careers (PARCC). The ACT Aspire examinations were administered to students in grades 3 through 10 in Math, Reading, Writing, English and Science. For the purposes of this report, the scores obtained in Reading, Writing and English were combined to create a combined ELA score.
This edition of the OEP Awards will highlight high-performing schools in Arkansas based on their performance in the Math, ELA and Science exams at the Elementary, Middle, Junior and High school level.
In 2012, we introduced an academic performance indicator, the “GPA” rating system, to rank the highest-performing schools. Unlike the commonly reported percentage of students scoring at or above the proficient level on each assessment which suffers from being an “all-or-nothing” measure in which a student is either proficient or not, the “GPA” includes information provided by student scores that are placed into the four different performance categories: In Need of Support, Close to Meeting Expectations, Ready, and Exceeded Expectations.
Our GPA indicator gives the most credit to students who have exceeded expectations and the least credit to those that are in need of support. In this GPA measure, parallel to the familiar grade point average for individual students, a 4.0 is a perfect score. The GPA measure, we believe, is a better representation of student achievement on statewide standardized exams.
ACT Aspire Performance Category GPA Points Awarded Exceeded Expectations 4.0 Ready 3.0 Close to Meeting Expectations 2.0 In Need of Support 1.0
Outstanding Educational Performance Awards 2016 Page 2
In this report, we are presenting a list of the top 20 schools in each area. In some cases, these “top 20 lists” will contain more than 20 schools as some schools’ GPA scores will be identical.
In the following weeks, we will focus on high-performing elementary schools, middle schools, and high schools in the various regions across the state. We will conclude this edition of the report by highlighting schools that are beating the odds (that is, schools that have high levels of student achievement while serving a high percentage of low-income students). Our release schedule is:
• High-Achieving Elementary Schools • High-Achieving Middle Schools • High-Achieving Junior High Schools • High-Achieving High Schools • Beating the Odds: High-Achieving Schools Serving Low-Income Communities

Outstanding Educational Performance Awards 2016 Page 71
V. 2016 OEP AWARDS: BEATING THE ODDS – HIGH ACHIEVING SCHOOLS, BASED ON THE ACT ASPIRE EXAMINATIONS, SERVING
LOW INCOME COMMUNITIES
This section highlights high-achieving schools across Arkansas based on the ACT Aspire examinations in Math, English Language Arts (ELA) and Science for the 20115-16 academic year. For these awards, we consider schools that serve free or reduced lunch to at least 66% of the student body.
This section is divided into subsections based the three exams. Schools are ranked using the GPA performance measure (explained in the Introduction) in each subject. Because the exams are not “grade-specific,” schools in each of the subsections are categorized differently to account for school performance based on grade levels served; this is explained further in the introduction text in each subsection. Furthermore, each subsection includes the top schools, the top “high-poverty” schools, and the top five schools by region. In the subsections, the tables present the high-achieving schools for the noted category and subject using the GPA performance measure. These tables include the region in which the school is located, the number of test takers, the percentage of students that met or exceeded expectations, and the GPA of the school in that particular subject.

Outstanding Educational Performance Awards 2016 Page 72
Q. Elementary Schools “Beating the Odds”
Beating the Odds: Overall ACT Aspire, 2016
Table 97: Top 10 "High-Poverty" Elementary Schools in Arkansas based on Overall ACT Aspire Achievement (Math, ELA and Science combined)
School (District) Region Grades Served %FRL
# of Test
Takers
% Met Readiness
Benchmark GPA
1 Salem Elementary (Salem) NE K-6 69% 696 75% 3.07
2 Clinton Elementary (Clinton) NW K-3 71% 276 65% 2.93
3 Bismarck Elementary (Bismarck) CN K-4 74% 426 64% 2.85
3 Forest Heights STEM Academy (Little Rock) CN K-8 66% 1,509 64% 2.84
5 Nemo Vista Elementary (Nemo Vista) NW K-5 66% 240 65% 2.78
6 College Station Elementary (Pulaski County Special)
CN P-5 80% 354 64% 2.77
6 Amanda Gist Elementary (Cotter) NW K-6 73% 675 61% 2.77
8 Eagle Heights Elementary (Harrison) NW K-4 67% 183 63% 2.76
8 Des Arc Elementary (Des Arc) SE P-6 73% 450 60% 2.76
10 Eastside Elementary (Rogers) NW K-5 68% 854 60% 2.74

Outstanding Educational Performance Awards 2016 Page 73
Beating the Odds: Math ACT Aspire, 2016
Table 98: Top 10 "High-Poverty" Elementary Schools in Arkansas based on ACT Aspire Math Achievement
School (District) Region Grades Served %FRL
# of Test
Takers
% Met Readiness
Benchmark GPA
1 Clinton Elementary (Clinton) NW K-3 71% 92 77% 3.14
1 Salem Elementary (Salem) NE K-6 69% 232 81% 3.14
3 Des Arc Elementary (Des Arc) SE P-6 73% 150 73% 3.11
3 Centerpoint Primary (Centerpoint) SW P-3 79% 80 73% 3.11
5 Bismarck Elementary (Bismarck) CN K-4 74% 142 74% 3.06
6 Amanda Gist Elementary (Cotter) NW K-6 73% 225 72% 3.00
7 Kingsland Elementary (Cleveland County) SE K-5 81% 43 74% 2.98
8 Mammoth Spring Elementary (Mammoth Spring)
NE K-6 69% 149 71% 2.97
9 Tuckerman Elementary (Jackson Co.) NE K-4 72% 115 74% 2.96
10 Norfork Elementary (Norfork) NW K-6 84% 131 68% 2.95

Outstanding Educational Performance Awards 2016 Page 74
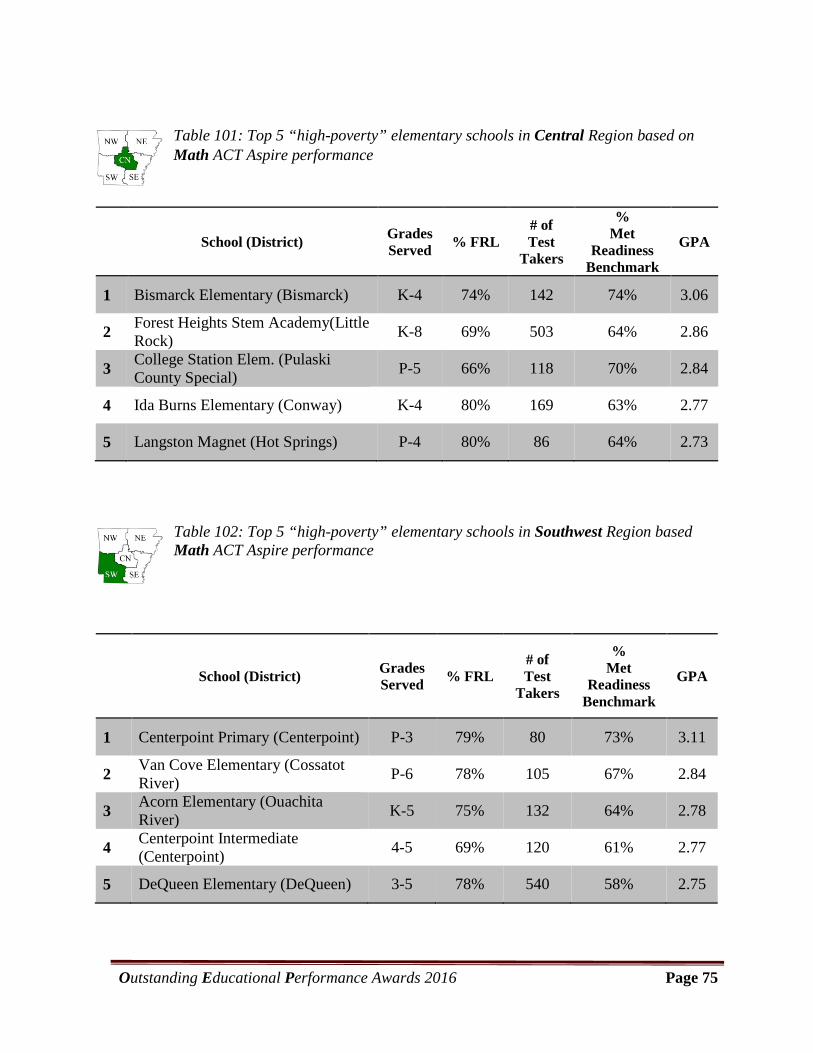
Table 99-103: Top 5 “High-Poverty” Elementary Schools in Arkansas by Region, Math Achievement.
Table 99: Top 5 “high-poverty” elementary schools in Northwest Region based on Math ACT Aspire performance
School (District) Grades Served % FRL
# of Test
Takers
% Met
Readiness Benchmark
GPA
1 Clinton Elementary (Clinton) K-3 71% 92 77% 3.14
2 Amanda Gist Elementary (Cotter) K-6 73% 225 72% 3.00
3 Norfork Elementary (Norfork) K-6 84% 131 68% 2.95
4 Nemo Vista Elementary (Nemo Vista) K-5 66% 80 75% 2.91
5 Eastside Elementary (Rogers) K-5 68% 285 67% 2.89
Table 100: Top 5 “high-poverty” elementary schools in Northeast Region based on Math ACT Aspire performance
School (District) Grades Served % FRL
# of Test
Takers
% Met
Readiness Benchmark
GPA
1 Salem Elementary (Salem) K-6 69% 232 81% 3.14
2 Mammoth Spring Elementary (Mammoth Spring) K-6 69% 149 71% 2.97
3 Tuckerman Elementary (Jackson Co.) K-4 72% 115 74% 2.96
4 Melbourne Elementary (Melbourne) K-6 66% 232 72% 2.89
5 West Elementary (Batesville) K-6 72% 302 67% 2.86
Outstanding Educational Performance Awards 2016 Page 75
Table 101: Top 5 “high-poverty” elementary schools in Central Region based on Math ACT Aspire performance
School (District) Grades Served % FRL
# of Test
Takers
% Met
Readiness Benchmark
GPA
1 Bismarck Elementary (Bismarck) K-4 74% 142 74% 3.06
2 Forest Heights Stem Academy(Little Rock) K-8 69% 503 64% 2.86
3 College Station Elem. (Pulaski County Special) P-5 66% 118 70% 2.84
4 Ida Burns Elementary (Conway) K-4 80% 169 63% 2.77
5 Langston Magnet (Hot Springs) P-4 80% 86 64% 2.73
Table 102: Top 5 “high-poverty” elementary schools in Southwest Region based Math ACT Aspire performance
School (District) Grades Served % FRL
# of Test
Takers
% Met
Readiness Benchmark
GPA
1 Centerpoint Primary (Centerpoint) P-3 79% 80 73% 3.11
2 Van Cove Elementary (Cossatot River) P-6 78% 105 67% 2.84
3 Acorn Elementary (Ouachita River) K-5 75% 132 64% 2.78
4 Centerpoint Intermediate (Centerpoint) 4-5 69% 120 61% 2.77
5 DeQueen Elementary (DeQueen) 3-5 78% 540 58% 2.75
Outstanding Educational Performance Awards 2016 Page 76
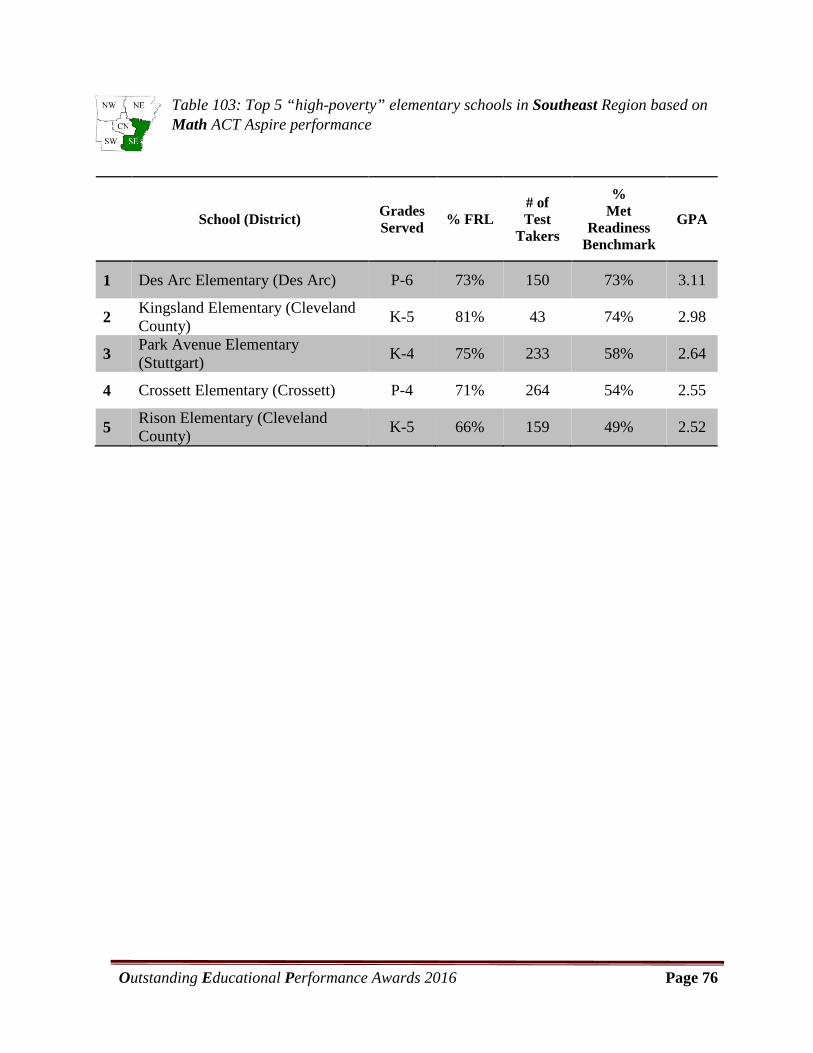
Table 103: Top 5 “high-poverty” elementary schools in Southeast Region based on Math ACT Aspire performance
School (District) Grades Served % FRL
# of Test
Takers
% Met
Readiness Benchmark
GPA
1 Des Arc Elementary (Des Arc) P-6 73% 150 73% 3.11
2 Kingsland Elementary (Cleveland County) K-5 81% 43 74% 2.98
3 Park Avenue Elementary (Stuttgart) K-4 75% 233 58% 2.64
4 Crossett Elementary (Crossett) P-4 71% 264 54% 2.55
5 Rison Elementary (Cleveland County) K-5 66% 159 49% 2.52

Outstanding Educational Performance Awards 2016 Page 77
Beating the Odds: ELA ACT Aspire, 2016
Table 104: Top 10 "High-Poverty" Elementary Schools in Arkansas based on ACT Aspire ELA Achievement
School (District) Region Grades Served %FRL
# of Test
Takers
% Met Readiness
Benchmark GPA
1 Salem Elementary (Salem) NE K-6 69% 232 73% 3.13
2 Forest Heights STEM Academy (Little Rock) CN K-8 66% 503 70% 3.01
3 College Station Elementary (Pulaski County Special)
CN P-5 80% 118 66% 2.86
4 Eastside Elementary (Rogers) NW K-5 68% 284 63% 2.83
5 Clinton Elementary (Clinton) NW K-3 71% 92 58% 2.81
6 Eagle Heights Elementary (Harrison) NW K-4 67% 61 64% 2.80
6 Delight Elementary (South Pike County) SW K-6 72% 59 63% 2.80
6 Nemo Vista Elementary (Nemo Vista) NW K-5 66% 80 60% 2.80
9 Bismarck Elementary (Bismarck) CN K-4 74% 142 59% 2.77
10 Viola Elementary (Viola) NE K-6 70% 126 60% 2.72

Outstanding Educational Performance Awards 2016 Page 78
Table 105-109: Top 5 Elementary Schools in Arkansas by Region, ACT Aspire ELA Achievement.
Table 105: Top 5 “high-poverty” elementary schools in Northwest Region based on ELA ACT Aspire performance
School (District) Grades Served % FRL
# of Test
Takers
% Met
Readiness Benchmark
GPA
1 Eastside Elementary (Rogers) K-5 68% 283 63% 2.75 1 Clinton Elementary (Clinton) K-3 71% 92 58% 2.75 3 Eagle Heights Elementary (Harrison) K-4 67% 61 64% 2.80
4 Nemo Vista Elementary (Nemo Vista) K-5 66% 79 61% 2.75
5 Omaha Elementary (Omaha) K-6 83% 108 59% 2.71
Table 106: Top 5 “high-poverty” elementary schools in Northeast Region based on ELA ACT Aspire performance
School (District) Grades Served % FRL
# of Test
Takers
% Met
Readiness Benchmark
GPA
1 Salem Elementary (Salem) K-6 69% 232 73% 3.13
2 Viola Elementary (Viola) K-6 70% 126 60% 2.72
3 Hillcrest Elementary (Hillcrest) K-6 75% 117 58% 2.71
4 Buffalo Is. Central East Elementary (Buffalo Is. Central) P-6 72% 113 58% 2.68
5 West Elementary (Batesville) K-6 72% 301 57% 2.67

Outstanding Educational Performance Awards 2016 Page 79
Table 107: Top 5 “high-poverty” elementary schools in Central Region based on ELA ACT Aspire performance
School (District) Grades Served % FRL
# of Test
Takers
% Met
Readiness Benchmark
GPA
1 Forest Heights Stem Academy (Little Rock) K-8 66% 503 70% 3.01
2 College Station Elementary (Pulaski County Special) P-5 80% 118 66% 2.86
3 Bismarck Elementary (Bismarck) K-4 74% 142 59% 2.77
4 Geyer Springs Gifted And Talented Academy (Little Rock) 2-5 89% 129 59% 2.66
5 Joe T. Robinson Elementary (Pulaski County Special) P-5 73% 74 45% 2.38
Table 108: Top 5 “high-poverty” elementary schools in Southwest Region based on ELA ACT Aspire performance
School (District) Grades Served % FRL
# of Test
Takers
% Met
Readiness Benchmark
GPA
1 Delight Elementary (South Pike County) K-6 72% 59 63% 2.80
2 Van Cove Elementary (Cossatot River) P-6 78% 105 58% 2.67
3 Joann Walters Elementary (Dierks) K-6 70% 160 52% 2.54
4 Wickes Elementary (Cossatot River) P-6 81% 162 51% 2.49
4 Fouke Elementary (Fouke) P-5 68% 247 51% 2.49
Outstanding Educational Performance Awards 2016 Page 80
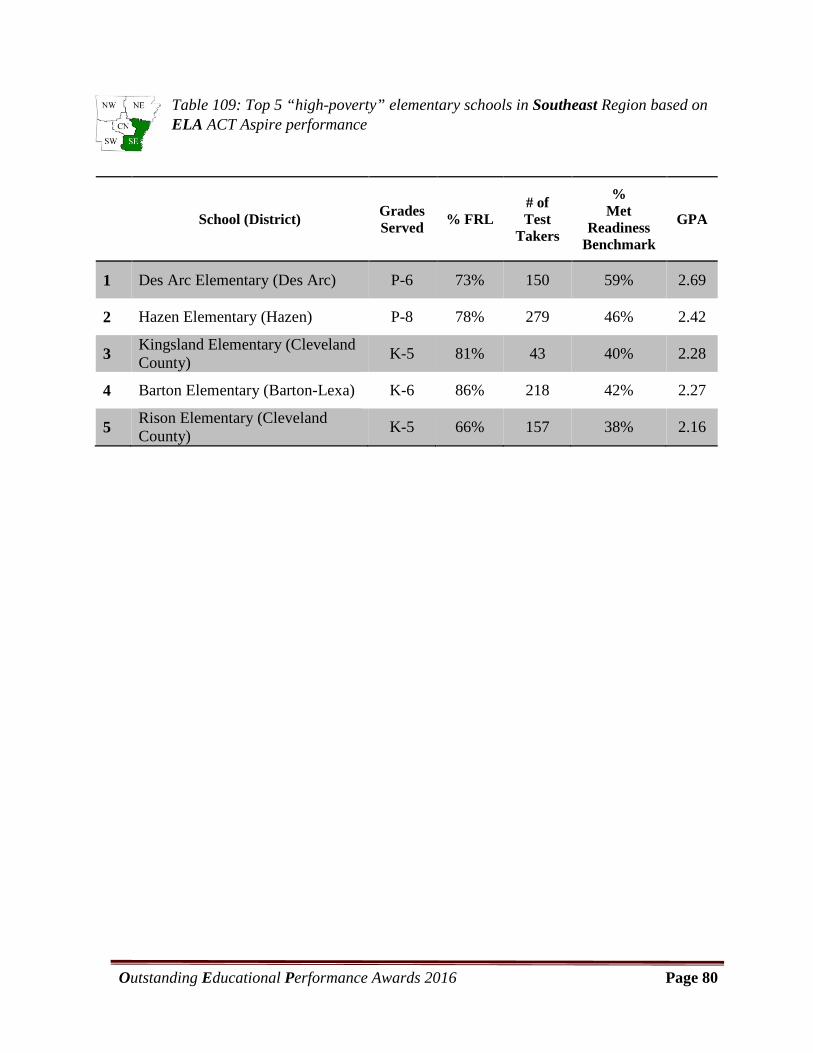
Table 109: Top 5 “high-poverty” elementary schools in Southeast Region based on ELA ACT Aspire performance
School (District) Grades Served % FRL
# of Test
Takers
% Met
Readiness Benchmark
GPA
1 Des Arc Elementary (Des Arc) P-6 73% 150 59% 2.69
2 Hazen Elementary (Hazen) P-8 78% 279 46% 2.42
3 Kingsland Elementary (Cleveland County) K-5 81% 43 40% 2.28
4 Barton Elementary (Barton-Lexa) K-6 86% 218 42% 2.27
5 Rison Elementary (Cleveland County) K-5 66% 157 38% 2.16
Outstanding Educational Performance Awards 2016 Page 81
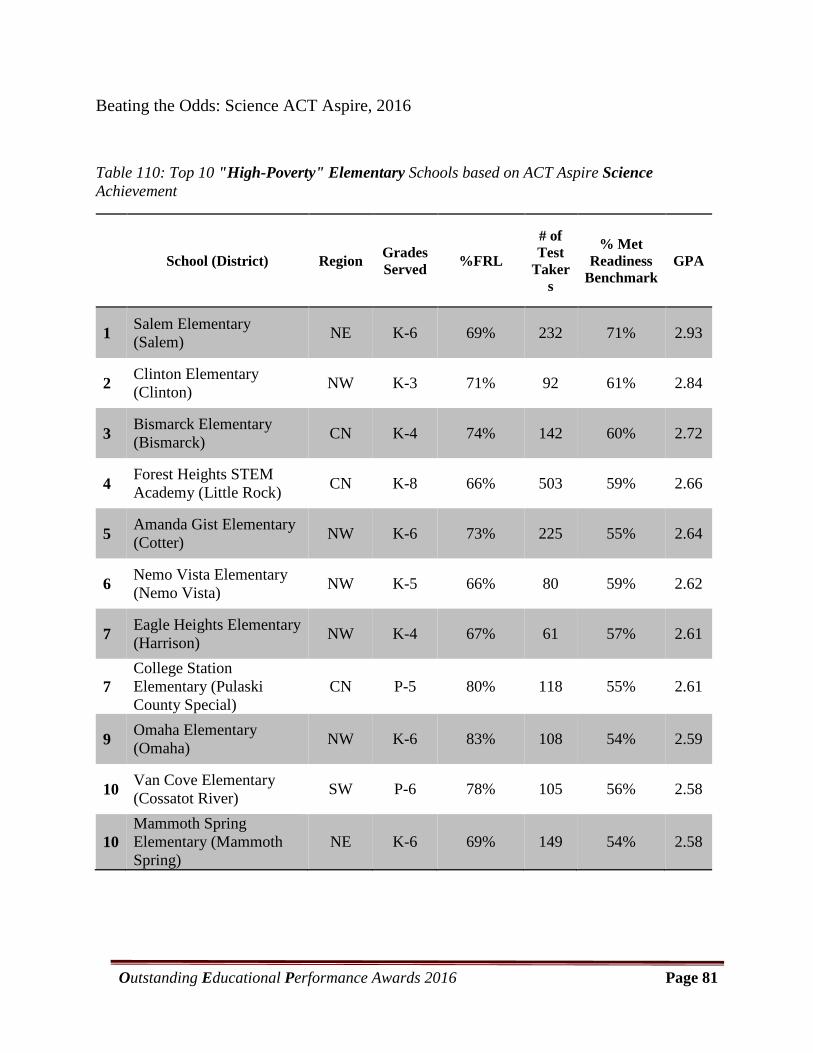
Beating the Odds: Science ACT Aspire, 2016
Table 110: Top 10 "High-Poverty" Elementary Schools based on ACT Aspire Science Achievement
School (District) Region Grades Served %FRL
# of Test
Takers
% Met Readiness
Benchmark GPA
1 Salem Elementary (Salem) NE K-6 69% 232 71% 2.93
2 Clinton Elementary (Clinton) NW K-3 71% 92 61% 2.84
3 Bismarck Elementary (Bismarck) CN K-4 74% 142 60% 2.72
4 Forest Heights STEM Academy (Little Rock) CN K-8 66% 503 59% 2.66
5 Amanda Gist Elementary (Cotter) NW K-6 73% 225 55% 2.64
6 Nemo Vista Elementary (Nemo Vista) NW K-5 66% 80 59% 2.62
7 Eagle Heights Elementary (Harrison) NW K-4 67% 61 57% 2.61
7 College Station Elementary (Pulaski County Special)
CN P-5 80% 118 55% 2.61
9 Omaha Elementary (Omaha) NW K-6 83% 108 54% 2.59
10 Van Cove Elementary (Cossatot River) SW P-6 78% 105 56% 2.58
10 Mammoth Spring Elementary (Mammoth Spring)
NE K-6 69% 149 54% 2.58
Outstanding Educational Performance Awards 2016 Page 82
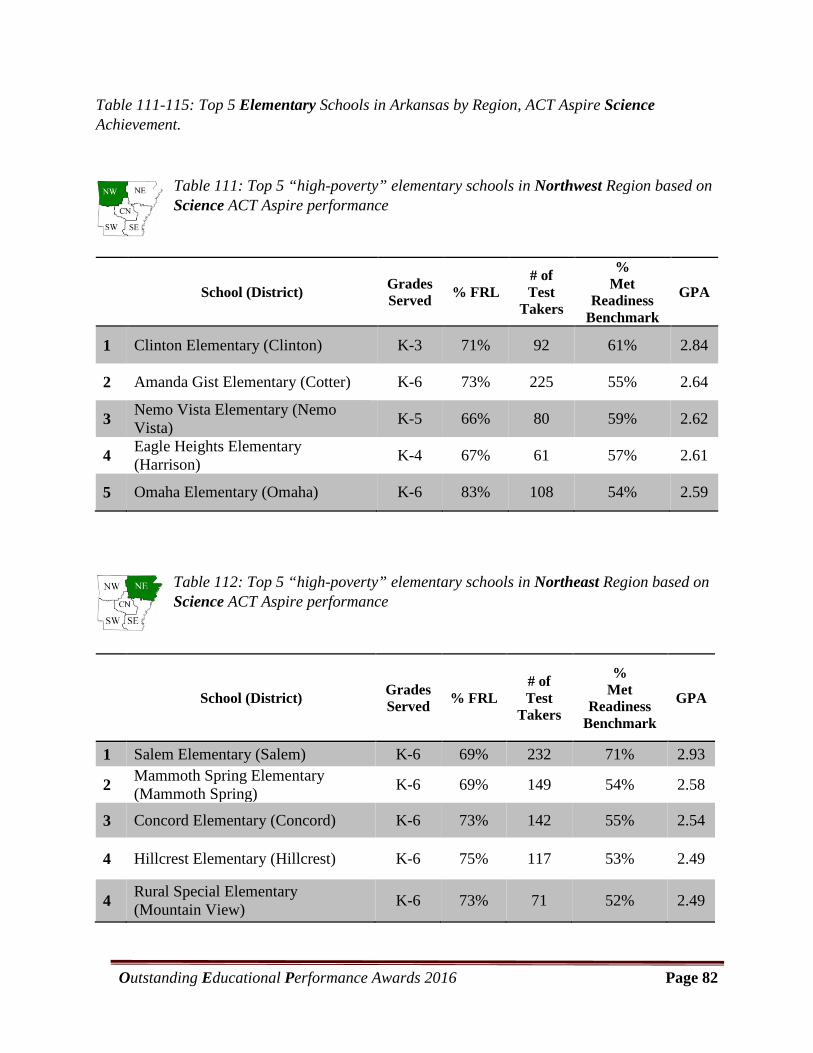
Table 111-115: Top 5 Elementary Schools in Arkansas by Region, ACT Aspire Science Achievement.
Table 111: Top 5 “high-poverty” elementary schools in Northwest Region based on Science ACT Aspire performance
School (District) Grades Served % FRL
# of Test
Takers
% Met
Readiness Benchmark
GPA
1 Clinton Elementary (Clinton) K-3 71% 92 61% 2.84
2 Amanda Gist Elementary (Cotter) K-6 73% 225 55% 2.64
3 Nemo Vista Elementary (Nemo Vista) K-5 66% 80 59% 2.62
4 Eagle Heights Elementary (Harrison) K-4 67% 61 57% 2.61
5 Omaha Elementary (Omaha) K-6 83% 108 54% 2.59
Table 112: Top 5 “high-poverty” elementary schools in Northeast Region based on Science ACT Aspire performance
School (District) Grades Served % FRL
# of Test
Takers
% Met
Readiness Benchmark
GPA
1 Salem Elementary (Salem) K-6 69% 232 71% 2.93
2 Mammoth Spring Elementary (Mammoth Spring) K-6 69% 149 54% 2.58
3 Concord Elementary (Concord) K-6 73% 142 55% 2.54
4 Hillcrest Elementary (Hillcrest) K-6 75% 117 53% 2.49
4 Rural Special Elementary (Mountain View) K-6 73% 71 52% 2.49

Outstanding Educational Performance Awards 2016 Page 83
Table 113: Top 5 “high-poverty” elementary schools in Central Region based on Science ACT Aspire performance
School (District) Grades Served % FRL
# of Test
Takers
% Met
Readiness Benchmark
GPA
1 Bismarck Elementary (Bismarck) K-4 74% 142 60% 2.72
2 Forest Heights Stem Academy (Little Rock) K-8 66% 503 59% 2.66
3 College Station Elementary (Pulaski County Special) P-5 80% 118 55% 2.61
4 Geyer Springs Gifted And Talented Academy (Little Rock) 2-5 89% 129 42% 2.30
5 Ida Burns Elementary (Conway) K-4 73% 169 41% 2.21
Table 114: Top 5 “high-poverty” elementary schools in Southwest Region based on Science ACT Aspire performance
School (District) Grades Served % FRL
# of Test
Takers
% Met
Readiness Benchmark
GPA
1 Van Cove Elementary (Cossatot River) P-6 78% 105 56% 2.58
2 Centerpoint Primary (Centerpoint) P-3 79% 80 51% 2.50
3 Acorn Elementary (Ouachita River) K-5 75% 132 46% 2.45
4 Delight Elementary (South Pike County) K-6 72% 59 51% 2.44
5 Wickes Elementary (Cossatot River) P-6 81% 162 49% 2.40
5 Joann Walters Elementary (Dierks) K-6 70% 160 47% 2.40

Outstanding Educational Performance Awards 2016 Page 84
Table 115: Top 5 “high-poverty” elementary schools in Southeast Region based on Science ACT Aspire performance
School (District) Grades Served % FRL
# of Test
Takers
% Met
Readiness Benchmark
GPA
1 Des Arc Elementary (Des Arc) P-6 73% 150 49% 2.47
2 Kingsland Elementary (Cleveland County) K-5 81% 43 44% 2.25
3 DeWitt Elementary (DeWitt) K-5 70% 245 35% 2.05
4 Rison Elementary (Cleveland County) K-5 66% 159 33% 2.01
4 Hazen Elementary (Hazen) P-8 78% 279 33% 2.01

Outstanding Educational Performance Awards 2016 Page 85
R. Middle School Achievement
Beating the Odds: Overall ACT Aspire, 2016
Table 116: Top 10 "High-Poverty" Middle Schools in Arkansas based on Overall ACT Aspire Achievement (Math, ELA and Science combined)
School (District) Region Grades Served %FRL
# of Test
Takers
% Met Readiness
Benchmark GPA
1 Clinton Intermediate (Clinton) NW 4-6 77% 906 61% 2.72
2 Atkins Middle (Atkins) NW 5-8 67% 855 60% 2.71
3 Leslie Intermediate (Searcy County) NW 4-6 77% 519 60% 2.69
4 Mena Middle (Mena) SW 6-8 67% 1,158 60% 2.68
5 Mountain View Middle (Mountain View) NE 5-8 66% 1,110 57% 2.66
6 DeQueen Middle (DeQueen) SW 6-7 79% 1,058 57% 2.64
6 Lingle Middle (Rogers) NW 6-8 68% 2,633 55% 2.64
8 Southside Middle (Southside (Independence))
NE 4-6 68% 1,164 54% 2.55
8 Oakdale Middle (Rogers) NW 6-8 71% 2,454 52% 2.55
9 Cave City Middle (Cave City) NE 6-8 76% 900 53% 2.54

Outstanding Educational Performance Awards 2016 Page 86
Beating the Odds: Math ACT Aspire, 2016
Table 117: Top 10 "High-Poverty" Middle Schools based on ACT Aspire Math Achievement
School (District) Region Grades Served %FRL
# of Test
Takers
% Met Readiness
Benchmark GPA
1 Leslie Intermediate (Searcy County) NW 4-6 77% 173 69% 2.84
1 Mena Middle (Mena) SW 6-8 67% 386 67% 2.84
3 Clinton Intermediate (Clinton) NW 4-6 77% 302 65% 2.79
4 Southside Middle (Southside (Independence))
NE 4-6 68% 388 61% 2.77
5 Atkins Middle (Atkins) NW 5-8 67% 285 61% 2.75
6 DeQueen Middle (DeQueen) SW 6-7 79% 353 60% 2.74
7 Kraus Middle (Clarksville) NW 5-6 76% 398 60% 2.71
8 Meekins Middle (Stuttgart) SE 5-6 66% 217 59% 2.68
8 Morrilton Intermediate (South Conway County) NW 4-6 75% 502 58% 2.68
10 Cedarville Middle (Cedarville) NW 5-8 73% 235 59% 2.67
Outstanding Educational Performance Awards 2016 Page 87
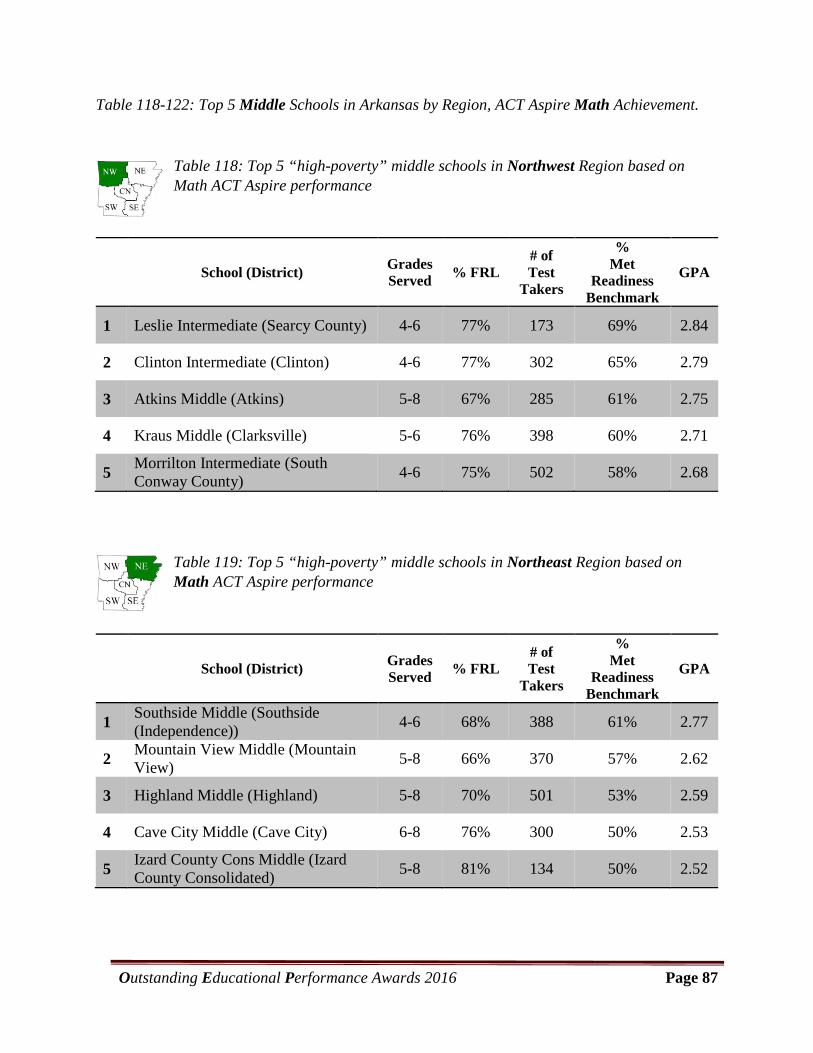
Table 118-122: Top 5 Middle Schools in Arkansas by Region, ACT Aspire Math Achievement.
Table 118: Top 5 “high-poverty” middle schools in Northwest Region based on Math ACT Aspire performance
School (District) Grades Served % FRL
# of Test
Takers
% Met
Readiness Benchmark
GPA
1 Leslie Intermediate (Searcy County) 4-6 77% 173 69% 2.84
2 Clinton Intermediate (Clinton) 4-6 77% 302 65% 2.79
3 Atkins Middle (Atkins) 5-8 67% 285 61% 2.75
4 Kraus Middle (Clarksville) 5-6 76% 398 60% 2.71
5 Morrilton Intermediate (South Conway County) 4-6 75% 502 58% 2.68
Table 119: Top 5 “high-poverty” middle schools in Northeast Region based on Math ACT Aspire performance
School (District) Grades Served % FRL
# of Test
Takers
% Met
Readiness Benchmark
GPA
1 Southside Middle (Southside (Independence)) 4-6 68% 388 61% 2.77
2 Mountain View Middle (Mountain View) 5-8 66% 370 57% 2.62
3 Highland Middle (Highland) 5-8 70% 501 53% 2.59
4 Cave City Middle (Cave City) 6-8 76% 300 50% 2.53
5 Izard County Cons Middle (Izard County Consolidated) 5-8 81% 134 50% 2.52

Outstanding Educational Performance Awards 2016 Page 88
Table 120: Top 5 “high-poverty” middle schools in Central Region based on Math ACT Aspire performance
School (District) Grades Served % FRL
# of Test
Takers
% Met
Readiness Benchmark
GPA
1 Hot Springs Intermediate (Hot Springs) 5-6 83% 511 43% 2.42
2 Jessieville Middle (Jessieville) 6-8 71% 198 46% 2.37
3 Mann Magnet Middle (Little Rock) 6-8 70% 811 38% 2.28
4 Wilson Intermediate (Malvern) 5-6 79% 288 34% 2.24
5 Lonoke Middle (Lonoke) 6-8 66% 409 36% 2.21
Table 121: Top 5 “high-poverty” middle schools in Southwest Region based on Math ACT Aspire performance
School (District) Grades Served % FRL
# of Test
Takers
% Met
Readiness Benchmark
GPA
1 Mena Middle (Mena) 6-8 67% 386 67% 2.84
2 DeQueen Middle (DeQueen) 4-5 79% 353 60% 2.74
3 Nashville Elementary (Nashville) 6-7 71% 433 55% 2.66
4 Washington Middle (El Dorado) 4-6 67% 707 44% 2.45
5 Central Elementary (Magnolia) 5-6 71% 625 45% 2.42
Outstanding Educational Performance Awards 2016 Page 89
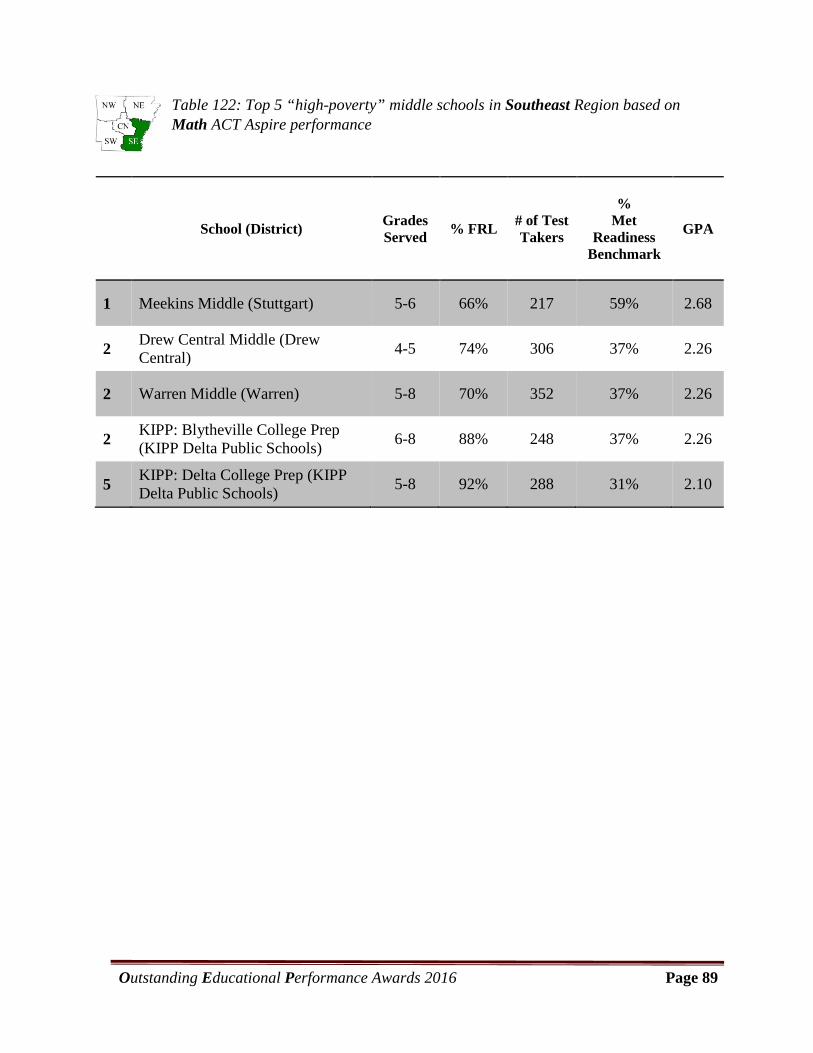
Table 122: Top 5 “high-poverty” middle schools in Southeast Region based on Math ACT Aspire performance
School (District) Grades Served % FRL # of Test
Takers
% Met
Readiness Benchmark
GPA
1 Meekins Middle (Stuttgart) 5-6 66% 217 59% 2.68
2 Drew Central Middle (Drew Central) 4-5 74% 306 37% 2.26
2 Warren Middle (Warren) 5-8 70% 352 37% 2.26
2 KIPP: Blytheville College Prep (KIPP Delta Public Schools) 6-8 88% 248 37% 2.26
5 KIPP: Delta College Prep (KIPP Delta Public Schools) 5-8 92% 288 31% 2.10
Outstanding Educational Performance Awards 2016 Page 90
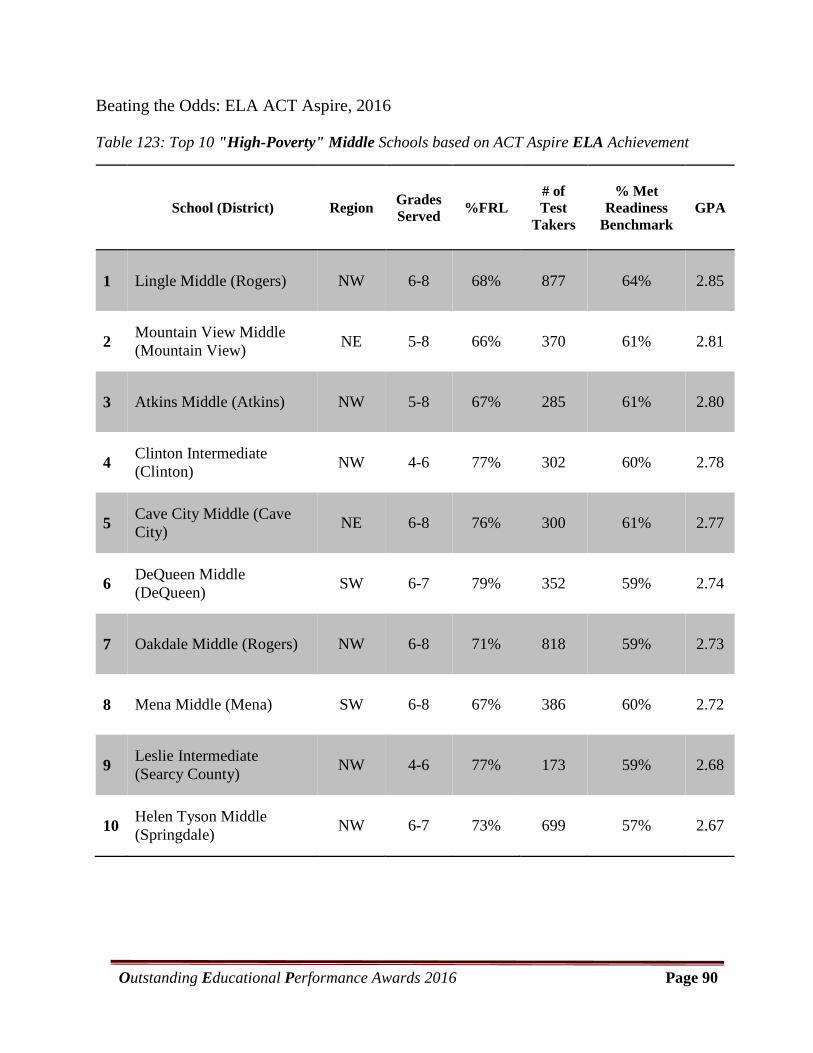
Beating the Odds: ELA ACT Aspire, 2016
Table 123: Top 10 "High-Poverty" Middle Schools based on ACT Aspire ELA Achievement
School (District) Region Grades Served %FRL
# of Test
Takers
% Met Readiness
Benchmark GPA
1 Lingle Middle (Rogers) NW 6-8 68% 877 64% 2.85
2 Mountain View Middle (Mountain View) NE 5-8 66% 370 61% 2.81
3 Atkins Middle (Atkins) NW 5-8 67% 285 61% 2.80
4 Clinton Intermediate (Clinton) NW 4-6 77% 302 60% 2.78
5 Cave City Middle (Cave City) NE 6-8 76% 300 61% 2.77
6 DeQueen Middle (DeQueen) SW 6-7 79% 352 59% 2.74
7 Oakdale Middle (Rogers) NW 6-8 71% 818 59% 2.73
8 Mena Middle (Mena) SW 6-8 67% 386 60% 2.72
9 Leslie Intermediate (Searcy County) NW 4-6 77% 173 59% 2.68
10 Helen Tyson Middle (Springdale) NW 6-7 73% 699 57% 2.67

Outstanding Educational Performance Awards 2016 Page 91
Table 124-128: Top 5 Middle Schools in Arkansas by Region, ACT Aspire ELA Achievement.
Table 124: Top 5 “high-poverty” middle schools in Northwest Region based on ELA ACT Aspire performance
School (District) Grades Served % FRL
# of Test
Takers
% Met
Readiness Benchmark
GPA
1 Lingle Middle (Rogers) 6-8 68% 877 64% 2.85
2 Atkins Middle (Atkins) 5-8 67% 285 61% 2.80
3 Clinton Intermediate (Clinton) 4-6 77% 302 60% 2.78
4 Oakdale Middle (Rogers) 6-8 71% 818 59% 2.73
5 Leslie Intermediate (Searcy County) 4-6 77% 173 59% 2.68
Table 125: Top 5 “high-poverty” middle schools in Northeast Region based on ELA ACT Aspire performance
School (District) Grades Served % FRL
# of Test
Takers
% Met
Readiness Benchmark
GPA
1 Mountain View Middle (Mountain View) 5-8 66% 370 61% 2.81
2 Cave City Middle (Cave City) 6-8 76% 300 61% 2.77
3 Oak Grove Middle (Paragould) 5-6 69% 475 55% 2.62
4 Nettleton Middle (Nettleton) 6-6 72% 263 58% 2.59
4 Highland Middle (Highland) 5-8 70% 500 54% 2.59
Outstanding Educational Performance Awards 2016 Page 92
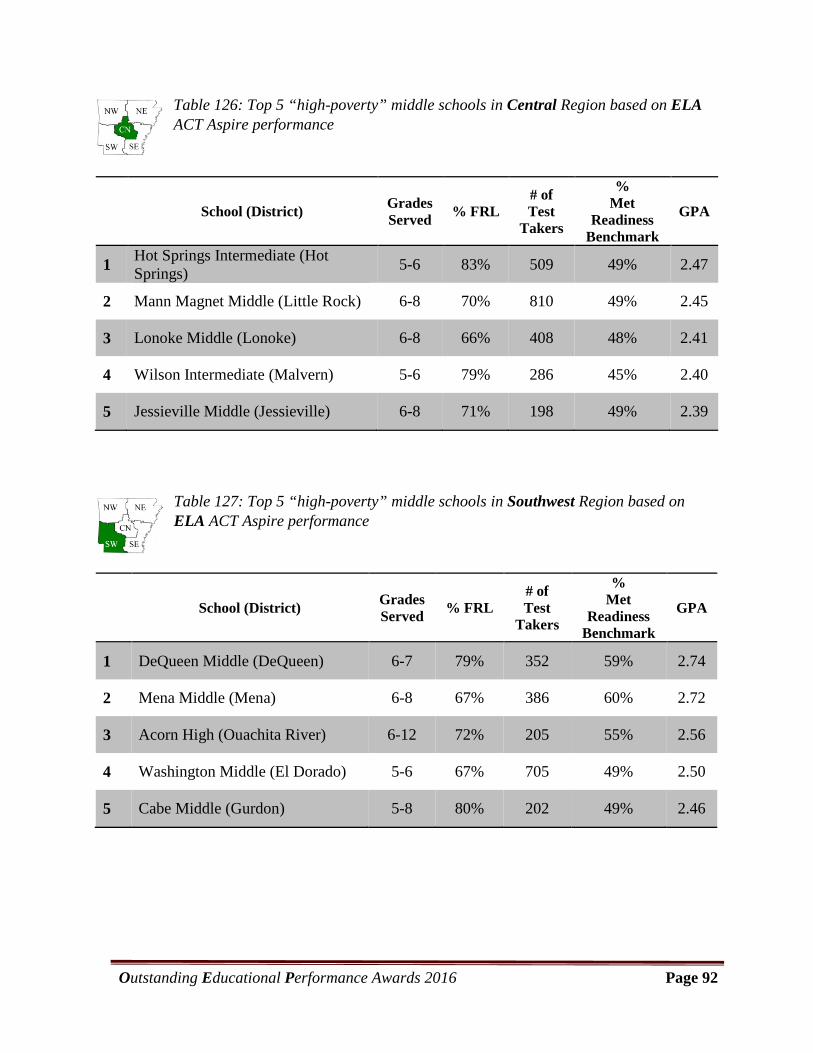
Table 126: Top 5 “high-poverty” middle schools in Central Region based on ELA ACT Aspire performance
School (District) Grades Served % FRL
# of Test
Takers
% Met
Readiness Benchmark
GPA
1 Hot Springs Intermediate (Hot Springs) 5-6 83% 509 49% 2.47
2 Mann Magnet Middle (Little Rock) 6-8 70% 810 49% 2.45
3 Lonoke Middle (Lonoke) 6-8 66% 408 48% 2.41
4 Wilson Intermediate (Malvern) 5-6 79% 286 45% 2.40
5 Jessieville Middle (Jessieville) 6-8 71% 198 49% 2.39
Table 127: Top 5 “high-poverty” middle schools in Southwest Region based on ELA ACT Aspire performance
School (District) Grades Served % FRL
# of Test
Takers
% Met
Readiness Benchmark
GPA
1 DeQueen Middle (DeQueen) 6-7 79% 352 59% 2.74
2 Mena Middle (Mena) 6-8 67% 386 60% 2.72
3 Acorn High (Ouachita River) 6-12 72% 205 55% 2.56
4 Washington Middle (El Dorado) 5-6 67% 705 49% 2.50
5 Cabe Middle (Gurdon) 5-8 80% 202 49% 2.46

Outstanding Educational Performance Awards 2016 Page 93
Table 128: Top 5 “high-poverty” middle schools in Southeast Region based on ELA ACT Aspire performance
School (District) Grades Served % FRL
# of Test
Takers
% Met
Readiness Benchmark
GPA
1 Meekins Middle (Stuttgart) 5-6 66% 215 41% 2.32
2 Drew Central Middle (Drew Central) 5-8 74% 306 44% 2.31
3 Warren Middle (Warren) 6-8 70% 351 43% 2.25
3 Lakeside Middle (Lakeside (Chicot)) 6-8 85% 207 41% 2.25
4 KIPP: Delta College Prep (KIPP Delta Public Schools) 5-8 92% 289 38% 2.22
Outstanding Educational Performance Awards 2016 Page 94
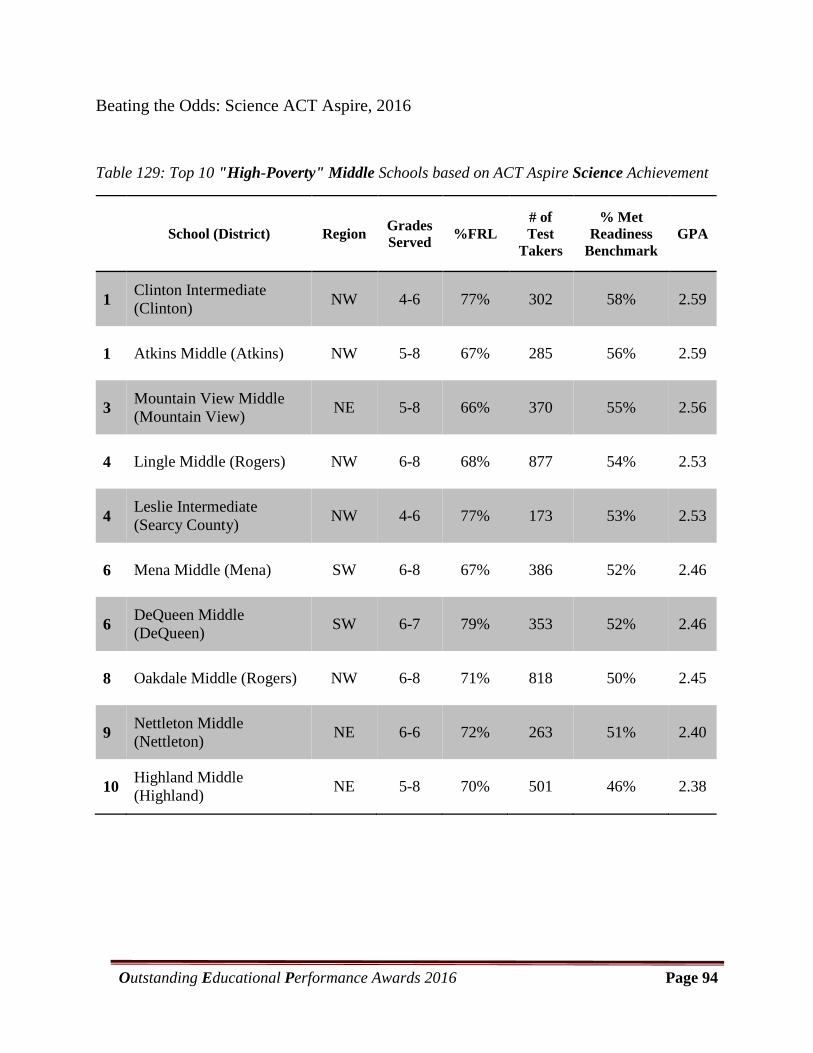
Beating the Odds: Science ACT Aspire, 2016
Table 129: Top 10 "High-Poverty" Middle Schools based on ACT Aspire Science Achievement
School (District) Region Grades Served %FRL
# of Test
Takers
% Met Readiness
Benchmark GPA
1 Clinton Intermediate (Clinton) NW 4-6 77% 302 58% 2.59
1 Atkins Middle (Atkins) NW 5-8 67% 285 56% 2.59
3 Mountain View Middle (Mountain View) NE 5-8 66% 370 55% 2.56
4 Lingle Middle (Rogers) NW 6-8 68% 877 54% 2.53
4 Leslie Intermediate (Searcy County) NW 4-6 77% 173 53% 2.53
6 Mena Middle (Mena) SW 6-8 67% 386 52% 2.46
6 DeQueen Middle (DeQueen) SW 6-7 79% 353 52% 2.46
8 Oakdale Middle (Rogers) NW 6-8 71% 818 50% 2.45
9 Nettleton Middle (Nettleton) NE 6-6 72% 263 51% 2.40
10 Highland Middle (Highland) NE 5-8 70% 501 46% 2.38

Outstanding Educational Performance Awards 2016 Page 95
Table 130-134: Top 5 Middle Schools in Arkansas by Region, ACT Aspire Science Achievement.
Table 130: Top 5 “high-poverty” middle schools in Northwest Region based on Science ACT Aspire performance
School (District) Grades Served % FRL
# of Test
Takers
% Met
Readiness Benchmark
GPA
1 Clinton Intermediate (Clinton) 4-6 77% 302 58% 2.59
1 Atkins Middle (Atkins) 5-8 67% 285 56% 2.59
3 Lingle Middle (Rogers) 6-8 68% 877 54% 2.53
3 Leslie Intermediate (Searcy County) 4-6 77% 173 53% 2.53
5 Oakdale Middle (Rogers) 6-8 71% 818 50% 2.45
Table 131: Top 5 “high-poverty” middle schools in Northeast Region based on Science ACT Aspire performance
School (District) Grades Served % FRL
# of Test
Takers
% Met
Readiness Benchmark
GPA
1 Mountain View Middle (Mountain View) 5-8 66% 370 55% 2.56
2 Nettleton Middle (Nettleton) 6-6 72% 263 51% 2.40
3 Highland Middle (Highland) 5-8 70% 501 46% 2.38
4 Southside Middle (Southside (Independence)) 4-6 68% 388 47% 2.36
5 Izard County Cons Middle (Izard County Consolidated) 5-8 81% 134 46% 2.32

Outstanding Educational Performance Awards 2016 Page 96
Table 132: Top 5 “high-poverty” middle schools in Central Region based on Science ACT Aspire performance
School (District) Grades Served % FRL
# of Test
Takers
% Met
Readiness Benchmark
GPA
1 Jessieville Middle (Jessieville) 6-8 71% 198 41% 2.20
2 Lonoke Middle (Lonoke) 6-8 66% 409 38% 2.16
3 Wilson Intermediate (Malvern) 5-6 79% 288 34% 2.07
4 Mann Magnet Middle (Little Rock) 6-8 70% 811 34% 2.05
5 Hot Springs Intermediate (Hot Springs) 5-6 83% 511 36% 2.02
Table 133: Top 5 “high-poverty” middle schools in Southwest Region based on Science ACT Aspire performance
School (District) Grades Served % FRL
# of Test
Takers
% Met
Readiness Benchmark
GPA
1 Mena Middle (Mena) 6-8 68% 386 52% 2.46
1 DeQueen Middle (DeQueen) 6-7 79% 353 52% 2.46
3 Acorn High (Ouachita River) 6-12 72% 205 42% 2.27
4 Nashville Elementary (Nashville) 4-6 71% 433 41% 2.26
5 Central Elementary (Magnolia) 4-6 71% 625 40% 2.16
Outstanding Educational Performance Awards 2016 Page 97
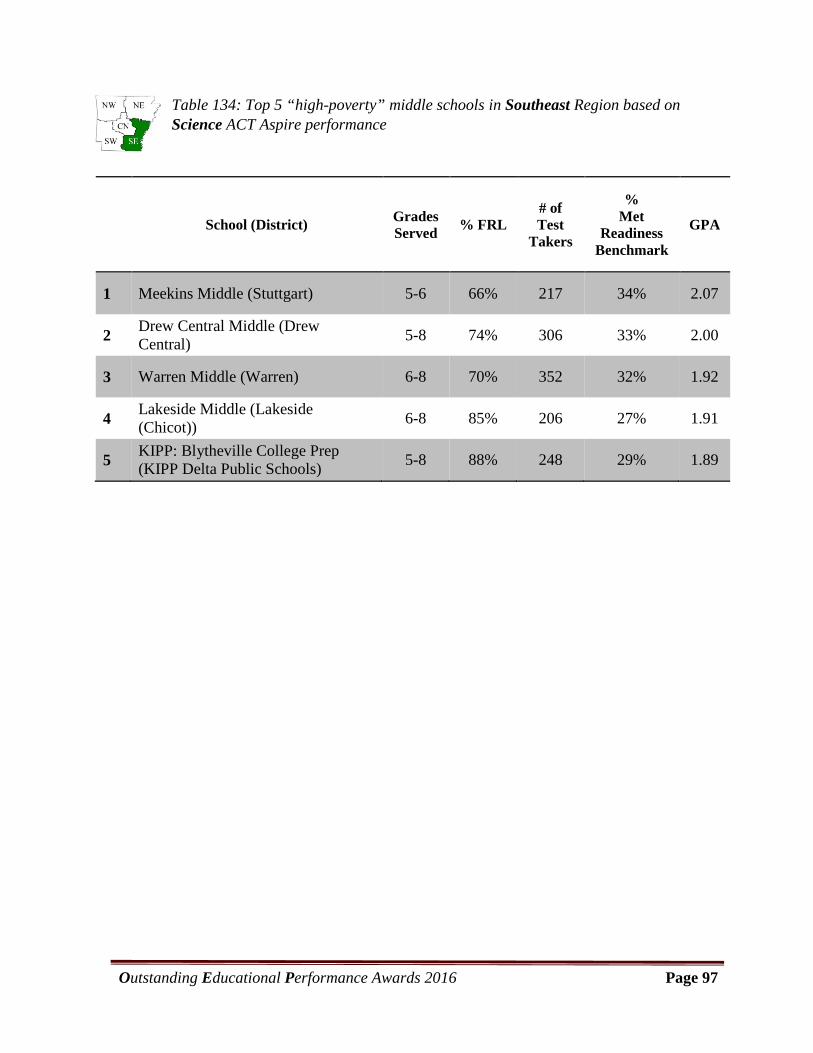
Table 134: Top 5 “high-poverty” middle schools in Southeast Region based on Science ACT Aspire performance
School (District) Grades Served % FRL
# of Test
Takers
% Met
Readiness Benchmark
GPA
1 Meekins Middle (Stuttgart) 5-6 66% 217 34% 2.07
2 Drew Central Middle (Drew Central) 5-8 74% 306 33% 2.00
3 Warren Middle (Warren) 6-8 70% 352 32% 1.92
4 Lakeside Middle (Lakeside (Chicot)) 6-8 85% 206 27% 1.91
5 KIPP: Blytheville College Prep (KIPP Delta Public Schools) 5-8 88% 248 29% 1.89

Outstanding Educational Performance Awards 2016 Page 98
S. Junior High School Achievement
Beating the Odds: Overall ACT Aspire, 2016
Table 135: Top 10 "High-Poverty" Junior High Schools in Arkansas based on Overall ACT Aspire Achievement (Math, ELA and Science combined)
School (District) Region Grades Served %FRL
# of Test
Takers
% Met Readiness
Benchmark GPA
1 Clinton Jr. High (Clinton) NW 7-9 69% 920 56% 2.59
2 DeQueen Jr. High (DeQueen) SW 8-9 74% 1,154 47% 2.41
3 Southwest Jr. High (Springdale) NW 8-9 71% 1,987 45% 2.38
4 Morrilton Jr. High (South Conway County) NW 7-8 71% 966 43% 2.33
5 Clarksville Jr. High (Clarksville) NW 7-9 68% 1,872 42% 2.26
5 Nashville Jr. High (Nashville) SW 7-9 72% 1,281 41% 2.26
7 Nettleton Jr. High (Nettleton) NE 7-8 66% 1,358 38% 2.17
8 Malvern Middle (Malvern) CN 7-8 72% 808 37% 2.16
9 Trumann Intermediate 7-8 (Trumann) NE 7-8 73% 744 34% 2.07
10 Magnolia Jr. High (Magnolia) SW 7-9 67% 1,866 34% 2.05

Outstanding Educational Performance Awards 2016 Page 99
Beating the Odds: Math ACT Aspire, 2016
Table 136: Top 10 "High-Poverty" Junior High Schools based on ACT Aspire Math Achievement
School (District) Region Grades Served %FRL
# of Test
Takers
% Met Readiness
Benchmark GPA
1 Clinton Jr. High (Clinton) NW 7-9 69% 307 55% 2.57
2 Southwest Jr. High (Springdale) NW 8-9 71% 663 46% 2.44
3 DeQueen Jr. High (DeQueen) SW 8-9 74% 385 46% 2.40
4 Nashville Jr. High (Nashville) SW 7-9 72% 427 43% 2.31
5 Clarksville Jr. High (Clarksville) NW 7-9 68% 624 41% 2.23
5 Morrilton Jr. High (South Conway County) NW 7-8 71% 322 36% 2.14
7 Malvern Middle (Malvern) CN 7-8 72% 270 33% 2.10
8 Trumann Intermediate 7-8 (Trumann) NE 7-8 73% 248 31% 2.05
9 Nettleton Jr. High (Nettleton) NE 7-8 66% 453 31% 2.02
10 North Heights Jr. High (Texarkana) SW 7-8 68% 563 27% 2.00
* Note: Due to the small number of schools in the Junior High category, math achievement is not examined on the regional level.
Outstanding Educational Performance Awards 2016 Page 100
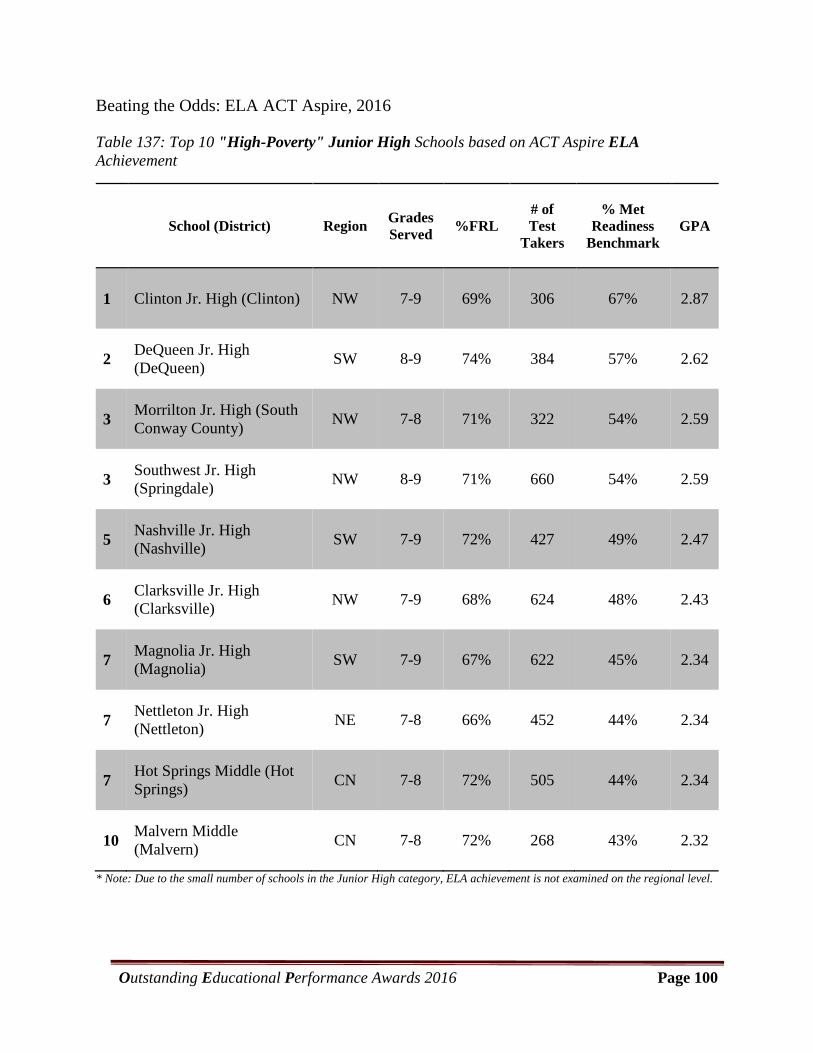
Beating the Odds: ELA ACT Aspire, 2016
Table 137: Top 10 "High-Poverty" Junior High Schools based on ACT Aspire ELA Achievement
School (District) Region Grades Served %FRL
# of Test
Takers
% Met Readiness
Benchmark GPA
1 Clinton Jr. High (Clinton) NW 7-9 69% 306 67% 2.87
2 DeQueen Jr. High (DeQueen) SW 8-9 74% 384 57% 2.62
3 Morrilton Jr. High (South Conway County) NW 7-8 71% 322 54% 2.59
3 Southwest Jr. High (Springdale) NW 8-9 71% 660 54% 2.59
5 Nashville Jr. High (Nashville) SW 7-9 72% 427 49% 2.47
6 Clarksville Jr. High (Clarksville) NW 7-9 68% 624 48% 2.43
7 Magnolia Jr. High (Magnolia) SW 7-9 67% 622 45% 2.34
7 Nettleton Jr. High (Nettleton) NE 7-8 66% 452 44% 2.34
7 Hot Springs Middle (Hot Springs) CN 7-8 72% 505 44% 2.34
10 Malvern Middle (Malvern) CN 7-8 72% 268 43% 2.32
* Note: Due to the small number of schools in the Junior High category, ELA achievement is not examined on the regional level.

Outstanding Educational Performance Awards 2016 Page 101
Beating the Odds: Science ACT Aspire, 2016
Table 138: Top 10 "High-Poverty" Junior High Schools based on ACT Aspire Science Achievement
School (District) Region Grades Served %FRL
# of Test
Takers
% Met Readiness
Benchmark GPA
1 Clinton Jr. High (Clinton) NW 7-9 69% 307 46% 2.34
2 Morrilton Jr. High (South Conway County) NW 7-8 71% 322 41% 2.24
3 DeQueen Jr. High (DeQueen) SW 8-9 74% 385 39% 2.23
4 Nettleton Jr. High (Nettleton) NE 7-8 66% 453 39% 2.16
5 Clarksville Jr. High (Clarksville) NW 7-9 68% 624 38% 2.14
6 Southwest Jr. High (Springdale) NW 8-9 71% 664 36% 2.13
7 Malvern Middle (Malvern) CN 7-8 72% 270 37% 2.08
8 Nashville Jr. High (Nashville) SW 7-9 72% 427 31% 2.02
9 Riverview Jr. High (Riverview) NE 7-8 76% 197 30% 1.98
10 Magnolia Jr. High (Magnolia) SW 7-9 67% 622 30% 1.89
* Note: Due to the small number of schools in the Junior High category, science achievement is not examined on the regional level.
Outstanding Educational Performance Awards 2016 Page 102
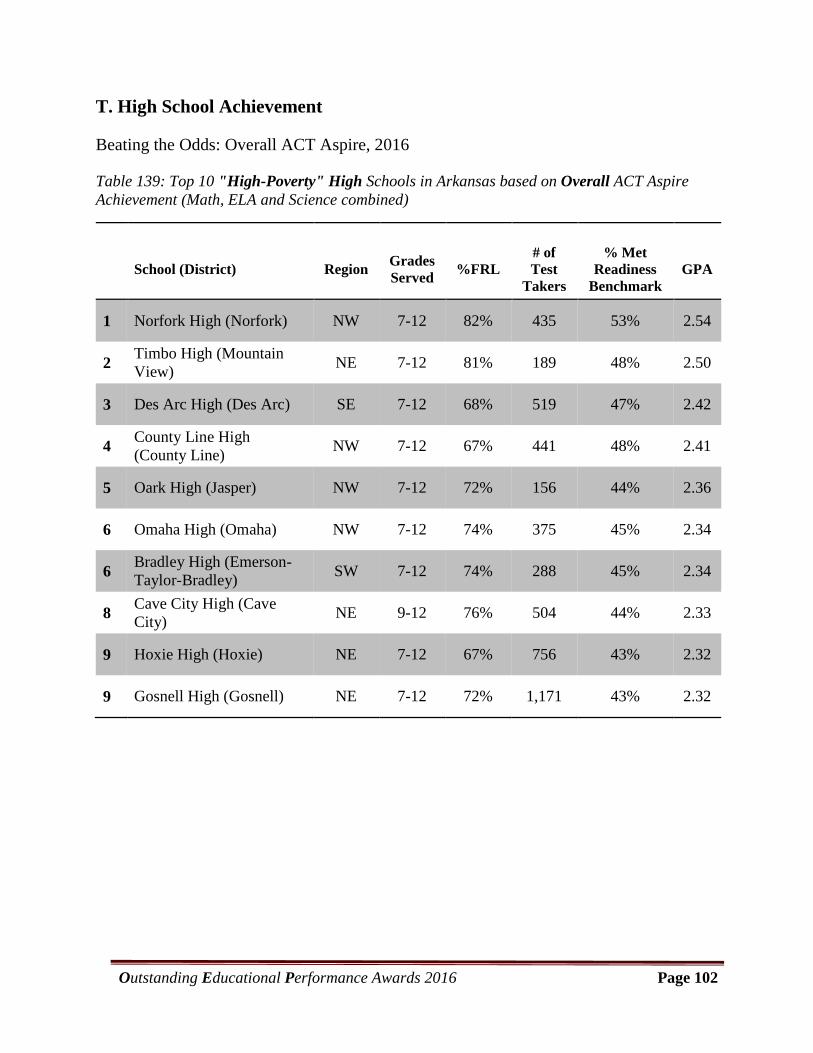
T. High School Achievement
Beating the Odds: Overall ACT Aspire, 2016
Table 139: Top 10 "High-Poverty" High Schools in Arkansas based on Overall ACT Aspire Achievement (Math, ELA and Science combined)
School (District) Region Grades Served %FRL
# of Test
Takers
% Met Readiness
Benchmark GPA
1 Norfork High (Norfork) NW 7-12 82% 435 53% 2.54
2 Timbo High (Mountain View) NE 7-12 81% 189 48% 2.50
3 Des Arc High (Des Arc) SE 7-12 68% 519 47% 2.42
4 County Line High (County Line) NW 7-12 67% 441 48% 2.41
5 Oark High (Jasper) NW 7-12 72% 156 44% 2.36
6 Omaha High (Omaha) NW 7-12 74% 375 45% 2.34
6 Bradley High (Emerson-Taylor-Bradley) SW 7-12 74% 288 45% 2.34
8 Cave City High (Cave City) NE 9-12 76% 504 44% 2.33
9 Hoxie High (Hoxie) NE 7-12 67% 756 43% 2.32
9 Gosnell High (Gosnell) NE 7-12 72% 1,171 43% 2.32

Outstanding Educational Performance Awards 2016 Page 103
Beating the Odds: Math ACT Aspire, 2016
Table 140: Top 10 "High-Poverty" High Schools based on ACT Aspire Math Achievement
School (District) Region Grades Served %FRL
# of Test
Takers
% Met Readiness
Benchmark GPA
1 Norfork High (Norfork) NW 7-12 82% 145 42% 2.35
2 Des Arc High (Des Arc) SE 7-12 68% 173 40% 2.31
3 Gosnell High (Gosnell) NE 7-12 72% 392 42% 2.29
3 Timbo High (Mountain View) NE 7-12 81% 63 38% 2.29
5 Bradley High (Emerson-Taylor-Bradley) SW 7-12 74% 96 42% 2.27
6 County Line High (County Line) NW 7-12 67% 147 42% 2.26
7 Omaha High (Omaha) NW 7-12 74% 125 37% 2.23
8 J.D. Leftwich High (Magazine) NW 7-12 75% 174 37% 2.15
9 Oark High (Jasper) NW 7-12 72% 52 37% 2.14
10 Izard Co. Cons. High (Izard County Consolidated)
NE 9-12 79% 80 34% 2.09
Outstanding Educational Performance Awards 2016 Page 104
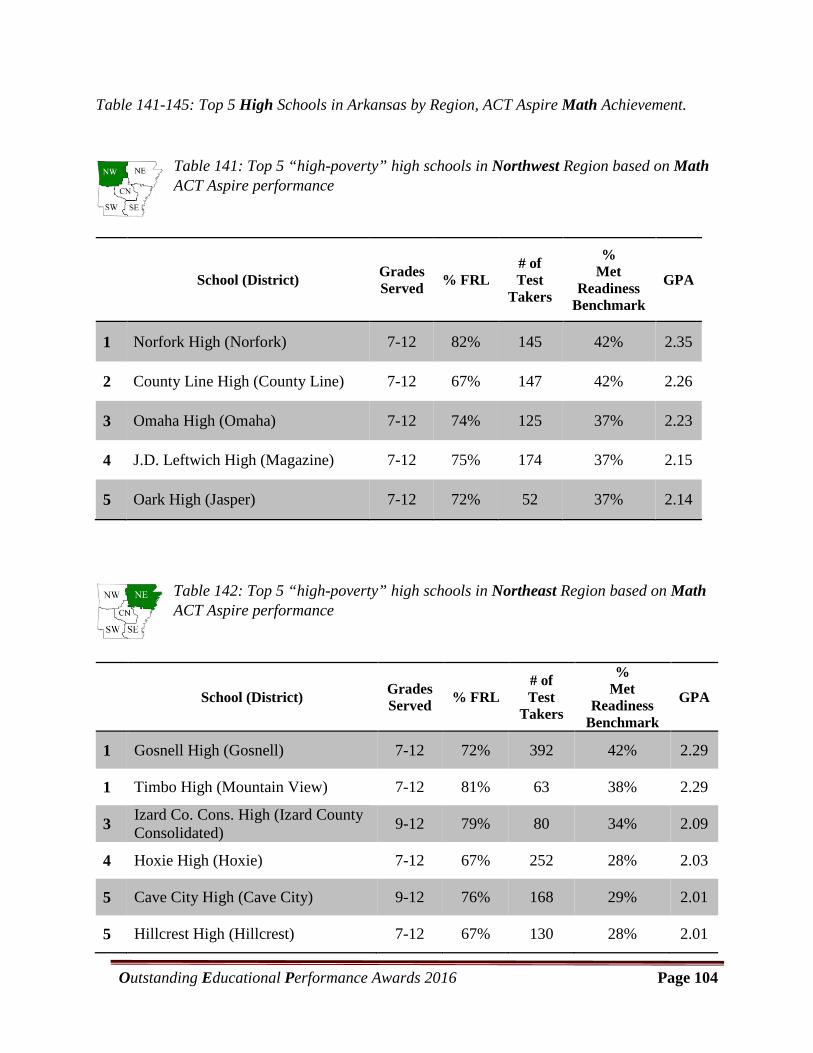
Table 141-145: Top 5 High Schools in Arkansas by Region, ACT Aspire Math Achievement.
Table 141: Top 5 “high-poverty” high schools in Northwest Region based on Math ACT Aspire performance
School (District) Grades Served % FRL
# of Test
Takers
% Met
Readiness Benchmark
GPA
1 Norfork High (Norfork) 7-12 82% 145 42% 2.35
2 County Line High (County Line) 7-12 67% 147 42% 2.26
3 Omaha High (Omaha) 7-12 74% 125 37% 2.23
4 J.D. Leftwich High (Magazine) 7-12 75% 174 37% 2.15
5 Oark High (Jasper) 7-12 72% 52 37% 2.14
Table 142: Top 5 “high-poverty” high schools in Northeast Region based on Math ACT Aspire performance
School (District) Grades Served % FRL
# of Test
Takers
% Met
Readiness Benchmark
GPA
1 Gosnell High (Gosnell) 7-12 72% 392 42% 2.29
1 Timbo High (Mountain View) 7-12 81% 63 38% 2.29
3 Izard Co. Cons. High (Izard County Consolidated) 9-12 79% 80 34% 2.09
4 Hoxie High (Hoxie) 7-12 67% 252 28% 2.03
5 Cave City High (Cave City) 9-12 76% 168 29% 2.01
5 Hillcrest High (Hillcrest) 7-12 67% 130 28% 2.01
Outstanding Educational Performance Awards 2016 Page 105
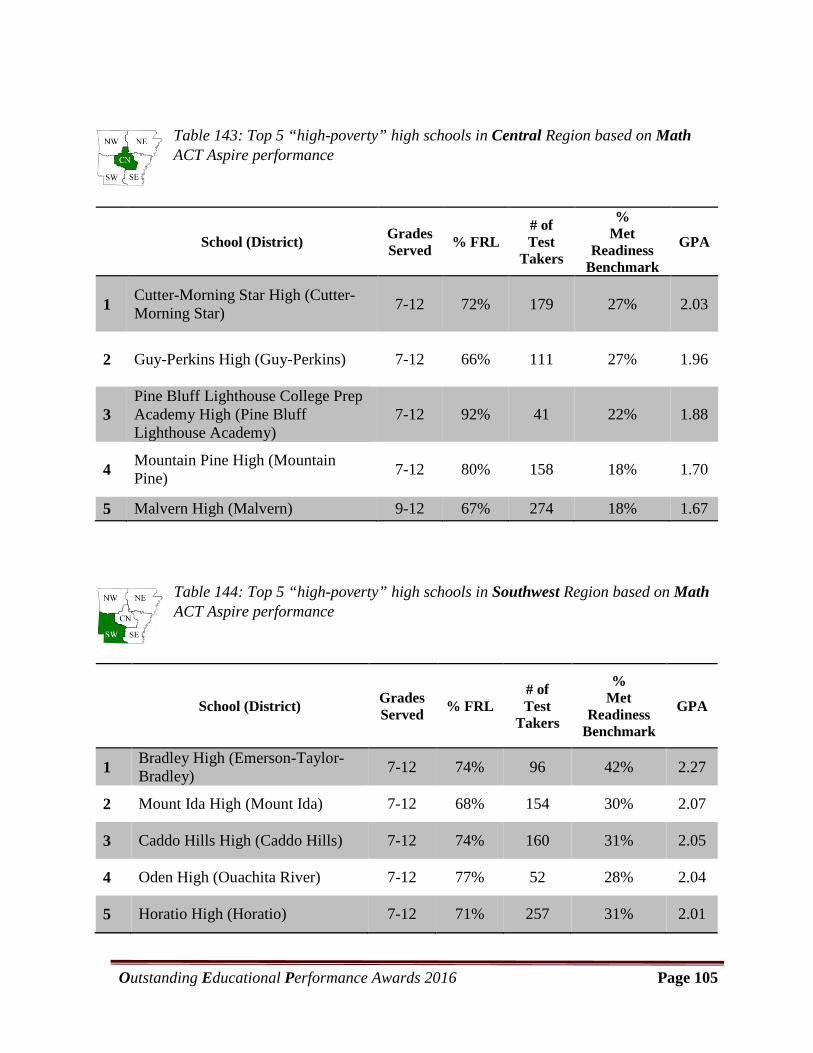
Table 143: Top 5 “high-poverty” high schools in Central Region based on Math ACT Aspire performance
School (District) Grades Served % FRL
# of Test
Takers
% Met
Readiness Benchmark
GPA
1 Cutter-Morning Star High (Cutter-Morning Star) 7-12 72% 179 27% 2.03
2 Guy-Perkins High (Guy-Perkins) 7-12 66% 111 27% 1.96
3 Pine Bluff Lighthouse College Prep Academy High (Pine Bluff Lighthouse Academy)
7-12 92% 41 22% 1.88
4 Mountain Pine High (Mountain Pine) 7-12 80% 158 18% 1.70
5 Malvern High (Malvern) 9-12 67% 274 18% 1.67
Table 144: Top 5 “high-poverty” high schools in Southwest Region based on Math ACT Aspire performance
School (District) Grades Served % FRL
# of Test
Takers
% Met
Readiness Benchmark
GPA
1 Bradley High (Emerson-Taylor-Bradley) 7-12 74% 96 42% 2.27
2 Mount Ida High (Mount Ida) 7-12 68% 154 30% 2.07
3 Caddo Hills High (Caddo Hills) 7-12 74% 160 31% 2.05
4 Oden High (Ouachita River) 7-12 77% 52 28% 2.04
5 Horatio High (Horatio) 7-12 71% 257 31% 2.01
Outstanding Educational Performance Awards 2016 Page 106
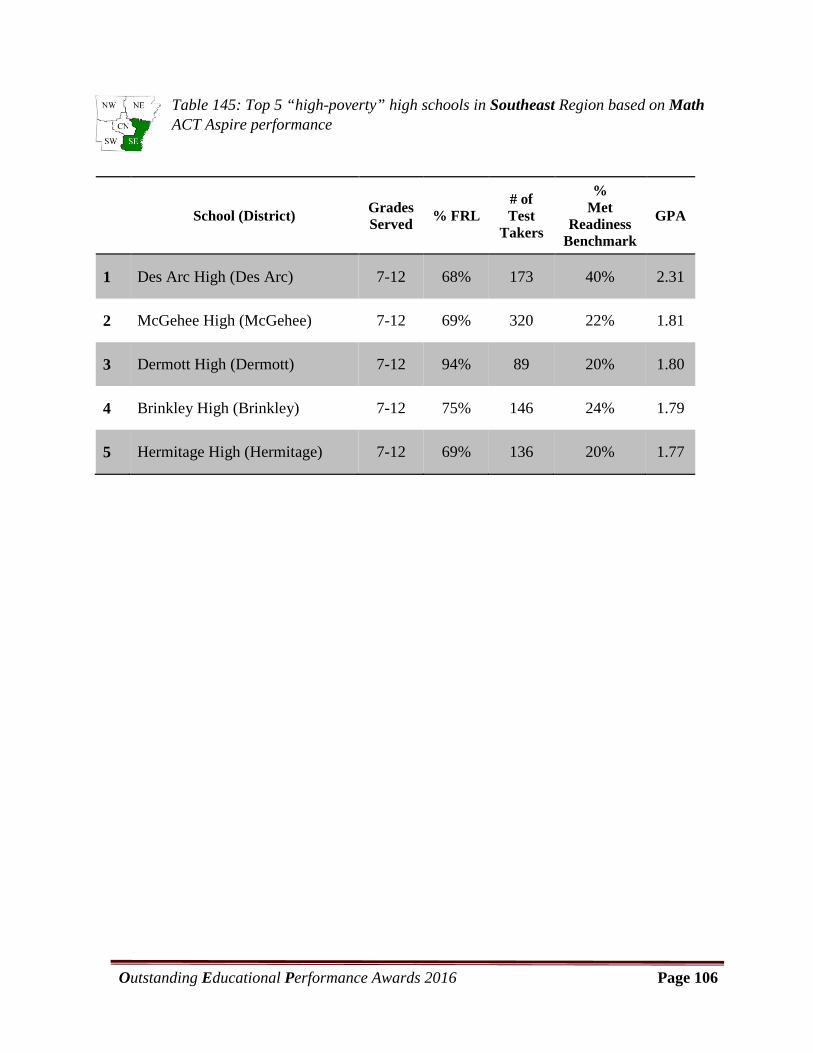
Table 145: Top 5 “high-poverty” high schools in Southeast Region based on Math ACT Aspire performance
School (District) Grades Served % FRL
# of Test
Takers
% Met
Readiness Benchmark
GPA
1 Des Arc High (Des Arc) 7-12 68% 173 40% 2.31
2 McGehee High (McGehee) 7-12 69% 320 22% 1.81
3 Dermott High (Dermott) 7-12 94% 89 20% 1.80
4 Brinkley High (Brinkley) 7-12 75% 146 24% 1.79
5 Hermitage High (Hermitage) 7-12 69% 136 20% 1.77
Outstanding Educational Performance Awards 2016 Page 107
Beating the Odds: ELA ACT Aspire, 2016
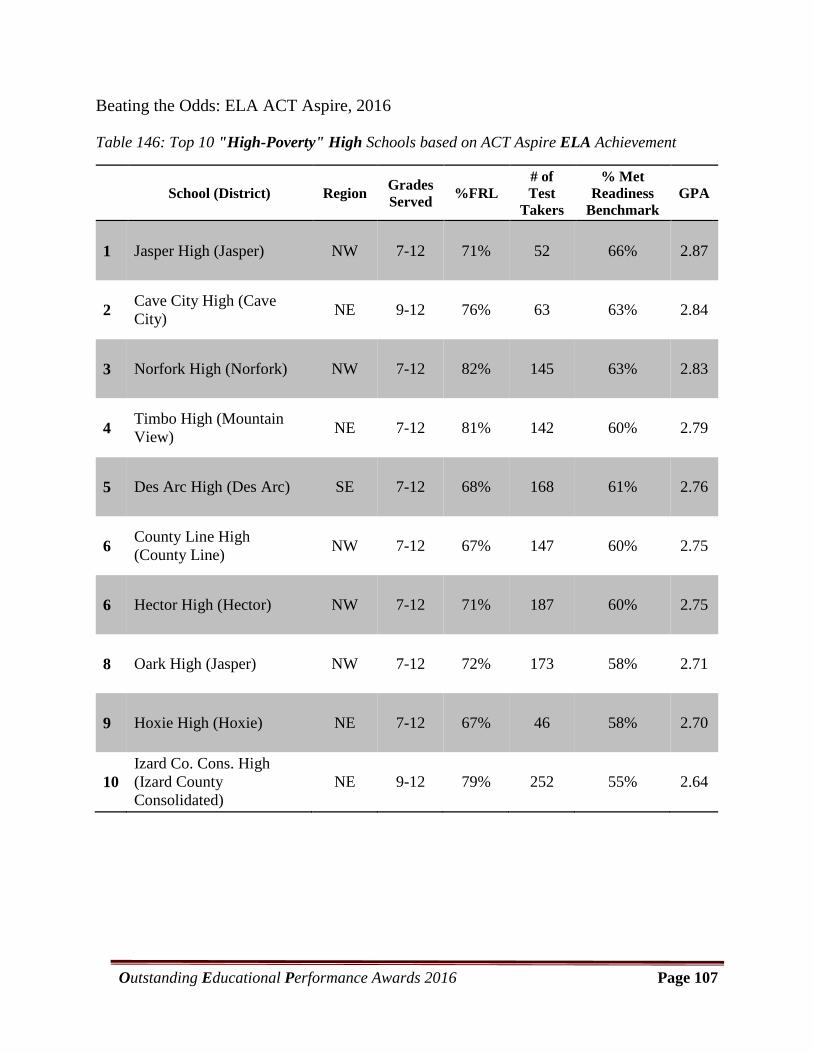
Table 146: Top 10 "High-Poverty" High Schools based on ACT Aspire ELA Achievement
School (District) Region Grades Served %FRL
# of Test
Takers
% Met Readiness
Benchmark GPA
1 Jasper High (Jasper) NW 7-12 71% 52 66% 2.87
2 Cave City High (Cave City) NE 9-12 76% 63 63% 2.84
3 Norfork High (Norfork) NW 7-12 82% 145 63% 2.83
4 Timbo High (Mountain View) NE 7-12 81% 142 60% 2.79
5 Des Arc High (Des Arc) SE 7-12 68% 168 61% 2.76
6 County Line High (County Line) NW 7-12 67% 147 60% 2.75
6 Hector High (Hector) NW 7-12 71% 187 60% 2.75
8 Oark High (Jasper) NW 7-12 72% 173 58% 2.71
9 Hoxie High (Hoxie) NE 7-12 67% 46 58% 2.70
10 Izard Co. Cons. High (Izard County Consolidated)
NE 9-12 79% 252 55% 2.64

Outstanding Educational Performance Awards 2016 Page 108
Table 147-151: Top 5 High Schools in Arkansas by Region, ACT Aspire ELA Achievement.
Table 147: Top 5 “high-poverty” high schools in Northwest Region based on ELA ACT Aspire performance
School (District) Grades Served % FRL
# of Test
Takers
% Met
Readiness Benchmark
GPA
1 Jasper High (Jasper) 7-12 71% 142 66% 2.87
2 Norfork High (Norfork) 7-12 82% 145 63% 2.83
3 County Line High (County Line) 7-12 67% 147 60% 2.75
3 Hector High (Hector) 7-12 71% 189 60% 2.75
5 Oark High (Jasper) 7-12 72% 52 58% 2.71
Table 148: Top 5 “high-poverty” high schools in Northeast Region based on ELA ACT Aspire performance
School (District) Grades Served % FRL
# of Test
Takers
% Met
Readiness Benchmark
GPA
1 Cave City High (Cave City) 9-12 76% 168 63% 2.84
2 Timbo High (Mountain View) 7-12 81% 63 60% 2.79
3 Hoxie High (Hoxie) 7-12 67% 252 58% 2.70
4 Izard Co. Cons. High (Izard County Consolidated) 9-12 79% 80 55% 2.64
5 Hillcrest High (Hillcrest) 7-12 67% 130 54% 2.63

Outstanding Educational Performance Awards 2016 Page 109
Table 149: Top 5 “high-poverty” high schools in Central Region based on ELA ACT Aspire performance
School (District) Grades Served % FRL
# of Test
Takers
% Met
Readiness Benchmark
GPA
1 Cutter-Morning Star High (Cutter-Morning Star) 7-12 72% 179 45% 2.39
2 Guy-Perkins High (Guy-Perkins) 7-12 66% 111 37% 2.22
3 Malvern High (Malvern) 9-12 67% 274 40% 2.20
4 Mountain Pine High (Mountain Pine) 7-12 80% 158 41% 2.17
4 Jessieville High (Jessieville) 9-12 66% 143 39% 2.17
Table 150: Top 5 “high-poverty” high schools in Southwest Region based on ELA ACT Aspire performance
School (District) Grades Served % FRL
# of Test
Takers
% Met
Readiness Benchmark
GPA
1 Bradley High (Emerson-Taylor-Bradley) 7-12 74% 96 50% 2.54
2 Foreman High (Foreman) 7-12 66% 171 53% 2.52
2 Umpire High (Cossatot River) 7-12 79% 46 52% 2.52
4 Horatio High (Horatio) 7-12 71% 257 50% 2.50
5 Mount Ida High (Mount Ida) 7-12 68% 155 46% 2.45

Outstanding Educational Performance Awards 2016 Page 110
Table 151: Top 5 “high-poverty” high schools in Southeast Region based on ELA ACT Aspire performance
School (District) Grades Served % FRL # of Test
Takers
% Met
Readiness Benchmark
GPA
1 Des Arc High (Des Arc) 7-12 68% 173 61% 2.76
2 KIPP Blytheville Collegiate High (KIPP Delta Public Schools) 9-12 86% 102 43% 2.25
3 Dumas High (Dumas) 10-12 71% 110 40% 2.22
4 McGehee High (McGehee) 7-12 69% 320 40% 2.20
5 KIPP: Delta Collegiate High (KIPP Delta Public Schools) 9-12 88% 137 40% 2.19

Outstanding Educational Performance Awards 2016 Page 111
Beating the Odds: Science ACT Aspire, 2016
Table 152: Top 10 "High-Poverty" High Schools based on ACT Aspire Science Achievement
School (District) Region Grades Served %FRL
# of Test
Takers
% Met Readiness
Benchmark GPA
1 Norfork High (Norfork) NW 7-12 82% 145 52% 2.43
2 Timbo High (Mountain View) NE 7-12 81% 63 46% 2.41
3 Omaha High (Omaha) NW 7-12 74% 125 46% 2.31
4 County Line High (County Line) NW 7-12 67% 147 44% 2.24
5 Hoxie High (Hoxie) NE 7-12 67% 252 42% 2.23
5 Oark High (Jasper) NW 7-12 72% 52 37% 2.23
7 Lead Hill High (Lead Hill) NW 7-12 72% 98 39% 2.21
8 Bradley High (Emerson-Taylor-Bradley) SW 7-12 74% 96 43% 2.20
9 Izard Co. Cons. High (Izard County Consolidated)
NE 9-12 79% 80 36% 2.19
10 Des Arc High (Des Arc) NE 7-12 68% 173 40% 2.18

Outstanding Educational Performance Awards 2016 Page 112
Table 153-157: Top 5 High Schools in Arkansas by Region, ACT Aspire Science Achievement.
Table 153: Top 5 “high-poverty” high schools in Northwest Region based on Science ACT Aspire performance
School (District) Grades Served % FRL
# of Test
Takers
% Met
Readiness Benchmark
GPA
1 Norfork High (Norfork) 7-12 82% 145 52% 2.43
2 Omaha High (Omaha) 7-12 74% 125 46% 2.31
3 County Line High (County Line) 7-12 67% 147 44% 2.24
4 Oark High (Jasper) 7-12 72% 52 37% 2.23
5 Lead Hill High (Lead Hill) 7-12 72% 98 39% 2.21
Table 154: Top 5 “high-poverty” high schools in Northeast Region based on Science ACT Aspire performance
School (District) Grades Served % FRL
# of Test
Takers
% Met
Readiness Benchmark
GPA
1 Timbo High (Mountain View) 7-12 81% 63 46% 2.41
2 Hoxie High (Hoxie) 7-12 67% 252 42% 2.23
3 Izard Co. Cons. High (Izard County Consolidated) 9-12 79% 80 36% 2.19
4 Cave City High (Cave City) 9-12 76% 168 41% 2.16
5 East Poinsett Co. High (East Poinsett Co.) 7-12 73% 236 35% 2.04
5 Gosnell High (Gosnell) 7-12 72% 392 33% 2.04

Outstanding Educational Performance Awards 2016 Page 113
Table 155: Top 5 “high-poverty” high schools in Central Region based on Science ACT Aspire performance
School (District) Grades Served % FRL
# of Test
Takers
% Met
Readiness Benchmark
GPA
1 Guy-Perkins High (Guy-Perkins) 7-12 66% 111 31% 2.03
2 Cutter-Morning Star High (Cutter-Morning Star) 7-12 72% 179 30% 1.94
3 Mountain Pine High (Mountain Pine) 7-12 80% 158 24% 1.79
4 Jessieville High (Jessieville) 9-12 66% 143 21% 1.77
5 Malvern High (Malvern) 9-12 67% 274 22% 1.72
Table 156: Top 5 “high-poverty” high schools in Southwest Region based on Science ACT Aspire performance
School (District) Grades Served % FRL
# of Test
Takers
% Met
Readiness Benchmark
GPA
1 Bradley High (Emerson-Taylor-Bradley) 7-12 74% 96 43% 2.20
2 Oden High (Ouachita River) 7-12 77% 52 37% 2.15
3 Foreman High (Foreman) 7-12 66% 171 32% 2.02
4 Kirby High (Kirby) 7-12 67% 104 30% 2.01
5 Horatio High (Horatio) 7-12 71% 257 32% 1.98
Outstanding Educational Performance Awards 2016 Page 114
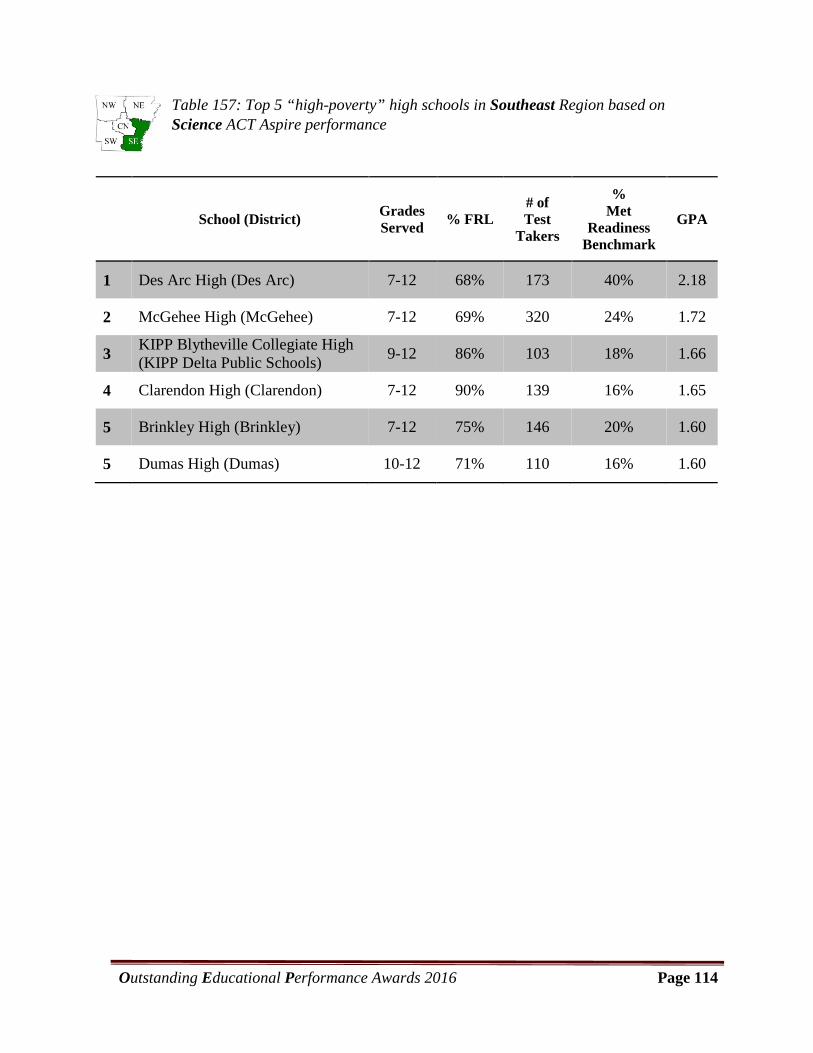
Table 157: Top 5 “high-poverty” high schools in Southeast Region based on Science ACT Aspire performance
School (District) Grades Served % FRL
# of Test
Takers
% Met
Readiness Benchmark
GPA
1 Des Arc High (Des Arc) 7-12 68% 173 40% 2.18
2 McGehee High (McGehee) 7-12 69% 320 24% 1.72
3 KIPP Blytheville Collegiate High (KIPP Delta Public Schools) 9-12 86% 103 18% 1.66
4 Clarendon High (Clarendon) 7-12 90% 139 16% 1.65
5 Brinkley High (Brinkley) 7-12 75% 146 20% 1.60
5 Dumas High (Dumas) 10-12 71% 110 16% 1.60
Outstanding Educational Performance Awards 2016 Page A1
APPENDIX A. Methods
The Office for Education Policy strives to make all of our calculations and publications transparent to our readers. Thus, in this appendix we describe our data source, calculations performed on these data for the purposes of our reporting, and our method for determining a school’s classification as an elementary, middle, or high school.
All data used in this report were obtained from the Arkansas Department of Education via the link http://www.arkansased.gov/divisions/learning-services/student-assessment/test-scores/year?y=2016. Other data, such as the percent of students eligible for free and reduced lunch, were obtained from the Arkansas Department of Education Data Center (http://adedata.arkansas.gov).
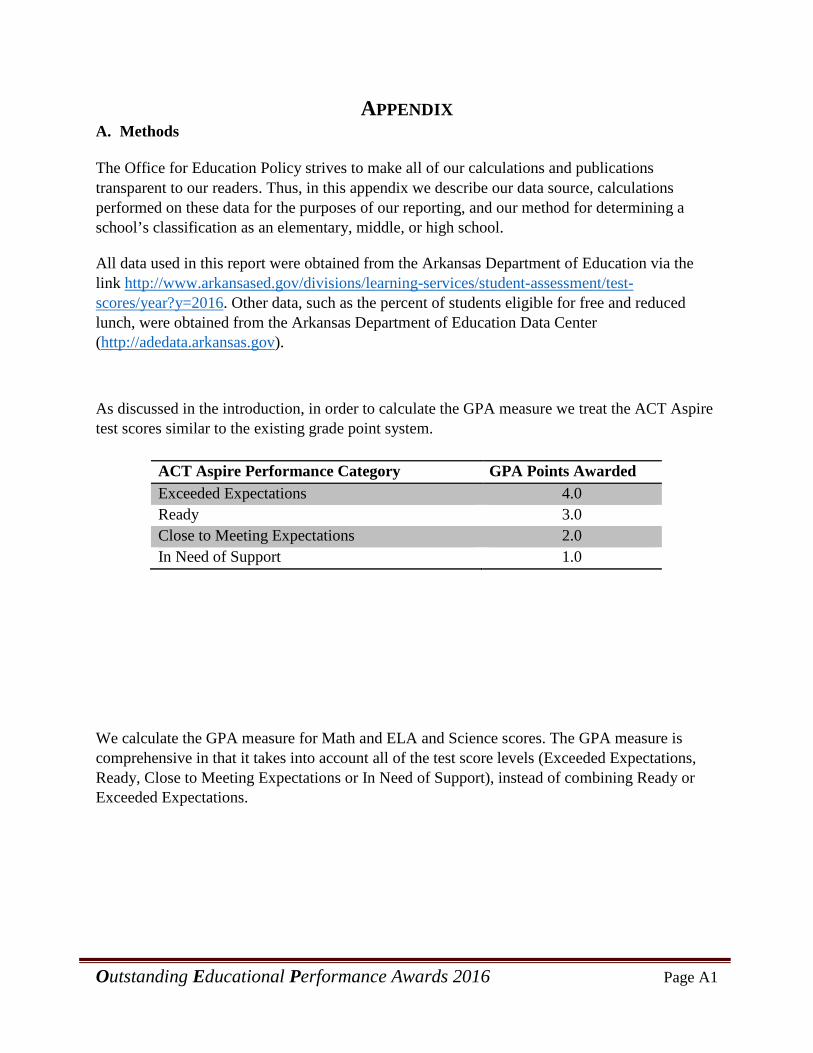
As discussed in the introduction, in order to calculate the GPA measure we treat the ACT Aspire test scores similar to the existing grade point system.
We calculate the GPA measure for Math and ELA and Science scores. The GPA measure is comprehensive in that it takes into account all of the test score levels (Exceeded Expectations, Ready, Close to Meeting Expectations or In Need of Support), instead of combining Ready or Exceeded Expectations.
ACT Aspire Performance Category GPA Points Awarded Exceeded Expectations 4.0 Ready 3.0 Close to Meeting Expectations 2.0 In Need of Support 1.0

Outstanding Educational Performance Awards 2016 Page A2
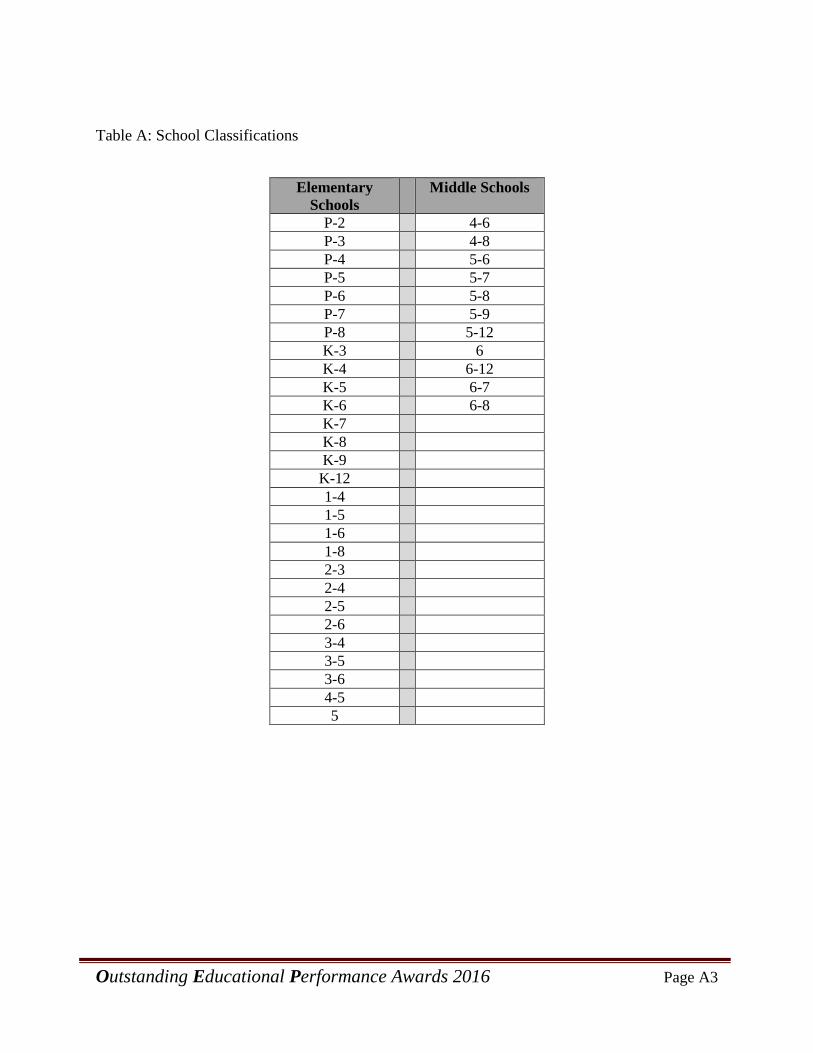
B. School Classification
For the OEP Awards, we classified schools based on the following rules:
• Elementary School: primarily grades 3-5 (minimum grade P, K, 1, 2, 3, or 4) • Middle School: primarily grades 6-8 (minimum grade of 4, 5, or 6 and maximum grade
of 7, or 8)
There were also a few “comprehensive schools,” such as K-8 or K-12 schools, that we included as either middle schools or elementary schools based on their enrollment numbers. The following table lists every grade configuration and their classifications.
Outstanding Educational Performance Awards 2016 Page A3
Table A: School Classifications
Elementary Schools
Middle Schools
P-2 4-6 P-3 4-8 P-4 5-6 P-5 5-7 P-6 5-8 P-7 5-9 P-8 5-12 K-3 6 K-4 6-12 K-5 6-7 K-6 6-8 K-7 K-8 K-9
K-12 1-4 1-5 1-6 1-8 2-3 2-4 2-5 2-6 3-4 3-5 3-6 4-5 5
Outstanding Educational Performance Awards 2016 Page A4
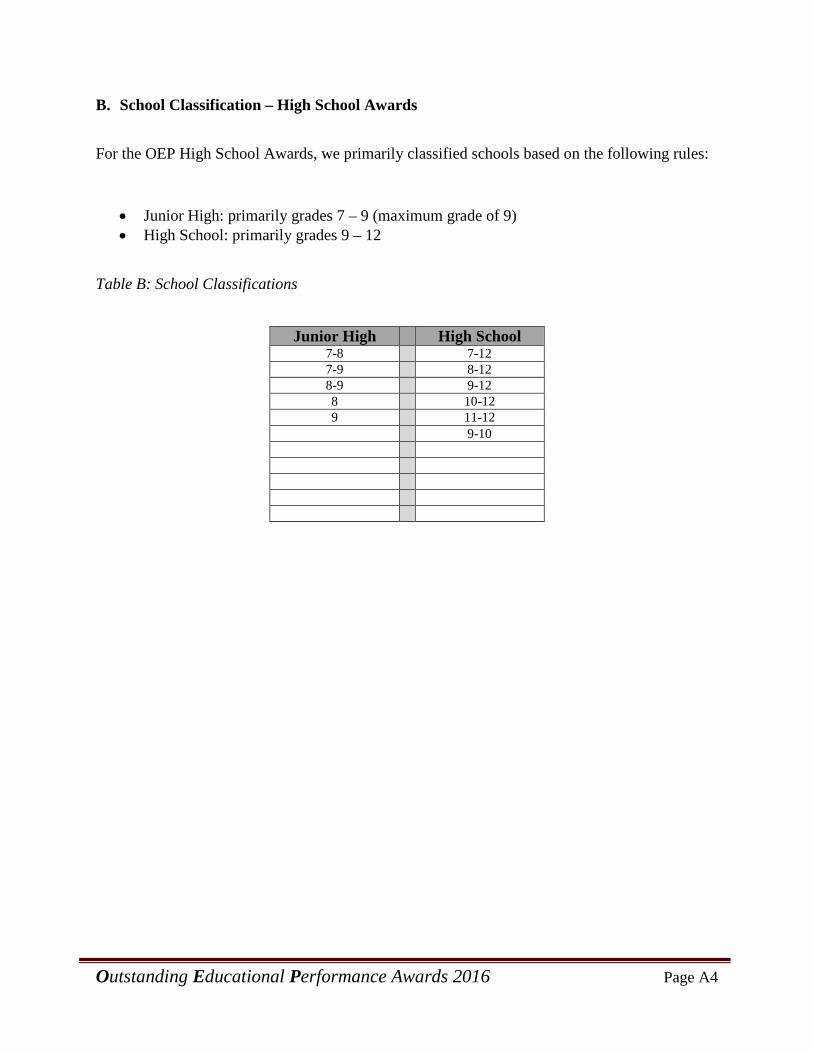
B. School Classification – High School Awards
For the OEP High School Awards, we primarily classified schools based on the following rules:
• Junior High: primarily grades 7 – 9 (maximum grade of 9) • High School: primarily grades 9 – 12
Table B: School Classifications
Junior High High School 7-8 7-12 7-9 8-12 8-9 9-12 8 10-12 9 11-12 9-10