Embed Size (px)
Citation preview

Arizona Physicians IPA, Inc. Financial Statements as of and for the Years Ended December 31, 2016 and 2015, Supplemental Schedules as of and for the Year Ended December 31, 2016, and Independent Auditors’ Report

ARIZONA PHYSICIANS IPA, INC.
TABLE OF CONTENTS
Page
INDEPENDENT AUDITORS’ REPORT 1–2
FINANCIAL STATEMENTS AS OF AND FOR THE YEARS ENDED DECEMBER 31, 2016 AND 2015: Balance Sheets 3 Statements of Operations 4 Statements of Comprehensive Income 5 Statements of Changes in Stockholder’s Equity and Accumulated Other Comprehensive (Loss) Income 6 Statements of Cash Flows 7 Notes to Financial Statements 8–28
SUPPLEMENTAL SCHEDULES AS OF AND FOR THE YEAR ENDED DECEMBER 31, 2016: Exhibit I—Supplemental Combining Statements (Unaudited) Supplemental Combining Balance Sheets Supplemental Combining Statements of Operations
INDEPENDENT AUDITORS’ REPORT
To the Board of Directors of Arizona Physicians IPA, Inc. 3141 North 3rd Avenue Phoenix, AZ 85013
We have audited the accompanying financial statements of Arizona Physicians IPA, Inc. (the “Company”), which comprise the balance sheets as of December 31, 2016 and 2015, and the related statements of operations, comprehensive income, changes in stockholder’s equity and accumulated other comprehensive income, and cash flows for the years then ended, and the related notes to the financial statements.
Management’s Responsibility for the Financial Statements
Management is responsible for the preparation and fair presentation of these financial statements in accordance with accounting principles generally accepted in the United States of America; this includes the design, implementation, and maintenance of internal control relevant to the preparation and fair presentation of financial statements that are free from material misstatement, whether due to fraud or error.
Auditors’ Responsibility
Our responsibility is to express an opinion on these financial statements based on our audits. We conducted our audits in accordance with auditing standards generally accepted in the United States of America. Those standards require that we plan and perform the audit to obtain reasonable assurance about whether the financial statements are free from material misstatement.
An audit involves performing procedures to obtain audit evidence about the amounts and disclosures in the financial statements. The procedures selected depend on the auditor’s judgment, including the assessment of the risks of material misstatement of the financial statements, whether due to fraud or error. In making those risk assessments, the auditor considers internal control relevant to the Company’s preparation and fair presentation of the financial statements in order to design audit procedures that are appropriate in the circumstances, but not for the purpose of expressing an opinion on the effectiveness of the Company’s internal control. Accordingly, we express no such opinion. An audit also includes evaluating the appropriateness of accounting policies used and the reasonableness of significant accounting estimates made by management, as well as evaluating the overall presentation of the financial statements.
We believe that the audit evidence we have obtained is sufficient and appropriate to provide a basis for our audit opinion.
Opinion
In our opinion, the financial statements referred to above present fairly, in all material respects, the financial position of Arizona Physicians IPA, Inc. as of December 31, 2016 and 2015, and the results of its operations and its cash flows for the years then ended in accordance with accounting principles generally accepted in the United States of America.

- 2 -
Report on Supplementary Schedules
Our audits were conducted for the purpose of forming an opinion on the financial statements as a whole. The supplementary information in Exhibit I, although not a part of the basic financial statements, is required by the Arizona Health Care Cost Containment System who considers it to be an essential part of financial reporting for placing the basic financial statements in an appropriate operational, economic, or historical context. We have applied certain limited procedures to the required supplementary information in accordance with auditing standards generally accepted in the United States of America, which consisted of inquiries of management about the methods of preparing the information and comparing the information for consistency with managements responses to our inquiries, the basic financial statement, and other knowledge we obtained during our audit of the basic financial statements. We do not express an opinion or provide any assurance on the information because the limited procedures do not provide us with sufficient evidence to express an opinion or provide any assurance.
April 27, 2017

- 3 -
ARIZONA PHYSICIANS IPA, INC.
BALANCE SHEETSAS OF DECEMBER 31, 2016 AND 2015(In thousands, except share and per share data)
2016 2015ASSETS
CURRENT ASSETS: Cash and cash equivalents 104,903$ 168,331$ Short-term investments 3,762 4,261 Premiums receivable 99,525 35,407 AHCCCS reinsurance receivable 37,775 34,625 Other contract program receivables 12,690 8,384 Other receivables—net of allowances of $1,328 and $265 in 2016 and 2015, respectively 5,665 4,986 Related-party receivable—net - 198 Investment receivables 2,115 1,616 Current state income taxes receivable 851 851 Current deferred taxes—net - 705 Other assets 465 76
Total current assets 267,751 259,440
LONG-TERM ASSETS: Long-term investments 296,153 223,739 Other long-term assets 19,980 190 Long-term deferred income taxes—net 1,748 -
Total long-term assets 317,881 223,929
TOTAL 585,632$ 483,369$
LIABILITIES AND STOCKHOLDER’S EQUITY
CURRENT LIABILITIES: Medical services payable 299,366$ 239,030$ Medicaid risk sharing payable 76,165 51,280 Other payables to contract programs 15,329 9,578 Accounts payable and accrued expenses 8,958 8,190 Related-party payable—net 5,439 - Current federal income taxes payable 5,062 24,279
Total current liabilities 410,319 332,357
LONG-TERM DEFERRED INCOME TAXES—Net - 338
Total liabilities 410,319 332,695
CONTINGENCIES (Note 6)
STOCKHOLDER’S EQUITY: Common stock, $0.01 par value—1,000,000 shares authorized; two shares issued and outstanding - - Additional paid-in capital 77,516 77,516 Retained earnings 99,073 71,825 Accumulated other comprehensive (loss) income (1,276) 1,333
Total stockholder’s equity 175,313 150,674
TOTAL 585,632$ 483,369$
See notes to financial statements.

- 4 -
ARIZONA PHYSICIANS IPA, INC.
STATEMENTS OF OPERATIONSFOR THE YEARS ENDED DECEMBER 31, 2016 AND 2015(In thousands)
2016 2015
REVENUES: Capitation and risk-sharing settlements 2,697,780$ 2,406,935$ Delivery supplemental premiums 59,283 56,458 Investment income—net 10,125 7,572
Total revenues 2,767,188 2,470,965
MEDICAL SERVICES EXPENSES: Hospital inpatient services 464,016 459,421 Medical compensation 579,616 491,575 Pharmacy 320,048 294,854 Outpatient facility 227,526 151,198 Emergency facility services 130,574 118,949 Nursing facility and home health care 109,606 109,621 Lab, x-ray, and medical imaging 71,375 64,981 Transportation 81,262 68,732 Dental 83,143 71,088 Other medical services 76,919 63,287 Durable medical equipment 60,365 53,176 Long-term care institutional 121,371 115,902 Long-term care home-based and community-based services 125,468 113,296 Recoveries from AHCCCS (67,253) (75,392)
Total medical services expenses 2,384,036 2,100,688
ADMINISTRATIVE EXPENSES 278,149 228,829
PREMIUM TAXES 43,179 38,757
Total expenses 2,705,364 2,368,274
INCOME BEFORE INCOME TAXES 61,824 102,691
PROVISION FOR INCOME TAXES 34,576 44,499
NET INCOME 27,248$ 58,192$
See notes to financial statements.

- 5 -
ARIZONA PHYSICIANS IPA, INC.
STATEMENTS OF COMPREHENSIVE INCOMEFOR THE YEARS ENDED DECEMBER 31, 2016 AND 2015(In thousands)
2016 2015
NET INCOME 27,248$ 58,192$
OTHER COMPREHENSIVE LOSS: Gross unrealized holding losses on investment securities during the period (1,521) (1,757) Income tax effect 532 1,042
Total unrealized losses—net of tax (989) (715)
Gross reclassification adjustment for net realized gains included in net earnings (2,492) (2,169) Income tax effect 872 950
Total reclassification adjustment—net of tax (1,620) (1,219)
Other comprehensive loss (2,609) (1,934)
COMPREHENSIVE INCOME 24,639$ 56,258$
See notes to financial statements.

- 6 -
ARIZONA PHYSICIANS IPA, INC.
STATEMENTS OF CHANGES IN STOCKHOLDER’S EQUITY AND ACCUMULATED OTHER COMPREHENSIVE (LOSS) INCOMEFOR THE YEARS ENDED DECEMBER 31, 2016 AND 2015(In thousands, except share data)
AccumulatedAdditional Other Total
Paid-In Retained Comprehensive Shareholder’sShares Amount Capital Earnings (Loss) Income Equity
BALANCE—January 1, 2015 2 - $ 77,516$ 28,633$ 3,267$ 109,416$
Comprehensive income: Net income - - - 58,192 - 58,192 Change in net unrealized losses on investments available-for-sale—net of tax effects and reclassification adjustments - - - - (715) (715) Reclassification adjustments for net realized gains included in net income—net of tax effects - - - - (1,219) (1,219)
Total comprehensive income 56,258
Dividends - - - (15,000) - (15,000)
BALANCE—December 31, 2015 2 - 77,516 71,825 1,333 150,674
Comprehensive income: Net income - - - 27,248 - 27,248 Change in net unrealized losses on investments available-for-sale—net of tax effects and reclassification adjustments - - - - (989) (989) Reclassification adjustments for net realized gains included in net income—net of tax effects - - - - (1,620) (1,620)
Total comprehensive income 24,639
BALANCE—December 31, 2016 2 - $ 77,516$ 99,073$ (1,276)$ 175,313$
See notes to financial statements.
Common Stock

- 7 -
ARIZONA PHYSICIANS IPA, INC.
STATEMENTS OF CASH FLOWSFOR THE YEARS ENDED DECEMBER 31, 2016 AND 2015(In thousands)
2016 2015
CASH FLOWS FROM OPERATING ACTIVITIES: Net income 27,248$ 58,192$ Adjustments to reconcile net income to net cash provided by operating activities: Amortization of investment premium—net 1,887 1,482 Deferred income taxes 23 (443) Gains on sale of investments—net (2,493) (2,169) Changes in operating assets and liabilities: Premiums receivable (64,118) (5,680) AHCCCS reinsurance receivables (3,150) (6,228) Other contract program receivables (879) 13 Other receivables (599) 713 Other assets (389) (76) Investment receivables (499) (97) Current income taxes (19,217) 14,260 Medical services payable 60,336 8,153 Accounts payable and accrued expenses 1,202 1,394 Medicaid risk sharing payables 24,885 18,838 Other payables to contract programs 10,655 4,673 Related party receivable—net 5,637 3,671
Net cash provided by operating activities 40,529 96,696
CASH FLOWS FROM INVESTING ACTIVITIES: Purchases of investments available-for-sale (197,205) (108,206) Proceeds from maturities/sales of investments available-for-sale 121,883 70,502
Net cash used in investing activities (75,322) (37,704)
CASH FLOWS FROM FINANCING ACTIVITIES: Dividends paid - (15,000) Mortgage loan disbursements (19,790) (190) Checks outstanding (434) (741) AHCCCS funds administered (4,904) 14,995 Customer funds administered (3,427) 6,992 Other (80) -
Net cash (used in) provided by financing activities (28,635) 6,056
NET INCREASE IN CASH AND CASH EQUIVALENTS (63,428) 65,048
CASH AND CASH EQUIVALENTS—Beginning of the year 168,331 103,283
CASH AND CASH EQUIVALENTS—End of year 104,903$ 168,331$
SUPPLEMENTAL CASH FLOW DISCLOSURE—Cash paid for income taxes 53,769$ 30,683$
See notes to financial statements.
- 8 -
ARIZONA PHYSICIANS IPA, INC.
NOTES TO FINANCIAL STATEMENTS AS OF AND FOR THE YEARS ENDED DECEMBER 31, 2016 AND 2015 (In thousands)
1. ORGANIZATIONAL STRUCTURE AND OPERATION
Organization—Arizona Physicians IPA, Inc. (the “Company” or “APIPA”) was incorporated on September 19, 1995. The Company is a wholly owned, for-profit subsidiary of United HealthCare, Inc. (“UHC”), which is a wholly owned subsidiary of United HealthCare Services, Inc. (“UHS”), a Minnesota corporation. UHS provides management services to managed care companies and is a wholly owned subsidiary of UnitedHealth Group Incorporated (“UHG”). UHG is a publicly held company trading on the New York Stock Exchange.
Operation—The majority of the Company’s premium revenues result from its contracts with the Arizona Health Care Cost Containment System (“AHCCCS”). Under these contracts the Company provides health care benefits to Medicaid and expansion enrollees (“Acute”), Arizona Long Term Care System (“ALTCS”), and Children’s Rehabilitative Services (“CRS”) members. AHCCCS also provides prior period coverage for the period of time prior to the member’s enrollment with the Company during which time the member is eligible for covered services. The contracts have been approved by AHCCCS and expire on September 30, 2017, with capitation rates up for renewal annually. The Company also contracts with the Arizona Department of Economic Security Division for Developmental Disabilities (“DES/DDD”) and the Centers for Medicare and Medicaid Services (“CMS”) for its Medicare Advantage health plan.
2. BASIS OF PRESENTATION, USE OF ESTIMATES AND SIGNIFICANT ACCOUNTING POLICIES
Basis of Presentation—The Company has prepared the financial statements according to United States of America (U.S.) Generally Accepted Accounting Principles (GAAP).
Use of Estimates—These financial statements include certain amounts based on the Company’s best estimates and judgments. The Company’s most significant estimates are related to medical services expenses, AHCCCS reinsurance receivable, medical services payable, Medicaid risk sharing payable, valuation of certain investments, and estimates and judgments related to income taxes. These estimates require the application of complex assumptions and judgments, often because they involve matters that are inherently uncertain, and will likely change in subsequent periods. The impact of any changes in estimates is included in earnings in the period in which the estimate is adjusted.
Cash, Cash Equivalents, and Investments—Cash and cash equivalents are highly liquid investments with original maturity of three months or less. The fair value of cash and cash equivalents approximates their carrying value because of the short maturity of the instruments.
Cash and cash equivalents include the Company’s share of an investment pool sponsored and administered by UHS. The investment pool consists principally of investments with original maturities of less than one year, with the average life of the individual investments being less than 60 days. The Company’s share of the pool represents an undivided ownership interest in the pool and is immediately convertible to cash at no cost or penalty. The participants within the pool have an individual fund number to track those investments owned by the Company. In addition, the Company is listed as a participant in the executed custodial agreement between UHS and the custodian whereby the Company’s share in the investment pool is segregated and separately maintained. The pool is primarily invested in government obligations, commercial paper, certificates of deposit, and short-term agency notes and is recorded at cost or amortized cost. Interest income from the pool accrues daily to participating members based upon ownership percentage.

- 9 -
The Company had checks outstanding of $343 and $777 at December 31, 2016 and 2015, respectively, which were classified in accounts payable and accrued expenses in the balance sheets. The change in this balance has been reflected as checks outstanding within financing activities in the statements of cash flows. The outstanding checks are related to zero balance accounts. The Company does not net checks outstanding with deposits in other accounts.
Investments with maturities of less than one year are classified as short-term. All other investments are classified as available-for-sale and reported at fair value based on quoted market prices, where available.
The Company excludes unrealized gains and losses on investments in available-for-sale securities from earnings, and reports them as accumulated other comprehensive (loss) income, net of income tax effects, as a separate component of stockholder’s equity. To calculate realized gains and losses on the sale of investments, the Company specifically identifies the cost of each investment sold.
The Company evaluates an investment for impairment by considering the length of time and extent to which market value has been less than cost or amortized cost, the financial condition and near-term prospects of the issuer as well as specific events or circumstances that may influence the operations of the issuer, and the Company’s intent to sell the security or the likelihood that it will be required to sell the security before recovery of the entire amortized cost.
For debt securities, if the Company intends to either sell, or determines that it will be more likely than not required to sell a security before recovery of the entire amortized cost basis of maturity of the security, the Company recognizes the entire impairment in investment income–net within the statements of operations. If the Company does not intend to sell the debt security, and it determines that it will not be more likely than not required to sell the security, but it does not expect to recover the entire amortized cost basis, the impairment is bifurcated into the amount attributed to the credit loss, which is recognized in earnings, and all other causes, which are recognized in accumulated other comprehensive (loss) income.
New information and the passage of time can change these judgments. The Company manages its investment portfolio to limit its exposure to any one issuer or market sector, and largely limits its investments to U.S. government and agency securities; state and municipal securities; mortgage-backed securities; and corporate obligations, substantially all of which are investment grade quality. Securities downgraded below policy minimums after purchase will be disposed of in accordance with the investment policy.
Investment income earned and due as of the reporting date, in addition to investment income earned but not paid or collected until subsequent periods, is reported as investment receivables in the balance sheets. The Company evaluates the collectability of the amounts due and amounts determined to be uncollectible are written off in the period in which the determination is made.
Investment income—net includes investment income collected during the period, as well as the change in investment income due and accrued on the Company’s holdings. Amortization of premium or discount on bonds and certain external investment management costs are also included in investment income—net.
Notes Receivable—Effective November 19, 2015, the Company entered into a Receivable Purchase and Servicing Agreement with OptumBank, Inc., an affiliate. The Company agrees to purchase, without recourse, up to $20,000 of notes receivable associated with a real-estate term loan facility (“RETLF”) issued to a subsidiary of Chicanos Por la Causa, Inc. (“CPLC”), a non-profit organization. The commercial loans are part of a community development partnership with CPLC. The loans are fixed low-interest notes and mature in full on the first day of the seventh year after the date of the loan. The loans are collateralized by the properties invested in by CPLC. Interest payments must be made in arrears at the end of each quarter beginning April 1, 2017.

- 10 -
The loans are stated at outstanding principle. There are no origination costs incurred by the Company or allowance recorded on the receivable as of December 31, 2016. The Company has the ability and the intent to hold the loans for the foreseeable future, until maturity, or payoff.
As of December 31, 2016 there are two outstanding notes receivable, $13,686 issued on February 9, 2016 and $6,294 issued on March 31, 2016. The receivables are reported as other long-term assets in the balance sheets. Generally, a loan is identified as impaired when it is probable that the Company will be unable to collect all amounts due (including both interest and principle) according to the contractual terms of the loan agreement. No impairments were identified as of December 31, 2016.
Premium Revenues—Capitation and risk-sharing settlements and delivery supplemental premiums are contractual. Capitation revenues are generally paid in advance of the coverage period in which benefits are to be provided and are earned and recognized during the applicable coverage period regardless of whether services are incurred. The majority of premium revenues recorded is based on capitated rates, which are monthly premiums paid for each member enrolled.
As part of the Value-Based Purchasing Initiative (“VBP”), 1% of gross prospective capitation, excluding CRS, from all contractors in Arizona is at-risk to be redistributed based upon each contractor’s performance on selected Quality Management Performance Measures as determined by AHCCCS. AHCCCS will recoup the amounts due from contractors to be redistributed once reconciliation for the contract period is complete. The Company accrued a payable of $15,329 and $1,387 as of December 31, 2016 and 2015, respectively, for revenues it expects to be recouped as other payables to contract programs in the balance sheets and capitation and risk-sharing settlements within the statements of operations.
CMS deploys a risk adjustment model that apportions premiums paid to all health plans according to health severity and certain demographic factors. The CMS risk adjustment model pays more for members whose medical history indicates they have certain medical conditions. Under this risk adjustment methodology, CMS calculates the risk-adjusted premium payment using diagnosis data from hospital inpatient, hospital outpatient, and physician treatment settings. The Company and health care providers collect, capture, and submit the necessary and available diagnosis data to CMS within prescribed deadlines. The Company estimates risk adjustment revenues based upon the diagnosis data submitted and expected to be submitted to CMS, which result in changes to its Medicare revenues. The Company recognizes such changes when the amounts become determinable and supportable and collectability is reasonably assured. The estimated risk adjusted payments due to the Company at December 31, 2016 and 2015, were $43,162 and $22,516 respectively, and are recorded as premiums receivable in the balance sheets. The Company recognized $4,918 and $1,130 for changes in prior year Medicare risk factor estimates during the years ended December 31, 2016 and 2015, respectively, which is recorded as capitation and risk-sharing settlements within the statements of operations.
Delivery supplemental premium payments are per delivery and intended by AHCCCS to cover the cost of maternity care. Such premiums are recognized in the month that the delivery occurs, and are recorded as delivery supplemental premiums in the statements of operations and other contract program receivables in the accompanying balance sheets.
Prospective capitation from the ALTCS contract is paid for those members who are receiving long-term care services and reside in a nursing facility, a certified home and community based setting or in their own home. The prospective capitation rate is a blended rate that uses an institutional rate and a Home and Community Based Services (“HCBS”) rate based on an assumed placement ratio of HCBS member months to total member months for each geographic service area. Additionally, the prospective capitation incorporates an assumed deduction for the Share of Cost (“SOC”), which members contribute to the cost of care based on their income and type of placement. The Company and its contracted providers collect members’ SOC directly from members.
At the end of the contract year, AHCCCS compares the actual HCBS member months to the assumed HCBS percentage that was used to determine the full long-term care capitation rate for that year. If the Company’s actual HCBS percentage is different than the assumed percentage, AHCCCS will recoup (or

- 11 -
reimburse) the difference between the institutional capitation rate and the HCBS capitation rate for the number of member months, which exceeded (or was less than) the assumed percentage. The Company recorded a receivable of $449 as other contract program receivables and a payable of $3,669 as Medicaid risk sharing payable related to HCBS redetermination in the balance sheets at December 31, 2016 and 2015, respectively.
After the end of the contract year, AHCCCS compares actual SOC assignment to the SOC assignment assumed in the calculation of the prospective capitation rate. Assumed SOC will be fully reconciled to actual SOC assignment, and AHCCCS will either recoup or refund the total difference, as applicable. The Company recorded $2,678 and $4,476 related to member SOC redetermination as premiums receivable in the balance sheets at December 31, 2016 and 2015, respectively.
Medical Services Expenses and Medical Services Payable—Medical services expenses and medical services payable include estimates of the Company’s obligations for medical care services that have been rendered on behalf of insured consumers, but for which claims have either not yet been received or processed, and for liabilities for physician, hospital and other medical cost disputes. The Company develops estimates for medical services expenses incurred but not reported using an actuarial process that is consistently applied, centrally controlled and automated. The actuarial models consider factors such as historical submission and payment data, cost trends, customer and product mix, seasonality, utilization of health care services, contracted service rates, and other relevant factors. The Company estimates liabilities for physician, hospital and other medical services payable disputes based upon an analysis of potential outcomes, assuming a combination of litigation and settlement strategies. Each period, the Company re-examines previously established medical services payable estimates based on actual claim submissions and other changes in facts and circumstances. As the medical services payable estimates recorded in prior periods develop, the Company adjusts the amount of the estimates and includes the changes in estimates in medical services expenses in the period in which the change is identified.
The Company contracts with hospitals, physicians, and other providers of health care under capitated or discounted fee for service arrangements, including a hospital and nursing home negotiated per diem to provide medical care services to enrollees. Some of these contracts are with related parties (see Note 9). Capitated providers are at risk for the cost of medical care services provided to the Company’s enrollees; however, the Company is ultimately responsible for the provision of services to its enrollees should the capitated provider be unable to provide the contracted services.
As part of the VBP initiative the Company has agreements with certain medical providers that provide for the establishment of a pool into which the Company places funds based on the performance of the provider as defined in the contract. The Company manages the disbursement of funds from this account as well as reviews the utilization and designated quality scores based on members assigned to the provider. Any surpluses and/or deficits in the pool are shared by the Company and the provider based upon specific contracts and the liability is included within medical services payable on the balance sheets. The Company accrued $7,999 and $7,444 in medical services payable in the balance sheets for this program as of December 31, 2016 and 2015, respectively.
AHCCCS Reinsurance—AHCCCS Reinsurance is a stop-loss program provided by AHCCCS for the partial reimbursement of covered medical services and those costs incurred beyond an annual deductible per member. AHCCCS provides regular reinsurance so long as the member incurred an inpatient stay, catastrophic reinsurance for those members receiving certain drugs or diagnosed with specific disorders, transplant reinsurance and other reinsurance. Claims containing any prior period coverage are excluded from reinsurance coverage. Recoveries from AHCCCS are recorded at estimated amounts due to the Company pursuant to the Acute, CRS, ALTCS and DES/DDD contracts. All contracts require the respective agencies to reimburse the Company 75% (85% for catastrophic cases for Acute, CRS and DES/DDD contracts) of qualified health care costs in excess of a recovery deductible. The deductibles applied are $50 for DES/DDD, $25 for Acute, and $75 for CRS. The deductible for members covered under the ALTCS contract is dependent upon the Company’s

- 12 -
enrollment. For cases where qualified medical out-of-pocket expense exceeds $650, the Company is reimbursed for 100% of the expense.
The Company reports estimated recoveries from AHCCCS as AHCCCS reinsurance receivable in the balance sheets. Recoveries from AHCCCS have been offset against medical services expenses in the statements of operations.
Medicare Part D Pharmacy Benefits—The Company serves as a plan sponsor offering Medicare Part D prescription drug insurance coverage under contracts with CMS. Under the Medicare Part D program, there are seven separate elements of payment received by the Company during the plan year. These payment elements are as follows:
• CMS Premium. CMS pays a fixed monthly premium per member to the Company for the entire plan year.
• Member Premium. Additionally, certain members pay a fixed monthly premium to the Company for the entire plan year.
• Low-Income Premium Subsidy. For qualifying low-income members, CMS pays some or all of the member’s monthly premiums to the Company on the member’s behalf.
• Catastrophic Reinsurance Subsidy. CMS pays the Company a monthly cost reimbursement estimate to fund the CMS obligation to pay approximately 80% of the costs incurred by individual members in excess of the individual annual out-of-pocket maximum. A settlement is made with CMS, based on actual cost experience, after the end of the plan year.
• Low-Income Member Cost Sharing Subsidy. For qualifying low-income members, CMS pays on the member’s behalf some or all of a member’s cost sharing amounts, such as deductibles and coinsurance. The cost sharing subsidy is funded by CMS through monthly payments to the Company. The Company administers and pays for the subsidized portion of the claims on behalf of CMS, and a settlement payment is made between CMS and the Company, based on actual claims and premium experience, after the end of the plan year.
• CMS Risk-Share. Premiums from CMS are subject to risk corridor provisions that compare costs targeted in the Company’s annual bids by product and region to actual prescription drug costs, limited to actual costs that would have been incurred under the standard coverage as defined by CMS. Variances of more than 5% above or below the original bid submitted by the Company may result in CMS making additional payments to the Company, or require the Company to refund to CMS a portion of the premiums received. The Company estimates and recognizes an adjustment to premium revenues related to the risk corridor payment settlement based upon pharmacy claims experience to date. The estimate of the settlement associated with these risk corridor provisions requires the Company to consider factors that may not be certain, including estimates of eligible pharmacy costs and member eligibility status differences with CMS. The Company records risk-share adjustments to capitation and risk-sharing settlements in the statements of operations and other payables to contract programs or other contract program receivables in the balance sheets.
• Drug Discount. Health Reform Legislation mandated a consumer discount on brand name prescription drugs for Part D plan participants in the coverage gap. This discount is funded by CMS and pharmaceutical manufacturers, while the Company administers the application of these funds. Amounts received are not reflected as capitation and risk-sharing settlements, but rather are accounted for as deposits. The Company records a payable in other payables to contract programs when amounts are received from CMS, and a receivable in other contract program receivables when the Company bills the pharmaceutical manufacturers. Related cash flows are presented as customer funds administered within financing activities in the statements of cash flows.
- 13 -
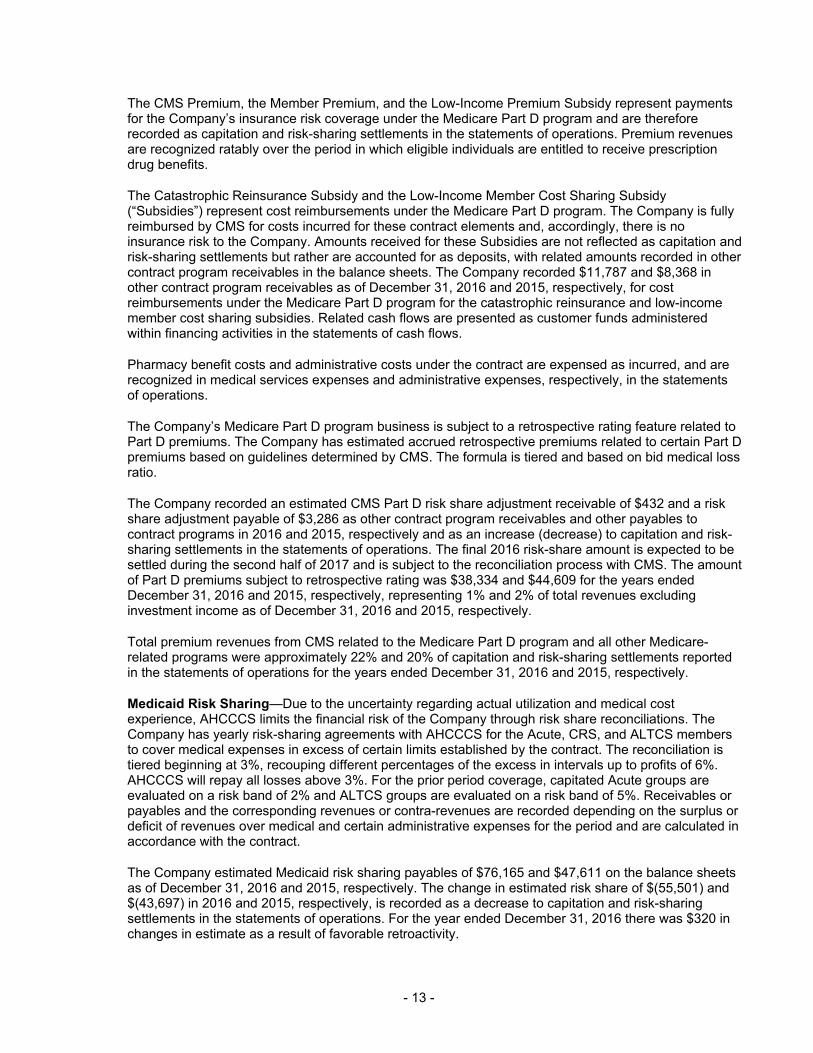
The CMS Premium, the Member Premium, and the Low-Income Premium Subsidy represent payments for the Company’s insurance risk coverage under the Medicare Part D program and are therefore recorded as capitation and risk-sharing settlements in the statements of operations. Premium revenues are recognized ratably over the period in which eligible individuals are entitled to receive prescription drug benefits.
The Catastrophic Reinsurance Subsidy and the Low-Income Member Cost Sharing Subsidy (“Subsidies”) represent cost reimbursements under the Medicare Part D program. The Company is fully reimbursed by CMS for costs incurred for these contract elements and, accordingly, there is no insurance risk to the Company. Amounts received for these Subsidies are not reflected as capitation and risk-sharing settlements but rather are accounted for as deposits, with related amounts recorded in other contract program receivables in the balance sheets. The Company recorded $11,787 and $8,368 in other contract program receivables as of December 31, 2016 and 2015, respectively, for cost reimbursements under the Medicare Part D program for the catastrophic reinsurance and low-income member cost sharing subsidies. Related cash flows are presented as customer funds administered within financing activities in the statements of cash flows.
Pharmacy benefit costs and administrative costs under the contract are expensed as incurred, and are recognized in medical services expenses and administrative expenses, respectively, in the statements of operations.
The Company’s Medicare Part D program business is subject to a retrospective rating feature related to Part D premiums. The Company has estimated accrued retrospective premiums related to certain Part D premiums based on guidelines determined by CMS. The formula is tiered and based on bid medical loss ratio.
The Company recorded an estimated CMS Part D risk share adjustment receivable of $432 and a risk share adjustment payable of $3,286 as other contract program receivables and other payables to contract programs in 2016 and 2015, respectively and as an increase (decrease) to capitation and risk-sharing settlements in the statements of operations. The final 2016 risk-share amount is expected to be settled during the second half of 2017 and is subject to the reconciliation process with CMS. The amount of Part D premiums subject to retrospective rating was $38,334 and $44,609 for the years ended December 31, 2016 and 2015, respectively, representing 1% and 2% of total revenues excluding investment income as of December 31, 2016 and 2015, respectively.
Total premium revenues from CMS related to the Medicare Part D program and all other Medicare-related programs were approximately 22% and 20% of capitation and risk-sharing settlements reported in the statements of operations for the years ended December 31, 2016 and 2015, respectively.
Medicaid Risk Sharing—Due to the uncertainty regarding actual utilization and medical cost experience, AHCCCS limits the financial risk of the Company through risk share reconciliations. The Company has yearly risk-sharing agreements with AHCCCS for the Acute, CRS, and ALTCS members to cover medical expenses in excess of certain limits established by the contract. The reconciliation is tiered beginning at 3%, recouping different percentages of the excess in intervals up to profits of 6%. AHCCCS will repay all losses above 3%. For the prior period coverage, capitated Acute groups are evaluated on a risk band of 2% and ALTCS groups are evaluated on a risk band of 5%. Receivables or payables and the corresponding revenues or contra-revenues are recorded depending on the surplus or deficit of revenues over medical and certain administrative expenses for the period and are calculated in accordance with the contract.
The Company estimated Medicaid risk sharing payables of $76,165 and $47,611 on the balance sheets as of December 31, 2016 and 2015, respectively. The change in estimated risk share of $(55,501) and $(43,697) in 2016 and 2015, respectively, is recorded as a decrease to capitation and risk-sharing settlements in the statements of operations. For the year ended December 31, 2016 there was $320 in changes in estimate as a result of favorable retroactivity.

- 14 -
Loss Adjustment Expenses—Loss adjustment expenses are costs that are expected to be incurred in connection with the adjustment and recording of health claims. Management believes the amount of the liability for unpaid claims adjustment expenses and associated claims interest as of December 31, 2016 is adequate to cover the Company’s cost for the adjustment of unpaid claims; however, actual expenses may differ from those established estimates. It is the responsibility of UHS to pay loss adjustment expenses in the event the Company ceases operations. As of December 31, 2016 and 2015, the unpaid loss adjustment expenses included in the accompanying balance sheets in the accounts payable and accrued expenses line item is $4,400 and $4,099, respectively.
Administration of AHCCCS Funds—The Company has three agreements with AHCCCS to administer funds from AHCCCS to specific provider populations and are accounted for as deposits. The net impact of funds transferred are reported as AHCCCS funds administered under cash flows from financing on the statements of cash flows.
Primary Care Physician Enhancement Payments—Effective for calendar years 2013 and 2014 the Patient Protection and Affordable Care Act (“ACA”) mandated that certain physicians practicing primary care (“PCPs”) were eligible to receive increased payments for specified primary care services provided to Medicaid eligible individuals. This was to encourage PCPs to serve the Medicaid population in advance of the Medicaid expansion in 2014.
The state elected to administer the additional PCP funds through non-risk reconciled payments for enhanced rates model. Under this model, the state’s capitation rate is not inclusive of the enhanced rate. The Company is reimbursed at agreed upon intervals for all of the enhanced payment amounts in the determined period. There is no risk to the Company because any excess or shortfall is 100% remitted or received back from the state. The Company recorded a payable to AHCCCS for reconciled overpayments of $4,904 in other payables to contract programs in the balance sheets as of December 31, 2015. The legislative requirement to pay enhanced rates to primary care physicians ended as of January 1, 2015 and there are no outstanding amounts related to this program as of December 31, 2016.
Rural Hospital Enhancement Payments—The Company entered into an agreement with AHCCCS in which it will pass through supplemental inpatient reimbursement payments to qualifying rural hospitals as determined by AHCCCS. AHCCCS remits payment and informs the Company of the amount to be paid to each provider. The Company then makes the prescribed payments to the providers specified within 15 days of the receipt of funds. There is no risk to the Company as a result of this program. At December 31, 2016 and 2015, the Company has nothing recorded on the balance sheets related to this program.
Nursing Facilities—The Company is required to make quarterly enhancement payments to qualifying nursing facilities once paid by AHCCCS. AHCCCS retroactively adjusts its capitation rates paid to the Company on a quarterly basis to fund these enhancement payments. Reconciliation is performed at the end of the contract year to true up the enhancement payments. The Company does not make payments for this program until funding has been received from AHCCCS. At December 31, 2016 and 2015, the Company has nothing recorded on the balance sheets related to this program.
Premium Deficiency Reserve—The Company assesses the profitability of each contract for providing health care services to its members by comparing anticipated premiums to health care related costs, including estimated payments for physicians and hospitals, commissions, and costs of collecting premiums and processing claims. If the anticipated future costs exceed the premiums, a loss contract accrual is recognized. The Company has no amounts recorded for premium deficiency reserves as of December 31, 2016 and 2015.
Concentration of Business and Credit Risk—Future contract awards are contingent upon the continuation of the Acute, ALTCS, DES/DDD, and CRS programs by AHCCCS and the State of Arizona and the continuation of the CMS Medicare Advantage program and the Company’s ability and desire to retain its status as a contractor under the programs. For the years ended December 31, 2016 and 2015, all of the Company’s total revenues and receivables were from these programs.

- 15 -
Premiums from the Acute, Medicare, and ALTCS contracts of $1,464,587, $582,793, and $363,061, respectively, represent 53%, 21%, and 13% of total revenues excluding investment income for the year ended December 31, 2016. Premiums from the Acute, Medicare and ALTCS contracts of $1,293,912, $506,526 and $346,530, respectively, represent 53%, 21% and 14% of total revenues excluding investment income for the year ended December 31, 2015. All other contracts represent less than 10% of total revenues excluding investment income. The entire ALTCS contract will be up for bid in 2017 for service periods beginning on October 1, 2017.
Concentration of credit risk with respect to receivables is limited due to the fact that AHCCCS, DES/DDD, and CMS are governmental agencies.
Industry Tax—The ACA includes an annual, nondeductible insurance industry tax (“Industry Tax”) to be levied proportionally across the insurance industry for risk-based health insurance products that began on January 1, 2014.
The Company estimates its liability for the Industry Tax based on a ratio of the Company’s applicable net premiums written, compared to the U.S. health insurance industry total applicable net premiums written, for the previous calendar year. The Company records in full the estimated liability for the Industry Tax at the beginning of the calendar year, with a corresponding deferred cost that is amortized to administrative expenses in the statements of operations using a straight-line method of allocation over the calendar year. The Company paid its Industry Tax liability of $39,188 and $35,007 in September 2016 and 2015, respectively.
AHCCCS has agreed to increase the capitation payments to the Company in response to the Industry Tax, including the nondeductible tax effect, for up to the amounts paid for the year. The Company recorded $47,276 and $39,218 as capitation and risk-sharing settlements in the statements of operations for the years ended December 31, 2016 and 2015, respectively.
Recently Adopted Accounting Standards—In November 2015, the FASB issued ASU No. 2015-17, “Balance Sheet Classification of Deferred Taxes (Topic 740)” (ASU 2015-17). ASU 2015-17 requires entities to present deferred tax assets and deferred tax liabilities as noncurrent on a classified balance sheet. ASU 2015-17 is effective for annual and interim reporting periods after December 15, 2016, and companies are permitted to apply ASU 2015-17 either prospectively or retrospectively. Early adoption of ASU 2015-17 is permitted. The Company adopted ASU 2015-17 on a prospective basis in the first quarter of 2016.
The Company has determined that there have been no other recently adopted or issued accounting standards that had or will have a material impact on its financial statements.
3. PLEDGES/ASSIGNMENTS AND GUARANTEES
The Company has no pledges, assignments, collateralized assets, or guaranteed liabilities not disclosed in the balance sheets as of December 31, 2016 and 2015.
4. PERFORMANCE BONDS
Pursuant to its contracts with AHCCCS, DES/DDD, and CMS, the Company is required annually to provide performance bonds, in an acceptable form, to guarantee performance of the Company’s obligations under certain contracts. To satisfy this requirement, the Company maintained surety bonds in 2016 and 2015 in the amounts of $234,300 and $197,753, respectively. The bonds are unsecured and require no Company assets to secure the obligations.

- 16 -
5. MEDICAL SERVICES PAYABLE ANALYSIS
Changes in estimates related to prior years’ incurred claims are included in medical services expenses in the current year in the statements of operations. Stop loss recoveries are included in AHCCCS reinsurance receivable, claim overpayment receivables are included in other receivables, and pharmacy rebate receivables are included in related-party receivable—net in the accompanying balance sheets. The following tables disclose paid claims, incurred claims, and the balance in the unpaid claim reserve for the years ended December 31, 2016 and 2015:
Current Year Prior Years’Incurred IncurredClaims Claims Total
Beginning year medical services payable - $ (239,030)$ (239,030)$ Paid claims—net of stop loss recoveries, pharmacy rebates and claim overpayments collected 2,154,284 177,226 2,331,510 End of year medical services payable 293,297 6,069 299,366
Incurred claims excluding stop loss recoveries, pharmacy rebate and claim overpayment receivables as presented below 2,447,581 (55,735) 2,391,846
Beginning stop loss recoveries, pharmacy rebate and claim overpayment receivables - 59,809 59,809 End of year stop loss recoveries, pharmacy rebate and claim overpayment receivables (62,316) (5,303) (67,619)
Total incurred claims 2,385,265$ (1,229)$ 2,384,036$
Current Year Prior Years’Incurred IncurredClaims Claims Total
Beginning year medical services payable - $ (230,877)$ (230,877)$ Paid claims—net of stop loss recoveries, pharmacy rebates and claim overpayments collected 1,936,823 163,981 2,100,804 End of year medical services payable 235,417 3,613 239,030
Incurred claims excluding stop loss recoveries, pharmacy rebate and claim overpayment receivables as presented below 2,172,240 (63,283) 2,108,957
Beginning stop loss recoveries, pharmacy rebate and claim overpayment receivables - 51,540 51,540 End of year stop loss recoveries, pharmacy rebate and claim overpayment receivables (54,545) (5,264) (59,809)
Total incurred claims 2,117,695$ (17,007)$ 2,100,688$
2016
2015

- 17 -
The liability for medical services payable, net of stop loss recoveries, pharmacy rebate receivables and claim overpayment receivables, as of December 31, 2015 was $179,221. As of December 31, 2016, $177,226 has been paid for incurred claims attributable to insured events of prior years. The medical services payable remaining for prior years including the effect of stop loss recoveries, pharmacy rebate receivables and claim overpayment receivables are now $766 as a result of re-estimation of unpaid claims. Therefore, there has been $1,229 of favorable prior year development since December 31, 2015 to December 31, 2016. The primary drivers consist of favorable development of $9,324 as a result of a change in the provision for adverse deviations in experience and favorable development of $2,022, $553, and $215 in retroactivity for provider gain share and bonus amounts, pharmacy rebates, and provider settlement claims, respectively. This was partially offset by unfavorable development of $6,341 in unfavorable retroactivity for inpatient, outpatient, physician, and pharmacy claims, along with unfavorable development of $3,530, $580, and $389 in AHCCCS reinsurance recoveries, other items, and Part D, respectively. At December 31, 2015, the Company recorded $17,007 of favorable development primarily driven by favorable development of $13,178 as a result of a change in the provision for adverse deviations in experience and $7,214 in AHCCCS reinsurance recoveries. This was partially offset by unfavorable development of $3,528 in retroactivity for inpatient, outpatient, physician, and pharmacy claims. Original estimates are increased or decreased as additional information becomes known regarding individual claims.
6. CONTINGENT LIABILITIES AND GOVERNMENT REGULATIONS
Because of the nature of its businesses, the Company is frequently made party to a variety of legal actions and regulatory inquiries, including class actions and suits brought by members, care providers, consumer advocacy organizations, customers and regulators, relating to the Company’s businesses, including management and administration of health benefit plans and other services.
The Company records liabilities for its estimates of probable costs resulting from these matters where appropriate. Estimates of costs resulting from legal and regulatory matters involving the Company are inherently difficult to predict, particularly where the matters: involve indeterminate claims for monetary damages or may involve fines, penalties or punitive damages; present novel legal theories or represent a shift in regulatory policy; involve a large number of claimants or regulatory bodies; are in the early stages of the proceedings; or could result in a change in business practices. Accordingly, the Company is often unable to estimate the losses or ranges of losses for those matters where there is a reasonable possibility or it is probable that a loss may be incurred. Although the outcomes of any such legal actions cannot be predicted, in the opinion of management, the resolution of any currently pending or threatened actions will not have a material adverse effect on the accompanying balance sheets or statements of operations of the Company.
The Company’s business is regulated at the federal, state, and local levels. The laws and rules governing the Company’s business and interpretations of those laws and rules are subject to frequent change. Broad latitude is given to the agencies administering those regulations. Further, the Company must obtain and maintain regulatory approvals to market and sell many of its products.
The Company has been, or is currently involved in various governmental investigations, audits and reviews. These include routine, regular and special investigations, audits and reviews by CMS, state insurance and health and welfare departments and other governmental authorities. Certain of the Company’s businesses have been reviewed or are currently under review, including for, among other things, compliance with coding and other requirements under the Medicare risk-adjustment model.
In February 2017, the United States Department of Justice decided to pursue, in part, a qui tam lawsuit that previously had been under seal challenging compliance with coding and other requirements under the Medicare risk-adjustment model (the Poehling matter). The Department of Justice and the qui tam plaintiff may file amended complaints in the coming months. The Company cannot reasonably estimate the range of loss, if any, that may result from the Poehling matter.

- 18 -
Risk Adjustment Data Validation (RADV) Audit—CMS adjusts capitation payments to Medicare Advantage plans and Medicare Part D plans according to the predicted health status of each beneficiary as supported by data from health care providers. The Company collects claim and encounter data from providers, who the Company generally relies on to appropriately code their claim submissions and document their medical records. CMS then determines the risk score and payment amount for each enrolled member based on the health care data submitted and member demographic information.
CMS and the Office of Inspector General for Health and Human Services periodically perform RADV audits of selected Medicare health plans to validate the coding practices of and supporting documentation maintained by health care providers. Such audits have in the past resulted and could in the future result in retrospective adjustments to payments made to the Company, fines, corrective action plans or other adverse action by CMS.
In February 2012, CMS announced a final RADV audit and payment adjustment methodology and that it will conduct RADV audits beginning with the 2011 payment year. These audits involve a review of medical records maintained by care providers and may result in retrospective adjustments to payments made to health plans. CMS has not communicated how the final payment adjustment under its methodology will be implemented.
Health Reform Legislation and the related federal and state regulations will continue to impact how the Company does business and could restrict revenue and enrollment growth in certain products and market segments, restrict premium growth rates for certain products and market segments, increase the Company’s medical and administrative costs, expose the Company to an increased risk of liability (including increasing our liability in federal and state courts for coverage determinations and contract interpretation), or put the Company at risk for loss of business. In addition, the Company’s results of operations, financial condition and cash flows could be materially adversely affected by such changes. The Health Reform Legislation may create new or expand existing opportunities for business growth, but due to its complexity, the impact of the Health Reform Legislation remains difficult to predict and is not yet fully known.

- 19 -
7. INVESTMENTS
A summary of investments by major security type is as follows:
Gross GrossAmortized Unrealized Unrealized Fair
December 31, 2016 Cost Gains Losses Value
Debt securities—available-for-sale: U.S. government and agency obligations 19,574$ 7$ (548)$ 19,033$ State and municipal obligations 103,889 634 (1,657) 102,866 Corporate obligations 127,032 605 (353) 127,284 U.S. agency mortgage-backed securities 33,623 120 (388) 33,355 Non-U.S. agency mortgage-backed securities 17,440 61 (124) 17,377
Total debt securities—available-for-sale 301,558 1,427 (3,070) 299,915
Total investments 301,558$ 1,427$ (3,070)$ 299,915$
December 31, 2015
Debt securities—available-for-sale: U.S. government and agency obligations 26,371$ 10$ (102)$ 26,279$ State and municipal obligations 85,429 3,068 (68) 88,429 Corporate obligations 68,626 194 (467) 68,353 U.S. agency mortgage-backed securities 31,911 58 (174) 31,795 Non-U.S. agency mortgage-backed securities 13,292 12 (160) 13,144
Total debt securities—available-for-sale 225,629 3,342 (971) 228,000
Total investments 225,629$ 3,342$ (971)$ 228,000$
The amortized cost and fair value of available-for-sale debt securities as of December 31, 2016, by contractual maturity, were as follows:
Amortized FairCost Value
Due in one year or less 3,757$ 3,762$ Due after one year through five years 76,876 77,163 Due after five years through ten years 102,128 101,150 Due after ten years 67,734 67,108 U.S. agency mortgage-backed securities 33,623 33,355 Non-U.S. agency mortgage-backed securities 17,440 17,377
Total debt securities—available-for-sale 301,558$ 299,915$
2016

- 20 -
The fair value of available-for-sale investments with gross unrealized losses by major security type and length of time that individual securities have been in a continuous unrealized loss position were as follows:
Gross Gross GrossFair Unrealized Fair Unrealized Fair Unrealized
December 31, 2016 Value Losses Value Losses Value Losses
Debt securities—available-for-sale: U.S. government and agency obligations 15,045$ (548)$ - $ - $ 15,045$ (548)$ State and municipal obligations 62,458 (1,641) 1,346 (16) 63,804 (1,657) Corporate obligations 33,674 (350) 1,592 (3) 35,266 (353) U.S. agency mortgage-backed securities 22,051 (388) - - 22,051 (388) U.S. non-agency mortgage-backed securities 8,443 (72) 2,128 (52) 10,571 (124)
Total debt securities—available-for-sale 141,671$ (2,999)$ 5,066$ (71)$ 146,737$ (3,070)$
December 31, 2015
Debt securities—available-for-sale: U.S. government and agency obligations 24,085$ (102)$ - $ - $ 24,085$ (102)$ State and municipal obligations 7,330 (68) 450 - 7,780 (68) Corporate obligations 40,972 (415) 3,699 (52) 44,671 (467) U.S agency mortgage-backed securities 24,685 (174) - - 24,685 (174) U.S. non-agency mortgage-backed securities 9,877 (102) 1,872 (58) 11,749 (160)
Total debt securities—available-for-sale 106,949$ (861)$ 6,021$ (110)$ 112,970$ (971)$
Less than 12 Months 12 Months or Greater Total
The unrealized losses from all securities as of December 31, 2016 were generated from approximately 152 positions out of a total of approximately 373 positions. The Company believes that it will collect all principal and interest due on its investments that have an amortized cost in excess of fair value. The unrealized losses on investments were primarily caused by interest rate increases and not by unfavorable changes in the credit ratings associated with these securities. The Company evaluates impairment at each reporting period for each of the securities whereby the fair value of the investment is less than its amortized cost. The contractual cash flows of the U.S. government and agency obligations are either guaranteed by the U.S. government or an agency of the U.S. government. It is expected that the securities would not be settled at a price less than the cost of the investment, and the Company does not intend to sell the investment until the unrealized loss is fully recovered. The Company evaluated the underlying credit quality and credit ratings of the issuers, noting whether a significant deterioration since purchase or other factors that may indicate an other-than-temporary impairment (“OTTI”), such as the length of time and extent to which fair value has been less than cost, the financial condition, and near term prospects of the issuer as well as specific events or circumstances that may influence the operations of the issuer and the Company’s intent to sell the investment. As of December 31, 2016, the Company did not have the intent to sell any of the securities in an unrealized loss position.

- 21 -
Net realized gains included in investment income—net on the statements of operations were from the following sources:
2016 2015
Total OTTI - $ (16)$
Net OTTI recognized in earnings - (16)
Gross realized losses from sales (356) (47) Gross realized gains from sales 2,848 2,216
Net realized gains (included in investment income—net on the statements of operations) 2,492 2,169
Income tax effect (included in provision for income taxes on the statement of operations) (872) (950)
Realized gains—net of taxes 1,620$ 1,219$
Years EndedDecember 31,
8. FAIR VALUE
Certain assets and liabilities are measured at fair value in the consolidated financial statements, or have fair values disclosed in the notes to financial statements. These assets and liabilities are classified into one of three levels of a hierarchy defined by GAAP. In instances in which the inputs used to measure fair value fall into different levels of the fair value hierarchy, the fair value measurement is categorized in its entirety based on the lowest level input that is significant to the fair value measurement in its entirety. The Company’s assessment of the significance of a particular item to the fair value measurement in its entirety requires judgment, including the consideration of inputs specific to the asset or liability.
The fair value hierarchy is summarized as follows:
Level 1—Quoted prices (unadjusted) for identical assets/liabilities in active markets.
Level 2—Other observable inputs, either directly or indirectly, including:
• Quoted prices for similar assets/liabilities in active markets;
• Quoted prices for identical or similar assets/liabilities in non-active markets (e.g., few transactions, limited information, non-current prices, high variability over time, etc.);
• Inputs other than quoted prices that are observable for the asset/liability (e.g., interest rates, yield curves, implied volatilities, credit spreads); and
• Inputs that are corroborated by other observable market data.
Level 3—Unobservable inputs that cannot be corroborated by observable market data.
Non-financial assets and liabilities, or financial assets and liabilities that are measured at fair value on a nonrecurring basis, are subject to fair value adjustments only in certain circumstances, such as when the Company records an impairment. There were no significant fair value adjustments for these assets and liabilities recorded during the years ended December 31, 2016 and 2015.

- 22 -
The following table presents a summary of the fair value measurements by level for assets and liabilities measured at fair value on a recurring basis:
Quoted Prices Otherin Active Observable Unobservable Total FairMarkets Inputs Inputs and Carrying
December 31, 2016 (Level 1) (Level 2) (Level 3) Value
Cash and cash equivalents 104,903$ - $ - $ 104,903$
Debt securities—available-for-sale: U.S. government and agency obligations 19,033 - - 19,033 State and municipal obligations - 102,866 - 102,866 Corporate obligations - 127,284 - 127,284 U.S. agency mortgage-backed securities - 33,355 - 33,355 Non-U.S. agency mortgage-backed securities - 17,377 - 17,377
Total debt securities—available-for-sale 19,033 280,882 - 299,915
Total cash, cash equivalents, and investments at fair value 123,936$ 280,882$ - $ 404,818$
December 31, 2015
Cash and cash equivalents 168,331$ - $ - $ 168,331$
Debt securities—available-for-sale: U.S. government and agency obligations 26,279 - - 26,279 State and municipal obligations - 88,429 - 88,429 Corporate obligations - 68,353 - 68,353 U.S. agency mortgage-backed securities - 31,795 - 31,795 Non-U.S. agency mortgage-backed securities - 13,144 - 13,144
Total debt securities—available-for-sale 26,279 201,721 - 228,000
Total cash, cash equivalents, and investments at fair value 194,610$ 201,721$ - $ 396,331$
Transfers between levels, if any, are recorded as of the beginning of the reporting period in which the transfer occurs. There were no transfers between Levels 1, 2 or 3 of any financial assets or liabilities during 2016 or 2015.
The Company does not have financial assets with a fair value hierarchy of Level 3.
The following methods and assumptions were used to estimate the fair value and determine the fair value hierarchy classification of each class of financial instrument:
Cash and Cash Equivalents—The carrying value of cash and cash equivalents approximates fair value, as maturities are less than three months. Fair values of cash equivalent instruments that do not trade on a regular basis in active markets are classified as Level 2.
Debt Securities—Fair values of debt and equity securities are based on quoted market prices, where available. The Company obtains one price for each security, primarily from a third-party pricing service (pricing service), which generally uses quoted or other observable inputs for the determination of fair value. The pricing service normally derives the security prices through recently reported trades for identical or similar securities and, if necessary, makes adjustments through the reporting date based

- 23 -
upon available observable market information. For securities not actively traded, the pricing service may use quoted market prices of comparable instruments or discounted cash flow analyses, incorporating inputs that are currently observable in the markets for similar securities. Inputs that are often used in the valuation methodologies include, but are not limited to, benchmark yields, credit spreads, default rates, prepayment speeds and non-binding broker quotes.
As the Company is responsible for the determination of fair value, it performs quarterly analyses on the prices received from the pricing service to determine whether the prices are reasonable estimates of fair value. Specifically, the Company compares the prices received from the pricing service to prices reported by a secondary pricing source such as its custodian, its investment consultant, and third-party investment advisors. Additionally, the Company compares changes in the reported market values and returns to relevant market indices to test the reasonableness of the reported prices. The Company’s internal price verification procedures, and review of fair value methodology documentation provided by independent pricing services, have not historically resulted in adjustment to the prices obtained from the pricing service.
Fair values of debt securities that do not trade on a regular basis in active markets, but are priced using other observable inputs, are classified as Level 2.
Fair value estimates for Level 1 and Level 2 equity securities are based on quoted market prices for actively traded equity security and/or other market data for the same or comparable instruments and transactions in establishing the prices.
The carrying amounts reported in the balance sheets for other receivables and accounts payable and accrued expenses approximate fair value because of their short-term nature.
9. RELATED-PARTY TRANSACTIONS
Pursuant to the terms of a Management Agreement (the “Agreement”), UHS will provide management services to the Company under a fee structure, which is based on a percentage of premium charge representing UHS’ expenses for services or use of assets provided to the Company. In addition, UHS provides or arranges for services on behalf of the Company using a pass-through of charges incurred by UHS on a PMPM basis (where the charge incurred by UHS is on a PMPM basis) or using another allocation methodology consistent with the Agreement. These services may include, but are not limited to, integrated personal health management solutions, such as disease management and treatment decision support, including a 24-hour call-in service, access to a network of transplant providers, and discount program services. The amount and types of services provided pursuant to the pass-through provision of the Agreement can change year over year as UHS becomes the contracting entity for services provided to the Company’s members. Total administrative services, capitation, and access fees under this arrangement totaled $226,604 and $180,540 in 2016 and 2015, respectively, and are included in medical services expenses and administrative expenses in the statements of operations. Direct expenses not covered under the Agreement, such as broker commissions, ACA assessments, and premium taxes, are paid by UHS on behalf of the Company. UHS is reimbursed by the Company for these direct expenses.
The Company also directly contracts with related parties to provide services to its members. The Company expensed as administrative expenses $72,442 and $61,881 in capitation fees and administrative services to related parties during 2016 and 2015, respectively. Dental Benefit Providers, Inc. provides dental care assistance. Effective January 1, 2015, this agreement was amended to reflect the change from an administrative services only agreement to a capitated agreement for all members, with the exception of certain CRS members. United Behavioral Health provides mental health and substance abuse services. OptumHealth Care Solutions, Inc. provides chiropractic, speech therapy, physical therapy and occupational therapy services.

- 24 -
The capitation expenses, administrative services, and access fees paid to related parties, that are included as administrative expenses in the accompanying statements of operations for the years ended December 31, 2016 and 2015, are shown below:
2016 2015
Dental Benefit Providers, Inc. 67,588$ 59,154$ United Behavioral Health 4,175 2,167 OptumHealth Care Solutions, Inc. 679 560
Total 72,442$ 61,881$
The Company contracts with OptumRx, Inc. to provide administrative services related to pharmacy management and pharmacy claims processing for its enrollees. Fees related to these agreements, which are calculated on a per-claim basis, of $11,444 and $10,272 in 2016 and 2015, respectively, are included in administrative expenses in the accompanying statements of operations. Additionally, OptumRx collects rebates on certain pharmaceutical products based on member utilization. Rebate receivables of $24,258 and $20,185 as of December 31, 2016 and 2015, are included as related-party payable—net and related-party receivable—net, respectively, on the balance sheets.
The Company contracts with OptumRx, Inc. to provide personal health products catalogues showing the health care products and benefit credits needed to redeem the respective products. OptumRx, Inc. will mail the appropriate personal health products catalogues to the Company’s members and manage the personal health products credit balance. OptumRx, Inc. also distributes personal health products to individual members based upon the terms of the agreement. Fees related to this agreement in 2016 and 2015, which are calculated on a PMPM basis, of $8,050 and $8,262, respectively, are included in the other medical services expenses in the accompanying statements of operations.
The Company holds a $50,000 subordinated revolving credit agreement with UHG, at an interest rate of London InterBank Offered Rate, plus a margin of 0.50%. The credit agreement is for a one-year term and automatically renews annually, unless terminated by either party. No amounts were outstanding under the line of credit as of December 31, 2016 and 2015.
In addition to the agreements above, UHS maintains a private short-term money market investment pool in which affiliated companies may participate (see Note 2). At December 31, 2016 and 2015, the Company’s portion was $95,384 and $147,607, respectively, and is included in cash and cash equivalents in the balance sheets.
The remaining related-party (payable) receivable—net, as reflected in the accompanying balance sheets, represents costs incurred in the ordinary course of business by, or on behalf of, the Company.
Effective November 19, 2015, the Company entered into a Receivable Purchase and Servicing Agreement with OptumBank, Inc., an affiliate. Under the terms of the agreement, the Company will purchase all receivables arising from a RETLF (see Note 2). As of December 31, 2016, the Company has purchased $19,980, in exchange for cash which is reported in other long-term assets.
10. STOCKHOLDER’S EQUITY
As a result of the change in net unrealized gains and losses on investments available-for-sale, the Company had accumulated other comprehensive (loss) income of $(1,276) and $1,333 as of December 31, 2016 and 2015, respectively.
The Company did not pay any dividends in 2016.

- 25 -
The Company paid dividends of $5,000 and $10,000 on December 1, 2015 to UHC. This was recorded as a decrease to retained earnings. Approval was required from the Arizona Department of Environmental Security (DES) for the $5,000 dividend paid from DDD contract equity and was received on November 24, 2015. The stockholder’s equity associated with AHCCCS contracts was not decreased as a result of the $10,000 dividend, therefore, no approval was required prior to distribution.
11. COMPLIANCE WITH FINANCIAL VIABILITY STANDARDS AND PERFORMANCE GUIDELINES
For the contract year ended September 30, 2016, the Company was not in compliance with the medical expense ratio requirement on the DES/DDD contract, but was in compliance with all other Financial Viability Standards and Performance Guidelines. There has been no impact to the Company to date as a result of the non-compliance, financial or otherwise. As of December 31, 2016, one quarter into the 2017 contract year, the Company was not in compliance with the administrative cost ratio requirement on the Acute contract. Performance against these standards and guidelines for the contract year ending September 30, 2017 is being monitored by the Company on a quarterly basis.
12. ACCRUED SANCTIONS
The Company had accrued a liability of $2,210 and $2,750 for AHCCCS sanctions related to encounter and quality measures not met as of December 31, 2016 and 2015, respectively. The sanctions are included in accounts payable and accrued expenses in the accompanying balance sheets.
13. PROVIDER INCENTIVES
The Company does not currently offer any provider incentives.
14. NON-COVERED SERVICES
The Company performed a review of claims with dates of service in 2016. Areas of focus included non-covered outpatient rehabilitation services, chiropractic services and dental services for adults. Small amounts of services were identified as having been provided to adults for outpatient rehabilitation services and chiropractic services. The results showed that $12 of chiropractic services and $4 of physical therapy services were paid for in 2016 for all members under contract.
15. INCOME TAXES
The Company’s operations are included in the consolidated federal income tax return of UHG. Federal and state income taxes are paid to or refunded by UHG pursuant to the terms of a tax sharing agreement, approved by the Board of Directors, under which taxes approximate the amount that would have been computed on a separate company basis. The Company receives a benefit at the federal rate in the current year for net losses incurred in that year to the extent losses can be utilized in the consolidated federal income tax return of UHG. There were no net operating losses or other tax carry forwards as of December 31, 2016 or 2015.

- 26 -
The components of the provision for income taxes for the years ended December 31, are as follows:
2016 2015
Current provision: Federal 34,553$ 48,839$ State and local - (3,897)
Total current provision 34,553 44,942
Deferred provision: Federal 23 (271) State and local - (172)
Total deferred provision 23 (443)
Total provision for income taxes 34,576$ 44,499$
The reconciliation of the tax provision at the U.S. Federal Statutory Rate to the provision for income taxes and the effective tax rate for the years ended December 31, 2016 and 2015 is as follows:
2016 2015
Tax provision at the U.S. federal statutory rate 21,638$ 35.0 % 35,942$ 35.0 % Industry tax 13,716 22.2 12,252 11.9 State income taxes—net of federal benefit - - (2,943) (2.9) Tax-exempt investment income (778) (1.3) (813) (0.8) Other—net - - 61 0.1
Provision for income taxes 34,576$ 55.9 % 44,499$ 43.3 %
Current net federal and state income taxes payable is $4,211 and $23,428 as of December 31, 2016 and 2015, respectively.
Deferred income tax assets and liabilities are recognized for the differences between the financial and income tax reporting bases of assets and liabilities, based on enacted tax rates and laws. The deferred income tax provision or benefit generally reflects the net change in deferred income tax assets and liabilities during the year. The current income tax provision reflects the tax consequence of revenues and expenses currently taxable or deductible on various income tax returns for the year reported.

- 27 -
The components of deferred income tax assets and liabilities as of December 31, 2016 and 2015 are as follows:
2016 2015
Deferred income tax assets: Accrued expenses - $ 486$ Bad debt reserve 465 93 Unpaid losses and loss adjustment expense 818 705 Unrealized loss 577 -
Total deferred income tax assets 1,860 1,284
Deferred income tax liabilities: Prepaid expenses 36 (27) Investments 74 (60) Unrealized gain 2 (830)
Total deferred income tax liabilities 112 (917)
Net deferred income tax assets 1,748$ 367$
As part of the contracts with AHCCCS the Company pays a premium tax imposed by Arizona Revised Statutes (“A.R.S.”) Section 36-2905. A.R.S. Section 20-226 exempts from state income tax, companies paying premium tax imposed by A.R.S. Section 20-224 (but not Section 36-2905). Therefore, an issue was raised regarding whether companies paying tax under A.R.S. Section 36-2905 are exempt from Arizona income tax.
Consequently, on August 6, 2015, Taxpayer Information Ruling (“TIR”) LR 15-007, was converted to a named ruling specifying that the income tax exemption statute (A.R.S. Section 43-1201(A)(14)) does not require the premium tax be paid pursuant to A.R.S. Section 20-224 to apply, only that a premium tax be paid. The ruling was received prior to filing the 2014 Arizona income tax return. Thus, the Company was excluded from the 2014 state income tax return. In addition, amended state income tax returns were filed for 2012 and 2013 in accordance with the ruling. The Company is awaiting the review and processing of these returns by the Arizona Department of Revenue and expects to receive the refunds upon completion of their review. The true-up amount was a $4,069 reduction to the 2015 provision for income taxes on the statement of operations.
UHG currently files income tax returns in the United States federal jurisdiction, various states, and foreign jurisdictions. The U.S. Internal Revenue Service (“IRS”) has completed exams on UHG’s consolidated income tax returns for fiscal years 2015 and prior. UHG’s 2016 tax return is under advance review by the IRS under its Compliance Assurance Program. With the exception of a few states, UHG is no longer subject to income tax examinations prior to 2010 in major state and foreign jurisdictions. The Company does not believe any adjustments that may result from these examinations will be material to the Company.
The Company has not included a reconciliation of the beginning and ending amount of unrecognized tax benefits as it does not have any uncertain tax positions as of December 31, 2016 or 2015.
Federal and state income taxes paid, net of refunds, was $53,769 and $30,683 in 2016 and 2015, respectively.

- 28 -
16. RETIREMENT PLANS, DEFERRED COMPENSATION, POSTEMPLOYMENT BENEFITS AND COMPENSATED ABSENCES, AND OTHER POSTRETIREMENT BENEFIT PLANS
The Company has no retirement plan, deferred compensation, and other benefit plans, since all personnel are employees of UHS, which provides services to the Company under the terms of a management agreement (see Note 9).
17. SUBSEQUENT EVENTS
In preparing these financial statements, management has evaluated and disclosed all material subsequent events up to April 27, 2017, the date that the draft financial statements were available to be issued.
On February 2, 2017, the Company paid $30,608, 90% of the projected final settlement, to Maricopa Integrated Health System to acquire Acute members under the terms of the Membership Transfer Agreement dated August 24, 2016, after receiving approval from AHCCCS on January 13, 2017. On March 3, 2017, the Company paid an additional $2,087, which is the final settlement amount based on actual membership.
There are no other events subsequent to December 31, 2016 that require disclosure.
* * * * * *

EXHIBIT I: SUPPLEMENTAL COMBINING STATEMENTS
(UNAUDITED)

ARIZONA PHYSICIANS IPA, INC.
SUPPLEMENTAL COMBINING BALANCE SHEETSAS OF DECEMBER 31, 2016 (UNAUDITED)(In thousands)
Acute DD CRS Medicare LTC Eliminations TotalASSETS
CURRENT ASSETS: Cash and cash equivalents 104,903$ - $ - $ - $ - $ - $ 104,903$ Short-term investments 3,762 - - - - - 3,762 Premiums receivable 43,901 2,334 6,092 43,644 3,554 - 99,525 AHCCCS reinsurance receivable 13,209 2,122 15,602 - 6,842 - 37,775 Other contract programs receivable - - - 12,241 449 - 12,690 Other receivables—net of allowances of $1,328 2,542 38 831 697 1,557 - 5,665 Related-party receivable—net - - - - - - - Investment receivables 2,115 - - - - - 2,115 Current state income taxes receivable 851 - - - - - 851 Current deferred taxes—net - - - - - - - Other assets 527 - 9 102 (173) - 465 Due from other lines of business - 15,379 2,338 30,360 64,944 (113,021) -
Total current assets 171,810 19,873 24,872 87,044 77,173 (113,021) 267,751
LONG-TERM ASSETS: Long-term investments 296,153 - - - - - 296,153 Other long-term assets 19,980 - - - - - 19,980 Long-term deferred income taxes—net 1,748 - - - - - 1,748
Total long-term assets 317,881 - - - - - 317,881
TOTAL 489,691$ 19,873$ 24,872$ 87,044$ 77,173$ (113,021)$ 585,632$
LIABILITIES AND STOCKHOLDER’S EQUITY
CURRENT LIABILITIES: Medical services payable 136,748$ 6,210$ 38,200$ 72,548$ 45,660$ - $ 299,366$ Medicaid risk sharing payable 100,180 - (26,614) - 2,599 - 76,165 Other payables to contract programs 15,089 - - - 240 - 15,329 Accounts payable and accrued expenses 6,404 164 633 1,029 728 - 8,958 Related-party payable—net 25,391 (131) (220) (19,469) (132) - 5,439 Current federal income taxes payable 5,062 - - - - - 5,062 Due to other lines of business 113,021 - - - - (113,021) -
Total current liabilities 401,895 6,243 11,999 54,108 49,095 (113,021) 410,319
LONG-TERM DEFERRED INCOME TAXES—Net - - - - - - -
Total liabilities 401,895 6,243 11,999 54,108 49,095 (113,021) 410,319
STOCKHOLDER’S EQUITY: Common stock, $0.01 par value—1,000,000 share authorized; two shares issued and outstanding - - - - - - - Additional paid-in capital 56,411 7,105 - - 14,000 - 77,516 Retained earnings 32,661 6,525 12,873 32,936 14,078 - 99,073 Accumulated other comprehensive income (1,276) - - - - - (1,276)
Total stockholder’s equity 87,796 13,630 12,873 32,936 28,078 - 175,313
TOTAL 489,691$ 19,873$ 24,872$ 87,044$ 77,173$ (113,021)$ 585,632$

ARIZONA PHYSICIANS IPA, INC.
SUPPLEMENTAL COMBINING STATEMENTS OF OPERATIONSAS OF DECEMBER 31, 2016 (UNAUDITED)(in thousands)
Acute DD CRS Medicare LTC Total
REVENUES: Capitation and risk-sharing settlements 1,405,304$ 90,505$ 256,117$ 582,793$ 363,061$ 2,697,780$ Delivery supplemental premium 59,283 - - - - 59,283 Investment income—net 10,125 - - - - 10,125
Total revenues 1,474,712 90,505 256,117 582,793 363,061 2,767,188
MEDICAL SERVICES EXPENSES: Hospital inpatient services 215,548 11,737 61,694 160,142 14,895 464,016 Medical compensation 348,050 13,812 88,847 116,206 12,701 579,616 Pharmacy 204,212 22,771 54,283 27,050 11,732 320,048 Outpatient facility 170,049 5,504 7,473 39,754 4,746 227,526 Emergency facility services 99,127 2,287 4,896 23,632 632 130,574 Nursing facility and home health care 41,633 9,495 2,091 31,292 25,095 109,606 Lab, x-ray, and medical imaging 50,527 941 2,064 16,856 987 71,375 Transportation 52,752 2,423 3,354 14,520 8,213 81,262 Dental 47,896 2,500 7,293 25,394 60 83,143 Other medical services 35,860 947 12,211 20,924 6,977 76,919 Durable medical equipment 15,582 10,903 16,459 13,944 3,477 60,365 Long-term care institutional - - - - 121,371 121,371 Long-term care home-based and community-based services - - - - 125,468 125,468 Recoveries from AHCCCS (29,106) (5,990) (22,524) - (9,633) (67,253)
Total medical services expenses 1,252,130 77,330 238,141 489,714 326,721 2,384,036
ADMINISTRATIVE EXPENSES 146,827 9,062 25,096 67,817 29,347 278,149
PREMIUM TAXES 30,137 - 5,581 - 7,461 43,179
Total expenses 1,429,094 86,392 268,818 557,531 363,529 2,705,364
INCOME (LOSS) BEFORE INCOME TAXES 45,618 4,113 (12,701) 25,262 (468) 61,824
PROVISION FOR INCOME TAXES 23,881 1,917 (3,019) 11,766 31 34,576
NET INCOME (LOSS) 21,737$ 2,196$ (9,682)$ 13,496$ (499)$ 27,248$