Embed Size (px)
Citation preview

COUNTRY PROFILE
ArgentinaOur quarterly Country Report on Argentina analyses currenttrends. This annual Country Profile provides backgroundpolitical and economic information.
1997-98The Economist Intelligence Unit15 Regent Street, London SW1Y 4LRUnited Kingdom
The Economist Intelligence Unit
The Economist Intelligence Unit is a specialist publisher serving companies establishing and managingoperations across national borders. For over 50 years it has been a source of information on businessdevelopments, economic and political trends, government regulations and corporate practice worldwide.
The EIU delivers its information in four ways: through subscription products ranging from newslettersto annual reference works; through specific research reports, whether for general release or for particularclients; through electronic publishing; and by organising conferences and roundtables. The firm is amember of The Economist Group.
London New York Hong KongThe Economist Intelligence Unit The Economist Intelligence Unit The Economist Intelligence Unit15 Regent Street The Economist Building 25/F, Dah Sing Financial CentreLondon 111 West 57th Street 108 Gloucester RoadSW1Y 4LR New York Wanchai United Kingdom NY 10019, US Hong KongTel: (44.171) 830 1000 Tel: (1.212) 554 0600 Tel: (852) 2802 7288Fax: (44.171) 499 9767 Fax: (1.212) 586 1181/2 Fax: (852) 2802 7638e-mail: [email protected] e-mail: [email protected] e-mail: [email protected]
Website: http://www.eiu.com
Electronic deliveryEIU ElectronicNew York: Lou Celi or Lisa Hennessey Tel: (1.212) 554 0600 Fax: (1.212) 586 0248London: Moya Veitch Tel: (44.171) 830 1007 Fax: (44.171) 830 1023
This publication is available on the following electronic and other media:
Online databases CD-ROM Microfilm
FT Profile (UK) Knight-Ridder Information World Microfilms Publications (UK)Tel: (44.171) 825 8000 Inc (US) Tel: (44.171) 266 2202
DIALOG (US) SilverPlatter (US) University Microfilms Inc (US)Tel: (1.415) 254 7000 Tel: (1.800) 521 0600
LEXIS-NEXIS (US)Tel: (1.800) 227 4908
M.A.I.D/Profound (UK)Tel: (44.171) 930 6900
Copyright© 1997 The Economist Intelligence Unit Limited. All rights reserved. Neither this publication nor any part of it may be reproduced, stored in a retrieval system, or transmitted in any form or by anymeans, electronic, mechanical, photocopying, recording or otherwise, without the prior permission of The Economist Intelligence Unit Limited.
All information in this report is verified to the best of the author’s and the publisher’s ability. However,the EIU does not accept responsibility for any loss arising from reliance on it.
Symbols for tables“n/a” means not available; “–” means not applicable
Printed and distributed by Redhouse Press Ltd, Unit 151, Dartford Trade Park, Dartford, Kent DA1 1QB, UK
ISSN 0269-4468

December 1st 1997 Contents
2 Basic data
3 Political background3 Historical background8 Constitution and institutions9 Political forces
11 International relations and defence
13 The economy13 Economic structure14 Economic policy17 Economic performance19 Regional trends
21 Resources21 Population23 Education25 Health26 Natural resources and the environment
28 Economic infrastructure28 Transport and communications32 Energy provision34 Financial services40 Other services
41 Production41 Manufacturing45 Mining and semi-processing46 Agriculture, forestry and fishing 49 Construction
50 The external sector50 Merchandise trade52 Invisibles and the current account53 Capital flows and foreign debt55 Foreign reserves and the exchange rate
56 Appendices56 Sources of information58 Reference tables
1
EIU Country Profile 1997-98 © The Economist Intelligence Unit Limited 1997
Argentina
Basic data
Land area 2,737,000 sq km
Population 32.61m (1991 census)
Main towns Population in ’000, 1991
Buenos Aires, federal capital 2,961(Greater Buenos Aires area) 10,911Córdoba 1,179Rosario 1,078Mendoza 122(Greater Mendoza area) 721La Plata 543Mar del Plata 534Tucumán 473Santa Fe 442Salta 374
Climate Varies from subtropical in the north to subarctic in the south
Weather in Buenos Aires(altitude 27 metres)
Hottest month, January, 17-29°C (average daily minimum and maximum);coldest month, June, 5-14°C; driest month, July, 56 mm average rainfall; wet-test month, March, 109 mm average rainfall
Language Spanish
Measures Metric system. Among other measures in use are: fanega=3.77 bushels quintal=100 kg
Currency The peso has been fixed at the rate Ps1:$1 since April 1991
Time 3 hours behind GMT
Public holidays January 1st; Good Friday; May 1st and 25th; June 10th and 20th;July 9th (Independence Day); August 17th; October 12th; December 8th and25th
2 Argentina: Basic data
EIU Country Profile 1997-98 © The Economist Intelligence Unit Limited 1997

Political background
The president is head of state and government. The present incumbent isCarlos Menem. There is a two-chamber parliament. Mr Menem’s party, thePartido Justicialista, lost in the lower house at the October 1997 election.
Historical background
A poor Spanish colony— Argentina was one of the poorest and most sparsely populated Spanish coloniesin America. Having neither gold nor silver, nor a climate suitable for raisingtropical crops, the role of the Argentinian economy was to provide inputs tothe Potosí silver mines in Upper Peru (now Bolivia). In 1777 the Spanish crowncreated the Río de la Plata viceroyalty to stop the westward expansion of thePortuguese rather than to establish a new economic centre.
Independence from Spain in 1816 was followed by decades of instability andcivil strife. The 1853 constitution, based on the US model, created modernArgentina. But there were ten more years of civil war before the rich provinceof Buenos Aires (which controlled the port) joined the union.
—became one of therichest countries in the
world
In the late 19th century innovations in transport and the conservation of foodsmade possible the exploitation of the fertile pampas, turning the country intoa supplier of grains and meat to Europe (particularly the UK). Liberal-mindedgovernments encouraged foreign investment and immigration. By the turn ofthe century Argentina was the tenth largest trading country in the world andthe sixth in terms of income per head. Almost 40% of its 6m inhabitants wereforeigners. UK investments were larger in Argentina than in Australia, Canadaor the US.
Throughout this time of growth the economy and society diversified. Theestablishment of secret and mandatory voting in 1912 paved the way for thevictory of the Unión Cívica Radical (UCR) in the 1916 election. The UCR,founded in 1890 to advance the interests of the rapidly growing middle classes,did not change the economic profile of the country in substance; foreign traderemained the engine of growth and the UK the closest partner.
The Great Depression The rapid economic growth and political pluralism was brought to an end bythe Great Depression of the 1930s. Falling agricultural prices and export vol-umes depressed the Argentinian economy. In 1930 the alleged ineffectivenessof the Radical government was the excuse for the first of what would turn outto be a long list of military interventions. By means of fraudulent electoralpractices, Conservatives returned to office in 1932 and stayed in power formore than a decade. Conservative governments attempted to overcome theeconomic crisis by means of a combination of preferential arrangements withthe UK, foreign-exchange controls and protection of domestic markets.
The emergence ofPeronism
The second world war reawakened demand for Argentinian exports. At thesame time, the influence in the army of a group of nationalist officers, amongthem Colonel Juan Domingo Perón, began to grow. In 1943 another military
Argentina: Historical background 3
EIU Country Profile 1997-98 © The Economist Intelligence Unit Limited 1997
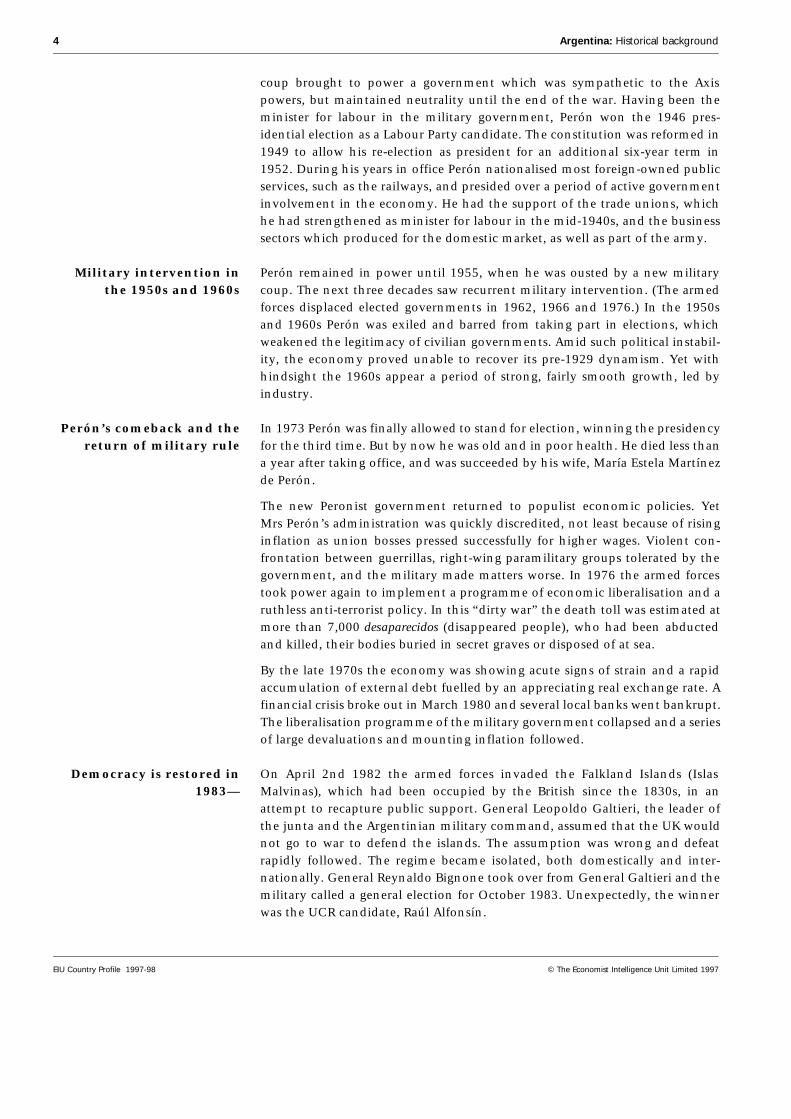
coup brought to power a government which was sympathetic to the Axispowers, but maintained neutrality until the end of the war. Having been theminister for labour in the military government, Perón won the 1946 pres-idential election as a Labour Party candidate. The constitution was reformed in1949 to allow his re-election as president for an additional six-year term in1952. During his years in office Perón nationalised most foreign-owned publicservices, such as the railways, and presided over a period of active governmentinvolvement in the economy. He had the support of the trade unions, whichhe had strengthened as minister for labour in the mid-1940s, and the businesssectors which produced for the domestic market, as well as part of the army.
Military intervention inthe 1950s and 1960s
Perón remained in power until 1955, when he was ousted by a new militarycoup. The next three decades saw recurrent military intervention. (The armedforces displaced elected governments in 1962, 1966 and 1976.) In the 1950sand 1960s Perón was exiled and barred from taking part in elections, whichweakened the legitimacy of civilian governments. Amid such political instabil-ity, the economy proved unable to recover its pre-1929 dynamism. Yet withhindsight the 1960s appear a period of strong, fairly smooth growth, led byindustry.
Perón’s comeback and thereturn of military rule
In 1973 Perón was finally allowed to stand for election, winning the presidencyfor the third time. But by now he was old and in poor health. He died less thana year after taking office, and was succeeded by his wife, María Estela Martínezde Perón.
The new Peronist government returned to populist economic policies. YetMrs Perón’s administration was quickly discredited, not least because of risinginflation as union bosses pressed successfully for higher wages. Violent con-frontation between guerrillas, right-wing paramilitary groups tolerated by thegovernment, and the military made matters worse. In 1976 the armed forcestook power again to implement a programme of economic liberalisation and aruthless anti-terrorist policy. In this “dirty war” the death toll was estimated atmore than 7,000 desaparecidos (disappeared people), who had been abductedand killed, their bodies buried in secret graves or disposed of at sea.
By the late 1970s the economy was showing acute signs of strain and a rapidaccumulation of external debt fuelled by an appreciating real exchange rate. Afinancial crisis broke out in March 1980 and several local banks went bankrupt.The liberalisation programme of the military government collapsed and a seriesof large devaluations and mounting inflation followed.
Democracy is restored in1983—
On April 2nd 1982 the armed forces invaded the Falkland Islands (IslasMalvinas), which had been occupied by the British since the 1830s, in anattempt to recapture public support. General Leopoldo Galtieri, the leader ofthe junta and the Argentinian military command, assumed that the UK wouldnot go to war to defend the islands. The assumption was wrong and defeatrapidly followed. The regime became isolated, both domestically and inter-nationally. General Reynaldo Bignone took over from General Galtieri and themilitary called a general election for October 1983. Unexpectedly, the winnerwas the UCR candidate, Raúl Alfonsín.
4 Argentina: Historical background
EIU Country Profile 1997-98 © The Economist Intelligence Unit Limited 1997
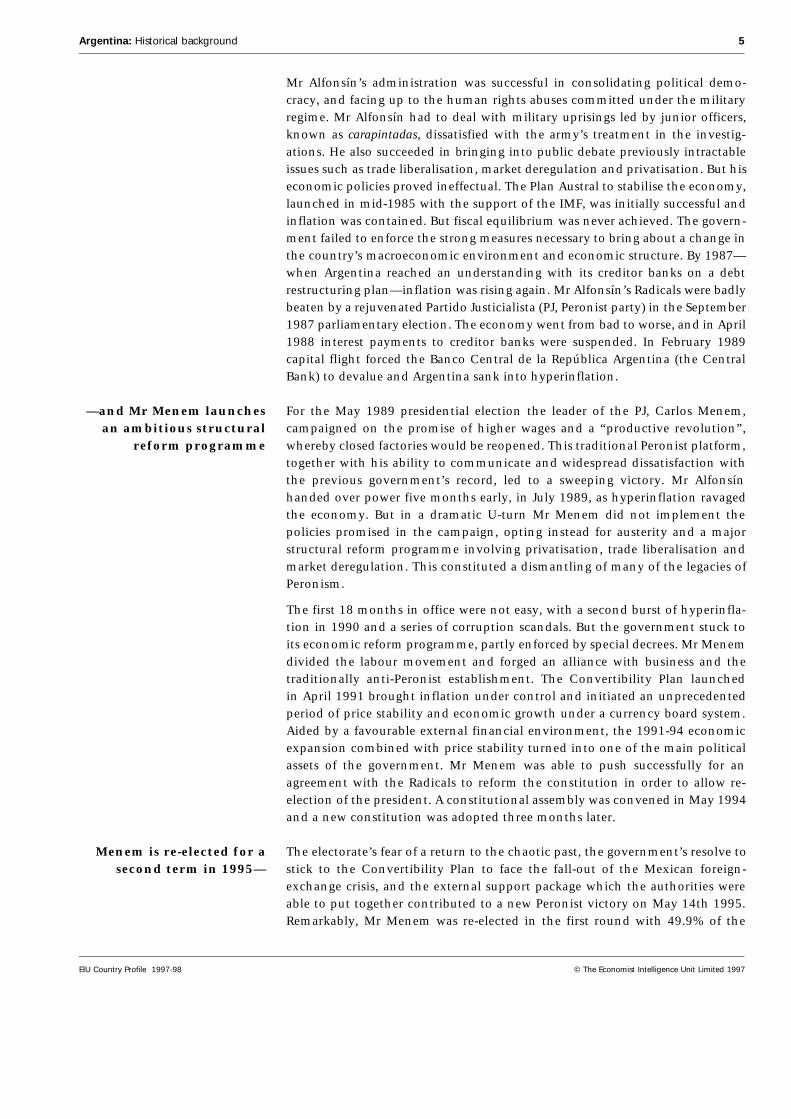
Mr Alfonsín’s administration was successful in consolidating political demo-cracy, and facing up to the human rights abuses committed under the militaryregime. Mr Alfonsín had to deal with military uprisings led by junior officers,known as carapintadas, dissatisfied with the army’s treatment in the investig-ations. He also succeeded in bringing into public debate previously intractableissues such as trade liberalisation, market deregulation and privatisation. But hiseconomic policies proved ineffectual. The Plan Austral to stabilise the economy,launched in mid-1985 with the support of the IMF, was initially successful andinflation was contained. But fiscal equilibrium was never achieved. The govern-ment failed to enforce the strong measures necessary to bring about a change inthe country’s macroeconomic environment and economic structure. By 1987—when Argentina reached an understanding with its creditor banks on a debtrestructuring plan—inflation was rising again. Mr Alfonsín’s Radicals were badlybeaten by a rejuvenated Partido Justicialista (PJ, Peronist party) in the September1987 parliamentary election. The economy went from bad to worse, and in April1988 interest payments to creditor banks were suspended. In February 1989capital flight forced the Banco Central de la República Argentina (the CentralBank) to devalue and Argentina sank into hyperinflation.
—and Mr Menem launchesan ambitious structural
reform programme
For the May 1989 presidential election the leader of the PJ, Carlos Menem,campaigned on the promise of higher wages and a “productive revolution”,whereby closed factories would be reopened. This traditional Peronist platform,together with his ability to communicate and widespread dissatisfaction withthe previous government’s record, led to a sweeping victory. Mr Alfonsínhanded over power five months early, in July 1989, as hyperinflation ravagedthe economy. But in a dramatic U-turn Mr Menem did not implement thepolicies promised in the campaign, opting instead for austerity and a majorstructural reform programme involving privatisation, trade liberalisation andmarket deregulation. This constituted a dismantling of many of the legacies ofPeronism.
The first 18 months in office were not easy, with a second burst of hyperinfla-tion in 1990 and a series of corruption scandals. But the government stuck toits economic reform programme, partly enforced by special decrees. Mr Menemdivided the labour movement and forged an alliance with business and thetraditionally anti-Peronist establishment. The Convertibility Plan launchedin April 1991 brought inflation under control and initiated an unprecedentedperiod of price stability and economic growth under a currency board system.Aided by a favourable external financial environment, the 1991-94 economicexpansion combined with price stability turned into one of the main politicalassets of the government. Mr Menem was able to push successfully for anagreement with the Radicals to reform the constitution in order to allow re-election of the president. A constitutional assembly was convened in May 1994and a new constitution was adopted three months later.
Menem is re-elected for asecond term in 1995—
The electorate’s fear of a return to the chaotic past, the government’s resolve tostick to the Convertibility Plan to face the fall-out of the Mexican foreign-exchange crisis, and the external support package which the authorities wereable to put together contributed to a new Peronist victory on May 14th 1995.Remarkably, Mr Menem was re-elected in the first round with 49.9% of the
Argentina: Historical background 5
EIU Country Profile 1997-98 © The Economist Intelligence Unit Limited 1997

vote, followed by the centre-left coalition, Frente del País Solidario (Frepaso),with 30%. The UCR’s performance, with only 17% of the vote, was the worst inthe party’s history. Mr Menem’s sweeping victory also provided him with amajority in both houses of Congress.
Main political figures
Carlos Saúl Menem: The president of Argentina and head of the Peronist party.Re-elected for an additional four-year period in 1995. His second term wasinaugurated under the influence of the Mexican peso crisis and has been marred byhigh unemployment. Mr Menem’s authority is being challenged by contenders forthe 1999 Peronist presidential nomination. Eduardo Duhalde: Governor of Buenos Aires province, the largest electoral districtand a Peronist stronghold. He has considerable electoral support in his district andwas the most likely Peronist candidate for the 1999 election, but lost ground whenhis wife lost to the Alianza por el Trabajo, la Justicia y la Producción in the October1997 congressional election. Influential within the party structures and with stronglinks with traditional Peronist interest groups, he will have to cultivate theestablishment to win the presidency.Roque Fernández: A professional economist and former Central Bank presidenteducated in the University of Chicago tradition. He became economy minister whenDomingo Cavallo was ousted in mid-1996, amid great concern over the future of theeconomy. Yet he successfully managed to steer the economy on to a positive growthpath.Domingo Cavallo: Former economy minister and architect of the ConvertibilityPlan. He was ousted by Mr Menem in 1996 and has since increased his allegations ofcorruption within the administration. He won a congressional seat in the October1997 election, from where he plans to rebuild his political career.Raúl Alfonsín: Former president and leader of a Unión Cívica Radical (UCR) faction.His authority within the party has been challenged and his popularity with theelectorate has declined, but his political ambitions remain strong. He is credited withworking behind the scenes to enable the creation of the Alianza.Fernando de la Rúa: Mayor of the city of Buenos Aires, former senator andlong-standing member of the UCR. He was opposed to the Pacto de Olivos, theagreement in which the UCR supported the constitutional amendment allowingMr Menem to stand for re-election in 1995. He is a strong candidate for the 1999Alianza presidential candidacy.Carlos Alvarez: A deputy, he is one of the prominent figures of the centre-leftcoalition, Frente del País Solidario (Frepaso), and the new Alianza. Formerly aPeronist, he will remain one of the most visible opposition leaders and may competewith Graciela Fernández Meijide as the (Frepaso) choice for the Alianza nominationin the 1999 election.Graciela Fernández Meijide: former Frepaso senator for Buenos Aires. Shesuccessfully ran for a congressional seat for Buenos Aires province in the October1997 election to enhance the Alianza’s electoral chances in the district. She is astrong contender for the Alianza nomination in 1999.
—which is plagued bysocial and political
problems
Despite Mr Menem’s strong mandate in the national ballots, his government’ssecond term has faced several problems. The most significant have been highunemployment rates and an early struggle for his own succession in 1999.Unprecedentedly high unemployment rates led to the first successful general
6 Argentina: Historical background
EIU Country Profile 1997-98 © The Economist Intelligence Unit Limited 1997
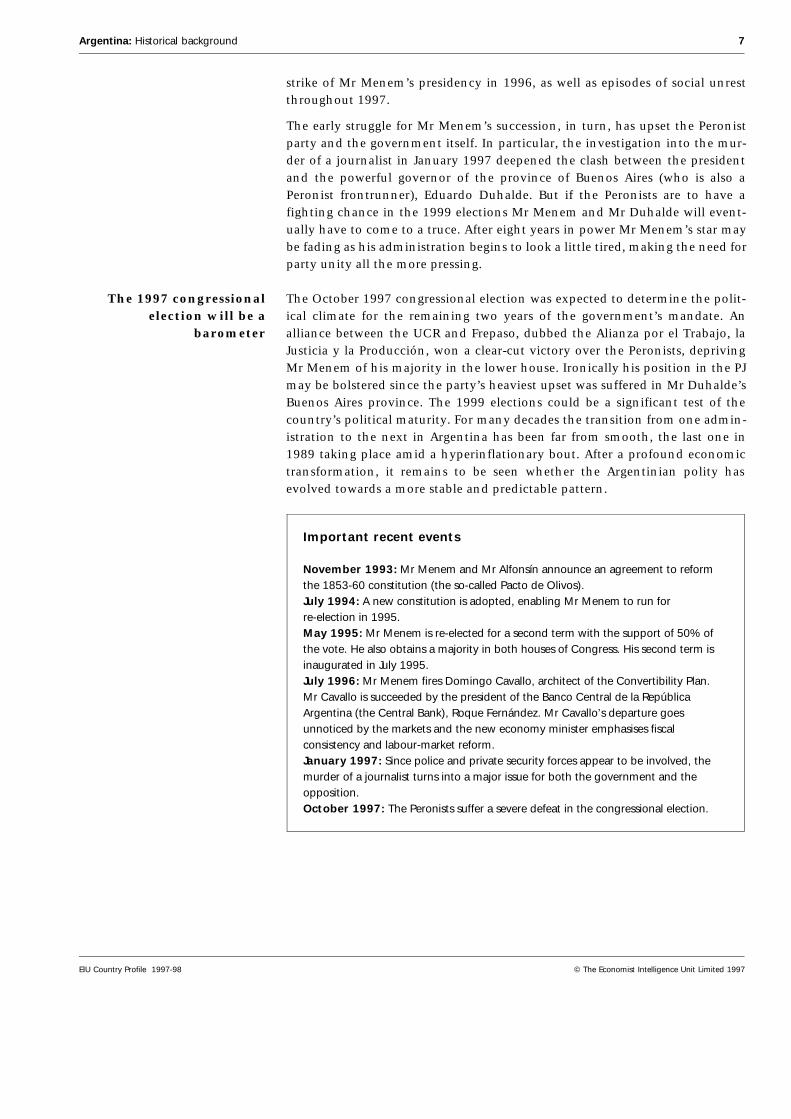
strike of Mr Menem’s presidency in 1996, as well as episodes of social unrestthroughout 1997.
The early struggle for Mr Menem’s succession, in turn, has upset the Peronistparty and the government itself. In particular, the investigation into the mur-der of a journalist in January 1997 deepened the clash between the presidentand the powerful governor of the province of Buenos Aires (who is also aPeronist frontrunner), Eduardo Duhalde. But if the Peronists are to have afighting chance in the 1999 elections Mr Menem and Mr Duhalde will event-ually have to come to a truce. After eight years in power Mr Menem’s star maybe fading as his administration begins to look a little tired, making the need forparty unity all the more pressing.
The 1997 congressionalelection will be a
barometer
The October 1997 congressional election was expected to determine the polit-ical climate for the remaining two years of the government’s mandate. Analliance between the UCR and Frepaso, dubbed the Alianza por el Trabajo, laJusticia y la Producción, won a clear-cut victory over the Peronists, deprivingMr Menem of his majority in the lower house. Ironically his position in the PJmay be bolstered since the party’s heaviest upset was suffered in Mr Duhalde’sBuenos Aires province. The 1999 elections could be a significant test of thecountry’s political maturity. For many decades the transition from one admin-istration to the next in Argentina has been far from smooth, the last one in1989 taking place amid a hyperinflationary bout. After a profound economictransformation, it remains to be seen whether the Argentinian polity hasevolved towards a more stable and predictable pattern.
Important recent events
November 1993: Mr Menem and Mr Alfonsín announce an agreement to reformthe 1853-60 constitution (the so-called Pacto de Olivos).July 1994: A new constitution is adopted, enabling Mr Menem to run forre-election in 1995.May 1995: Mr Menem is re-elected for a second term with the support of 50% ofthe vote. He also obtains a majority in both houses of Congress. His second term isinaugurated in July 1995.July 1996: Mr Menem fires Domingo Cavallo, architect of the Convertibility Plan.Mr Cavallo is succeeded by the president of the Banco Central de la RepúblicaArgentina (the Central Bank), Roque Fernández. Mr Cavallo’s departure goesunnoticed by the markets and the new economy minister emphasises fiscalconsistency and labour-market reform. January 1997: Since police and private security forces appear to be involved, themurder of a journalist turns into a major issue for both the government and theopposition.October 1997: The Peronists suffer a severe defeat in the congressional election.
Argentina: Historical background 7
EIU Country Profile 1997-98 © The Economist Intelligence Unit Limited 1997
Constitution and institutions
A strong presidentialtradition
Argentina is a federal republic with a strong presidential tradition. The pres-ident appoints a cabinet chief, a secretary-general of the presidency and eightministers. The 1994 constitutional reform established the upgrading of foursecretaries (of culture, social development, sports and tourism, and naturalresources and the environment) to ministerial level, but the decision has so farfailed to be implemented.
The cabinet chief, a post created with the intention of moderating presidentialpower, is in charge of the general administration of the country and can beremoved by a majority vote of both houses of Congress. In practice, the cabinetchief’s effectiveness as an administrator and moderator has proved modest andheavily dependent upon both personalities and the president’s willingness todelegate powers.
The new constitution also established a four-year presidential term with only asingle re-election allowed, two-round direct elections for the presidency (nosecond round is needed if the winner receives more than 45% of the vote, or atleast 40% with a 10-percentage-point lead over the second-placed candidate)and prohibited presidential emergency decrees on tax, criminal law or electoralissues. As established by the 1994 constitutional reform, in 1996 the federaldistrict was made autonomous and its mayor directly electable by the city’sresidents. The federal district is currently run by the UCR.
Traditionally, the Ministry of the Economy has wielded vast powers within thecabinet. This is unlikely to change with the creation of the post of cabinetchief, but much will depend on personalities. Pressure has been mounting tosplit the Ministry of the Economy into two ministries (treasury and economy).To what extent the post of cabinet chief will change the balance of powerbetween the executive and Congress also remains to be seen. So far, the officialmajority in both houses has prevented the opposition from succeeding inremoving the cabinet chief.
The head of the National Audit Bureau is designated by the opposition andreports to Congress.
Congress Congress is bicameral, with a 257-member Chamber of Deputies and a72-member Senate. Deputies are directly elected for four-year periods and half ofthem stand for re-election every two years. Senators, who represent the 23 pro-vincial states and the autonomous federal district, are elected for six-year terms.
In the lower house the Peronists lost their majority in the October 1997 con-gressional election. They hold 118 seats while the Alianza holds 110 and otherminority groups (mainly provincial parties) hold 29. In the Senate thePeronists hold 39 seats, the Radicals 21 and other minority parties 12. Relationsbetween Congress and the executive will be tested by the Peronists’ minorityposition in the lower house.
A weak judiciary After the trial and condemnation of the military juntas, the judiciary’s prestigereached a peak. But in recent years its image has deteriorated. There are long-standing infrastructural and organisational problems but, more importantly,
8 Argentina: Constitution and institutions
EIU Country Profile 1997-98 © The Economist Intelligence Unit Limited 1997
the government has intervened too often in judicial issues. In 1989 Mr Menemraised the number of Supreme Court members to alter the court’s politicalbalance. Congress has appointed judges with dubious experience or compe-tence and several have been removed as a result of allegations of corruption.Although there is a judicial reform under way (including the use of oral pro-ceedings to speed up trials), progress has been slow.
The new constitution established the appointment of judges by a council ofjurists and created a judges’ jury which is responsible for removing judges. Butso far the government and the opposition have failed to agree on the council’scomposition. The required legislation needs a special congressional majoritywhich the government has been unable to reach.
The need for an effective and independent judiciary has been highlighted byseveral highly publicised corruption scandals involving government officialsand foreign and domestic corporations. Public opinion is in favour of astronger fight against corruption and a more decisive promotion of the rule oflaw and calls for this have also been made by influential international organis-ations, such as the IMF. Although Congress has reached agreement on a bill topromote ethics in the public service, there is a shared consensus that Argentinaneeds more decisive action to fight corruption and poor enforcement of law.The murder of a journalist in January 1997 brought the issue to the forefront ofthe national debate and contributed to the opposition’s victory in October’scongressional election.
Political forces
A two-party politicalsystem—
Traditionally, the Argentinian political system has been bipartisan, the twomain political organisations being the Partido Justicialista (PJ, Peronist Party)and the Unión Cívica Radical (UCR). Yet the emergence of the centre-leftcoalition Frente del País Solidario (Frepaso) as a significant actor in nationalelections has altered this balance.
The stronghold of the Peronists has been the low- and middle-income sectors.Linked to the formerly powerful trade unions, the Peronists were regarded asunbeatable in free elections. But Mr Menem transformed the PJ into a party ofprivatisation, trade liberalisation and deregulation—the opposite of the poli-cies espoused by Perón himself. Mr Menem justified this on the grounds thattimes had changed and that the doctrine of the party should be updated. Buthis U-turn, warmly supported by business and financial elites, has not beenaccepted happily by either the party or the trade unions.
The internal competition for Mr Menem’s succession in the context of un-precedented unemployment rates and a worsening distribution of income hasfuelled this debate. While sharing a conviction that a return to the past is outof the question, the frontrunner for the 1999 Peronist nomination,Mr Duhalde, would like to see a stronger emphasis on social and industrialpolicies. Yet Mr Duhalde still has to win the support and the trust of theeconomic “establishment”. Peronism seems to be at a crossroads, with thechoice and performance of Mr Menem’s successor indicative of its futurecourse.
Argentina: Political forces 9
EIU Country Profile 1997-98 © The Economist Intelligence Unit Limited 1997
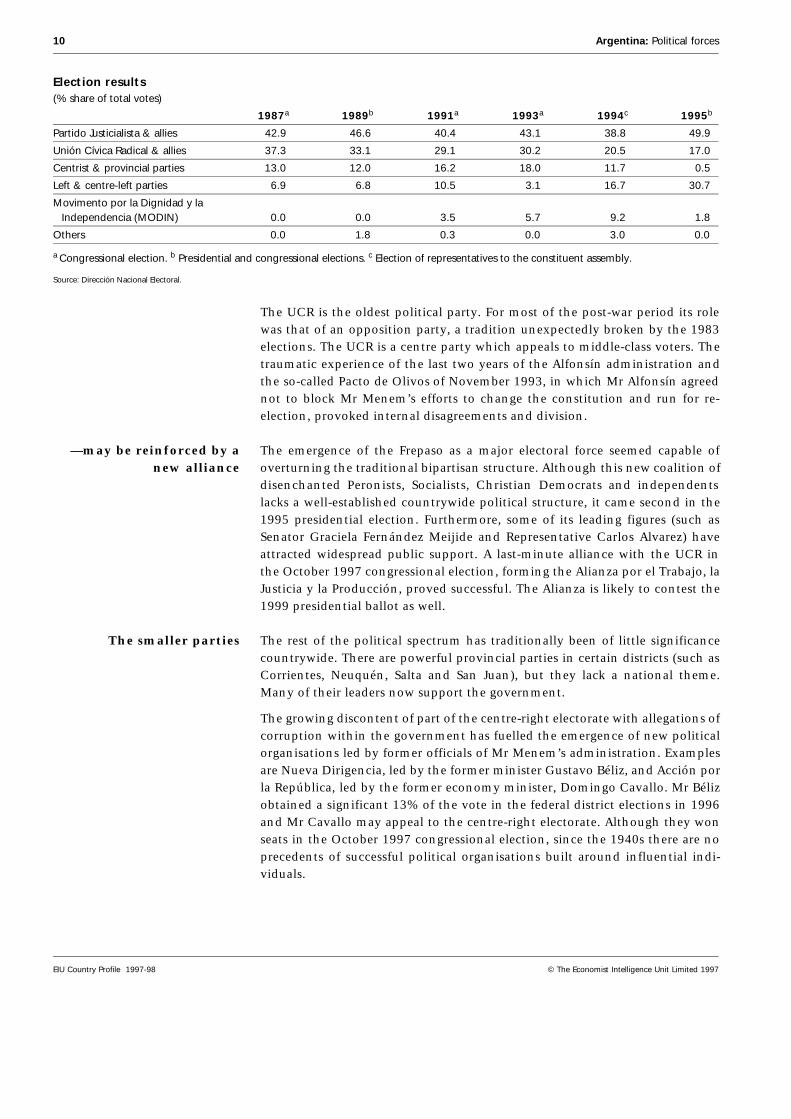
Election results(% share of total votes)
1987a 1989b 1991a 1993a 1994c 1995b
Partido Justicialista & allies 42.9 46.6 40.4 43.1 38.8 49.9
Unión Cívica Radical & allies 37.3 33.1 29.1 30.2 20.5 17.0
Centrist & provincial parties 13.0 12.0 16.2 18.0 11.7 0.5
Left & centre-left parties 6.9 6.8 10.5 3.1 16.7 30.7
Movimento por la Dignidad y la Independencia (MODIN) 0.0 0.0 3.5 5.7 9.2 1.8
Others 0.0 1.8 0.3 0.0 3.0 0.0
a Congressional election. b Presidential and congressional elections. c Election of representatives to the constituent assembly.
Source: Dirección Nacional Electoral.
The UCR is the oldest political party. For most of the post-war period its rolewas that of an opposition party, a tradition unexpectedly broken by the 1983elections. The UCR is a centre party which appeals to middle-class voters. Thetraumatic experience of the last two years of the Alfonsín administration andthe so-called Pacto de Olivos of November 1993, in which Mr Alfonsín agreednot to block Mr Menem’s efforts to change the constitution and run for re-election, provoked internal disagreements and division.
—may be reinforced by anew alliance
The emergence of the Frepaso as a major electoral force seemed capable ofoverturning the traditional bipartisan structure. Although this new coalition ofdisenchanted Peronists, Socialists, Christian Democrats and independentslacks a well-established countrywide political structure, it came second in the1995 presidential election. Furthermore, some of its leading figures (such asSenator Graciela Fernández Meijide and Representative Carlos Alvarez) haveattracted widespread public support. A last-minute alliance with the UCR inthe October 1997 congressional election, forming the Alianza por el Trabajo, laJusticia y la Producción, proved successful. The Alianza is likely to contest the1999 presidential ballot as well.
The smaller parties The rest of the political spectrum has traditionally been of little significancecountrywide. There are powerful provincial parties in certain districts (such asCorrientes, Neuquén, Salta and San Juan), but they lack a national theme.Many of their leaders now support the government.
The growing discontent of part of the centre-right electorate with allegations ofcorruption within the government has fuelled the emergence of new politicalorganisations led by former officials of Mr Menem’s administration. Examplesare Nueva Dirigencia, led by the former minister Gustavo Béliz, and Acción porla República, led by the former economy minister, Domingo Cavallo. Mr Bélizobtained a significant 13% of the vote in the federal district elections in 1996and Mr Cavallo may appeal to the centre-right electorate. Although they wonseats in the October 1997 congressional election, since the 1940s there are noprecedents of successful political organisations built around influential indi-viduals.
10 Argentina: Political forces
EIU Country Profile 1997-98 © The Economist Intelligence Unit Limited 1997
International relations and defence
The South Atlantic war:mending the damage done
The Alfonsín and Menem governments had a hard job trying to repair thedamage done to Argentina’s international reputation by the invasion of theFalkland Islands (Islas Malvinas). Although relations with developed countriesimproved markedly during the Alfonsín government, a number of difficultissues remained unresolved, such as the ratification of the Tlatelolco Treaty—which bars nuclear weapons from Latin America and the Caribbean—and there-establishment of diplomatic relations with the UK.
To reinforce his economic reform programme, Mr Menem decided to settle allpolitical disputes with industrial countries, particularly the US and the UK. TheMenem administration abandoned the Non-Aligned Movement and movedcloser to the US. Mr Menem supported UN intervention in Iraq, Bosnia andHaiti, even sending troops to participate in the operations. The governmentalso dismantled the Cóndor missile programme—which had been heavily criti-cised by the US administration—ratified the Tlatelolco document and pro-posed that the administration of the US president, Bill Clinton, upgradeArgentina to the category of an “extra-NATO” ally of the US. Mr Menem alsobecame one of the most vociferous critics of the Cuban president, Fidel Castro.
Similarly, relations with the UK were normalised and the Falklands sovereigntyissue set aside. The government has not renounced Argentinian claims to theislands, but has renounced the use of force to retrieve them. Following a policyof “charm diplomacy”, it has considered giving financial compensation to theislanders to settle the issue. In 1995 after months of negotiations theArgentinian and UK governments signed an agreement to share the potentialeconomic benefits from oil exploration in a specially designated area in theSouth Atlantic.
Improving relations withneighbouring countries
One area in which the Alfonsín and Menem administrations have been consis-tent is in their approach to neighbouring countries. Relations with Argentina’stwo largest neighbours—Brazil and Chile—had traditionally been poor. Brazilwas generally regarded as a threat to Argentinian supremacy in the region,while long-standing border disputes with Chile frequently inflamedArgentinian nationalism. Mr Alfonsín radically changed the approach. In 1985he and the then Brazilian president, José Sarney, launched a bilateral economicco-operation programme, to be followed in 1991 by the Treaty of Asunciónlaunching Mercado Común del Sur (Mercosur), the common market of thesouth. Yet co-operation with Brazil went far beyond economic issues. TheArgentinian and Brazilian governments have developed a foreign policy con-sultation mechanism, agreed on the mutual inspection of nuclear facilities andlaunched a military co-operation programme.
Argentina and Chile almost went to war in 1978 over three islands in theBeagle Channel. In 1984 the UCR government put a solution reached byarbitration (which did not favour Argentinian claims) to a plebiscite whichreceived majority support. Likewise, Mr Menem closed all pending territorialdisputes with Chile when he signed a Tratado de Paz y Amistad (Treaty of Peaceand Friendship). As a result, the Laguna del Desierto border dispute was re-solved by arbitration in 1994. Yet the agreement reached by the two
Argentina: International relations and defence 11
EIU Country Profile 1997-98 © The Economist Intelligence Unit Limited 1997

governments over the division of the continental glaciers area has so far failedto obtain legislative approval in either of the countries. If the agreement fails tobe passed by their respective legislatures the issue will have to be put before anarbitration panel. Mr Menem is keen to solve the issue before 1999 in order toconclude his term as the president who brought to an end all pending territo-rial disputes with Chile.
The establishment of Mercosur is a key part of this policy of regional economicand political co-operation. Mercosur is a customs union comprising Argentina,Brazil, Paraguay and Uruguay, and it has so far signed free-trade agreements(FTAs) with Chile (June 1996) and Bolivia (December 1996). Negotiations ofother FTAs with the Andean community (Colombia, Ecuador and Venezuela)and Peru are currently under way, following the pattern set by the Mercosur-Chile FTA. Mercosur (and unilateral trade liberalisation) has presided over aperiod of rapid growth of intra-regional trade and, to a lesser extent, invest-ment flows.
Finding a new role for thearmed forces
Improved relations with Brazil and Chile have had a major impact on the role ofArgentinian armed forces, as two traditional perceived threats to national secu-rity have almost disappeared. This development added to the military’s identitycrisis, originally brought about by the Falklands fiasco and the “dirty war”revelations. Once one of the largest and proudest armed forces in Latin America,the Argentinian military lost both influence and prestige in the 1980s. Morerecently, military spending has been trimmed because of fiscal constraints. Asthe carapintadas’ (junior officers’) uprisings were brought to an end in 1990 andthe armed forces were purged of anti-democratic elements, the challenge was tofind a new role for the military. Participation in UN peacekeeping operationswas instrumental in reincorporating a heavily criticised and demoralised mili-tary into social life. Yet professionalisation has advanced slowly, the last stepbeing the replacement of conscription with voluntary service.
The government and Congress are working on new legislation to restructurethe national defence system. The aim is to downsize the military and upgradeits abilities. In the process it may lose some of its traditional privileges, such asspecial social security and retirement regimes. Yet so far few details of thereform have been agreed or made public. The more expeditious privatisation ofthe remaining arms industries announced after the scandals of illegal armssales to Ecuador and Bosnia has also failed to materialise.
The Southern Cone countries’ armed forces compared
Argentina Brazil Chile
Land area (’000 sq km) 2,950 8,511 757
Population (m) 33.5 158.0 14.0
Total armed forces personnel (no.) 72,300 294,000 95,000 Army 40,000 195,000 56,000 Navy 19,000 50,000 25,000 Air force 13,300 49,000 14,000Source: EIU.
12 Argentina: International relations and defence
EIU Country Profile 1997-98 © The Economist Intelligence Unit Limited 1997
The economy
Economic structure
Main economic indicators, 1996
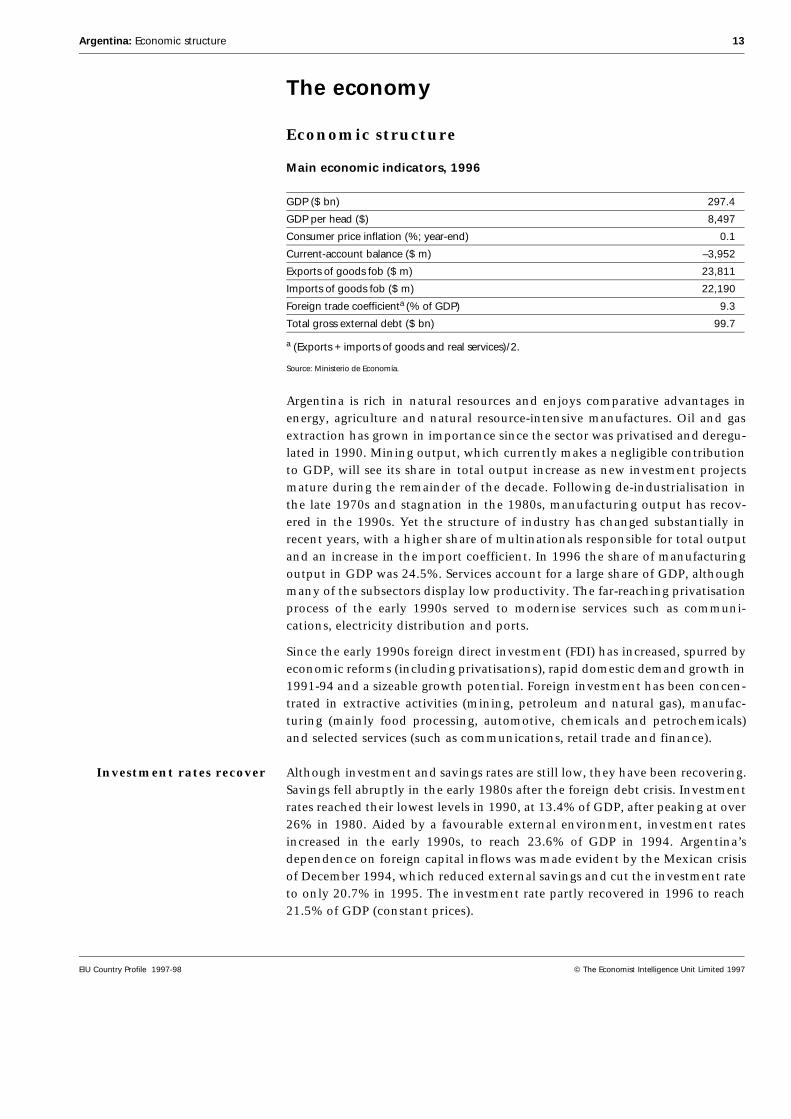
GDP ($ bn) 297.4
GDP per head ($) 8,497
Consumer price inflation (%; year-end) 0.1
Current-account balance ($ m) –3,952
Exports of goods fob ($ m) 23,811
Imports of goods fob ($ m) 22,190
Foreign trade coefficienta (% of GDP) 9.3
Total gross external debt ($ bn) 99.7
a (Exports + imports of goods and real services)/2.
Source: Ministerio de Economía.
Argentina is rich in natural resources and enjoys comparative advantages inenergy, agriculture and natural resource-intensive manufactures. Oil and gasextraction has grown in importance since the sector was privatised and deregu-lated in 1990. Mining output, which currently makes a negligible contributionto GDP, will see its share in total output increase as new investment projectsmature during the remainder of the decade. Following de-industrialisation inthe late 1970s and stagnation in the 1980s, manufacturing output has recov-ered in the 1990s. Yet the structure of industry has changed substantially inrecent years, with a higher share of multinationals responsible for total outputand an increase in the import coefficient. In 1996 the share of manufacturingoutput in GDP was 24.5%. Services account for a large share of GDP, althoughmany of the subsectors display low productivity. The far-reaching privatisationprocess of the early 1990s served to modernise services such as communi-cations, electricity distribution and ports.
Since the early 1990s foreign direct investment (FDI) has increased, spurred byeconomic reforms (including privatisations), rapid domestic demand growth in1991-94 and a sizeable growth potential. Foreign investment has been concen-trated in extractive activities (mining, petroleum and natural gas), manufac-turing (mainly food processing, automotive, chemicals and petrochemicals)and selected services (such as communications, retail trade and finance).
Investment rates recover Although investment and savings rates are still low, they have been recovering.Savings fell abruptly in the early 1980s after the foreign debt crisis. Investmentrates reached their lowest levels in 1990, at 13.4% of GDP, after peaking at over26% in 1980. Aided by a favourable external environment, investment ratesincreased in the early 1990s, to reach 23.6% of GDP in 1994. Argentina’sdependence on foreign capital inflows was made evident by the Mexican crisisof December 1994, which reduced external savings and cut the investment rateto only 20.7% in 1995. The investment rate partly recovered in 1996 to reach21.5% of GDP (constant prices).
Argentina: Economic structure 13
EIU Country Profile 1997-98 © The Economist Intelligence Unit Limited 1997
Total foreign trade in goods and real services represented only 15.8% of GDP(constant prices) in 1996. Although Argentina is a relatively large economywith a significant endowment of natural resources, this figure is still low. Yet inrecent years it has increased to double the levels recorded in the mid-1980s.
Economic activity is unevenly distributed. Less than one-fifth of the continen-tal area—the federal district and Buenos Aires, Córdoba and Santa Fe prov-inces—holds 64% of the population and contributes 80% of industrialproduction and 92% of total agricultural output. The north-western and north-eastern provinces are heavily dependent on agriculture and public-sectoremployment. In the south, sparsely populated Patagonia is the source of a largeshare of Argentina’s oil and natural gas production.
Comparative economic indicators, 1996
Argentina Brazil Mexico Venezuela US
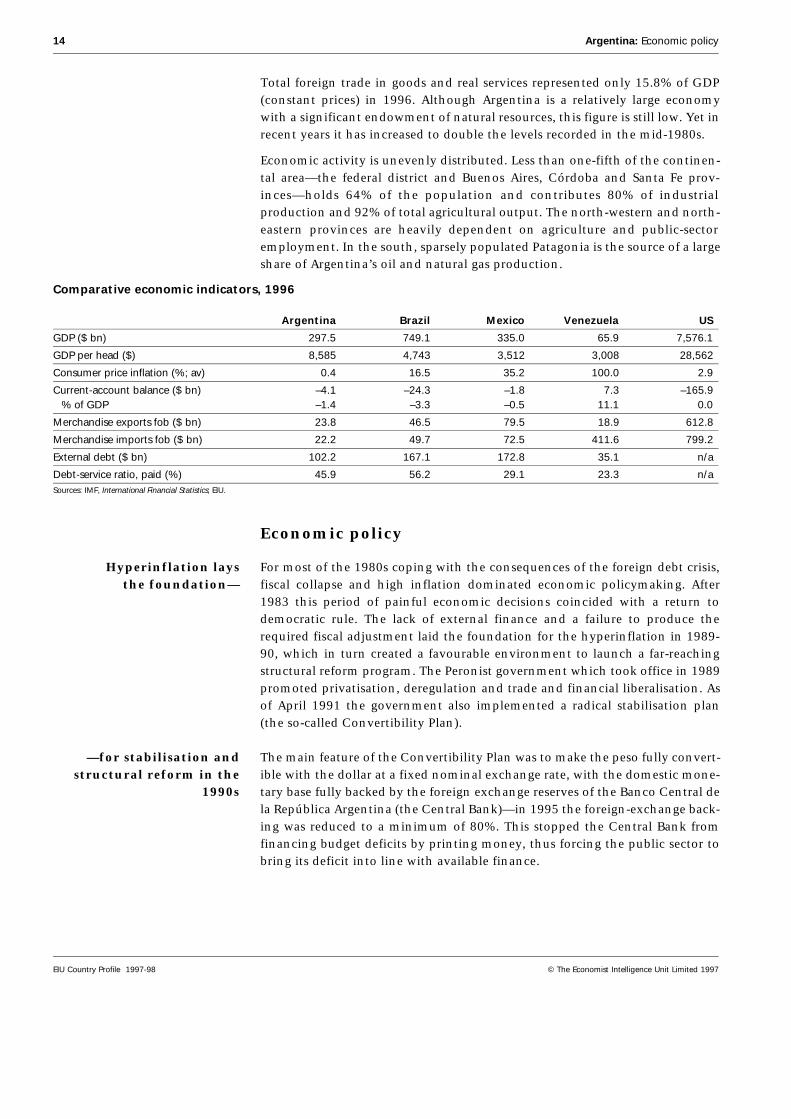
GDP ($ bn) 297.5 749.1 335.0 65.9 7,576.1
GDP per head ($) 8,585 4,743 3,512 3,008 28,562
Consumer price inflation (%; av) 0.4 16.5 35.2 100.0 2.9
Current-account balance ($ bn) –4.1 –24.3 –1.8 7.3 –165.9 % of GDP –1.4 –3.3 –0.5 11.1 0.0
Merchandise exports fob ($ bn) 23.8 46.5 79.5 18.9 612.8
Merchandise imports fob ($ bn) 22.2 49.7 72.5 411.6 799.2
External debt ($ bn) 102.2 167.1 172.8 35.1 n/a
Debt-service ratio, paid (%) 45.9 56.2 29.1 23.3 n/aSources: IMF, International Financial Statistics; EIU.
Economic policy
Hyperinflation laysthe foundation—
For most of the 1980s coping with the consequences of the foreign debt crisis,fiscal collapse and high inflation dominated economic policymaking. After1983 this period of painful economic decisions coincided with a return todemocratic rule. The lack of external finance and a failure to produce therequired fiscal adjustment laid the foundation for the hyperinflation in 1989-90, which in turn created a favourable environment to launch a far-reachingstructural reform program. The Peronist government which took office in 1989promoted privatisation, deregulation and trade and financial liberalisation. Asof April 1991 the government also implemented a radical stabilisation plan(the so-called Convertibility Plan).
—for stabilisation andstructural reform in the
1990s
The main feature of the Convertibility Plan was to make the peso fully convert-ible with the dollar at a fixed nominal exchange rate, with the domestic mone-tary base fully backed by the foreign exchange reserves of the Banco Central dela República Argentina (the Central Bank)—in 1995 the foreign-exchange back-ing was reduced to a minimum of 80%. This stopped the Central Bank fromfinancing budget deficits by printing money, thus forcing the public sector tobring its deficit into line with available finance.
14 Argentina: Economic policy
EIU Country Profile 1997-98 © The Economist Intelligence Unit Limited 1997

Important recent economic policy events
1991: The Convertibility Law fixes the Ps:$ exchange rate and declares fullconvertibility of the domestic currency. The monetary base is to be fully backed byinternational reserves.1992: Congress approves a new Central Bank charter establishing the independenceof monetary authorities.1993: The government agrees a debt-reduction package with commercial banks.Liabilities with commercial banks are exchanged for collateralised bonds.1994: The pension system is reformed to allow for the participation of privatepension funds.1995: The Central Bank charter is reformed to allow more flexibility in managingliquidity crises.1996: The government launches a “second reform of the state” which aims toreduce public-sector expenditure and enhance efficiency, but implementation ishalf-hearted.1997: The government agrees a labour-reform proposal with the labour unions, butis unable to mobilise business support.
The aggressive privatisation programme launched in the early 1990s aimed toease the stance of the public sector in the short term (providing fresh cash anddebt reduction or permitting lower spending) and to raise efficiency in themedium term. Although the first privatisations were poorly managed, the recordimproved as urgency receded and experience was gained. By 1996 the govern-ment had privatised most public utilities—telecommunications, airlines, powergeneration and distribution, gas transportation and distribution, water and sew-erage systems, and passenger and cargo railways—and sold the vast majority ofproductive facilities (including oil and gas extraction, coal mining, petrochemi-cals plants and steel mills). The Banco Hipotecario Nacional (national mortgagebank), the post office, the airports network and the nuclear power stations willbe transferred to the private sector in 1998. Divestiture operations have raised atotal of $17.6bn ($11.3bn in cash and $6.3bn in debt reduction at marketprices). The privatisation of public banks, electricity generation and distrib-ution, and water and sewerage systems by provincial governments has speededup since 1995 but progress has been uneven.
Structural reform also eliminated price and interest rate controls, deregulatedthe majority of economic activities, further liberalised the foreign investmentregime and removed most export taxes and quantitative restrictions on im-ports. Import levies were cut (in 1995 Argentina adopted Mercosur’s commonexternal tariff) and the tax system simplified around a value-added tax (VAT),which is easy to collect and in 1996 contributed 55% of the total tax revenue(excluding contributions to the social security system). The authorities arecurrently studying a major reform of the tax system to simplify it and improvecompliance. The so-called second reform of the state aims to reorganise thepublic sector (through employment cuts and the elimination or reorganisationof public-sector agencies) to improve efficiency and reduce government spend-ing. So far progress has been modest.
Argentina: Economic policy 15
EIU Country Profile 1997-98 © The Economist Intelligence Unit Limited 1997
Fiscal consistency turnsinto a key issue over the
medium term
The fiscal stance improved considerably during the Convertibility Plan’s earlyyears because rapid economic growth produced a significant increase in public-sector revenue. The simplified tax structure and measures to fight tax evasionalso made a contribution. After 1994 the fiscal performance gradually worsened:public spending continued to grow (particularly interest payments and transfersto provinces) as revenue contracted under the impact of structural reform meas-ures (such as the implementation of a private retirement system) and the dropin consumption spending brought about by the Mexican crisis.
The ensuing capital flight ($8bn in deposits—15% of the total—left the banksin only five months) brought financial fragility to the forefront. In the shortterm the run on bank deposits was successfully contained by a reactivation ofthe extended fund facility (EFF) agreement with the IMF which had beensuspended in 1994, a restrictive fiscal package and a reduction of exchange rateuncertainty brought about by Mr Menem’s re-election in May 1995. Thesemeasures prevented a major financial crisis and presided over a recovery indeposits and a sharp fall in interest rates after mid-1995. But easier creditconditions did not pull the economy out of the recession.
A new standby agreement signed with the IMF in early 1996 committed thegovernment to strict fiscal targets (a balanced budget for the year), but failureto comply led to a renegotiation of targets and a new fiscal restraint package inOctober. Notwithstanding these measures, the 1996 fiscal deficit reached thehighest level since the launching of the Convertibility Plan ($5.3bn, equivalentto 1.8% of GDP). The imbalance was cut in 1997 to around $3bn, as agreedwith the IMF.
Strengthening thefinancial system
A continued recovery in deposits and credits throughout 1996 made thegovernment’s efforts to strengthen the financial system easier. The CentralBank authorities arranged $6bn in contingency credit lines with foreign banksto be disbursed in case of emergency. Minimum liquidity requirements weregradually raised to enhance banks’ reserves and strengthen the banks’ ability torespond to deposit flight. Similarly, oversight activities were upgraded andbanking concentration stimulated (see Financial services).
With monetary policy severely constrained by the Convertibility Plan, theauthorities must rely on fiscal policy and microeconomic reforms to spureconomic growth. Against this background, the increase in public-sector defi-cits during 1995 and 1996 was not unwelcome because it served as a counter-cyclical influence. But with growth restored, fiscal consolidation has againbecome a priority. A reform of the tax revenue-sharing system will be needed ifthe increase in tax revenue is to be prevented from being automatically trans-ferred into higher spending on the part of local governments.
With a strong economic recovery under way and unemployment still at veryhigh rates, the debate over whether more active (targeted) policies are neces-sary has reignited.
16 Argentina: Economic policy
EIU Country Profile 1997-98 © The Economist Intelligence Unit Limited 1997

Public-sector accounts(Ps bn)
1996 1997a
Current revenue 47.7 53.7
Current expenditure 53.0 55.2
Primary surplus (excl privatisations) –1.1 1.4
Privatisation receipts 0.4 0.3
Primary surplus –0.7 1.7
Interest payments 4.6 4.7
Balance –5.3 –3.0
a Estimates.
Sources: Secretaría de Hacienda; Carta Económica.
(Historical data on public finances are given in Reference table 1; data onmonetary indicators are in Reference table 2; data on interest rates are inReference table 3.)
Economic performance
For many decades Argentinians have had to tolerate high inflation. But theproblem became much worse as a result of the 1982 debt crisis, which provokedmajor devaluations and a severe contraction of the peso-denominated finan-cial system. Economic growth suffered as financial intermediation declinedand capital flight turned into an endemic feature of the economy. Productiveinvestment was discouraged and resource allocation became inefficient as aresult of high and volatile inflation rates, turning economic stabilisation into aprerequisite of improved economic performance. Against this background thepost-1990 economic stabilisation record has been encouraging. Inflation fellrapidly and growth was fast, aided by a favourable international financialenvironment. The initial shift in relative prices in favour of non-tradeablegoods brought about by the fixed nominal exchange rate was partially reversedafter 1994.
A rapid economic recoveryfollows the Mexican crisis
Owing to the disappointing economic performance of the preceeding decade,in 1990 real output was still slightly below the 1982 level. Yet successful eco-nomic stabilisation and a favourable international financial environment al-lowed real GDP to expand by more than 40% between 1990 and 1994.Domestic demand was the major force behind economic growth, with grossfixed investment being the most dynamic component of aggregate demand.During 1990-94 fixed capital formation rose by nearly 150%, taking the invest-ment rate to the highest level since the 1982 debt crisis—23.6% of GDP (seeReference table 7). Consumption expenditure also expanded rapidly, rising by46% between 1990 and 1994. Domestic demand was fuelled by sizeable inflowsof foreign capital, partly reflected in a rapid accumulation of foreign reservesand an increase in the monetary base. Until 1994 net external demand made anegative contribution to GDP growth as slow export expansion combined withrapidly growing imports.
Argentina: Economic performance 17
EIU Country Profile 1997-98 © The Economist Intelligence Unit Limited 1997
Growth in gross domestic product(% real change)
Average1990-94 1995 1996
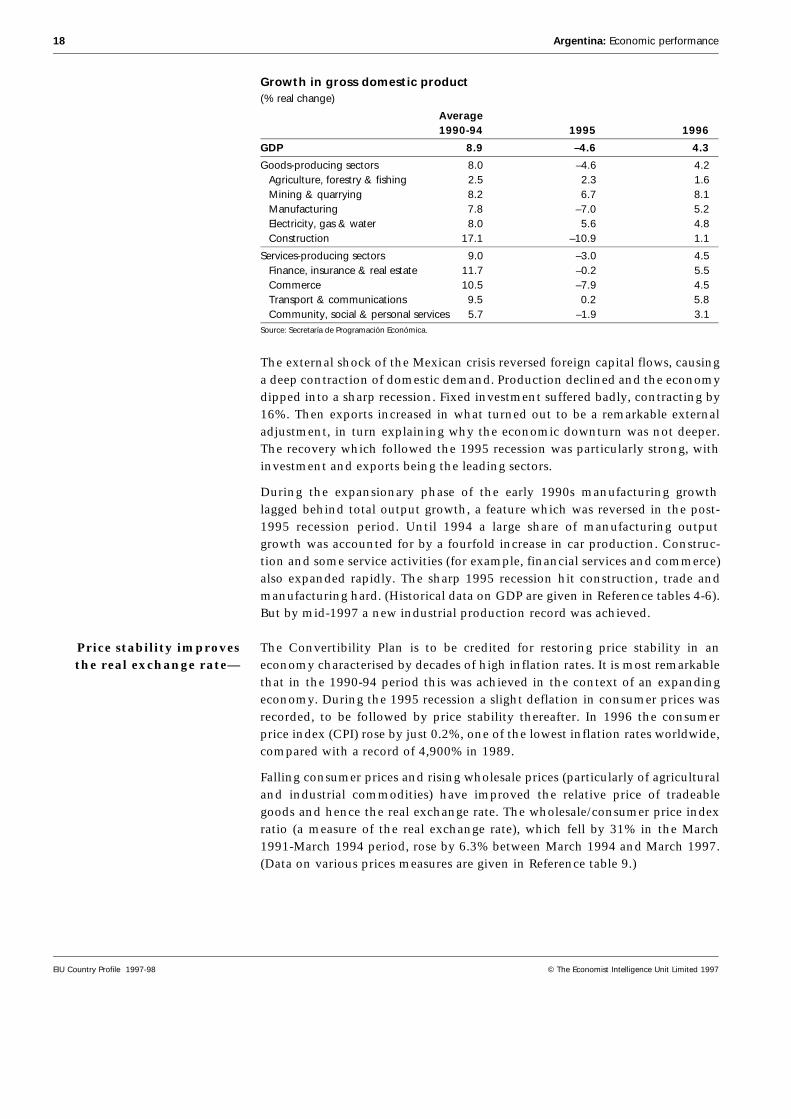
GDP 8.9 –4.6 4.3
Goods-producing sectors 8.0 –4.6 4.2 Agriculture, forestry & fishing 2.5 2.3 1.6 Mining & quarrying 8.2 6.7 8.1 Manufacturing 7.8 –7.0 5.2 Electricity, gas & water 8.0 5.6 4.8 Construction 17.1 –10.9 1.1
Services-producing sectors 9.0 –3.0 4.5 Finance, insurance & real estate 11.7 –0.2 5.5 Commerce 10.5 –7.9 4.5 Transport & communications 9.5 0.2 5.8 Community, social & personal services 5.7 –1.9 3.1Source: Secretaría de Programación Económica.
The external shock of the Mexican crisis reversed foreign capital flows, causinga deep contraction of domestic demand. Production declined and the economydipped into a sharp recession. Fixed investment suffered badly, contracting by16%. Then exports increased in what turned out to be a remarkable externaladjustment, in turn explaining why the economic downturn was not deeper.The recovery which followed the 1995 recession was particularly strong, withinvestment and exports being the leading sectors.
During the expansionary phase of the early 1990s manufacturing growthlagged behind total output growth, a feature which was reversed in the post-1995 recession period. Until 1994 a large share of manufacturing outputgrowth was accounted for by a fourfold increase in car production. Construc-tion and some service activities (for example, financial services and commerce)also expanded rapidly. The sharp 1995 recession hit construction, trade andmanufacturing hard. (Historical data on GDP are given in Reference tables 4-6).But by mid-1997 a new industrial production record was achieved.
Price stability improvesthe real exchange rate—
The Convertibility Plan is to be credited for restoring price stability in aneconomy characterised by decades of high inflation rates. It is most remarkablethat in the 1990-94 period this was achieved in the context of an expandingeconomy. During the 1995 recession a slight deflation in consumer prices wasrecorded, to be followed by price stability thereafter. In 1996 the consumerprice index (CPI) rose by just 0.2%, one of the lowest inflation rates worldwide,compared with a record of 4,900% in 1989.
Falling consumer prices and rising wholesale prices (particularly of agriculturaland industrial commodities) have improved the relative price of tradeablegoods and hence the real exchange rate. The wholesale/consumer price indexratio (a measure of the real exchange rate), which fell by 31% in the March1991-March 1994 period, rose by 6.3% between March 1994 and March 1997.(Data on various prices measures are given in Reference table 9.)
18 Argentina: Economic performance
EIU Country Profile 1997-98 © The Economist Intelligence Unit Limited 1997
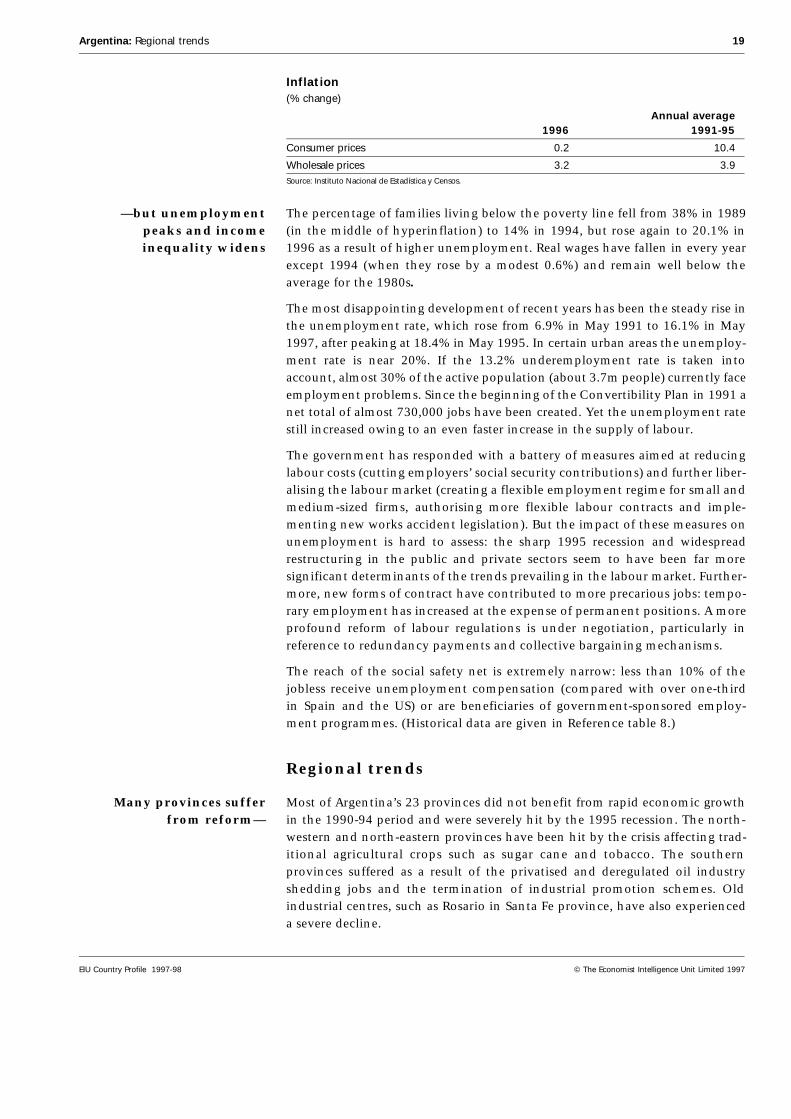
Inflation(% change)
Annual average1996 1991-95
Consumer prices 0.2 10.4
Wholesale prices 3.2 3.9Source: Instituto Nacional de Estadística y Censos.
—but unemploymentpeaks and incomeinequality widens
The percentage of families living below the poverty line fell from 38% in 1989(in the middle of hyperinflation) to 14% in 1994, but rose again to 20.1% in1996 as a result of higher unemployment. Real wages have fallen in every yearexcept 1994 (when they rose by a modest 0.6%) and remain well below theaverage for the 1980s.
The most disappointing development of recent years has been the steady rise inthe unemployment rate, which rose from 6.9% in May 1991 to 16.1% in May1997, after peaking at 18.4% in May 1995. In certain urban areas the unemploy-ment rate is near 20%. If the 13.2% underemployment rate is taken intoaccount, almost 30% of the active population (about 3.7m people) currently faceemployment problems. Since the beginning of the Convertibility Plan in 1991 anet total of almost 730,000 jobs have been created. Yet the unemployment ratestill increased owing to an even faster increase in the supply of labour.
The government has responded with a battery of measures aimed at reducinglabour costs (cutting employers’ social security contributions) and further liber-alising the labour market (creating a flexible employment regime for small andmedium-sized firms, authorising more flexible labour contracts and imple-menting new works accident legislation). But the impact of these measures onunemployment is hard to assess: the sharp 1995 recession and widespreadrestructuring in the public and private sectors seem to have been far moresignificant determinants of the trends prevailing in the labour market. Further-more, new forms of contract have contributed to more precarious jobs: tempo-rary employment has increased at the expense of permanent positions. A moreprofound reform of labour regulations is under negotiation, particularly inreference to redundancy payments and collective bargaining mechanisms.
The reach of the social safety net is extremely narrow: less than 10% of thejobless receive unemployment compensation (compared with over one-thirdin Spain and the US) or are beneficiaries of government-sponsored employ-ment programmes. (Historical data are given in Reference table 8.)
Regional trends
Many provinces sufferfrom reform—
Most of Argentina’s 23 provinces did not benefit from rapid economic growthin the 1990-94 period and were severely hit by the 1995 recession. The north-western and north-eastern provinces have been hit by the crisis affecting trad-itional agricultural crops such as sugar cane and tobacco. The southernprovinces suffered as a result of the privatised and deregulated oil industryshedding jobs and the termination of industrial promotion schemes. Oldindustrial centres, such as Rosario in Santa Fe province, have also experienceda severe decline.
Argentina: Regional trends 19
EIU Country Profile 1997-98 © The Economist Intelligence Unit Limited 1997
—and fail to adjust theirfiscal stance
The crisis aggravated the financial predicament of provincial governments,which for many years had sought to alleviate unemployment and buy politicalallegiance by providing jobs in the public sector. Thus in 1995 over 50% of theprovinces’ current spending was devoted to wages, resulting in an aggregatedeficit of Ps3.6bn ($3.6bn).
During 1990-94 provincial governments were able to increase local publicspending under the stimulus of high tax collection. But in 1995 the recessionreduced local and federal tax revenue and financial turmoil made credit toprovincial governments difficult to obtain. The result was a delay in paymentsto workers and suppliers, wage and salary cuts and the compulsory settlementof liabilities with locally issued bonds. The high level of indebtedness (mostlyshort run and estimated at $17.2bn by mid-1996) further strained provincialfinances. The economic recovery brought a transitory respite: higher tax reve-nue halved the deficit to $1.5bn.
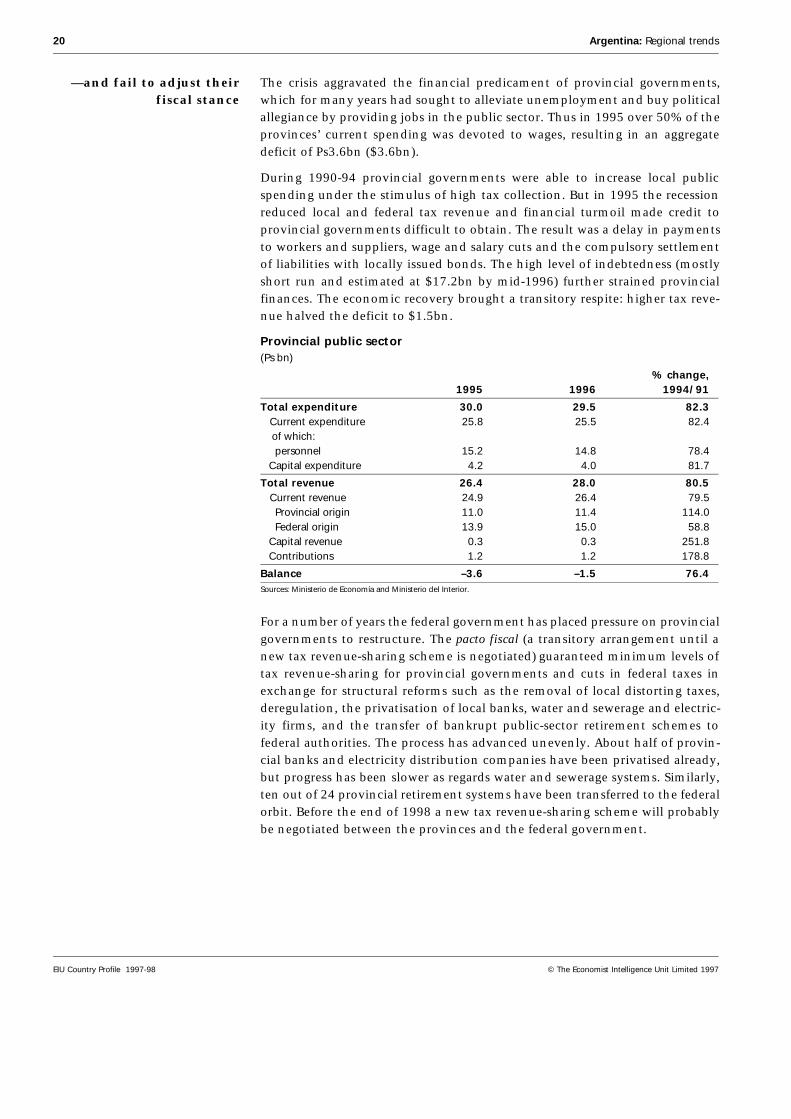
Provincial public sector(Ps bn)
% change,1995 1996 1994/91
Total expenditure 30.0 29.5 82.3 Current expenditure 25.8 25.5 82.4 of which: personnel 15.2 14.8 78.4 Capital expenditure 4.2 4.0 81.7
Total revenue 26.4 28.0 80.5 Current revenue 24.9 26.4 79.5 Provincial origin 11.0 11.4 114.0 Federal origin 13.9 15.0 58.8 Capital revenue 0.3 0.3 251.8 Contributions 1.2 1.2 178.8
Balance –3.6 –1.5 76.4Sources: Ministerio de Economía and Ministerio del Interior.
For a number of years the federal government has placed pressure on provincialgovernments to restructure. The pacto fiscal (a transitory arrangement until anew tax revenue-sharing scheme is negotiated) guaranteed minimum levels oftax revenue-sharing for provincial governments and cuts in federal taxes inexchange for structural reforms such as the removal of local distorting taxes,deregulation, the privatisation of local banks, water and sewerage and electric-ity firms, and the transfer of bankrupt public-sector retirement schemes tofederal authorities. The process has advanced unevenly. About half of provin-cial banks and electricity distribution companies have been privatised already,but progress has been slower as regards water and sewerage systems. Similarly,ten out of 24 provincial retirement systems have been transferred to the federalorbit. Before the end of 1998 a new tax revenue-sharing scheme will probablybe negotiated between the provinces and the federal government.
20 Argentina: Regional trends
EIU Country Profile 1997-98 © The Economist Intelligence Unit Limited 1997
Resources
Population
According to official projections made on the basis of the 1991 census, in 1996Argentina’s population was 35m, the fourth largest in Latin America behindBrazil, Mexico and Colombia. Projections for 1995-2000 give a 1.2% averageannual rate of population growth, slightly below the Latin American average of1.5%. Argentina’s fertility rates are comparable to the Latin American average.Projections for the remainder of the decade would take the total population to36.6m by 2000 and 46.1m by 2025.
Relatively high life expectancy puts Argentina among the three Latin Americancountries with the lowest share of population below 15 years and the highestshare of population over 65 years. Infant mortality rates in 1996 were 22.4 per1,000 live births, approximately half the Latin American average, and lifeexpectancy was 69 and 76 for men and women respectively, four and threeyears higher than the Latin American average. (Population totals are given inReference table 10; labour force totals in Reference table 11.)
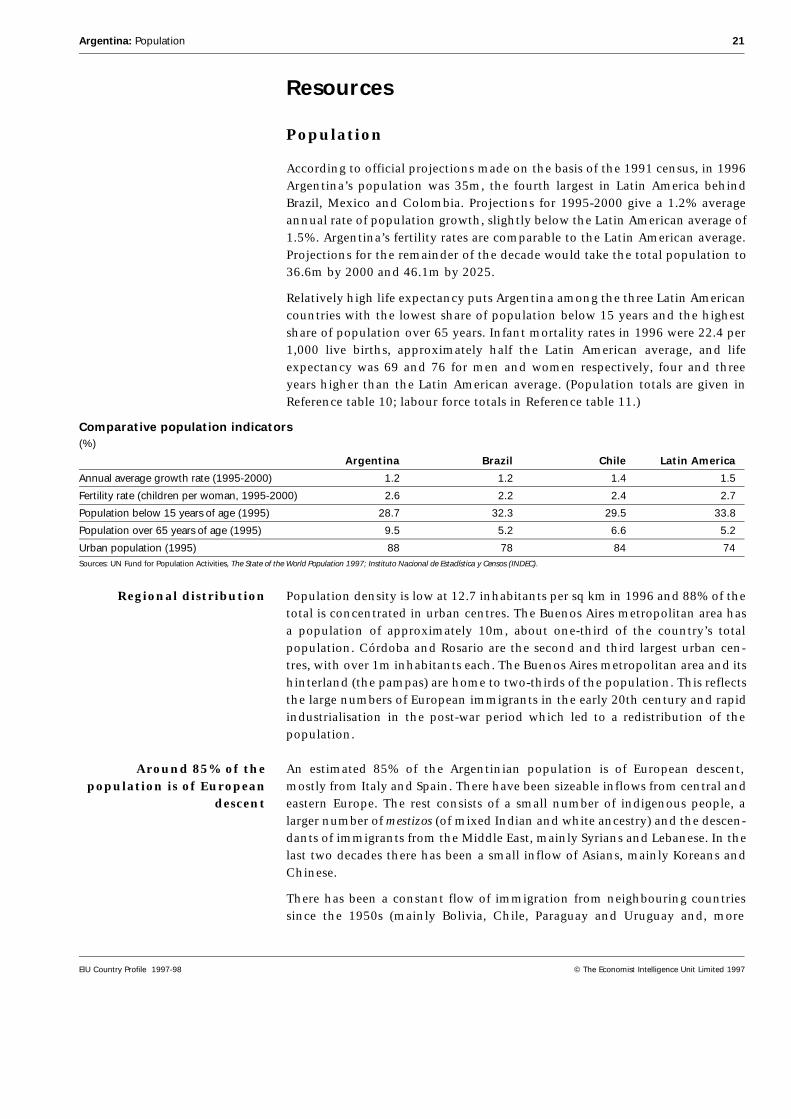
Comparative population indicators(%)
Argentina Brazil Chile Latin America
Annual average growth rate (1995-2000) 1.2 1.2 1.4 1.5
Fertility rate (children per woman, 1995-2000) 2.6 2.2 2.4 2.7
Population below 15 years of age (1995) 28.7 32.3 29.5 33.8
Population over 65 years of age (1995) 9.5 5.2 6.6 5.2
Urban population (1995) 88 78 84 74Sources: UN Fund for Population Activities, The State of the World Population 1997; Instituto Nacional de Estadística y Censos (INDEC).
Regional distribution Population density is low at 12.7 inhabitants per sq km in 1996 and 88% of thetotal is concentrated in urban centres. The Buenos Aires metropolitan area hasa population of approximately 10m, about one-third of the country’s totalpopulation. Córdoba and Rosario are the second and third largest urban cen-tres, with over 1m inhabitants each. The Buenos Aires metropolitan area and itshinterland (the pampas) are home to two-thirds of the population. This reflectsthe large numbers of European immigrants in the early 20th century and rapidindustrialisation in the post-war period which led to a redistribution of thepopulation.
Around 85% of thepopulation is of European
descent
An estimated 85% of the Argentinian population is of European descent,mostly from Italy and Spain. There have been sizeable inflows from central andeastern Europe. The rest consists of a small number of indigenous people, alarger number of mestizos (of mixed Indian and white ancestry) and the descen-dants of immigrants from the Middle East, mainly Syrians and Lebanese. In thelast two decades there has been a small inflow of Asians, mainly Koreans andChinese.
There has been a constant flow of immigration from neighbouring countriessince the 1950s (mainly Bolivia, Chile, Paraguay and Uruguay and, more
Argentina: Population 21
EIU Country Profile 1997-98 © The Economist Intelligence Unit Limited 1997
recently, Brazil and Peru). These flows gathered pace after 1991 when theeconomy recovered and the exchange rate appreciated. A number of these newimmigrants are undocumented and are employed in the informal sector of theeconomy. In the context of high unemployment rates, these new flows havebrought the debate on more stringent immigration laws and enforcement tothe fore. Yet Argentina has traditionally been a country open to immigrants,and it is likely to remain so in the future.
Housing The standard of housing varies across regions, but overall is better than in mostdeveloping countries. According to 1991 data, 93% of total dwellings hadelectricity and 92% were either connected to the natural gas network or usedbottled gas, 73% of the population had safe drinking water within their owndwellings and 69% had sanitary services (only 34% had sewerage services). Butovercrowding has worsened since the early 1980s: one-quarter of total dwell-ings were overcrowded in 1991 compared with 18.5% in 1980. The regionaldistribution of these figures is uneven. While almost 100% of the population ofthe federal district has sewerage systems, the share is only 31% for those livingin Buenos Aires province and shrinks to 13% in provinces such as Santiago delEstero or Chaco, and to 7% in Misiones.
Poverty indicators Poverty indicators, which improved in the early 1990s after peaking during thehyperinflation at the turn of the decade, worsened again during the 1995recession and thereafter. Available data for the Buenos Aires metropolitan area(which makes up one-third of the population) show that the percentage ofhouseholds below the poverty line, which fell significantly at the beginning ofthe decade, increased by more than 50% between 1994 and 1996. Part of thesehouseholds were formerly middle-class families displaced by economic restruc-turing. The share of households with unsatisfied basic needs and those belowthe indigency line also increased, the latter doubling from a minimum of 2.4%in 1992 to 5.5% in 1996. The recent rise in poverty indicators can be attributedto lower incomes as a result of high unemployment rates and the rise in theprice of basic staples and transportation, which make up a large share of lowincome groups’ spending.
Inequality has also increased in recent years, as income distribution has be-come more concentrated in the top of the pyramid. Between 1991 and 1996the share of total income held by the richest 10% of the population increasedby almost two percentage points (from 34.6% to 36.3%), whereas the incomeshare of the poorest 30% fell from 9.5% to 8.2%. These trends are reversing along-standing feature of Argentinian society, which is generally regarded asone of the most egalitarian in Latin America.
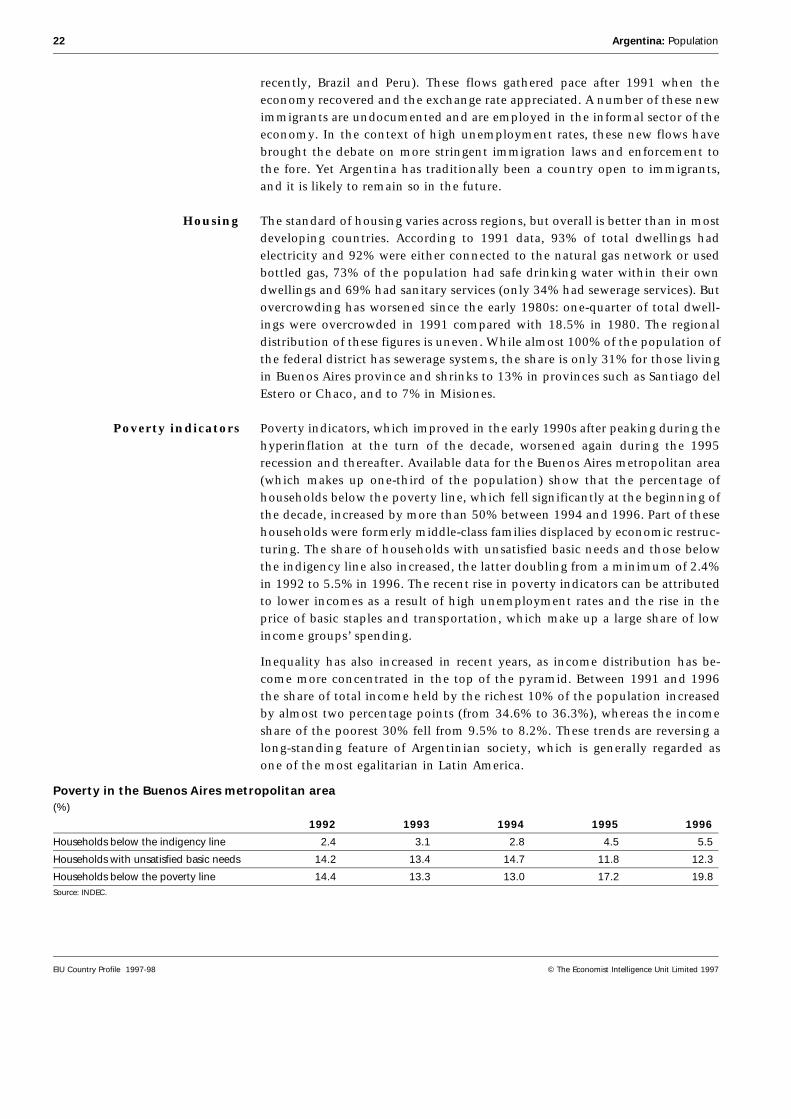
Poverty in the Buenos Aires metropolitan area(%)
1992 1993 1994 1995 1996
Households below the indigency line 2.4 3.1 2.8 4.5 5.5
Households with unsatisfied basic needs 14.2 13.4 14.7 11.8 12.3
Households below the poverty line 14.4 13.3 13.0 17.2 19.8Source: INDEC.
22 Argentina: Population
EIU Country Profile 1997-98 © The Economist Intelligence Unit Limited 1997

Education
The early development of a system of state schools has encouraged high liter-acy rates (96% in 1993) and high enrolment in primary and secondary educ-ation. In the early 1990s around 86% of children of school age were enrolled inthe last year of primary school, while almost two-thirds of children in the13-17 age group were enrolled in secondary school. The system of highereducation is also broadly based, with a total of 82 universities, of which 36 arepublic, although the public education system has deteriorated in the last twodecades owing to the fiscal crisis of the federal and provincial governments.The private education system has been growing rapidly, but quality is ex-tremely uneven and coverage selective.
Primary and secondaryeducation has been
decentralised—
In the late 1970s primary education became less homogeneous as it was decen-tralised from the federal to the local level. The process was repeated in the early1990s with the decentralisation of secondary education. Reasons for shortfallsin local educational services include administrative and technical deficiencies,and the fact that in many districts the educational system became a source ofpolitically motivated public employment. A far-reaching reform process isunder way to improve educational services in the public and private sectors.
—and a reform process isunder way—
The educational system is being reformed on the basis of the 1993 FederalEducation Law. Until 1995 the structure of the education system consisted ofone initial non-mandatory pre-school year, seven mandatory years of primaryeducation, and five non-mandatory years of secondary education and highereducation; the new structure includes one initial mandatory pre-school year,nine years of mandatory basic education, a non-mandatory three-year modularcycle and higher education. These reforms are being implemented throughspecific agreements between the federal and provincial governments. Thegovernment originally expected the new structure to be fully operational by2001, but this is unlikely.
Provincial governments are in charge of implementing the reform. Althoughall of them have launched the process, progress is uneven owing to disparatetechnical abilities and, more importantly, poor financial resources. In effect,financing is the main constraint on the reform process. Lack of resourcesinhibit infrastructural investment required to extend the primary cycle to nineyears, while teachers’ participation has been unenthusiastic as a result of lowwages. Although the national government has put forward a federal trainingprogramme, it is unlikely that it will be enough to compensate for a long-termdeterioration in the quality of teachers. The progress and the results of thereform also differ between rich and poor local communities, which make itunlikely that the reform process will turn into a vehicle for reducing inequalityin the quality of the educational services provided.
—but lack of financialresources is hindering
implementation
The Federal Education Agreement, which was signed in September 1994 by thefederal government and most provincial governments, established that federaland provincial educational budgets would be increased by 20% per year during1995-99, and committed the federal government to investing a total of Ps3bnto improve buildings, provide new equipment and train teachers. Total
Argentina: Education 23
EIU Country Profile 1997-98 © The Economist Intelligence Unit Limited 1997
government spending in education was scheduled to reach 6% of GDP. But thefinancial constraints faced by the national government since the end of 1994have prevented these targets from being met: currently, total governmentspending in education reaches only 4% of GDP.
Higher education The Higher Education Law passed in 1995 enabled public universities to estab-lish their own admission and financial regime. Traditionally, higher educationhas been free and there has been unrestricted admission to most nationaluniversities. Enforcement of the new legislation has faced stiff opposition incertain universities, particularly the largest, the University of Buenos Aires. Theapparent inadequacy of the public higher education system has stimulated theproliferation of private institutions. Yet many of these lack the human capitaland physical infrastructure required to provide adequate educational services.Graduate studies have increased because of the deteriorating quality of under-graduate training.
In recent years several national public universities were created in the BuenosAires metropolitan area. As they are still small in size and population (manyhave selective admission procedures), these units enjoy acceptable infrastruc-ture and financial resources. Yet academic quality is still modest.
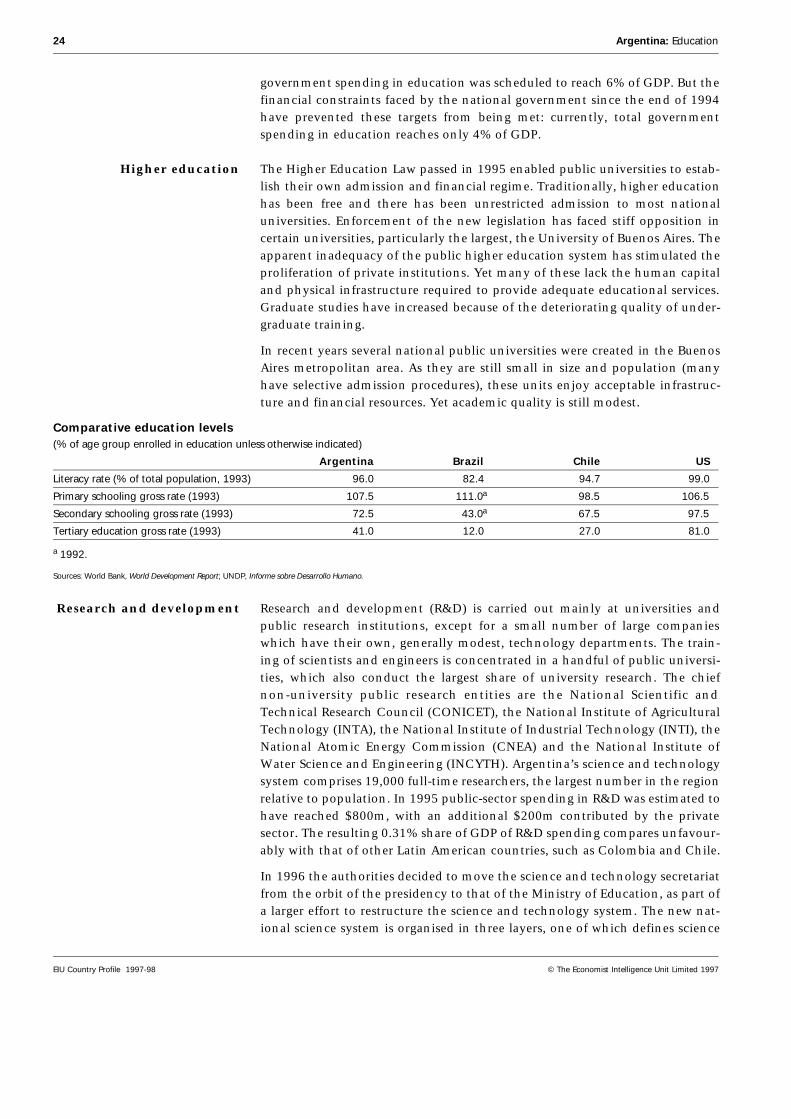
Comparative education levels(% of age group enrolled in education unless otherwise indicated)
Argentina Brazil Chile US
Literacy rate (% of total population, 1993) 96.0 82.4 94.7 99.0
Primary schooling gross rate (1993) 107.5 111.0a 98.5 106.5
Secondary schooling gross rate (1993) 72.5 43.0a 67.5 97.5
Tertiary education gross rate (1993) 41.0 12.0 27.0 81.0
a 1992.
Sources: World Bank, World Development Report; UNDP, Informe sobre Desarrollo Humano.
Research and development Research and development (R&D) is carried out mainly at universities andpublic research institutions, except for a small number of large companieswhich have their own, generally modest, technology departments. The train-ing of scientists and engineers is concentrated in a handful of public universi-ties, which also conduct the largest share of university research. The chiefnon-university public research entities are the National Scientific andTechnical Research Council (CONICET), the National Institute of AgriculturalTechnology (INTA), the National Institute of Industrial Technology (INTI), theNational Atomic Energy Commission (CNEA) and the National Institute ofWater Science and Engineering (INCYTH). Argentina’s science and technologysystem comprises 19,000 full-time researchers, the largest number in the regionrelative to population. In 1995 public-sector spending in R&D was estimated tohave reached $800m, with an additional $200m contributed by the privatesector. The resulting 0.31% share of GDP of R&D spending compares unfavour-ably with that of other Latin American countries, such as Colombia and Chile.
In 1996 the authorities decided to move the science and technology secretariatfrom the orbit of the presidency to that of the Ministry of Education, as part ofa larger effort to restructure the science and technology system. The new nat-ional science system is organised in three layers, one of which defines science
24 Argentina: Education
EIU Country Profile 1997-98 © The Economist Intelligence Unit Limited 1997
and technology policy (the Interministerial Cabinet on Science andTechnology), one which promotes it (the Science and Technology PromotionAgency) and a third one in charge of carrying forward research and develop-ment activities (through a network of institutes and laboratories). TheInterministerial Cabinet sets a multiannual national plan for the sector anddefines key areas to promote. The promotion agency, in turn, administers twofunds: one to provide loans to stimulate business modernisation and anotherto subsidise basic research. Whether the new structure will be able to reversethe long-term deterioration of R&D activities is still to be seen.
Health
Public healthcare serviceshave deteriorated
Responsibility for healthcare is shared between the public and private sectorsand the obras sociales (semi-public health trust funds). All three have undergonea profound transformation in recent years, partly as a result of the public sector’sfinancial crisis. While the private sector has increased its share in the provisionof healthcare, the contributions of the public sector and the health trust fundshave fallen owing to fiscal stringency, falling wage levels (which are the basis ofworkers’ contributions to health trust funds) and poor management.
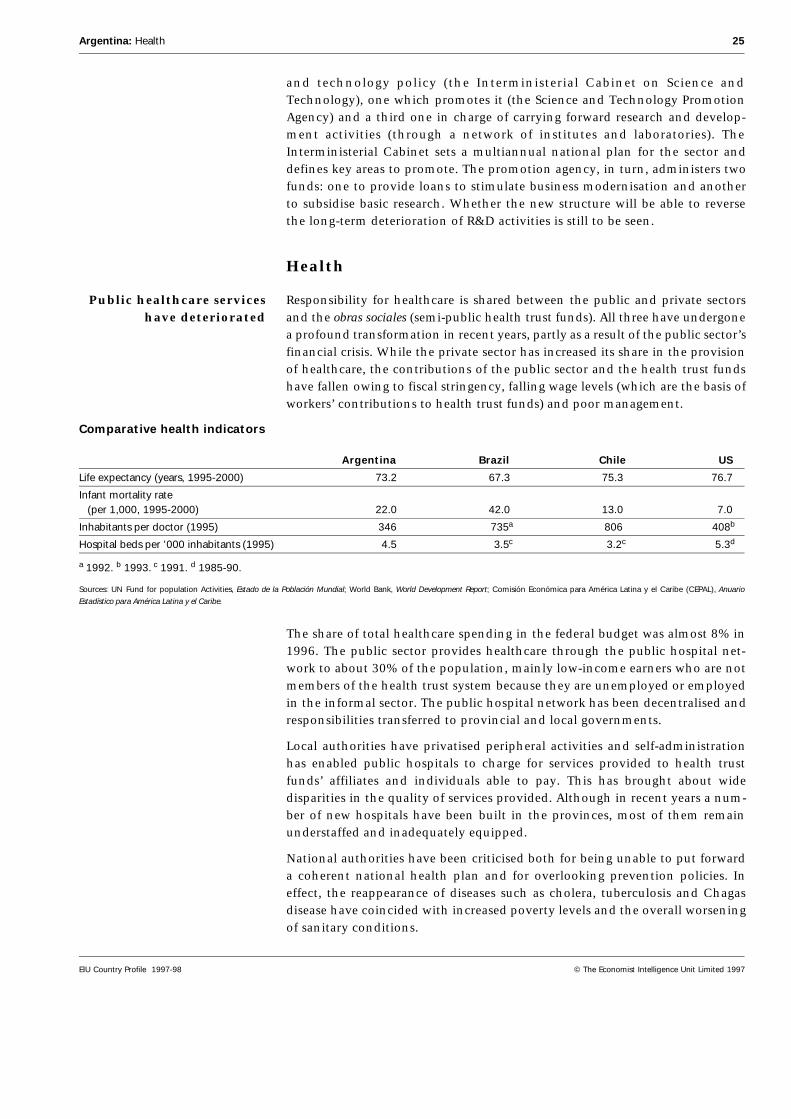
Comparative health indicators
Argentina Brazil Chile US
Life expectancy (years, 1995-2000) 73.2 67.3 75.3 76.7
Infant mortality rate (per 1,000, 1995-2000) 22.0 42.0 13.0 7.0
Inhabitants per doctor (1995) 346 735a 806 408b
Hospital beds per ’000 inhabitants (1995) 4.5 3.5c 3.2c 5.3d
a 1992. b 1993. c 1991. d 1985-90.
Sources: UN Fund for population Activities, Estado de la Población Mundial; World Bank, World Development Report; Comisión Económica para América Latina y el Caribe (CEPAL), Anuario
Estadístico para América Latina y el Caribe.
The share of total healthcare spending in the federal budget was almost 8% in1996. The public sector provides healthcare through the public hospital net-work to about 30% of the population, mainly low-income earners who are notmembers of the health trust system because they are unemployed or employedin the informal sector. The public hospital network has been decentralised andresponsibilities transferred to provincial and local governments.
Local authorities have privatised peripheral activities and self-administrationhas enabled public hospitals to charge for services provided to health trustfunds’ affiliates and individuals able to pay. This has brought about widedisparities in the quality of services provided. Although in recent years a num-ber of new hospitals have been built in the provinces, most of them remainunderstaffed and inadequately equipped.
National authorities have been criticised both for being unable to put forwarda coherent national health plan and for overlooking prevention policies. Ineffect, the reappearance of diseases such as cholera, tuberculosis and Chagasdisease have coincided with increased poverty levels and the overall worseningof sanitary conditions.
Argentina: Health 25
EIU Country Profile 1997-98 © The Economist Intelligence Unit Limited 1997

Health trust funds Obras sociales provide healthcare services to about 65% of the population. Theyare pay-as-you-go systems based on compulsory payroll contributions madeboth by the employer and the employee and are co-ordinated by theAdministración Nacional del Seguro de Salud. Most of the 280 health trustfunds do not provide services directly, but subcontract to the private sector. Inthe context of a programme financed by the World Bank, this sector is experi-encing a major restructuring. The aim of the programme is to increase effi-ciency through enhanced competition and consolidation. The first step,implemented in early 1997, consisted of enabling the membership to changetheir health coverage from one obra social to another, an option taken by anestimated 150,000 individuals. The chance will be available once every year. Theprivate sector wants competition within the obras sociales segment to includeprivate healthcare providers, but so far this has been blocked by opposition fromthe trade unions, which administer many health trusts and significant financialresources.
Private-sector healthcare The crisis of public healthcare and health trust funds has stimulated growth ofprivately owned hospitals, diagnostic centres and prepaid healthcare systems,mostly concentrated in large urban centres. Prepaid healthcare insurance takescare of only 3% of the population, often subcontracting the provision of serv-ices. The World Bank-sponsored reform programme demands more stringentregulations of private healthcare systems, if the latter are to be allowed tocompete with the obras sociales. Currently, prepaid healthcare systems operateas commercial firms, with no public oversight either of the kind of services andcoverage provided or the responsibilities assumed.
The authorities plan to regulate private healthcare systems through minimumcapital requirements, compulsory technical reserves and solvency margins.These issues are becoming more relevant as older prepaid healthcare systemsface the difficulties associated with an ageing membership.
Natural resources and the environment
Argentina is located in the southern extreme of the American continent. Itstotal surface area is 2.7m sq km, including 964,000 sq km of continentalAntarctic territory and South Atlantic islands (the ownership of some of whichis disputed with the UK). The South American continental portion is 3,700 kmlong, and the climate varies from subtropical to cold. Most of the country is inthe temperate climate region. One-third is in humid zones, comprising thepampas (600,000 sq km) and the subtropical forest of the north-east. The restof the country is arid and semi-arid.
Land-use patterns The territory is biologically diverse, with 300 species of mammal, 970 species ofbird, and 180 reptile, 70 amphibious and 10,000 plant species. Althoughmechanisms to preserve biodiversity are not well developed, the number ofprotected areas has been rising since the mid-1960s. Protected areas represent3-4% of the territory, which is low by developed country standards but similarto that of neighbouring countries.
26 Argentina: Natural resources and the environment
EIU Country Profile 1997-98 © The Economist Intelligence Unit Limited 1997

Some 73% of the territory is devoted to extensive or semi-extensive cattlebreeding, 4% is predominantly used for arable crops, 18% is of mixed use and5% is devoted to other uses. Although the yield per unit of land in grainproduction is similar to that of Australia or Canada, use of fertilisers (about5 kg/ha) is much less intensive. Similarly, the use of pesticides is still onlyone-third of Australia’s and one-tenth of that of some European countries,despite a rapid increase in recent years. The area planted with organic productshas increased markedly in recent years. Although the first certifications oforganic plantations date back to only 1992, by 1996 about 12,000 ha had beenplanted with organic products. More than one-half of the area was devoted tocereal and oilseed production, with an additional one-third devoted to fruit.The rapid increase of organic production suggests a significant potential.
Forest resources The exploitation of natural forests began in the 19th century when 39% ofArgentinian territory was natural forest. By the mid-1980s the natural forestarea had contracted to 38m ha, or 14% of the continental area. The rate ofdeforestation fell from 1m ha/year in the early part of the century to 160,000ha/year in the 1980s. The remaining natural forests are in danger unless legis-lation is enforced. It is estimated that at the present rate of deforestation(40,000 ha/year for over two decades), the misionera forest in the north-east(the second tropical ecosystem in the continent after Amazonia) will disappearin around 20 years. Large forest fires in 1995 raised the issue of deficientmanagement on the part of the public sector.
Fishing resources A large coastal region south of the Río de la Plata provides abundant fishingresources. Exploitation is uneven, with overfishing of some species, such assquid. In total 20 species of fish are caught.
Mineral resources Vast mineral resources are known to exist, but only 20% of the country hasbeen surveyed. A number of large mining projects are under way and Argentinais set to become one of the world’s largest gold and copper producers by theend of the decade. Since the natural gas and petroleum sectors were privatised,exploration for hydrocarbons has increased. Natural gas reserves are large andArgentina should become a major gas supplier to neighbouring markets, partic-ularly Chile and Brazil.
Environmental legislationand problems
Argentina has a well developed, but poorly enforced, framework of environ-mental legislation particularly in respect of the exploitation of natural re-sources (oil and gas, minerals and forestry). Legislation on the disposal ofdangerous wastes, the use of substances damaging the ozone layer, and shippollution control has been recently passed. In 1996 the government an-nounced that the Secretariat of Natural Resources and Environment, created in1991 under the direct control of the presidency, will be upgraded to a ministry,but implementation has been delayed. State and local governments have alsocreated environmental agencies but links between national and local bodies arepoor. Article 41 of the new constitution establishes the right to a healthy andbalanced environment, the duty to preserve it, the obligation to repair environ-mental damage and a prohibition against allowing dangerous or radioactive
Argentina: Natural resources and the environment 27
EIU Country Profile 1997-98 © The Economist Intelligence Unit Limited 1997
waste into the country. Regulations require budget allocations to make enforce-ment possible.
The government’s decision to privatise the nuclear power stations has raisedthe issue of nuclear waste disposal. The privatisation law passed in 1997 estab-lishes that creation of new nuclear waste disposal sites will require authorisa-tion from the nuclear regulatory authority and the local government involved.At present, highly radioactive nuclear waste is treated and stored in nuclearpower stations while low and medium level radioactive nuclear waste is treatedand stored in a plant close to Buenos Aires.
Economic infrastructure
Transport and communications
After many years of deterioration, transport infrastructure has begun a gradualrecovery. In effect, since the early 1990s the government has tried to improvethe quality of services offered through privatisation, deregulation and decen-tralisation. Railways, the underground network, most of the port system (in-cluding Buenos Aires, the largest port), domestic and international airlines anda large share of road construction and maintenance have all been privatised.Deregulation eased or removed administrative constraints on river and mari-time transportation, truck freight transportation, port operations, road passen-ger transportation and air travel and cargo. Most long-distance railwaypassenger transportation services were discontinued, while improved urbanservices shifted passengers away from road transportation. Lower airfares andimproved railway cargo services have also made a dent on road transportation.(Transport statistics are given in Reference table 12.)
Modernisation of thevehicle fleet
In the early 1990s the average age of the car fleet was 14 years, with 64% morethan 11 years old. Until 1994 there was a rapid increase in sales of new cars,fostered by economic stabilisation and the availability of credit. Although salesto the domestic market were badly hit in 1995 and 1996 by the consequencesof the Mexican crisis, the upward trend recovered in 1997. In 1992 the roadcargo fleet had an average age of 16 years, with 24% of vehicles in goodcondition, 38% in fair condition and 38% in poor condition. Although moreupdated statistics are not available, the average age of the fleet is likely to havefallen in recent years. About 41% of the road cargo fleet is owned by proprietorsof one or two vehicles.
Most urban and inter-urban passenger transport is by road, but that share hasbeen contracting for several years. In long-distance services air transportationhas significantly increased its share as a result of competitive fares.
Private investments inroad infrastructure
In 1990 only one-quarter of the road network of approximately 211,000 kmwas in good condition. The national road system is made up of 36,837 km, 76%of which is paved. Maintenance and improvement of main national roads(approximately 10,000 km) has been transferred to the private sector through a
28 Argentina: Transport and communications
EIU Country Profile 1997-98 © The Economist Intelligence Unit Limited 1997
toll system, which has led to a significant improvement in road conditions. In1996 about 92% of private-sector administered roads was in good condition.This was the result of a total of $1.5bn in investment during 1990-96. Theauthorities and the private sector are currently negotiating an extension in thelength of contracts in exchange for the elimination of official subsidies andnew works’ commitments. The authorities are also planning to build a new10,000-km highway network to link main urban centres, but the method offinancing is still undecided.
Construction and improvement work on four major highways in the BuenosAires metropolitan area was completed in 1997. In 1996 two long-delayedprojects (the Buenos Aires-La Plata and the Arturo Illia highways) were inaugu-rated, while the Panamerican highway and the Buenos Aires ring-road werecompletely overhauled. The Buenos Aires-Cañuelas and Buenos Aires-Lujánhighways have also made significant progress and are scheduled to be in fulloperation by late 1998.
Expanding regional trade is stimulating new projects to improve ground linkswith other Mercosur partners and Chile. In the next few years the countries inthe region are expected to invest about $5bn to improve border connections.From the standpoint of Argentina, links with Brazil and Chile are critical. TheArgentinian and Brazilian governments have joint projects for a total of$3.5bn, part of which will be financed through loans from multilateral agen-cies such as the Inter-American Development Bank.
The construction is under way of a bridge linking Santo Tomé in Argentinawith São Borja in Brazil. The new bridge will reduce traffic on the Paso de losLibres-Uruguayana bridge, which currently carries around 80% of road trafficbetween the two countries. A Spanish firm, Dycasa, has also made an offer tobuild the Rosario-Victoria bridge over the Paraná river (linking central andwestern Argentina with Brazil), while a study is still being undertaken on thefeasibility of building a Buenos Aires-Colonia bridge. A tunnel through theAndes mountain range linking Mendoza in Argentina with Santiago in Chile isalso being considered; the countries are linked by just one paved road which isblocked in winter sometimes.
Railway services improve The rail network, which totals 35,700 km, is the largest in Latin America and iscomposed of three subsectors: freight, passenger transportation in the BuenosAires metropolitan area and intercity passenger transportation. Between 1987and 1992 the number of passengers transported by urban and suburban rail-ways fell by 38%, while inter-urban passengers transported fell by 58% andcargo contracted by 51%.
In 1993 the cargo system as well as the urban, suburban and profitable intercitypassenger services were privatised. The six urban and suburban passenger net-works, including the Buenos Aires underground system, were transferred tofour private operators for periods of ten and 20 years. The cargo railway net-work was transferred to five operators. Owing to the improved quality of serv-ices, rail passenger transportation almost doubled between 1993 and 1996.There are plans to build a rail connection between Brazilian ports in the
Argentina: Transport and communications 29
EIU Country Profile 1997-98 © The Economist Intelligence Unit Limited 1997
Atlantic and Chilean ports in the Pacific, making use of existing networks, butthe required levels of investment are considerable.
Air transportation takes alarger share
Competition in air transportation has increased following privatisation andderegulation. A reduction in airfares led to a sharp increase (49%) in the num-ber of passengers transported between 1992 and 1996. In some cases, airfaresfell to 50% of their pre-deregulation levels, making air transport competitivewith road transport. Deregulation of cargo services had results similar to thosefor passenger services. Although domestic air freight is tiny compared withroad or even rail transportation, it has been expanding rapidly: between 1992and 1996 airfreight increased by 35%.
In November 1995 Aerolíneas Argentinas lost exclusive rights to fly to theregional market, a preliminary step towards the removal of all special rights by2000. In the course of 1998 the authorities also plan to transfer the airportsnetwork to the private sector for a period of 30 years, in exchange for an annualfee and minimum investment commitments.
Ports reduce costs throughprivatisation
In the last decade over 90% of total foreign trade was carried by river andmaritime transportation. Port infrastructure is therefore critical to the eco-nomy. To resolve long-standing problems of high costs and bureaucracy, theport system was decentralised and transferred from public ownership to privatehands. The main port is Buenos Aires, which handles 50% of total imports. InOctober 1994 the administration of the five port terminals was transferred tothe private sector. Greater efficiency and competition among operators havereduced costs sharply: while two years ago rates in the port of Buenos Aireswere 70-80% above those of other South American ports, they are now thelowest in the region. Yet the total number of containers handled by eachterminal remains well below international norms.
In May 1995 the Paraná-Rio de la Plata corridor was transferred to the privatesector. The concession was granted for ten years, with a commitment to imple-ment a signalling system—which would permit 24-hour navigation—and todeepen the channel. This will sharply reduce transportation costs. The corridoraccounts for the largest share of Argentinian river and maritime transportation,carrying 70% of agricultural exports. A toll system has been in operation sincethe start of 1996.
A major project under study is the creation of a 3,440-km freight corridor(known as the Hidrovía) linking Cáceres in Brazil and Nueva Palmira inUruguay through the Paraná and Paraguay rivers.
Telecommunicationsthrive
In the late 1980s the Argentinian telecommunications system was outdatedand the investment backlog considerable. In 1990 the state telecommun-ications firm, Entel, was privatised and its assets and operations were trans-ferred to four firms. The Argentinian territory was divided into two regions(northern and southern) and basic telephone services were transferred on amonopoly basis to two privately owned firms, Telecom Argentina andTelefónica de Argentina. International telephone, fax and data-transmissionservices were transferred to Teleintar while domestic telex, data-transmissionand maritime mobile radio transmissions went to Startel. Teleintar and Startel
30 Argentina: Transport and communications
EIU Country Profile 1997-98 © The Economist Intelligence Unit Limited 1997

are owned and jointly operated by Telecom and Telefónica. The telecomssector has thrived with new products and the arrival of large internationalplayers. Although the latter have not been allowed to operate the basic tele-phone system, new technologies and the large investments made suggest thatthey have the sector’s deregulation (to take place in 2000 at the latest) in sight.
Telephone service indicators
1990 1996
No. of lines (’000) 3,471 6,965
No. of lines in service (’000) 3,087 6,263
Lines in service per 100 inhabitants 12 16
No. of digital lines (’000) 460 5,920
Network digitalisation (%) 13.0 85.0
No. of cellular telephones (’000) 25a 667
a 1991.
Source: INDEC, Comisión Nacional de Comunicaciones.
Under the privatisation agreement, Telefónica and Telecom hold exclusiverights over basic telephone services until the end of 1997. If they can demon-strate that they have met the investment commitments (which is highlylikely), they may request an extension of the exclusive rights until November2000. A request made by Telefónica to break apart from Telecom in Teleintardemonstrates its interest in taking new positions in the market with an eye toderegulation. Telefónica is also building its own data-transmission company,anticipating a future break from Telecom in Startel.
In recent years mobile telephone services have been expanding at 70% peryear, with most of the growth concentrated in the Buenos Aires metropolitanarea, which is served by Movicom and Miniphone. In Argentina’s interior theservice is operated by Compañía de Teléfonos del Interior (CTI), Personal(Telecom) and Unifón (Telefónica de Argentina) acting in competition. Ind-ustry sources estimate that after the introduction of the calling party payssystem in 1997, mobile telephone users could rapidly reach 2m.
In 1997 the authorities also granted three licences to operate the country’s firstpersonal communications system providing telephone, cellular, paging, videoand data-transmission services in the Buenos Aires metropolitan area.
Cable television operators currently provide services to 50% of householdswith television sets. Argentina has the third largest cable network in theAmericas (behind the US and Canada), with a total of 5m users. The largestcable operators (which include key international players such as TCI and WestContinental of the US) have undertaken sizeable investments in optical fibre,in the hope of taking part in the telephone market once the monopoly rightsend in 2000.
In 1993 Nahuelsat, a consortium comprising domestic and foreign firms, wonthe tender to establish the first Argentinian satellite system (Nahuel), due toprovide services to Argentina, Uruguay, Chile and Brazil. Telecom joined theconsortium in 1995. The satellite began transmitting images, sound and data inMarch 1997.
Argentina: Transport and communications 31
EIU Country Profile 1997-98 © The Economist Intelligence Unit Limited 1997
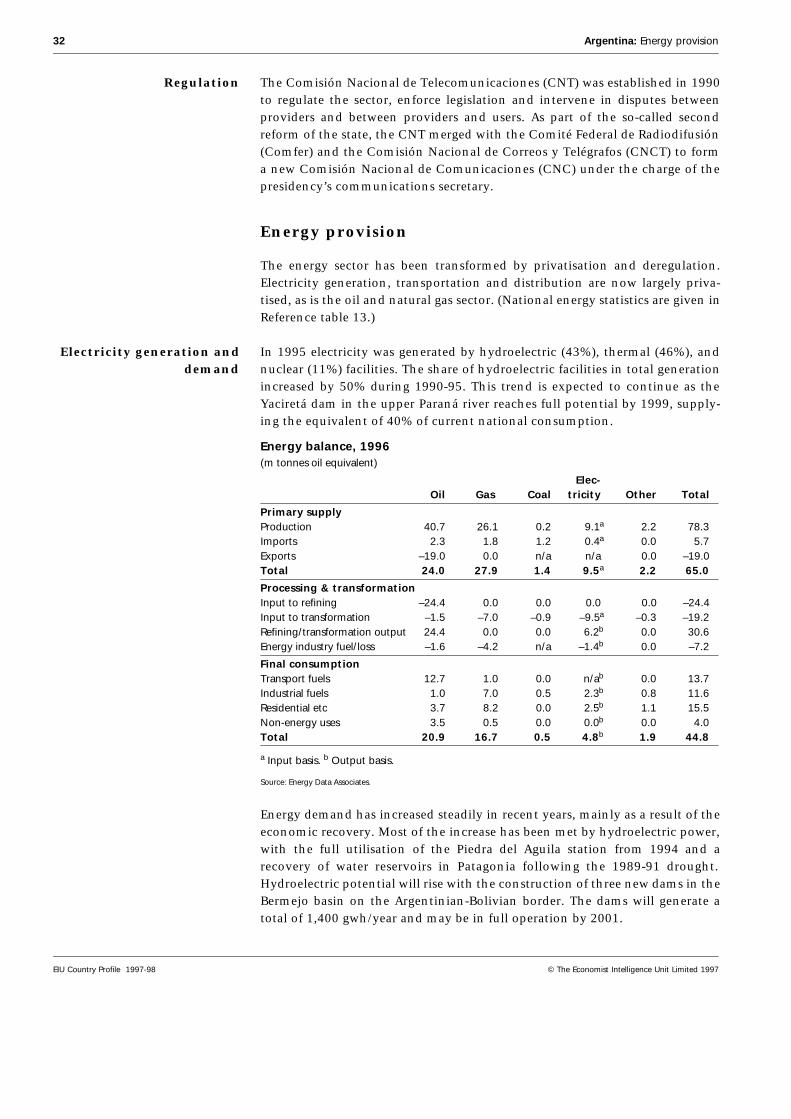
Regulation The Comisión Nacional de Telecomunicaciones (CNT) was established in 1990to regulate the sector, enforce legislation and intervene in disputes betweenproviders and between providers and users. As part of the so-called secondreform of the state, the CNT merged with the Comité Federal de Radiodifusión(Comfer) and the Comisión Nacional de Correos y Telégrafos (CNCT) to forma new Comisión Nacional de Comunicaciones (CNC) under the charge of thepresidency’s communications secretary.
Energy provision
The energy sector has been transformed by privatisation and deregulation.Electricity generation, transportation and distribution are now largely priva-tised, as is the oil and natural gas sector. (National energy statistics are given inReference table 13.)
Electricity generation anddemand
In 1995 electricity was generated by hydroelectric (43%), thermal (46%), andnuclear (11%) facilities. The share of hydroelectric facilities in total generationincreased by 50% during 1990-95. This trend is expected to continue as theYaciretá dam in the upper Paraná river reaches full potential by 1999, supply-ing the equivalent of 40% of current national consumption.
Energy balance, 1996(m tonnes oil equivalent)
Elec- Oil Gas Coal tricity Other Total
Primary supplyProduction 40.7 26.1 0.2 9.1a 2.2 78.3Imports 2.3 1.8 1.2 0.4a 0.0 5.7Exports –19.0 0.0 n/a n/a 0.0 –19.0Total 24.0 27.9 1.4 9.5a 2.2 65.0
Processing & transformationInput to refining –24.4 0.0 0.0 0.0 0.0 –24.4Input to transformation –1.5 –7.0 –0.9 –9.5a –0.3 –19.2Refining/transformation output 24.4 0.0 0.0 6.2b 0.0 30.6Energy industry fuel/loss –1.6 –4.2 n/a –1.4b 0.0 –7.2
Final consumptionTransport fuels 12.7 1.0 0.0 n/ab 0.0 13.7Industrial fuels 1.0 7.0 0.5 2.3b 0.8 11.6Residential etc 3.7 8.2 0.0 2.5b 1.1 15.5Non-energy uses 3.5 0.5 0.0 0.0b 0.0 4.0Total 20.9 16.7 0.5 4.8b 1.9 44.8
a Input basis. b Output basis.
Source: Energy Data Associates.
Energy demand has increased steadily in recent years, mainly as a result of theeconomic recovery. Most of the increase has been met by hydroelectric power,with the full utilisation of the Piedra del Aguila station from 1994 and arecovery of water reservoirs in Patagonia following the 1989-91 drought.Hydroelectric potential will rise with the construction of three new dams in theBermejo basin on the Argentinian-Bolivian border. The dams will generate atotal of 1,400 gwh/year and may be in full operation by 2001.
32 Argentina: Energy provision
EIU Country Profile 1997-98 © The Economist Intelligence Unit Limited 1997
Although in the early 1990s the system had excess capacity as a result of largeinvestments made in the 1970s, maintenance problems and obsolete equipmentcreated severe energy shortages. The situation changed after privatisation.
Electricity privatisation In 1992 privatisation split up electricity generation, transmission and distrib-ution. Most thermal and hydraulic electricity generation stations were priva-tised, with private operators making sizeable investments to address themaintenance backlog. The private sector also invested in new thermal stations(adding about 1 mw) to take advantage of natural gas production.
The electricity transmission system is operated by three private firms organisedon a regional basis and regulated by the public authority. Distribution is alsoprivate. The Ente Nacional Regulador de la Electricidad is responsible for serv-ice control and consumer protection. The wholesale market is administered byCAMMESA, a non-profit organisation composed of representatives from gener-ating, transmission and distribution companies, large users and the energysecretary. Electricity delivered to the market is administered by CAMMESA andis priced on a marginal cost basis. CAMMESA determines the amount of energywhich each generating company delivers to the wholesale market.
Edesur and Edenor, the two distribution companies in the Buenos Aires metro-politan area, have invested more than $1bn to modernise and expand theirnetworks. Although the quality of distribution services has improved, the bulkof the problems are in the sphere of transmission. These may be overcome bythe laying of a fourth transmission line, linking Piedra del Aguila hydraulicstation to Buenos Aires. The new line would raise transmission potential from3,300 mw at present to 4,600 mw in 1999, at a total cost of almost $300m.
The government plans to privatise the bi-national hydroelectric dams Yaciretáand Salto Grande and the nuclear power stations. But many congressmen areopposed to the sale of Yaciretá at a time when it is beginning to generaterevenue. If Congress does not pass the required legislation soon, the authoritiesmay go ahead with a concession, thus bypassing congressional authorisation.
Congress has approved the mechanism to grant a concession to the privatesector for a period of 30 years for the operation of three nuclear power stations(one is still under construction). The law establishes that a minimum of 20%plus one share of Nucleoeléctrica’s capital must remain in the government’shands. The Comisión Nacional de Energía Atómica (CNEA) will retain researchand development activities.
Provincial governments have also made some progress in privatising theirelectricity systems, a case in point being the sale of the Buenos Aires provincialelectricity company to the private sector for a total of over $1bn.
Privatisation in the gasand petroleum sectors
There has also been extensive privatisation in the gas and petroleum sectors.Two companies are engaged in natural gas transportation: Transportadora deGas del Norte and Transportadora de Gas del Sur. There are eight distributioncompanies which distribute gas among consumers in urban centres. EnteNacional Regulador del Gas is the agency in charge of regulating gas transport-ation and distribution. Gas extraction is completely deregulated.
Argentina: Energy provision 33
EIU Country Profile 1997-98 © The Economist Intelligence Unit Limited 1997
Argentina has become an important natural gas supplier to neighbouringcountries, especially Brazil and Chile. In 1997 the joint venture Gas-Andes(formed by Novacorp of Canada and Techint and Companía General deCombustibles of Argentina) completed the building of a gas pipeline betweenMendoza (Argentina) and Santiago (Chile) and started natural gas shipments.The northern region of Chile will also be supplied with Argentinian natural gasthrough a pipeline to be built by Novacorp and CMS Energy of the US. Ship-ments are scheduled to start in 1999.
Argentinian natural gas firms are taking positions to supply the huge Brazilianmarket by the end of the decade. Construction of a natural gas pipeline linkinggasfields in northern Argentina with the São Paulo metropolitan area is beingconsidered. A second pipeline may supply natural gas to thermal electricitygeneration units in southern Brazil.
Financial services
Concentration in thefinancial system
A long tradition of inefficiency and high costs has hindered the developmentof the financial system. Fewer than 10% of Argentinians hold bank accountsand the level of financial intermediation is modest by international standards.Total bank deposits are 20% of GDP, below Mexican and Chilean levels.
In recent years the financial system has undergone a significant restructuring. InDecember 1996 the financial system comprised 146 institutions, 120 of whichwere banks (21 public—mostly provincial—banks, 62 private national banks, 28private foreign banks and 8 co-operative banks). Between December 1994 andDecember 1996 the total number of financial institutions fell by almost one-third as a result of mergers and acquisitions, with provincial public banks,co-operative banks and non-banking institutions being most severely hit.
This sizeable restructuring was stimulated by the Mexican crisis, which forcedmergers and acquisitions and almost brought about the complete privatisationof provincial banks and the disappearance of co-operative banking institutions.But monetary authorities have also contributed through measures aimed tostrengthen the financial system in the event of a new run on capital (such ascapital requirements on market and counterpart risk, higher minimum liquid-ity requirements and reinforced mechanisms for bank supervision).
Faced with the need to increase their capital and liquidity and being subject tocloser scrutiny on the part of the Banco Central de la República Argentina (theCentral Bank), some large domestic banks (such as Banco Río, Banco Francés,Banco de Crédito Argentino, Banco Quilmes and Banco Roberts) decided to sellpart of their capital to foreign institutions. In turn, some wholesale bankinginstitutions that were negatively affected by the 1995-96 financial turmoilrestructured, becoming regional banks, thus taking advantage of the privatis-ation of provincial public banks.
Deposit and creditperformance
Although total bank deposits increased fivefold between January 1991 and late1994, the Mexican crisis led to a 18% contraction only in the first five monthsof 1995. Deposits recovered to pre-crisis levels by the end of the year and byearly 1996 total deposits were higher than in mid-1994. Although the
34 Argentina: Financial services
EIU Country Profile 1997-98 © The Economist Intelligence Unit Limited 1997
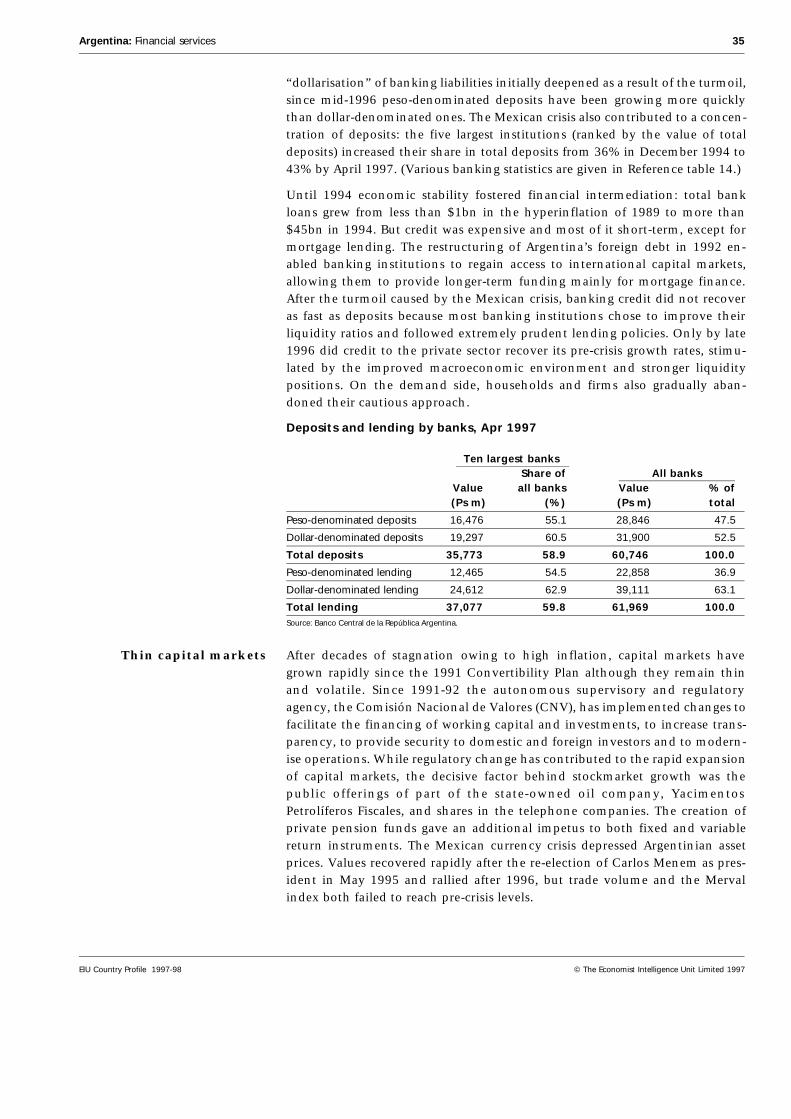
“dollarisation” of banking liabilities initially deepened as a result of the turmoil,since mid-1996 peso-denominated deposits have been growing more quicklythan dollar-denominated ones. The Mexican crisis also contributed to a concen-tration of deposits: the five largest institutions (ranked by the value of totaldeposits) increased their share in total deposits from 36% in December 1994 to43% by April 1997. (Various banking statistics are given in Reference table 14.)
Until 1994 economic stability fostered financial intermediation: total bankloans grew from less than $1bn in the hyperinflation of 1989 to more than$45bn in 1994. But credit was expensive and most of it short-term, except formortgage lending. The restructuring of Argentina’s foreign debt in 1992 en-abled banking institutions to regain access to international capital markets,allowing them to provide longer-term funding mainly for mortgage finance.After the turmoil caused by the Mexican crisis, banking credit did not recoveras fast as deposits because most banking institutions chose to improve theirliquidity ratios and followed extremely prudent lending policies. Only by late1996 did credit to the private sector recover its pre-crisis growth rates, stimu-lated by the improved macroeconomic environment and stronger liquiditypositions. On the demand side, households and firms also gradually aban-doned their cautious approach.
Deposits and lending by banks, Apr 1997
Ten largest banks Share of All banks
Value all banks Value % of(Ps m) (%) (Ps m) total
Peso-denominated deposits 16,476 55.1 28,846 47.5
Dollar-denominated deposits 19,297 60.5 31,900 52.5
Total deposits 35,773 58.9 60,746 100.0
Peso-denominated lending 12,465 54.5 22,858 36.9
Dollar-denominated lending 24,612 62.9 39,111 63.1
Total lending 37,077 59.8 61,969 100.0Source: Banco Central de la República Argentina.
Thin capital markets After decades of stagnation owing to high inflation, capital markets havegrown rapidly since the 1991 Convertibility Plan although they remain thinand volatile. Since 1991-92 the autonomous supervisory and regulatoryagency, the Comisión Nacional de Valores (CNV), has implemented changes tofacilitate the financing of working capital and investments, to increase trans-parency, to provide security to domestic and foreign investors and to modern-ise operations. While regulatory change has contributed to the rapid expansionof capital markets, the decisive factor behind stockmarket growth was thepublic offerings of part of the state-owned oil company, YacimentosPetrolíferos Fiscales, and shares in the telephone companies. The creation ofprivate pension funds gave an additional impetus to both fixed and variablereturn instruments. The Mexican currency crisis depressed Argentinian assetprices. Values recovered rapidly after the re-election of Carlos Menem as pres-ident in May 1995 and rallied after 1996, but trade volume and the Mervalindex both failed to reach pre-crisis levels.
Argentina: Financial services 35
EIU Country Profile 1997-98 © The Economist Intelligence Unit Limited 1997

Comparative economic indicators, 1996
0 100 200 300 400
Brazil
Mexico
Argentina
Colombia
Chile
Venezuela
Peru
Ecuador
Uruguay
Paraguay
Bolivia
Gross domestic product$ bn
Sources: EIU estimates; national sources.
749.1749.1749.1749.1749.1749.1749.1749.1
0 2,000 4,000 6,000 8,000 10,000
Argentina
Uruguay
Chile
Brazil
Mexico
Venezuela
Peru
Colombia
Paraguay
Ecuador
Bolivia
Gross domestic product per head$
Sources: EIU estimates; national sources.
-20 -10 0 10 20 30 40
Venezuela
Mexico
Uruguay
Ecuador
Brazil
Bolivia
Peru
Paraguay
Chile
Argentina
Colombia
Consumer prices% change, year on year
Sources: EIU estimates; national sources.
100100100100100100
0.40.4
100100100
0.4
-2 0 2 4 6 8
Chile
Mexico
Uruguay
Argentina
Bolivia
Brazil
Peru
Colombia
Ecuador
Paraguay
Venezuela
Gross domestic product% change, year on year
Sources: EIU estimates; national sources.
36
EIU Country Profile 1997-98 © The Economist Intelligence Unit Limited 1997

Recent capital market developments
1991-92: Elimination of fixed commissions for agents operating in the market andreduction of charges levied upon stockmarket transactions. Elimination of stamp andtransfer taxes. Standardisation of no tax on capital gains at national level. Commoninformation and reporting requirements for all markets operating in the country. Theuse of insider information is prohibited and public disclosure of company holdings ofdirectors and representatives is mandatory. Company reporting formats simplified tofacilitate interpretation of balance sheets.November 1992: Authorisation to issue commercial paper. Companies must obtaincredit ratings from two private and independent firms.July 1992: Minimum capital requirements for firms operating in the stockmarket.1993: Authorised companies permitted access to international capital marketsthrough the issuance of American Depository Receipts.December 1994: Securitisation of financial assets allowed.1997: Authorisation to quote foreign firms’ shares through the issuance ofCertificados de Depósito Argentino.
An open and concentratedmarket
The government has removed all investment barriers to encourage inflows intodomestic capital markets. Entering, trading and leaving the market are allstraightforward: there are no exchange controls or registration requirementsand capital gains and dividends are not taxed. Brokers’ commissions are fixedcompetitively and there are no sectoral restrictions on foreign investors. Thishas made Argentina’s capital markets among the most open in the world. SinceSeptember 1997 foreign firms can be quoted on the Buenos Aires stock ex-change through new instruments—Certificados de Depósito Argentino firms. Thenew instruments may be included in pension funds’ portfolios, which havegrown rapidly in recent years.
Although market capitalisation increased in the 1990s as a result of rising shareprices and the flotation of large privatised public utilities, five stocks account forthree-quarters of the total and liquidity can be a problem for trading in theshares of all but the largest companies. The total number of listed companies hasnot increased, partly because many Argentinian firms are family owned andprefer to borrow rather than raise capital by issuing equity. In the early 1990safter hyperinflation virtually eliminated their debts, companies had consider-able room to borrow, particularly following new regulations easing the issuanceof debt instruments. (Stockmarket indicators are given in Reference table 15.)
There are plans under way to launch a futures and options market, but thefeasibility of this is uncertain. Although the plan is to create a wide variety ofoptions, it may prove difficult to attract international investors to a small,traditional and concentrated market.
Rapid growth ofinvestment—
Since 1995 investment funds have been growing very rapidly. While in late1994 they administered a total of $390m, two years later their size had in-creased more than fourfold to reach $1.9bn. Growth continued at a brisk pacein 1997, to reach nearly $4bn by mid-year and an estimated $7.2bn by year-end. If these projections materialise, by late 1997 investment funds will admin-ister a volume of resources higher than that of pension funds.
38 Argentina: Financial services
EIU Country Profile 1997-98 © The Economist Intelligence Unit Limited 1997

Interestingly, the growth of investment funds has not been a result of theinterest of pension funds or international investors, but of small and medium-sized investors who have been successfully induced by banks to transfer theirsavings from savings accounts and term deposits to more profitable investmentfunds.
—and pension funds In their first three years of existence pension funds have reached a membershipof more than 5.6m, with $6.6bn in total funds managed. By early 1997 profit-ability averaged an impressive 20.3% per year. So far pension funds have chan-nelled most of their resources into purchases of public-debt instruments(52.7%). But stocks have increased their share significantly, from 6% in late1995 to over 19% one year later. Term deposits had the reverse performance,with their share contracting from 28% when the system was launched to 14% inlate 1996. By 2000 pension funds are expected to manage resources worth $20bn.
Reorganisation of thepublic-debt market
Hyperinflation severely disrupted the domestic public-debt market. Between1991 and 1994 the government obtained fresh funds almost exclusively inforeign markets: purchasers were frequently Argentinian residents. In 1996 thegovernment took the first steps to recreate a domestic public-debt market. Newdebt instruments similar to those in developed country markets—short-termbills (Letes) and medium- and long-term bonds (Bontes)—were created. To in-crease the liquidity of debt instruments—traditionally a problem—market-makers were created and appointed. Regular sales went ahead, in accordancewith the budget requirement that a proportion of public debt should be placedin the domestic market.
Insurance diversifies The insurance market has grown and changed rapidly since 1989. Until 1995the rise in sales (15% per year) was associated with the increase in new car salesand new regulations making life insurance more attractive (such as the author-isation to issue dollar-denominated policies). The creation of pension fundswas another stimulus, as members are forced to buy disability and life insur-ance. The growth cycle ended in 1995 when insurance sales contracted by5.6%, but the upward trend recovered after mid-1996. Insurance contracts mayincrease by more than 10% in 1997. About 40% of the insurance market isaccounted for by car insurance, with life and retirement insurance contributing30% and accident insurance an additional 10%.
There is no public-sector reinsurance monopoly and foreign firms receive thesame treatment as national ones. Prices and conditions are freely set by con-tracting parties. In mid-1994 the government authorised a wide range of busi-nesses to sell consumer policies and banks to collect premiums, in an effort toreduce high broking costs. Capital requirements were also raised for insurancefirms. But the authorities plan a major reform of the regulatory framework,which requires modernisation after decades of heavy regulation.
The Mexican crisis accelerated concentration in the insurance market. Since1991 a total of 61 insurance firms have closed down, while more than 20 are indifficulties. Presently the ten largest insurance groups hold 46% of the market,which is an increase of almost 6 percentage points in just two years. Foreignfirms, mainly from the US, have been moving rapidly into the industry.
Argentina: Financial services 39
EIU Country Profile 1997-98 © The Economist Intelligence Unit Limited 1997
Arrivals include Metropolitan Life, General American, Leucadia National, AIGand Eagle Star.
In mid-1996 the government had instituted a regime of compulsory labourrisks insurance. Specialised firms, Aseguradoras de Riesgos del Trabajo (ART), werecreated for a market estimated to reach an annual total of $1.2bn. The markethas undergone a rapid process of consolidation: seven out of 44 firms left thesystem in just one year. By mid-1997 ARTs had a total membership of 4m.
Other services
Tourism expands A rapid rise in the number of foreign visitors in recent years (see Reference table 16)has made Argentina the favourite destination in South America and the fourthmost popular in the continent. Its attractions include beautiful natural scenery,good hotels and medical services and relatively minor security problems. Domestictourism is relatively underdeveloped considering the average income per head.Argentinians devote only slightly over 3.1% of consumption spending to traveland tourism. In 1996 income generated from tourism exceeded $4bn.
There are over 4,800 hotels, with a total capacity of 141,000 rooms. Some 10%of the total number of establishments are in the three- to five-star category. Tomeet a rising demand for first-class accommodation, a number of internationalhotel chains have opened in Buenos Aires, while others have acquired aninterest in existing firms. In the last four years total investment in hotels andtime-share facilities reached $2bn, 20% of which was foreign. Winter ski resortsin the Andean range have become a major attraction for foreign investors,which now control the largest share of the business.
Projections of a continuing flow of tourists have led to new investment plansin infrastructure. The growing importance of the sector is reflected in theproposed upgrading of the tourism secretary to ministerial level in 1996, adecision still to be realised.
Restructuring of the retailsector
Previously organised around small, specialised and owner-operated shops, re-tail trade has been transformed by the emergence of large retail outlets. Parallelto this transformation, new commercial mechanisms such as franchising, tele-marketing and catalogue sales have increased rapidly. In 1996 supermarketswere responsible for 65% of total food sales, compared with only 43% in 1984.Financed by both domestic and foreign capital, supermarkets have expanded inlarge urban centres such as Buenos Aires, Córdoba and Mendoza, with eightchains sharing most of the turnover.
So far supermarket growth has been at the expense of small retail shops, butcompetition among large self-service stores is intensifying. More recently, thelarger supermarket chains have been purchasing smaller chains in the metro-politan area, probably stimulated by new proposals to regulate the estab-lishment of new outlets in the province of Buenos Aires. Notwithstanding thisdevelopment, Argentina remains a country with a fairly low level of retail tradeconcentration, with a rate of 3.8 shops per 1,000 inhabitants. Official statisticsestimate a total of 34,500 wholesale shops and almost 400,000 retail shops.
40 Argentina: Other services
EIU Country Profile 1997-98 © The Economist Intelligence Unit Limited 1997

Production
Manufacturing
Protection is left behind Manufacturing expanded rapidly until the late 1970s, behind protective barri-ers. The result was a diversified manufacturing base in which multinationalsplayed a leading role, but which was oriented to the domestic market. In thelate 1970s a combination of trade liberalisation and an appreciating domesticcurrency caused a sharp contraction in manufacturing capacity. By the onset ofthe 1982 debt crisis, the structure of manufacturing had changed dramatically:metal industries had lost their leading role and the processing of raw materials(such as oilseeds) and the production of standardised intermediate goods(which expanded rapidly under the stimulus of special promotional regimes)had grown in importance. Many foreign firms abandoned the country whiledomestically controlled diversified conglomerates expanded.
Productivity increasesafter the economic reforms
The Convertibility Plan and the structural reforms launched at the beginningof the 1990s transformed the sector. Between 1990 and 1996 manufacturingGDP increased by almost one-third, led by consumer durables (mainly cars andhousehold appliances), some intermediate goods linked to the automotive andconstruction industries, and non-durables. In contrast, output of capital goodsand some intermediate goods (such as textile inputs, mineral chemicals andpetrochemicals) contracted.
The recovery in industrial production in 1991-96 was accompanied by a rapidrise in productivity and by improved organisational and managerial tech-niques and new technologies. Labour productivity in manufacturing in 1996was 57% higher than in 1990. In the context of a more open internationaleconomy, manufacturing firms seem to be undergoing a process of intra-industry specialisation whereby they import more inputs, reduce the numberof production lines and expand production runs to gain economies of scale.
A revival of foreign investment has been an important factor in raising prod-uctivity. In the late 1980s foreign investment was stimulated by the capital-isation of external liabilities and, in the early 1990s, by structural reforms,rapid growth of domestic demand and the prospect of easier access to regionalmarkets. A large share of new foreign investment in tradeables has been chan-nelled to the automotive and food industries. Meanwhile, some domesticmanufacturing firms (mainly in the food and oil industries) have expandedabroad, mostly in the subregional market. In many cases internationalisationin the regional market coincides with a restructuring process in which the firmsinvolved abandon peripheral lines of business to concentrate on core activities.(Detailed manufacturing statistics are given in Reference tables 17-20.)
Argentina: Manufacturing 41
EIU Country Profile 1997-98 © The Economist Intelligence Unit Limited 1997

The manufacturing sector(1984=100 unless otherwise indicated)
% change 1996 1996/90 1996/95
Industrial output index 112.1 23.2 5.1
Non-durable consumer goodsFood 125.3 23.7 2.0 Beverages 117.3 41.0 1.8 Tobacco 100.6 18.6 –0.2
Intermediate goodsAgrochemicals 151.6 23.5 19.6 Mineral chemicals 105.6 –19.2 –4.5 Plastic & rubber inputs 139.8 10.4 –0.7 Iron & steel 157.6 38.7 8.6 Aluminium 134.8 12.2 0.1 Petrochemicals 98.3 –3.1 7.7 Tyres 141.7 51.1 5.8 Processed petroleum 100.3 2.9 5.0 Textile inputs 93.5 –11.0 7.7 Cement 98.1 43.2 –6.3 Paper & cellulose 121.1 19.3 7.1
Durable consumer goodsElectrical household appliances 121.3 90.4 –4.5 Automobiles 177.5 305.5 7.1 Non-electrical household appliances 82.9 83.0 18.6 Tractors 55.3 10.4 65.6 Capital goods inputs & capital goods 28.0 –34.9 23.3
Exports of manufactures ($ m)Agricultural 8,425.6 80.7 12.7Industrial 6,456.3 91.9 –0.7Manufacturing productivity index (1982=100) 175.1 57.5 6.5Manufacturing employment (1990=100) n/a –14.0a –6.1b
Hours worked (1990=100) n/a –10.7a –6.0b
Memorandum itemShare of manufacturing output in GDP (constant prices; %) 24.5 – –
a 1995/90. b First semester of 1996 over year-earlier period.
Sources: INDEC; Carta Económica; Fundación de Investigaciones Económicas para Latinoamericanas (FIEL).
Foreign investment
Foreign investment regulations are as follows.• No registration requirements.• Free repatriation of capital and profit remittances.• Unrestricted access to foreign exchange and no discrimination against foreigninvestors.• No performance requirements.• Equal tax treatment.• Few sectors restricted (mass media, real estate in border regions, nuclear powergeneration).
42 Argentina: Manufacturing
EIU Country Profile 1997-98 © The Economist Intelligence Unit Limited 1997
Sectoral and “horizontal”policies
Privatisation has reduced the public sector’s role in production, particularly inintermediate goods sectors, such as steel, petroleum and petrochemicals. Thegovernment rejects the idea of a proactive industrial policy. Fiscal considera-tions have only added to this predicament. In effect, the modest “horizontal”initiatives implemented in the early 1990s—the most important of which wasthe Régimen de Especialización Industrial (the Industrial Specialisation Regime)launched in 1992 to allow firms to import finished goods or parts at preferen-tial tariff rates in exchange for a commitment to increase exports of similargoods—were suspended in 1996. Similarly, tariff import rates for capital goodswere raised from zero to 10% in 1996 to increase tax revenue. Although somefirms still enjoy the benefits of industrial promotional schemes that were im-plemented in the 1970s and 1980s and suspended in 1991, they have beenlargely curtailed.
The most important sectoral programme is for cars and autoparts. The regimeprotects the domestic market with import quotas and authorises establishedmanufacturers to import finished cars and parts at preferential tariff rates inexchange for investment and export commitments. The programme is contrac-tual and is due to expire in 1999.
Finance remains scarceand expensive
Commercial banks’ credit is short-term and expensive, and access has beenuneven across sectors. Whereas small and medium-sized firms must rely onself-finance and suppliers’ credits even for the short term, large domestic firmsand subsidiaries of multinationals can raise money in the corporate bondmarket. Larger firms also have access to international capital markets, wherecosts are lower. Public-sector banks do not play an important role in financingthe industrial sector or exporters. There are programmes geared to improvingsmall and medium-sized business access to bank credit, such as the ReciprocalGuarantee Partnerships programme, but they have made a modest impact.Other programmes aim to encourage the development of supplier and pro-ducer centres, business support structures and export capabilities, but theygenerally have modest resources. The Banco de Inversión y Comercio Exterior(BICE), set up in 1992 to finance foreign trade and foreign trade-related invest-ment, has passed largely unnoticed.
The automotive industry The automotive industry was established in Argentina in the 1950s and thriveduntil the mid-1970s in a highly protected domestic market. Trade liberalisationproduced a major shake-out in the late 1970s with many firms (such as GeneralMotors and Chrysler of the US and Citroën of France) leaving the country. Bythe early 1990s car manufacturing was controlled by subsidiaries of Ford of theUS and Volkswagen of Germany and by two domestically controlled firmsproducing under licence agreements with Renault of France (CIADEA) and Fiatof Italy and Peugeot of France (SEVEL). Fiat Iveco, Scania of Sweden andMercedes-Benz of Germany produced commercial vehicles.
In recent years the automotive sector has undergone a major restructuring.General Motors, Chrysler and Toyota of Japan entered or returned to themarket, while Fiat, Peugeot and Renault (who operated under licence agree-ments with domestic firms) regained control of their local facilities as part oftheir international policy. Established manufacturers have specialised in
Argentina: Manufacturing 43
EIU Country Profile 1997-98 © The Economist Intelligence Unit Limited 1997

producing a small number of models for domestic and export markets (mainlyBrazil). Specialisation is also taking place among autopart producers, where ashare of the new investment has been geared towards export markets. Leadingautopart makers such as the US Tenneco, Nippondenso of Japan, Marelli andMagnetto of Italy and Valeo of France have established greenfield facilities inrecent years. The process of regional integration and the establishment of aunified car market with Brazil have been key factors in this process of industrialreorganisation. For car manufacturers located in Argentina, involvement in theMercado Comun del Sur (Mercosur) customs union means a fourfold increasein market size.
Between 1990 and 1994 car output increased fourfold, helped by rapid demandgrowth and the special sectoral regime. This was accompanied by a marked risein productivity: between 1990 and 1994 units produced per employee almosttrebled from 6 to 16 per year, with the number of man-hours worked per unitproduced falling from 209 to 118.
In 1995 the sharp contraction of domestic demand severely affected the auto-motive industry, although the slowdown was softened by rapidly growingexports (which trebled in value between 1994 and 1996 to absorb over one-third of total domestic output in 1996). Since late 1996 sales to the domesticmarket have been on the rise again.
The food industry Although the food industry has not grown rapidly in recent years, except forsubsectors such as beer and confectionery, it has great potential owing tolow-cost natural resources and free access to the large Brazilian market. Agro-industrial activities contribute almost one-quarter of total industrial valueadded and more than one-third of total exports. Traditionally dominated byfamily-owned firms, in recent years the industry has witnessed the arrival oflarge multinationals such as Nabisco, Parmalat, Philip Morris, Cadbury-Schweppes and Danone. More recently, Chilean and Brazilian firms have estab-lished facilities in Argentina, mainly in the beverages sector. Some local firms(such as Molinos Río de la Plata, Sancor and Arcor) have also increased theirinvestments abroad, particularly in neighbouring countries.
The steel industry Since the early 1990s the structure of the steel sector has changed dramaticallyas a result of the privatisation of SOMISA and Altos Hornos de Zapla andindustry concentration. Currently, one of the largest domestic private groupswith plants in Argentina, Italy and Mexico, Techint, controls 30% of theworld’s seamless tubes market. In 1990 the total number of employees in thesteel sector was 30,730; by the mid-1990s the figure had halved. The number ofestablishments also fell, with most of the output concentrated in four largeintegrated steel mills which between 1991 and 1995 invested almost $600m inrestructuring. As a result of productivity gains, the number of hours worked toproduce 1 tonne of steel halved from 14.8 in 1990 to 7 in 1995.
Production costs are higher than in Brazil but Argentinian steel mills benefitfrom proximity to domestic users and concentration in specialised productswith higher value added. Between 1990 and 1996 growth in steel output wasdriven by domestic demand, mainly from the automotive and constructionindustries.
44 Argentina: Manufacturing
EIU Country Profile 1997-98 © The Economist Intelligence Unit Limited 1997

The petroleum industry Since 1991 the petroleum and gas industries have been transformed by privatis-ation and deregulation. Argentina has traditionally been self-sufficient in oilproduction and has turned into an exporting country in recent years, withneighbouring Brazil and Chile the natural markets. For petroleum firms, con-solidating their stance in the natural gas market has become critical taking intoconsideration the consumption potential of the Brazilian market. YacimentosPetrolíferos Fiscales (YPF), the former state petroleum company, extracts ap-proximately 43% of total oil production, while the rest is supplied by privatedomestic and foreign firms (the largest being Pérez Companc, Petrolera SanJorge, US Amoco, Astra, Total Austral, Tecpetrol, Quintana, Bridas, Mexpetroland Pluspetrol). YPF also dominates the market in downstream activities.
Petroleum extraction expanded by nearly 60% between 1990 and 1996, butrefining increased by only 3%. The rise in petroleum output translated intolarger exports, mostly to Brazil and Chile. In 1996 total oil exports reached$2.3bn, equivalent to almost 40% of total output. Although sales of derivativesabroad have also increased, high transport costs and domestic regulations inimporting countries (mainly Brazil) have prevented Argentina from exportinga greater share of downstream products.
Argentinian petroleum companies have been expanding into other SouthAmerican countries, particularly those where the private sector is being openedup (such as Venezuela, Peru and Bolivia). YPF is establishing service stationnetworks in Chile and Peru and is taking part in exploration and extractionactivities in Bolivia, Peru, Ecuador and Venezuela. YPF has also signed co-operation agreements with Petrobrás of Brazil, with an eye on the largeBrazilian domestic market. New foreign firms (such as Repsol of Spain) haveentered the domestic market through the purchase of local firms or co-operation agreements.
Mining and semi-processing
Although Argentina has considerable mining potential, this sector (excludinggas and petroleum) contributes only 0.3% to GDP. The most important metalmining products are zinc, gold, silver, lead, uranium and copper. Iron-oreextraction has fallen precipitously as a result of the closure of high-cost mines.Argentina lacks a mining tradition, although it displays geological char-acteristics similar to neighbouring countries with more developed miningactivities, such as Bolivia, Chile and Peru. Most metal mining reserves arelocated in the Andes mountain range in the western part of the country. Thereare large copper and gold deposits in Catamarca and San Juan provinces, ura-nium deposits in Mendoza and zinc deposits in Jujuy. (Mineral and quarryingoutput statistics are given in Reference table 21.)
There is currently an upsurge of foreign investment in the mining sector,particularly by Canadian, US, Australian and South African firms. The newregulatory framework enacted in 1993 removes restrictions on foreign invest-ors, guarantees fiscal stability for 30 years and a 3% ceiling on the annualroyalty paid to provincial governments, allows accelerated depreciation offixed investments and applies zero tariffs to capital goods imports. The
Argentina: Mining and semi-processing 45
EIU Country Profile 1997-98 © The Economist Intelligence Unit Limited 1997

measures have stimulated considerable foreign investment interest, with anestimated $1.1bn invested during 1992-96. New investment for 1997-2000 isestimated to reach an annual average of $640m. This upsurge in foreign invest-ment is expected to treble mining output by 2000, raising exports from $45min 1996 to almost $1bn by 2000. Bajo la Alumbrera—currently in the construc-tion phase—is the largest mining project in Argentina’s history. By 2000 thesite is expected to become the world’s ninth largest copper mine and 15thlargest gold mine.
Major planned investment in the mining sector
Investment Annual output StartingProject Mineral Province ($ m) ($ m) date
Bajo la Alumbrera Gold/copper Catamarca 900 460 1997
Salar del Hombre Muerto Lithium Catamarca 110 45 1997
Cerro Vanguardia Gold/silver Santa Cruz 197 120 1998
Potasio Río Colorado Potassium salt Neuquén 150 120 1998
El Pachón Copper San Juan 700 240 2000Source: Subsecretaría de Minería.
Agriculture, forestry and fishing
Agriculture, livestock, forestry and fishing contributed 7.2% of GDP in 1996.However, as many processed raw materials are not included in the calculation,this figure underestimates the economic importance of the sector. Further-more, about 60% of total exports are agricultural or agroindustrial goods. Interms of output, the primary sector performed poorly under the ConvertibilityPlan: between 1990 and 1996 total output increased by only 15% comparedwith a 40% expansion of total GDP. Fishing bucked the trend, with the totalcatch and exports expanding rapidly. (Agricultural data are given in Referencetables 22 and 23.)
Output and exports of key crops, 1996/97a
(’000 tonnes)
Output Exports
Wheat 15,983 10,500
Maize 14,496 9,500
Soybeans 11,013 1,800
Sorghum 2,552 800
Sunflower 5,021 1,800
a Estimates.
Source: Secretaría de Agricultura, Ganadería, Pesca y Alimentación.
Argentina is well endowed with natural resources, and with a climate rangingfrom subtropical to subarctic it can produce a wide variety of agriculturalproducts. Furthermore, the pampas, the heart of Argentinian temperate agri-culture (cereals and oilseeds), is among the most fertile land in the world.Industrial crops are mostly cultivated outside the pampas, particularly in thenorth-west (sugar cane and tobacco) and north-east (cotton, tobacco and tea).Fruit production is spread countrywide, the most important districts being
46 Argentina: Agriculture, forestry and fishing
EIU Country Profile 1997-98 © The Economist Intelligence Unit Limited 1997
Mendoza (grapes, peaches and plums), Río Negro and Neuquén (apples, pearsand grapes) and Tucumán and Corrientes (citrus).
Agricultural outputexpands rapidly
In the 1996/97 season about 26.3m ha were sown, mainly with cereals (14.9mha) and oilseeds (10.1m ha) for a total estimated record production of 52.8mtonnes (20% over the previous season). Total cereals output is estimated to reach35.1m tonnes in 1996/97, composed mostly of wheat (16m tonnes) and maize(14.5m tonnes). The emergence of oilseeds (soybeans and sunflowers) as impor-tant crops in the late 1970s has transformed agriculture. Presently, oilseedscontribute almost one-third of total agricultural production. In recent years theuse of fertilisers and pesticides has expanded rapidly, raising yields. Oilseeds andprocessed products contributed almost $5.2bn in export earnings in 1996 (22%of total sales abroad). Cereal exports amounted to $2.6bn in 1996.
In late 1995 and in 1996 contracting world stocks and adverse weather condi-tions in the US pushed prices upwards, boosting export earnings. Althoughthese price trends may not be sustainable, the medium- and long-term pros-pects for agricultural activity should benefit from rising world food demandand the gradual dismantling of subsidies in Europe and the US.
Livestock and meat Livestock and meat production are important economic activities. In the early1990s the sector suffered from low world prices and intense competition ininternational markets. In 1995 it was further affected by the fall-out of thebovine spongiform encephalopathy (BSE, or Mad Cow Disease) outbreak inEurope. Cattle production has been also been affected by the rise in the price ofagricultural products, which has displaced cattle breeding to more marginalregions.
Cattle stocks (50.9m in 1996) have been recovering slowly after a sharp con-traction in the second half of the 1980s. Two years with no outbreak of foot-and-mouth disease has qualified Argentinian fresh meat to enter new marketsin the developed world, such as the US. This in turn may open up the largemarket potential of Asia. In 1996 exports of meat and meat preparationsreached $1.1bn. The future potential of the meat industry is stimulating asignificant restructuring of the sector.
The number of sheep has continued to decline from an average 31.5m in1979-81 to 14.3m in 1996. A volcano catastrophe in 1991 and adverse weatherconditions since 1994 have been responsible for the decrease. Wool exportsremained depressed in 1991-93 but began to recover in 1994. In 1995-96 woolexports reached an annual average of $190m.
Dairy production has been one of the most dynamic primary activities in1990-96, recording average annual growth of 6.1%. Modernisation loweredcosts and raised competitiveness, contributing to rapid export growth (mainlyto neighbouring markets). Poultry also expanded but pork production hassuffered from foreign competition.
Higher prices stimulatetechnological upgrading
A high level of debt (nearly $8bn) is a major burden to the agricultural sector,particularly for small and medium-sized producers which are technologicallybackward. In response the authorities have launched programmes offering
Argentina: Agriculture, forestry and fishing 47
EIU Country Profile 1997-98 © The Economist Intelligence Unit Limited 1997

technical, social, financial and organisational assistance to rural producers.They have also implemented a comprehensive plan to restructure all produc-ers’ liabilities with the Banco de la Nación Argentina, which holds the bulk ofagricultural debt. Higher agricultural prices in 1995-96 have improved thefinancial plight of rural producers, stimulating a process of technological up-grading. The use of fertilisers and pesticides has increased substantially, as havepurchases of new machinery, the implementation of new cultivation tech-niques (direct seeding) and the introduction of irrigation machinery.
The agricultural sector has undergone a concentration into larger units. Newbusiness organisations, such as agricultural investment funds and seedingpools, manage an estimated 10% of the most productive lands in the pampas.They have plentiful funds and benefit from economies of scale and improvedtechnology and management. Foreign investors have been playing an impor-tant role.
Government policies havebeen overhauled
Government policies towards the sector have been overhauled since the early1990s. All export taxes have been eliminated, key transport networks—such asthe Buenos Aires-Bahía Blanca railway—have been privatised, as have grainelevators and port facilities. Furthermore, the sector was completely deregulatedwith the removal of foreign-exchange controls and the elimination of theNational Grains Board and the National Meat Board. Trade liberalisation re-duced the cost of imported inputs and machinery. Yet more recently fiscalconstraints have led the government to take measures which have had negativeeffects upon agricultural producers (such as the increase in the oil tax, thereduction in export tax rebates and the increase in capital goods tariffs in 1996).
Overall, the Argentinian agricultural sector is set to gain from trade throughthe Mercado Común del Sur (Mercosur) customs union, in particular free accessto the Brazilian market, to which it can supply grains, meat and dairy produce.Some crops, such as sugar cane, will suffer from Brazilian competition. Theoutcome of the Uruguay Round of the General Agreement on Tariffs and Trade(GATT, now the World Trade Organisation, WTO) has been broadly beneficial,although progress was much slower than expected by Argentinian negotiators.The most significant achievement has been to include agriculture in the inter-national trade regime. A recently signed agreement on mutual recognition ofveterinary and phytosanitary regulations with the European Commission mayboost bilateral trade.
Forestry Forestry contributes an estimated 1% of GDP. Argentina’s comparative advan-tages in the sector have not been exploited. Although planting has increasedrapidly in the last two decades, at 800,000 ha the planted area is just 5% of itspotential. The national and provincial governments provide incentives forforestry development. Exploitation is concentrated in Misiones, Entre Ríos,Buenos Aires and Corrientes.
In 1995 the government launched the Plan Nacional de Desarrollo Forestal (thenational forestry development plan) to attract investment and produce a five-fold increase in the planted area by 2001. The purported regulatory frameworkis similar to that of the mining sector. Foreign investment projects under wayin the forestry sector amount to an estimated $900m. The authorities have also
48 Argentina: Agriculture, forestry and fishing
EIU Country Profile 1997-98 © The Economist Intelligence Unit Limited 1997
expanded the coverage of the programme which provides subsidies to newplantations (created in 1992) and have announced the submission to Congressof a new bill to regulate the sector and transform the new framework into law.
Fishing expands rapidly The total fish catch has trebled in the last decade, to reach 1.23m tonnes in1996. Of the total catch, almost 75% is fish (mainly hake), squid and prawnaccounting for much of the rest. Export growth has been particularly strong,with exports reaching a total of almost $1bn in 1996, almost three times the1990 level. Squid has been the fastest-growing export item, generating revenueof more than $290m in 1996. Main destination markets have been Japan andSpain. It is expected that exports will level off because sales to Asian countrieshave reached quota levels and products have low value-added (fish is filletedand frozen only).
The fishing regulatory regime establishes that resources in the Argentinianmaritime zone (320 km around its coastline) may only be exploited by vesselsflying the Argentinian flag and with prior permission. A special fisheries accordwith the EU grants EU fleets the right to fish in the 320-km reserved zone inexchange for a 50% reduction in the EU import tariff on Argentinian fishingproducts, new investment in the fleet and onshore plants, and financial con-tributions to the scientific and technological development of the sector. Risingfishing activity in the South Atlantic has reduced stocks, and the Argentiniangovernment is searching for ways to foster conservation beyond the 320-kmeconomic zone.
Construction
In a radical departure from the depressed levels at the turn of the decade, in1990-94 the construction sector recorded average annual growth of 17.1%. The1995 economic slowdown severely depressed construction activity once more.Scarce credit and households’ fear of borrowing led to an 10.9% contraction inactivity. Yet in 1996 construction began a slow recovery, with output expand-ing by 1.1%. This performance took the constant price share of construction inGDP to 5.5% in 1996, compared with 4.6% in 1990.
The expansion in residential construction between 1990 and 1996 reflected therelease of pent-up demand and the reappearance of mortgage credit at increas-ingly favourable terms. Initially, residential construction focused on units forhigh-income families but eventually medium-priced units became the mostdynamic sector. Construction activity has also been stimulated by the buildingof new shopping centres, hotels and the renewal of petrol station networks.The privatisation of public utilities and services, which has frequently involvednew investment commitments, improvements in road infrastructure and tele-communications, and large urban projects—such as the renovation of PuertoMadero docklands in Buenos Aires—have also contributed. A credit pro-gramme backed by securitised mortgages came into operation in 1996, withestimated total credits of $800m that year and $1.2bn in 1997. With the re-sources obtained by the sale of the Banco Hipotecario Nacional (national mort-gages bank) the government plans to create a trust fund to financeinfrastructure spending countrywide. The authorities are also considering
Argentina: Construction 49
EIU Country Profile 1997-98 © The Economist Intelligence Unit Limited 1997
increasing the flexibility of procurement mechanisms to facilitate infrastructu-ral investment, particularly in the roads network. In addition to improvingground connections, the authorities would like to see a reduction in doubledigit unemployment rates taking place as fast as possible (Construction statis-tics are given in Reference table 24.)
The external sector
Merchandise trade
Foreign trade, 1996($ m unless otherwise indicated)
Exports fob 23,774 Manufactures of agricultural origin 8,426 Manufactures of industrial origin 6,456 Primary products 5,810 Petroleum products 3,082
Imports cif –23,732 Capital goods, parts & accessories 9,698 Intermediate goods 8,398 Consumption goods 3,581 Petroleum products 845 Passenger vehicles 1,199 Others 12
Trade balance 42 Balance with Brazil 1,296 Balance with US –2,777 Balance with EU –2,340
Exports (% growth)Value 13.6Volume 6.1Unit value 7.0
Imports (% growth)Value 18.1Volume 19.2Unit value –1.0
Purchasing power of exports in 1993 dollars (1993=100) 171.4
Terms of trade (1993=100) 109.9Source: INDEC.
A remarkable externaladjustment
Notwithstanding rapid trade liberalisation since the late 1980s and a rapidincrease in foreign trade since 1991, Argentina remains a relatively closedeconomy: total merchandise trade represented only 15.7% of GDP in 1996.After reaching a record surplus of $8.3bn in 1990, the trade balance deterio-rated markedly up to 1994, when it recorded a $5.8bn deficit. The depth of the1995 recession explains the sizeable shift recorded in that year, when the tradebalance posted a $842m surplus. During 1996 the trade account balanced torecord a slim $42m surplus.
During 1990-94 imports expanded at an annual average of 52% as a result offar-reaching trade liberalisation, a real appreciation of the domestic currency
50 Argentina: Merchandise trade
EIU Country Profile 1997-98 © The Economist Intelligence Unit Limited 1997
and strong domestic demand. Imports had been repressed after the debt crisisof the early 1980s as the Argentinian economy had to make large transfers ofresources abroad, and fell further during the hyperinflation of 1989 and 1990.The fall in capital inflows following the Mexican currency crisis choked importgrowth in 1995, only to recover strongly thereafter.
Annual export growth averaged only 2% per year during 1990-93 but expandedrapidly at an annual pace of 22% in 1994-96, aided by structural reforms, highinternational commodity prices and the boom in demand in Brazil. Rapidexport growth in the context of a fixed nominal exchange rate was an impor-tant factor in Argentina’s remarkable external adjustment after the Mexicancrisis. In particular, during 1996 exports continued to grow at double digit rateseven though aggregate domestic demand recovered rapidly.
Exports In recent years export growth has been driven by energy products (which stillmake a relatively low contribution to total exports) and manufactures (bothagricultural and industrial). Transport equipment exports have grown rapidlyto reach $1.64bn in 1996, more than six times the 1991 figure. This rapidincrease of sales abroad was stimulated by a special sectoral regime and thetrade agreement with Brazil. In 1996 manufactures contributed almost two-thirds of total exports. Yet except for sales of transport equipment, most manu-facturing exports are heavily concentrated in natural resource-intensive goods.(Detailed export statistics are given in Reference tables 25, 27 and 28.)
Imports Imports, in turn, are heavily concentrated in capital and intermediate goods. In1996 capital goods and spare parts accounted for about 41% of total imports,with an additional 35% explained by intermediate goods. The contraction ofimports which followed the Mexican crisis was rapidly reversed as the eco-nomy recovered in 1996, when purchases abroad reached a record level of$23.7bn. Although some capital goods imports have been channelled to invest-ment in non-tradeable sectors, these sectors will contribute to enhance inter-national competitiveness through modernisation of infrastructure. Importsalso make up a greater share of manufacturing inputs, increasing tradeability ofthe industrial sector. (Statistics on imports are given in Reference tables 26-28.)
Brazil becomes the mainexport outlet
In recent years Brazil has become the largest single outlet for Argentinianexports, its share in total sales abroad more than doubling from 12.4% in 1991to 27.8% in 1996. This trend has been stimulated by the Mercado Común delSur (Mercosur) customs union, unilateral trade liberalisation in Brazil and,more recently, by the boom in demand brought about by Brazil’s stabilisationplan. Exports of manufactures of industrial origin are even more heavily con-centrated in the Brazilian market than total exports (Brazil receives more than44% of total sales abroad of manufactures).
Meanwhile, exports to the US and the EU have grown at a much slower pace.In 1996 exports to North American Free-Trade Agreement (NAFTA) countrieswere less than 30% of total sales to Mercosur. The Chilean market alone ab-sorbed almost the same export value as the US. (Historical statistics on maintrading partners are given in Reference table 29.)
Argentina: Merchandise trade 51
EIU Country Profile 1997-98 © The Economist Intelligence Unit Limited 1997
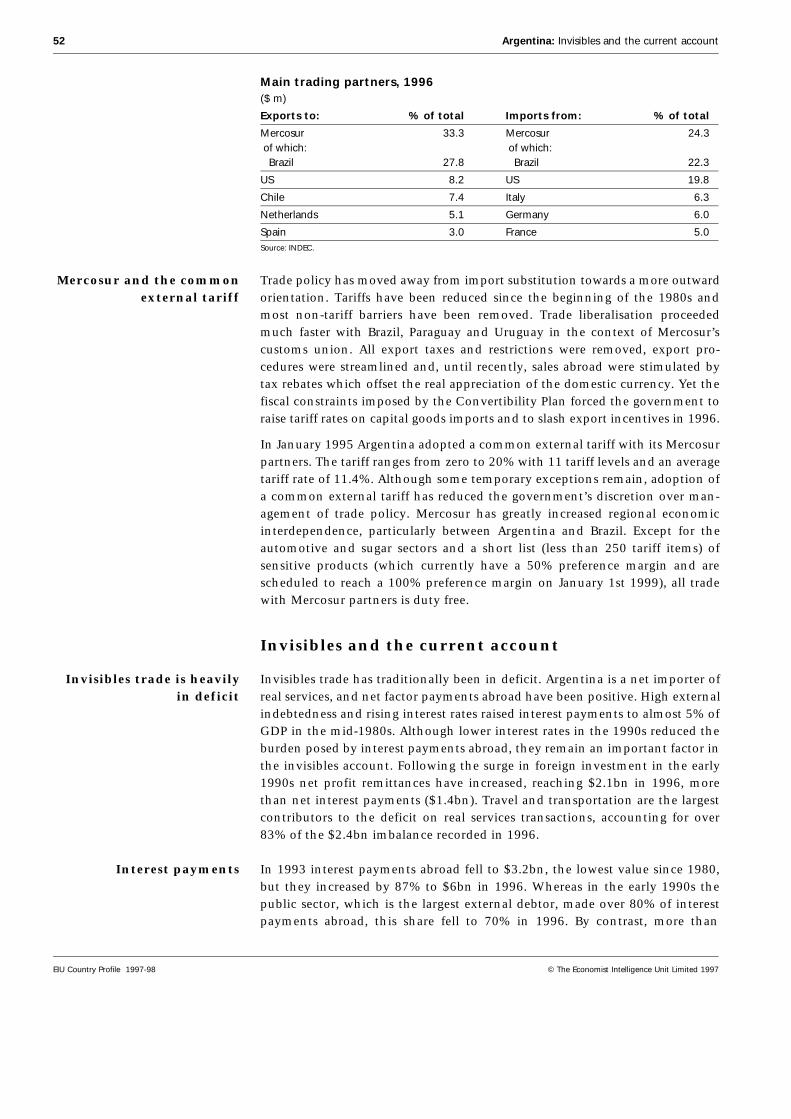
Main trading partners, 1996($ m)
Exports to: % of total Imports from: % of total
Mercosur 33.3 Mercosur 24.3 of which: of which: Brazil 27.8 Brazil 22.3
US 8.2 US 19.8
Chile 7.4 Italy 6.3
Netherlands 5.1 Germany 6.0
Spain 3.0 France 5.0Source: INDEC.
Mercosur and the commonexternal tariff
Trade policy has moved away from import substitution towards a more outwardorientation. Tariffs have been reduced since the beginning of the 1980s andmost non-tariff barriers have been removed. Trade liberalisation proceededmuch faster with Brazil, Paraguay and Uruguay in the context of Mercosur’scustoms union. All export taxes and restrictions were removed, export pro-cedures were streamlined and, until recently, sales abroad were stimulated bytax rebates which offset the real appreciation of the domestic currency. Yet thefiscal constraints imposed by the Convertibility Plan forced the government toraise tariff rates on capital goods imports and to slash export incentives in 1996.
In January 1995 Argentina adopted a common external tariff with its Mercosurpartners. The tariff ranges from zero to 20% with 11 tariff levels and an averagetariff rate of 11.4%. Although some temporary exceptions remain, adoption ofa common external tariff has reduced the government’s discretion over man-agement of trade policy. Mercosur has greatly increased regional economicinterdependence, particularly between Argentina and Brazil. Except for theautomotive and sugar sectors and a short list (less than 250 tariff items) ofsensitive products (which currently have a 50% preference margin and arescheduled to reach a 100% preference margin on January 1st 1999), all tradewith Mercosur partners is duty free.
Invisibles and the current account
Invisibles trade is heavilyin deficit
Invisibles trade has traditionally been in deficit. Argentina is a net importer ofreal services, and net factor payments abroad have been positive. High externalindebtedness and rising interest rates raised interest payments to almost 5% ofGDP in the mid-1980s. Although lower interest rates in the 1990s reduced theburden posed by interest payments abroad, they remain an important factor inthe invisibles account. Following the surge in foreign investment in the early1990s net profit remittances have increased, reaching $2.1bn in 1996, morethan net interest payments ($1.4bn). Travel and transportation are the largestcontributors to the deficit on real services transactions, accounting for over83% of the $2.4bn imbalance recorded in 1996.
Interest payments In 1993 interest payments abroad fell to $3.2bn, the lowest value since 1980,but they increased by 87% to $6bn in 1996. Whereas in the early 1990s thepublic sector, which is the largest external debtor, made over 80% of interestpayments abroad, this share fell to 70% in 1996. By contrast, more than
52 Argentina: Invisibles and the current account
EIU Country Profile 1997-98 © The Economist Intelligence Unit Limited 1997

three-quarters of interest payments received from abroad accrued to the privatesector. Interest payments received have more than doubled since 1993, owingto higher interest rates and the rise in international reserves.
Profit and dividends Net profit and dividend payments abroad have been rising and should con-tinue to do so owing to sizeable foreign investment inflows. A share of privatecapital inflows has been channelled into privatised public utilities which oper-ate in markets that are subject to natural monopolies with guaranteed returnson investment. Since Argentinians do not have large direct investmentsabroad, investment income is negligible (only $88m in 1996). Between 1992and 1996 profit remittances abroad more than doubled, to reach a value whichrepresents over one-third of total interest payments abroad.
Transfer payments Transfer payments make a relatively small contribution to the current account,yielding a net inflow of $334m in 1996, most of which was private. A large partof incoming private transfers is due to European expatriates (mainly Italians)receiving pensions from their countries of origin.
In 1994 the current-account deficit peaked at $10bn (3.5% of GDP), whichcontrasts with the $4.6bn current-account surplus recorded in 1990. The cut-back in capital inflows after the Mexican crisis reduced the current-accountimbalance to $2.4bn (0.9% of GDP) in 1995. Yet in 1996 the current-accountdeficit widened again to $4bn (1.3% of GDP) as a result of rapidly growingimports propped up by faster aggregate demand growth. A high income elastic-ity of imports and mounting profit remittances abroad have turned into majordeterminants of the current-account imbalance. (The IMF presentation of thebalance of payments is given in Reference table 30; the national breakdown isin Reference table 31.)
Balance of payments, 1996($ m)
Current-account balance –3,952 Merchandise trade balance (fob) 1,621 Real services –2,412 Financial services –3,495 Transfers 334
Capital-account balance 7,734 Banking sector –178 Non-financial public sector 8,879 Non-financial private sector 4,340 Others –5,307
Change in net international reserves 3,782Source: Banco Central de la República Argentina.
Capital flows and foreign debt
The Brady agreement For most of the 1980s Argentina remained submerged in a debt crisis whichforced the economy to a traumatic adjustment process involving large deval-uations and a major disruption of the domestic economy. The size of the exter-nal and fiscal adjustments required were too large as a share of GDP, laying thebasis for the hyperinflation of 1989 and 1990. Changing conditions in the
Argentina: Capital flows and foreign debt 53
EIU Country Profile 1997-98 © The Economist Intelligence Unit Limited 1997
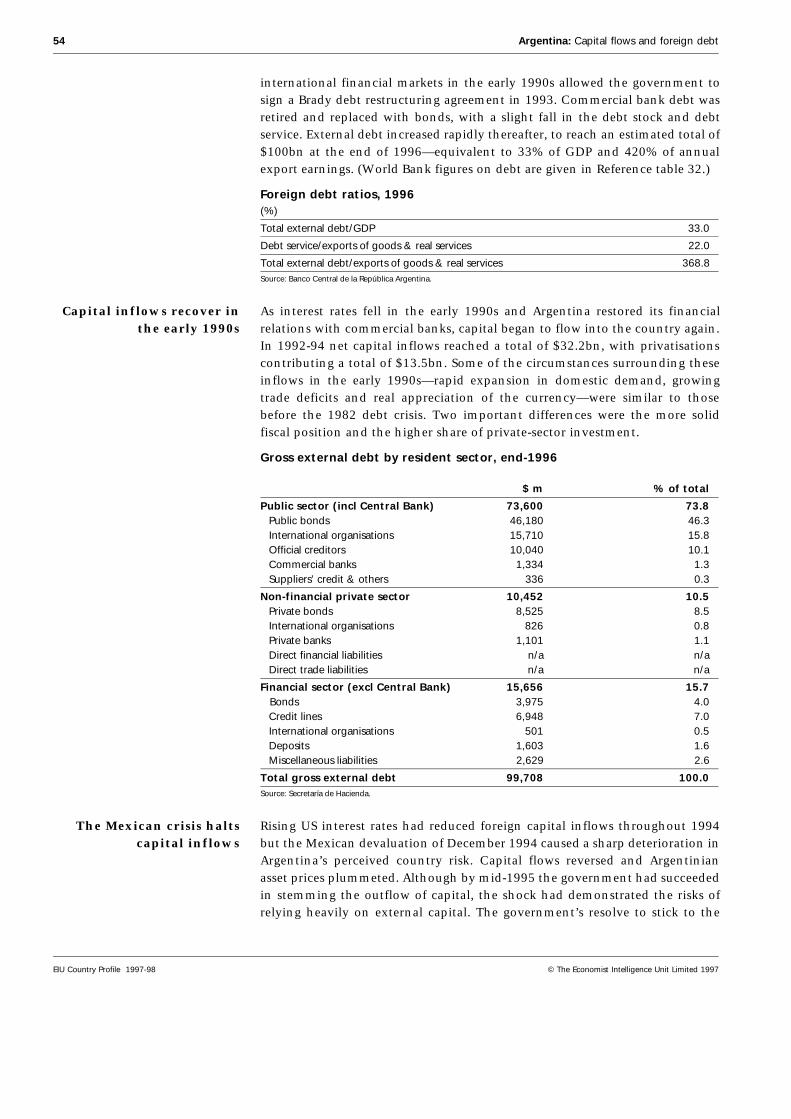
international financial markets in the early 1990s allowed the government tosign a Brady debt restructuring agreement in 1993. Commercial bank debt wasretired and replaced with bonds, with a slight fall in the debt stock and debtservice. External debt increased rapidly thereafter, to reach an estimated total of$100bn at the end of 1996—equivalent to 33% of GDP and 420% of annualexport earnings. (World Bank figures on debt are given in Reference table 32.)
Foreign debt ratios, 1996(%)
Total external debt/GDP 33.0
Debt service/exports of goods & real services 22.0
Total external debt/exports of goods & real services 368.8Source: Banco Central de la República Argentina.
Capital inflows recover inthe early 1990s
As interest rates fell in the early 1990s and Argentina restored its financialrelations with commercial banks, capital began to flow into the country again.In 1992-94 net capital inflows reached a total of $32.2bn, with privatisationscontributing a total of $13.5bn. Some of the circumstances surrounding theseinflows in the early 1990s—rapid expansion in domestic demand, growingtrade deficits and real appreciation of the currency—were similar to thosebefore the 1982 debt crisis. Two important differences were the more solidfiscal position and the higher share of private-sector investment.
Gross external debt by resident sector, end-1996
$ m % of total
Public sector (incl Central Bank) 73,600 73.8 Public bonds 46,180 46.3 International organisations 15,710 15.8 Official creditors 10,040 10.1 Commercial banks 1,334 1.3 Suppliers’ credit & others 336 0.3
Non-financial private sector 10,452 10.5 Private bonds 8,525 8.5 International organisations 826 0.8 Private banks 1,101 1.1 Direct financial liabilities n/a n/a Direct trade liabilities n/a n/a
Financial sector (excl Central Bank) 15,656 15.7 Bonds 3,975 4.0 Credit lines 6,948 7.0 International organisations 501 0.5 Deposits 1,603 1.6 Miscellaneous liabilities 2,629 2.6
Total gross external debt 99,708 100.0Source: Secretaría de Hacienda.
The Mexican crisis haltscapital inflows
Rising US interest rates had reduced foreign capital inflows throughout 1994but the Mexican devaluation of December 1994 caused a sharp deterioration inArgentina’s perceived country risk. Capital flows reversed and Argentinianasset prices plummeted. Although by mid-1995 the government had succeededin stemming the outflow of capital, the shock had demonstrated the risks ofrelying heavily on external capital. The government’s resolve to stick to the
54 Argentina: Capital flows and foreign debt
EIU Country Profile 1997-98 © The Economist Intelligence Unit Limited 1997
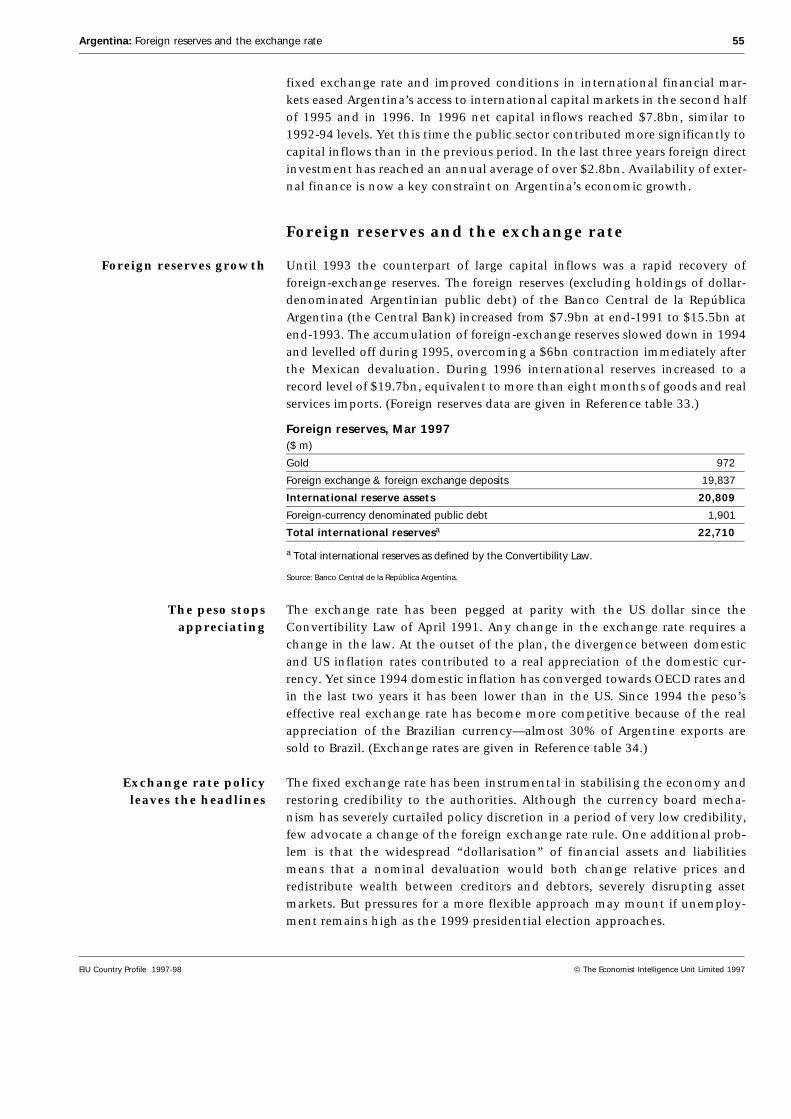
fixed exchange rate and improved conditions in international financial mar-kets eased Argentina’s access to international capital markets in the second halfof 1995 and in 1996. In 1996 net capital inflows reached $7.8bn, similar to1992-94 levels. Yet this time the public sector contributed more significantly tocapital inflows than in the previous period. In the last three years foreign directinvestment has reached an annual average of over $2.8bn. Availability of exter-nal finance is now a key constraint on Argentina’s economic growth.
Foreign reserves and the exchange rate
Foreign reserves growth Until 1993 the counterpart of large capital inflows was a rapid recovery offoreign-exchange reserves. The foreign reserves (excluding holdings of dollar-denominated Argentinian public debt) of the Banco Central de la RepúblicaArgentina (the Central Bank) increased from $7.9bn at end-1991 to $15.5bn atend-1993. The accumulation of foreign-exchange reserves slowed down in 1994and levelled off during 1995, overcoming a $6bn contraction immediately afterthe Mexican devaluation. During 1996 international reserves increased to arecord level of $19.7bn, equivalent to more than eight months of goods and realservices imports. (Foreign reserves data are given in Reference table 33.)
Foreign reserves, Mar 1997($ m)
Gold 972
Foreign exchange & foreign exchange deposits 19,837
International reserve assets 20,809
Foreign-currency denominated public debt 1,901
Total international reservesa 22,710
a Total international reserves as defined by the Convertibility Law.
Source: Banco Central de la República Argentina.
The peso stopsappreciating
The exchange rate has been pegged at parity with the US dollar since theConvertibility Law of April 1991. Any change in the exchange rate requires achange in the law. At the outset of the plan, the divergence between domesticand US inflation rates contributed to a real appreciation of the domestic cur-rency. Yet since 1994 domestic inflation has converged towards OECD rates andin the last two years it has been lower than in the US. Since 1994 the peso’seffective real exchange rate has become more competitive because of the realappreciation of the Brazilian currency—almost 30% of Argentine exports aresold to Brazil. (Exchange rates are given in Reference table 34.)
Exchange rate policyleaves the headlines
The fixed exchange rate has been instrumental in stabilising the economy andrestoring credibility to the authorities. Although the currency board mecha-nism has severely curtailed policy discretion in a period of very low credibility,few advocate a change of the foreign exchange rate rule. One additional prob-lem is that the widespread “dollarisation” of financial assets and liabilitiesmeans that a nominal devaluation would both change relative prices andredistribute wealth between creditors and debtors, severely disrupting assetmarkets. But pressures for a more flexible approach may mount if unemploy-ment remains high as the 1999 presidential election approaches.
Argentina: Foreign reserves and the exchange rate 55
EIU Country Profile 1997-98 © The Economist Intelligence Unit Limited 1997

Appendices
Sources of information
National statistical sources Banco Central de la República Argentina, Boletín Estadístico (monthly)
Banco Central de la República Argentina, Estados Contables de las EntidadesFinancieras (monthly)
INDEC (Instituto Nacional de Estadística y Censos), Anuario Estadístico de laRepública Argentina (yearly)
INDEC, Censo Nacional Económico 1994, Avance de Resultados
INDEC, Censo Nacional de Población y Vivienda 1991
INDEC, Comercio Exterior Argentino (yearly)
INDEC, Encuesta Industrial (quarterly)
INDEC, Encuesta Nacional Agropecuaria (yearly)
INDEC, Encuesta Permanente de Hogares, Gran Buenos Aires (biannual)
INDEC, Encuesta Permanente de Hogares, Total de aglomerados (biannual)
INDEC, Estadísticas de Productos Industriales (biannual)
INDEC, Indec Informa (monthly)
INDEC, Indicador de Demanda Laboral (monthly)
INDEC, Indice del Costo de la Construcción (monthly)
INDEC, Indice de Precios al Consumidor (monthly)
INDEC, Indice de Precios al por Mayor (monthly)
INDEC, Indice de Salarios básicos de convenio de la industria y la construcción (monthly)
INDEC, Intercambio Comercial Argentino (monthly)
INDEC, Navegación Aerocomercial (yearly)
INDEC, Situación y Evolución Social, Síntesis (yearly)
Ministerio de Economía, Boletín Fiscal (quarterly)
Ministerio de Economía, Estimaciones Trimestrales del Balance de Pagos (quarterly)
Ministerio de Economía, Informe Económico (quarterly)
Secretaría de Agricultura, Ganadería y Pesca, Estadísticas Agropecuarias yPesqueras (yearly)
Secretaría de Agricultura, Ganadería y Pesca, Estimaciones Agrícolas (weekly)
Secretaría de Energía, Boletín Mensual de Combustibles (monthly)
56 Argentina: Sources of information
EIU Country Profile 1997-98 © The Economist Intelligence Unit Limited 1997
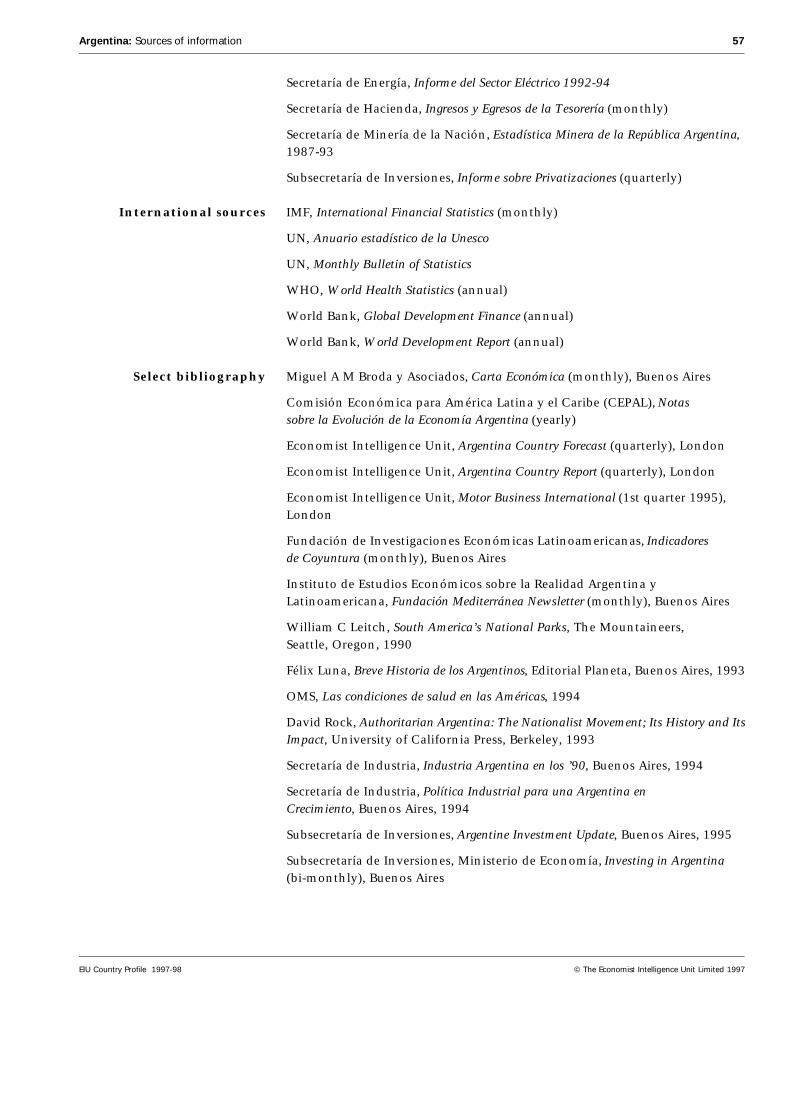
Secretaría de Energía, Informe del Sector Eléctrico 1992-94
Secretaría de Hacienda, Ingresos y Egresos de la Tesorería (monthly)
Secretaría de Minería de la Nación, Estadística Minera de la República Argentina,1987-93
Subsecretaría de Inversiones, Informe sobre Privatizaciones (quarterly)
International sources IMF, International Financial Statistics (monthly)
UN, Anuario estadístico de la Unesco
UN, Monthly Bulletin of Statistics
WHO, World Health Statistics (annual)
World Bank, Global Development Finance (annual)
World Bank, World Development Report (annual)
Select bibliography Miguel A M Broda y Asociados, Carta Económica (monthly), Buenos Aires
Comisión Económica para América Latina y el Caribe (CEPAL), Notas sobre la Evolución de la Economía Argentina (yearly)
Economist Intelligence Unit, Argentina Country Forecast (quarterly), London
Economist Intelligence Unit, Argentina Country Report (quarterly), London
Economist Intelligence Unit, Motor Business International (1st quarter 1995),London
Fundación de Investigaciones Económicas Latinoamericanas, Indicadores de Coyuntura (monthly), Buenos Aires
Instituto de Estudios Económicos sobre la Realidad Argentina y Latinoamericana, Fundación Mediterránea Newsletter (monthly), Buenos Aires
William C Leitch, South America’s National Parks, The Mountaineers, Seattle, Oregon, 1990
Félix Luna, Breve Historia de los Argentinos, Editorial Planeta, Buenos Aires, 1993
OMS, Las condiciones de salud en las Américas, 1994
David Rock, Authoritarian Argentina: The Nationalist Movement; Its History and ItsImpact, University of California Press, Berkeley, 1993
Secretaría de Industria, Industria Argentina en los ’90, Buenos Aires, 1994
Secretaría de Industria, Política Industrial para una Argentina en Crecimiento, Buenos Aires, 1994
Subsecretaría de Inversiones, Argentine Investment Update, Buenos Aires, 1995
Subsecretaría de Inversiones, Ministerio de Economía, Investing in Argentina(bi-monthly), Buenos Aires
Argentina: Sources of information 57
EIU Country Profile 1997-98 © The Economist Intelligence Unit Limited 1997
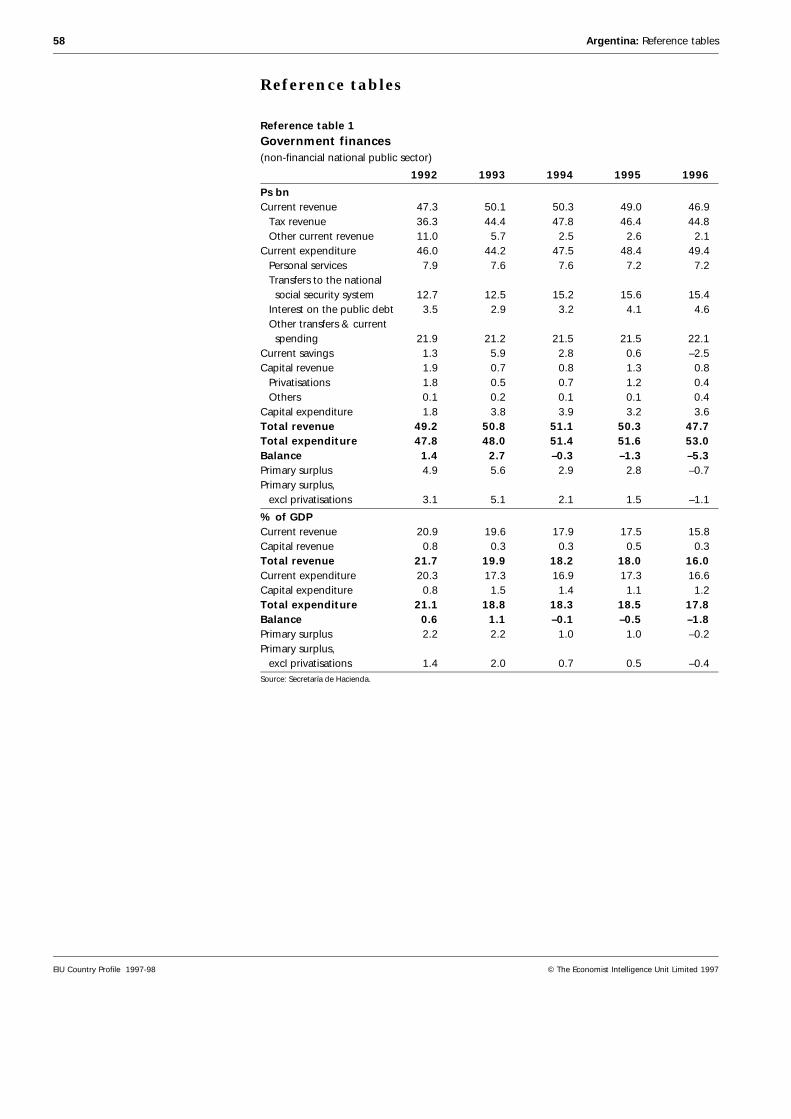
Reference tables
Reference table 1
Government finances(non-financial national public sector)
1992 1993 1994 1995 1996
Ps bnCurrent revenue 47.3 50.1 50.3 49.0 46.9 Tax revenue 36.3 44.4 47.8 46.4 44.8 Other current revenue 11.0 5.7 2.5 2.6 2.1Current expenditure 46.0 44.2 47.5 48.4 49.4 Personal services 7.9 7.6 7.6 7.2 7.2 Transfers to the national social security system 12.7 12.5 15.2 15.6 15.4 Interest on the public debt 3.5 2.9 3.2 4.1 4.6 Other transfers & current spending 21.9 21.2 21.5 21.5 22.1Current savings 1.3 5.9 2.8 0.6 –2.5Capital revenue 1.9 0.7 0.8 1.3 0.8 Privatisations 1.8 0.5 0.7 1.2 0.4 Others 0.1 0.2 0.1 0.1 0.4Capital expenditure 1.8 3.8 3.9 3.2 3.6Total revenue 49.2 50.8 51.1 50.3 47.7Total expenditure 47.8 48.0 51.4 51.6 53.0Balance 1.4 2.7 –0.3 –1.3 –5.3Primary surplus 4.9 5.6 2.9 2.8 –0.7Primary surplus, excl privatisations 3.1 5.1 2.1 1.5 –1.1
% of GDPCurrent revenue 20.9 19.6 17.9 17.5 15.8Capital revenue 0.8 0.3 0.3 0.5 0.3Total revenue 21.7 19.9 18.2 18.0 16.0Current expenditure 20.3 17.3 16.9 17.3 16.6Capital expenditure 0.8 1.5 1.4 1.1 1.2Total expenditure 21.1 18.8 18.3 18.5 17.8Balance 0.6 1.1 –0.1 –0.5 –1.8Primary surplus 2.2 2.2 1.0 1.0 –0.2Primary surplus, excl privatisations 1.4 2.0 0.7 0.5 –0.4Source: Secretaría de Hacienda.
58 Argentina: Reference tables
EIU Country Profile 1997-98 © The Economist Intelligence Unit Limited 1997
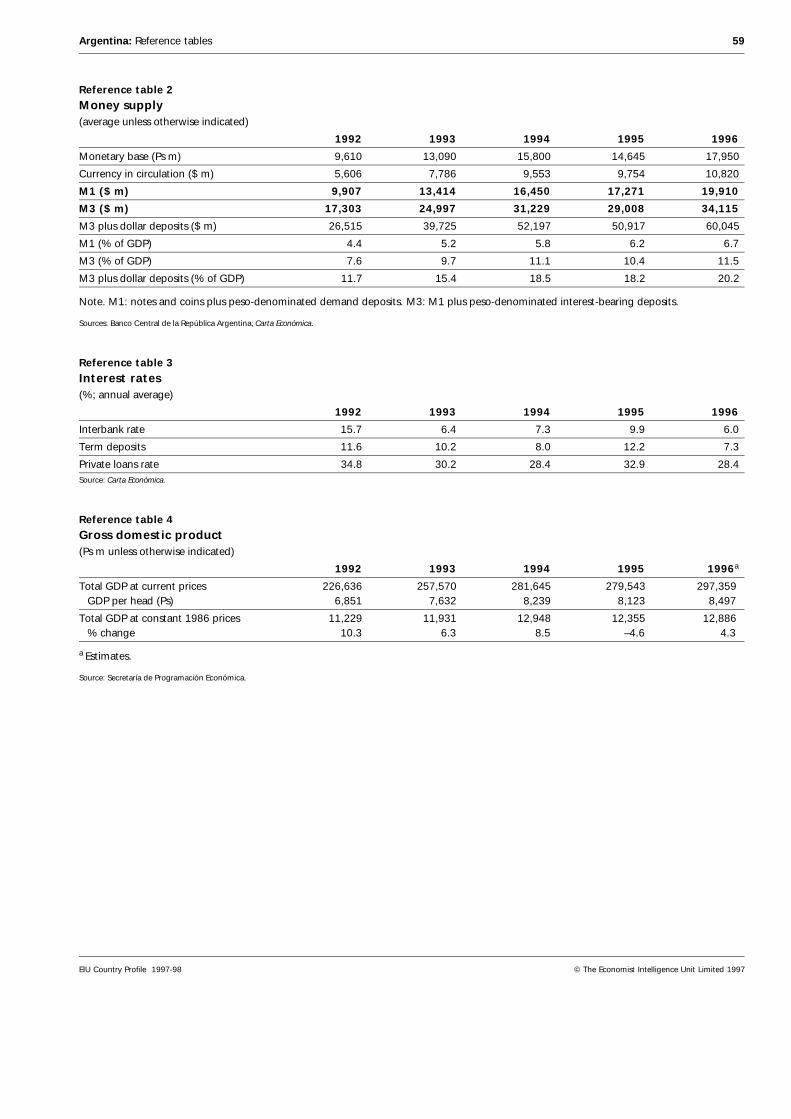
Reference table 2
Money supply(average unless otherwise indicated)
1992 1993 1994 1995 1996
Monetary base (Ps m) 9,610 13,090 15,800 14,645 17,950
Currency in circulation ($ m) 5,606 7,786 9,553 9,754 10,820
M1 ($ m) 9,907 13,414 16,450 17,271 19,910
M3 ($ m) 17,303 24,997 31,229 29,008 34,115
M3 plus dollar deposits ($ m) 26,515 39,725 52,197 50,917 60,045
M1 (% of GDP) 4.4 5.2 5.8 6.2 6.7
M3 (% of GDP) 7.6 9.7 11.1 10.4 11.5
M3 plus dollar deposits (% of GDP) 11.7 15.4 18.5 18.2 20.2
Note. M1: notes and coins plus peso-denominated demand deposits. M3: M1 plus peso-denominated interest-bearing deposits.
Sources: Banco Central de la República Argentina; Carta Económica.
Reference table 3
Interest rates(%; annual average)
1992 1993 1994 1995 1996
Interbank rate 15.7 6.4 7.3 9.9 6.0
Term deposits 11.6 10.2 8.0 12.2 7.3
Private loans rate 34.8 30.2 28.4 32.9 28.4Source: Carta Económica.
Reference table 4
Gross domestic product(Ps m unless otherwise indicated)
1992 1993 1994 1995 1996a
Total GDP at current prices 226,636 257,570 281,645 279,543 297,359 GDP per head (Ps) 6,851 7,632 8,239 8,123 8,497
Total GDP at constant 1986 prices 11,229 11,931 12,948 12,355 12,886 % change 10.3 6.3 8.5 –4.6 4.3
a Estimates.
Source: Secretaría de Programación Económica.
Argentina: Reference tables 59
EIU Country Profile 1997-98 © The Economist Intelligence Unit Limited 1997

Reference table 5
Gross domestic product by expenditure(Ps m unless otherwise indicated; constant 1986 prices)
1992 1993 1994 1995 1996a
Consumption spending (incl inventory change) 9,519 10,062 10,753 10,093 10,629 % change 11.4 5.7 6.9 –6.1 5.3 % of total 84.8 84.3 83.1 81.7 82.5
Gross domestic investment 2,164 2,511 3,057 2,560 2,772 % change 33.5 16.0 21.8 –16.3 8.3 % of total 19.3 21.0 23.6 20.7 21.5
Exports of goods & real services 1,145 1,172 1,358 1,667 1,775 % change 2.1 2.4 15.9 22.7 6.5 % of total 10.2 9.8 10.5 13.5 13.8
Imports of goods & real services 1,599 1,813 2,221 1,965 2,295 % change 66.5 13.4 22.5 –11.6 16.8 % of total 14.2 15.2 17.2 15.9 17.8
Total GDP 11,229 11,931 12,948 12,355 12,881 % change 10.3 6.3 8.5 –4.6 4.3
a Estimates.
Source: Secretaría de Programación Económica.
60 Argentina: Reference tables
EIU Country Profile 1997-98 © The Economist Intelligence Unit Limited 1997
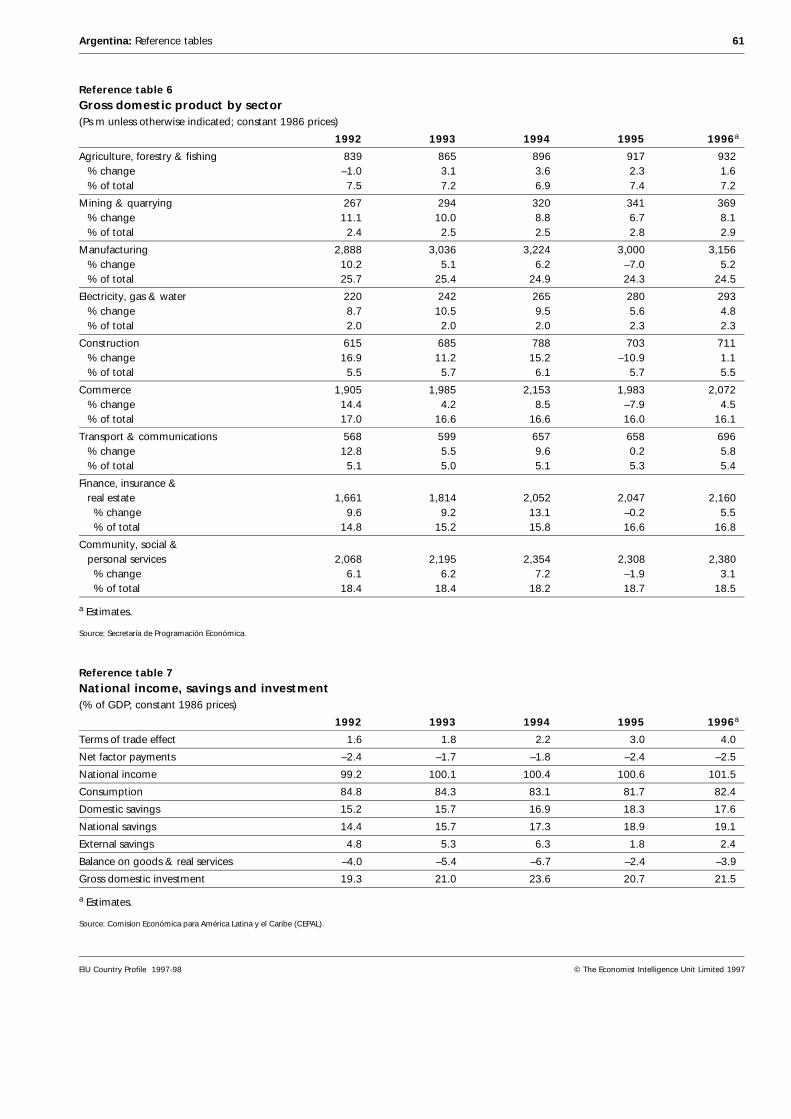
Reference table 6
Gross domestic product by sector(Ps m unless otherwise indicated; constant 1986 prices)
1992 1993 1994 1995 1996a
Agriculture, forestry & fishing 839 865 896 917 932 % change –1.0 3.1 3.6 2.3 1.6 % of total 7.5 7.2 6.9 7.4 7.2
Mining & quarrying 267 294 320 341 369 % change 11.1 10.0 8.8 6.7 8.1 % of total 2.4 2.5 2.5 2.8 2.9
Manufacturing 2,888 3,036 3,224 3,000 3,156 % change 10.2 5.1 6.2 –7.0 5.2 % of total 25.7 25.4 24.9 24.3 24.5
Electricity, gas & water 220 242 265 280 293 % change 8.7 10.5 9.5 5.6 4.8 % of total 2.0 2.0 2.0 2.3 2.3
Construction 615 685 788 703 711 % change 16.9 11.2 15.2 –10.9 1.1 % of total 5.5 5.7 6.1 5.7 5.5
Commerce 1,905 1,985 2,153 1,983 2,072 % change 14.4 4.2 8.5 –7.9 4.5 % of total 17.0 16.6 16.6 16.0 16.1
Transport & communications 568 599 657 658 696 % change 12.8 5.5 9.6 0.2 5.8 % of total 5.1 5.0 5.1 5.3 5.4
Finance, insurance & real estate 1,661 1,814 2,052 2,047 2,160 % change 9.6 9.2 13.1 –0.2 5.5 % of total 14.8 15.2 15.8 16.6 16.8
Community, social & personal services 2,068 2,195 2,354 2,308 2,380 % change 6.1 6.2 7.2 –1.9 3.1 % of total 18.4 18.4 18.2 18.7 18.5
a Estimates.
Source: Secretaría de Programación Económica.
Reference table 7
National income, savings and investment(% of GDP; constant 1986 prices)
1992 1993 1994 1995 1996a
Terms of trade effect 1.6 1.8 2.2 3.0 4.0
Net factor payments –2.4 –1.7 –1.8 –2.4 –2.5
National income 99.2 100.1 100.4 100.6 101.5
Consumption 84.8 84.3 83.1 81.7 82.4
Domestic savings 15.2 15.7 16.9 18.3 17.6
National savings 14.4 15.7 17.3 18.9 19.1
External savings 4.8 5.3 6.3 1.8 2.4
Balance on goods & real services –4.0 –5.4 –6.7 –2.4 –3.9
Gross domestic investment 19.3 21.0 23.6 20.7 21.5
a Estimates.
Source: Comisíon Económica para América Latina y el Caribe (CEPAL).
Argentina: Reference tables 61
EIU Country Profile 1997-98 © The Economist Intelligence Unit Limited 1997
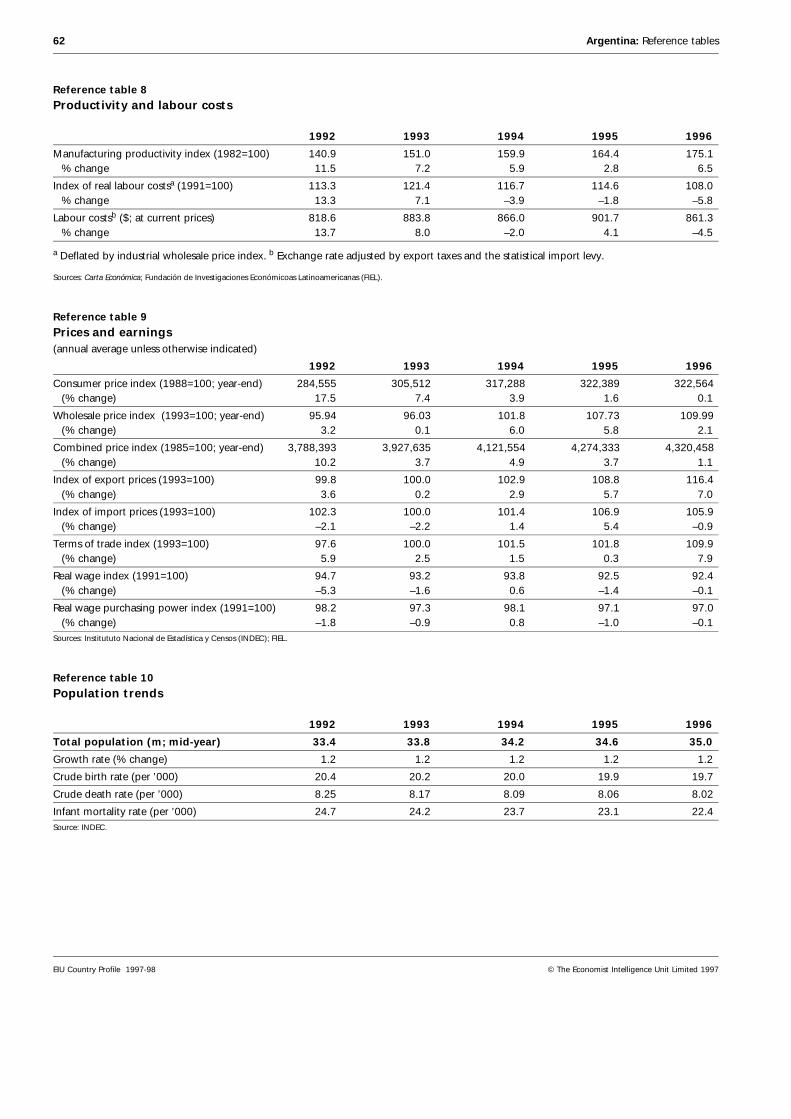
Reference table 8
Productivity and labour costs
1992 1993 1994 1995 1996
Manufacturing productivity index (1982=100) 140.9 151.0 159.9 164.4 175.1 % change 11.5 7.2 5.9 2.8 6.5
Index of real labour costsa (1991=100) 113.3 121.4 116.7 114.6 108.0 % change 13.3 7.1 –3.9 –1.8 –5.8
Labour costsb ($; at current prices) 818.6 883.8 866.0 901.7 861.3 % change 13.7 8.0 –2.0 4.1 –4.5
a Deflated by industrial wholesale price index. b Exchange rate adjusted by export taxes and the statistical import levy.
Sources: Carta Económica; Fundación de Investigaciones Económicoas Latinoamericanas (FIEL).
Reference table 9
Prices and earnings(annual average unless otherwise indicated)
1992 1993 1994 1995 1996
Consumer price index (1988=100; year-end) 284,555 305,512 317,288 322,389 322,564 (% change) 17.5 7.4 3.9 1.6 0.1
Wholesale price index (1993=100; year-end) 95.94 96.03 101.8 107.73 109.99 (% change) 3.2 0.1 6.0 5.8 2.1
Combined price index (1985=100; year-end) 3,788,393 3,927,635 4,121,554 4,274,333 4,320,458 (% change) 10.2 3.7 4.9 3.7 1.1
Index of export prices (1993=100) 99.8 100.0 102.9 108.8 116.4 (% change) 3.6 0.2 2.9 5.7 7.0
Index of import prices (1993=100) 102.3 100.0 101.4 106.9 105.9 (% change) –2.1 –2.2 1.4 5.4 –0.9
Terms of trade index (1993=100) 97.6 100.0 101.5 101.8 109.9 (% change) 5.9 2.5 1.5 0.3 7.9
Real wage index (1991=100) 94.7 93.2 93.8 92.5 92.4 (% change) –5.3 –1.6 0.6 –1.4 –0.1
Real wage purchasing power index (1991=100) 98.2 97.3 98.1 97.1 97.0 (% change) –1.8 –0.9 0.8 –1.0 –0.1Sources: Institututo Nacional de Estadística y Censos (INDEC); FIEL.
Reference table 10
Population trends
1992 1993 1994 1995 1996
Total population (m; mid-year) 33.4 33.8 34.2 34.6 35.0
Growth rate (% change) 1.2 1.2 1.2 1.2 1.2
Crude birth rate (per ’000) 20.4 20.2 20.0 19.9 19.7
Crude death rate (per ’000) 8.25 8.17 8.09 8.06 8.02
Infant mortality rate (per ’000) 24.7 24.2 23.7 23.1 22.4Source: INDEC.
62 Argentina: Reference tables
EIU Country Profile 1997-98 © The Economist Intelligence Unit Limited 1997
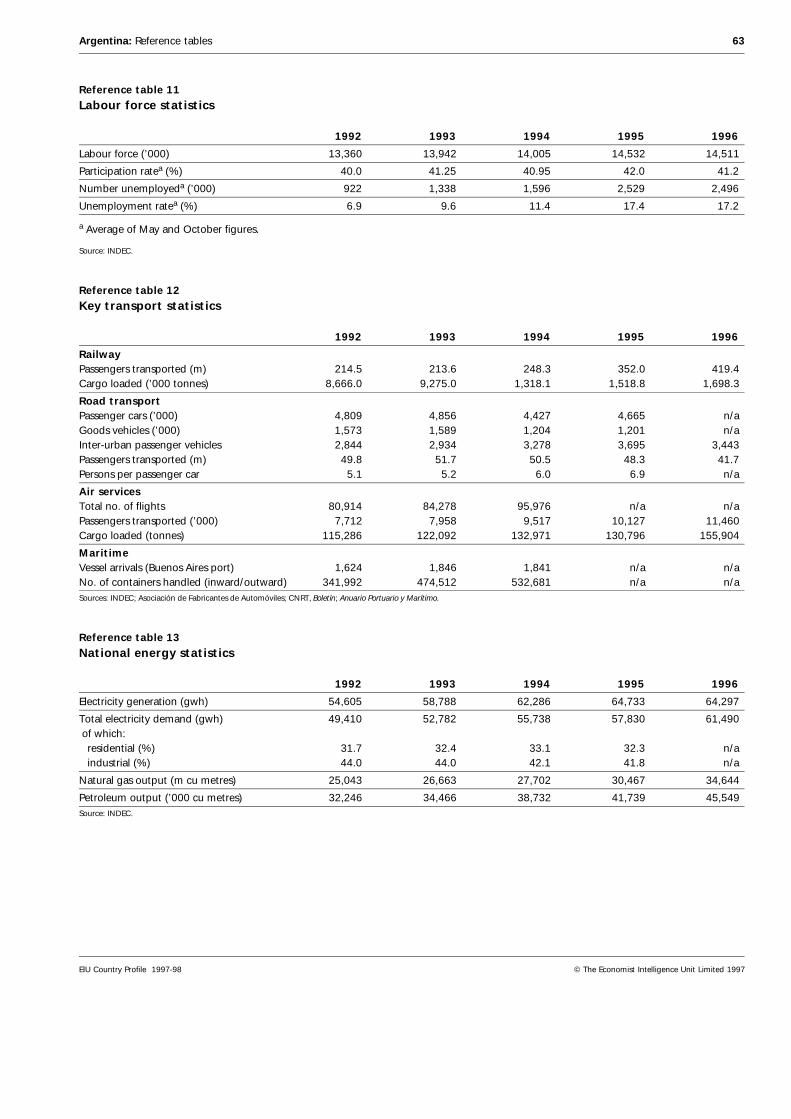
Reference table 11
Labour force statistics
1992 1993 1994 1995 1996
Labour force (’000) 13,360 13,942 14,005 14,532 14,511
Participation ratea (%) 40.0 41.25 40.95 42.0 41.2
Number unemployeda (’000) 922 1,338 1,596 2,529 2,496
Unemployment ratea (%) 6.9 9.6 11.4 17.4 17.2
a Average of May and October figures.
Source: INDEC.
Reference table 12
Key transport statistics
1992 1993 1994 1995 1996
RailwayPassengers transported (m) 214.5 213.6 248.3 352.0 419.4Cargo loaded (’000 tonnes) 8,666.0 9,275.0 1,318.1 1,518.8 1,698.3
Road transportPassenger cars (’000) 4,809 4,856 4,427 4,665 n/aGoods vehicles (’000) 1,573 1,589 1,204 1,201 n/aInter-urban passenger vehicles 2,844 2,934 3,278 3,695 3,443Passengers transported (m) 49.8 51.7 50.5 48.3 41.7Persons per passenger car 5.1 5.2 6.0 6.9 n/a
Air servicesTotal no. of flights 80,914 84,278 95,976 n/a n/aPassengers transported (’000) 7,712 7,958 9,517 10,127 11,460Cargo loaded (tonnes) 115,286 122,092 132,971 130,796 155,904
MaritimeVessel arrivals (Buenos Aires port) 1,624 1,846 1,841 n/a n/aNo. of containers handled (inward/outward) 341,992 474,512 532,681 n/a n/aSources: INDEC; Asociación de Fabricantes de Automóviles; CNRT, Boletín; Anuario Portuario y Marítimo.
Reference table 13
National energy statistics
1992 1993 1994 1995 1996
Electricity generation (gwh) 54,605 58,788 62,286 64,733 64,297
Total electricity demand (gwh) 49,410 52,782 55,738 57,830 61,490 of which: residential (%) 31.7 32.4 33.1 32.3 n/a industrial (%) 44.0 44.0 42.1 41.8 n/a
Natural gas output (m cu metres) 25,043 26,663 27,702 30,467 34,644
Petroleum output (’000 cu metres) 32,246 34,466 38,732 41,739 45,549Source: INDEC.
Argentina: Reference tables 63
EIU Country Profile 1997-98 © The Economist Intelligence Unit Limited 1997
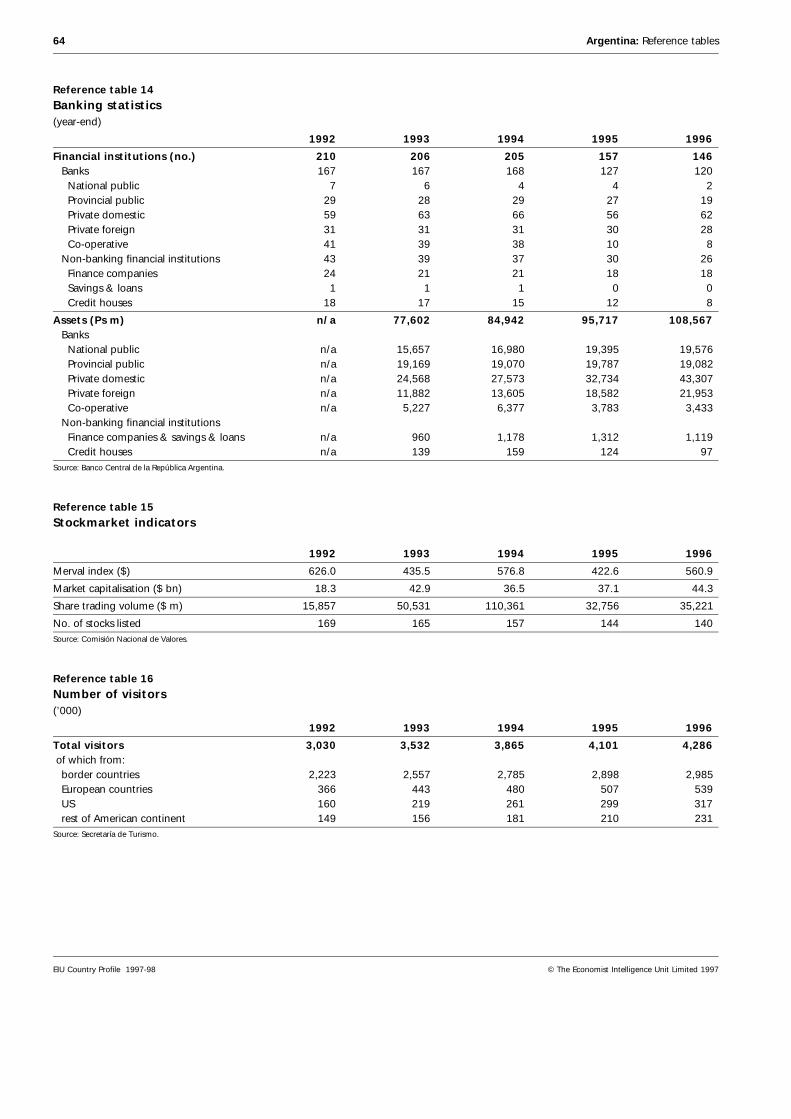
Reference table 14
Banking statistics(year-end)
1992 1993 1994 1995 1996
Financial institutions (no.) 210 206 205 157 146 Banks 167 167 168 127 120 National public 7 6 4 4 2 Provincial public 29 28 29 27 19 Private domestic 59 63 66 56 62 Private foreign 31 31 31 30 28 Co-operative 41 39 38 10 8 Non-banking financial institutions 43 39 37 30 26 Finance companies 24 21 21 18 18 Savings & loans 1 1 1 0 0 Credit houses 18 17 15 12 8
Assets (Ps m) n/a 77,602 84,942 95,717 108,567 Banks National public n/a 15,657 16,980 19,395 19,576 Provincial public n/a 19,169 19,070 19,787 19,082 Private domestic n/a 24,568 27,573 32,734 43,307 Private foreign n/a 11,882 13,605 18,582 21,953 Co-operative n/a 5,227 6,377 3,783 3,433 Non-banking financial institutions Finance companies & savings & loans n/a 960 1,178 1,312 1,119 Credit houses n/a 139 159 124 97Source: Banco Central de la República Argentina.
Reference table 15
Stockmarket indicators
1992 1993 1994 1995 1996
Merval index ($) 626.0 435.5 576.8 422.6 560.9
Market capitalisation ($ bn) 18.3 42.9 36.5 37.1 44.3
Share trading volume ($ m) 15,857 50,531 110,361 32,756 35,221
No. of stocks listed 169 165 157 144 140Source: Comisión Nacional de Valores.
Reference table 16
Number of visitors(’000)
1992 1993 1994 1995 1996
Total visitors 3,030 3,532 3,865 4,101 4,286 of which from: border countries 2,223 2,557 2,785 2,898 2,985 European countries 366 443 480 507 539 US 160 219 261 299 317 rest of American continent 149 156 181 210 231Source: Secretaría de Turismo.
64 Argentina: Reference tables
EIU Country Profile 1997-98 © The Economist Intelligence Unit Limited 1997

Reference table 17
Manufacturing production
1992 1993 1994 1995 1996
Manufacturing (Ps ’000; 1986 prices) 2,888 3,036 3,224 3,000 3,156 % change 10.2 5.1 6.2 –7.0 5.2
Volume indices (1986=100)Industrial production 105.9 111.0 116.9 108.1 114.2Food, beverages & tobacco 101.8 101.7 106.6 107.8 109.5Textiles 97.0 93.4 88.9 81.4 88.0Paper & cardboard 99.9 80.3 98.4 104.4 114.1Chemicals 116.6 123.3 133.7 140.6 148.6Cement 91.5 102.1 114.3 98.9 92.5Basic metal industries 96.0 101.3 130.6 134.4 141.1Machinery & equipment 112.7 130.3 131.7 98.2 107.8Sources: Secretaría de Programación Económica; Carta Económica.
Reference table 18
Output of main industrial products(’000 tonnes unless otherwise indicated)
1992 1993 1994 1995 1996
Vegetable oils 3,100 2,755 3,027 3,735 4,044
Steel 2,680 2,870 3,274 3,575 4,065
Aluminium 153 171 173 183 185
Cement 5,051 5,647 6,306 5,477 5,177
Paper 977 927 970 1,021 1,123
Sulphuric acid 222 194 192 180 193
Synthetic fibres 19.1 14.9 15.8 13.6 15.9
Automobiles (’000 units) 262 342 409 285 313
Tractors (units) 4,289 3,830 4,629 3,490 5,589
Tyres (’000 units) 5,627 6,243 7,329 7,174 7,593
Washing & drying machines (’000 units) 756 801 702 458 524
Colour TV sets (’000 units) 1,386 1,612 1,523 949 1,089Source: INDEC.
Reference table 19
Miscellaneous manufacturing statistics
1974 1985 1994a
No. of establishments 126,388 109,372 102,232 Food, beverages & tobacco 27,462 28,499 24,828 Textiles, garments & leather products 18,310 12,353 11,721 Wood products, paper & printing 25,132 14,921 14,551 Chemical, rubber & plastic products 6,217 6,556 6,061 Non-metal mineral products 14,216 10,919 4,615 Metals, machinery, transport & others 35,051 36,124 40,456
Total manufacturing employment (no.) 1,525,221 1,381,805 1,056,767
Workers per establishment 12.1 12.6 10.3
a Preliminary: number of sites (one site may host more than one establishment).
Source: INDEC, Censo Económico Nacional.
Argentina: Reference tables 65
EIU Country Profile 1997-98 © The Economist Intelligence Unit Limited 1997

Reference table 20
Manufacturing sector’s sales to the domestic market(domestic output)
1992 1993 1994 1995 1996
Vehicles (units) 243,363 311,213 360,721 224,961 215,131 % change 77.4 27.9 15.9 –37.6 –4.4
Beverages (beer, wine & soft drinks; ’000 hl) 45,256 45,428 48,000 43,743 44,456 % change 11.3 0.4 5.6 –8.9 1.6
Machine tools (1985=100) 160.0 145.1 135.6 123.6 107.7 % change 60.0 –9.3 –6.5 –8.8 –12.8
Pharmaceuticals (m units) 458.0 474.4 432.5 408.8 379.6 % change 6.2 3.6 –8.8 –5.5 –7.1
Cigarettes (m packets) 1,845.0 1,928.5 1,974.6 1,962.8 1,970.5 % change 6.8 4.5 2.4 –0.6 0.4
Tractors (units) 3,518 2,966 3,604 2,515 5,400 % change 8.9 –15.7 21.5 –30.2 114.7Source: INDEC.
Reference table 21
Minerals and quarrying output(Ps ’000; 1992 prices)
1992 1993 1994 1995 1996
Metallic minerals 55,875 44,137 40,821 42,357 40,287
Non-metallic minerals 120,603 126,264 119,249 123,717 149,457
Precious stones 257,170 308,023 306,646 345,209 351,768
Semi-precious stones 5 1,194 958 1,402 1,480
Total output 433,654 479,619 467,674 512,685 542,993Source: Secretaría de Minería.
Reference table 22
Agricultural production(’000 tonnes; crop years)
1992/93 1993/94 1994/95 1995/96 1996/97
Cereals 25,550 23,810 26,129 23,810 35,115 of which: maize 10,901 10,360 11,404 10,499 14,496 wheat 9,874 9,659 11,306 9,450 15,983 sorghum 2,860 2,148 1,650 2,132 2,552
Oilseeds 14,411 16,142 18,330 18,623 16,407 of which: soybeans 11,045 11,720 12,134 12,436 11,013 sunflower 2,956 4,095 5,800 5,558 5,021
Industrial crops (raw cotton, sugar cane, tobacco & tea) 11,088 12,282 15,148 15,278 n/a
Fruit 5,379 5,815 5,697 n/a n/a
Vegetables 4,525 5,122 5,707 n/a n/aSource: Secretaría de Agricultura, Ganadería y Pesca.
66 Argentina: Reference tables
EIU Country Profile 1997-98 © The Economist Intelligence Unit Limited 1997
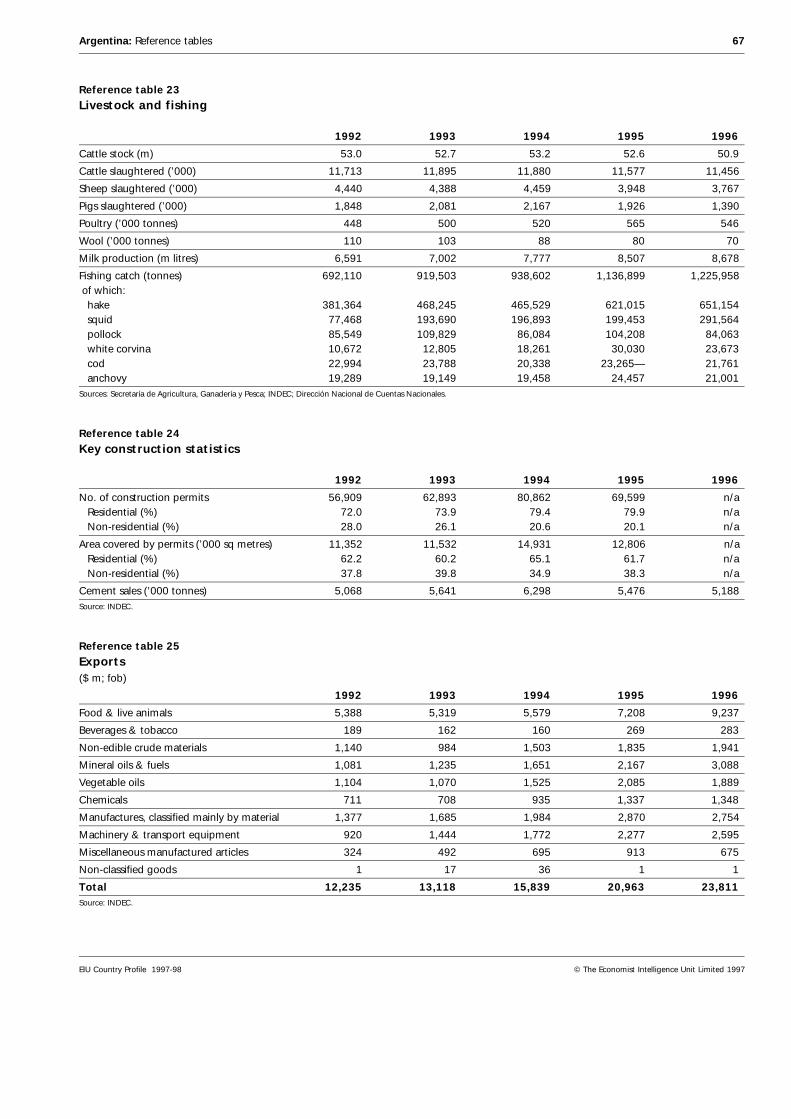
Reference table 23
Livestock and fishing
1992 1993 1994 1995 1996
Cattle stock (m) 53.0 52.7 53.2 52.6 50.9
Cattle slaughtered (’000) 11,713 11,895 11,880 11,577 11,456
Sheep slaughtered (’000) 4,440 4,388 4,459 3,948 3,767
Pigs slaughtered (’000) 1,848 2,081 2,167 1,926 1,390
Poultry (’000 tonnes) 448 500 520 565 546
Wool (’000 tonnes) 110 103 88 80 70
Milk production (m litres) 6,591 7,002 7,777 8,507 8,678
Fishing catch (tonnes) 692,110 919,503 938,602 1,136,899 1,225,958 of which: hake 381,364 468,245 465,529 621,015 651,154 squid 77,468 193,690 196,893 199,453 291,564 pollock 85,549 109,829 86,084 104,208 84,063 white corvina 10,672 12,805 18,261 30,030 23,673 cod 22,994 23,788 20,338 23,265— 21,761 anchovy 19,289 19,149 19,458 24,457 21,001Sources: Secretaría de Agricultura, Ganadería y Pesca; INDEC; Dirección Nacional de Cuentas Nacionales.
Reference table 24
Key construction statistics
1992 1993 1994 1995 1996
No. of construction permits 56,909 62,893 80,862 69,599 n/a Residential (%) 72.0 73.9 79.4 79.9 n/a Non-residential (%) 28.0 26.1 20.6 20.1 n/a
Area covered by permits (’000 sq metres) 11,352 11,532 14,931 12,806 n/a Residential (%) 62.2 60.2 65.1 61.7 n/a Non-residential (%) 37.8 39.8 34.9 38.3 n/a
Cement sales (’000 tonnes) 5,068 5,641 6,298 5,476 5,188Source: INDEC.
Reference table 25
Exports($ m; fob)
1992 1993 1994 1995 1996
Food & live animals 5,388 5,319 5,579 7,208 9,237
Beverages & tobacco 189 162 160 269 283
Non-edible crude materials 1,140 984 1,503 1,835 1,941
Mineral oils & fuels 1,081 1,235 1,651 2,167 3,088
Vegetable oils 1,104 1,070 1,525 2,085 1,889
Chemicals 711 708 935 1,337 1,348
Manufactures, classified mainly by material 1,377 1,685 1,984 2,870 2,754
Machinery & transport equipment 920 1,444 1,772 2,277 2,595
Miscellaneous manufactured articles 324 492 695 913 675
Non-classified goods 1 17 36 1 1
Total 12,235 13,118 15,839 20,963 23,811Source: INDEC.
Argentina: Reference tables 67
EIU Country Profile 1997-98 © The Economist Intelligence Unit Limited 1997
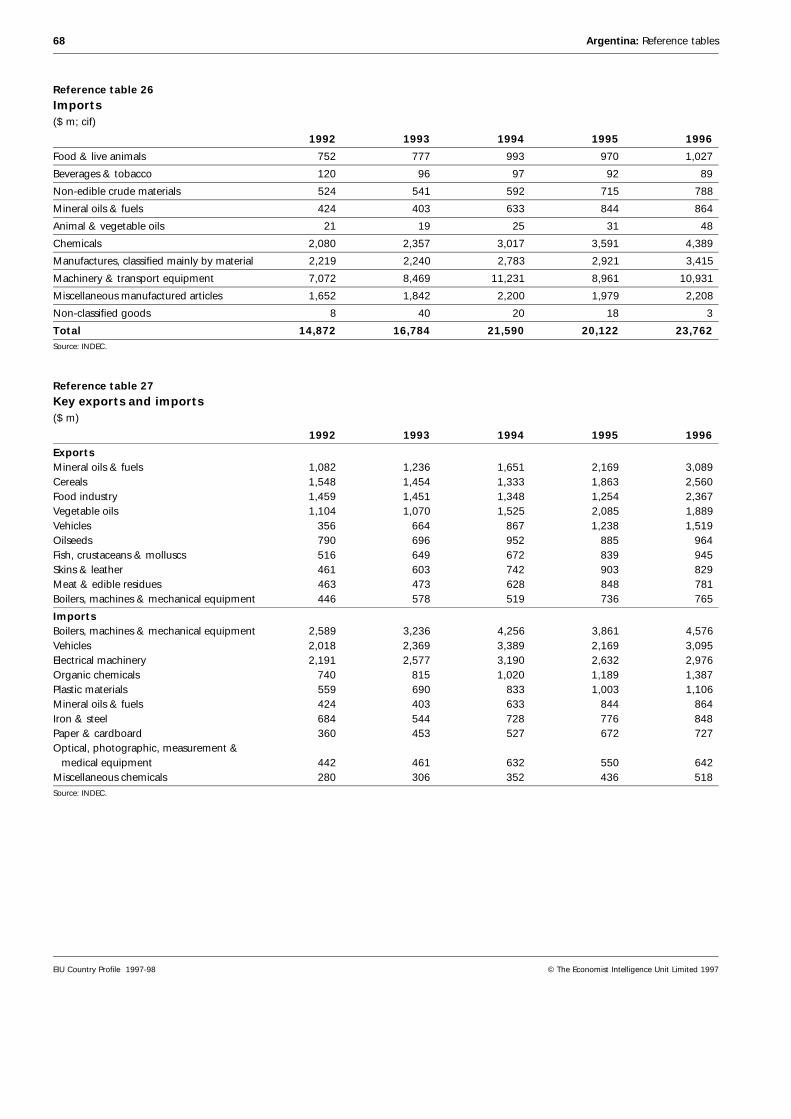
Reference table 26
Imports($ m; cif)
1992 1993 1994 1995 1996
Food & live animals 752 777 993 970 1,027
Beverages & tobacco 120 96 97 92 89
Non-edible crude materials 524 541 592 715 788
Mineral oils & fuels 424 403 633 844 864
Animal & vegetable oils 21 19 25 31 48
Chemicals 2,080 2,357 3,017 3,591 4,389
Manufactures, classified mainly by material 2,219 2,240 2,783 2,921 3,415
Machinery & transport equipment 7,072 8,469 11,231 8,961 10,931
Miscellaneous manufactured articles 1,652 1,842 2,200 1,979 2,208
Non-classified goods 8 40 20 18 3
Total 14,872 16,784 21,590 20,122 23,762Source: INDEC.
Reference table 27
Key exports and imports($ m)
1992 1993 1994 1995 1996
ExportsMineral oils & fuels 1,082 1,236 1,651 2,169 3,089Cereals 1,548 1,454 1,333 1,863 2,560Food industry 1,459 1,451 1,348 1,254 2,367Vegetable oils 1,104 1,070 1,525 2,085 1,889Vehicles 356 664 867 1,238 1,519Oilseeds 790 696 952 885 964Fish, crustaceans & molluscs 516 649 672 839 945Skins & leather 461 603 742 903 829Meat & edible residues 463 473 628 848 781Boilers, machines & mechanical equipment 446 578 519 736 765
ImportsBoilers, machines & mechanical equipment 2,589 3,236 4,256 3,861 4,576Vehicles 2,018 2,369 3,389 2,169 3,095Electrical machinery 2,191 2,577 3,190 2,632 2,976Organic chemicals 740 815 1,020 1,189 1,387Plastic materials 559 690 833 1,003 1,106Mineral oils & fuels 424 403 633 844 864Iron & steel 684 544 728 776 848Paper & cardboard 360 453 527 672 727Optical, photographic, measurement & medical equipment 442 461 632 550 642Miscellaneous chemicals 280 306 352 436 518Source: INDEC.
68 Argentina: Reference tables
EIU Country Profile 1997-98 © The Economist Intelligence Unit Limited 1997

Reference table 28
Trade volume indices(1993=100)
1992 1993 1994 1995 1996
Exports 93.5 100.0 117.4 146.9 155.9
Imports 86.6 100.0 126.9 112.2 133.7Source: INDEC
Reference table 29
Main trading partners ($ m)
1992 1993 1994 1995 1996
Exports to:Brazil 1,671 2,814 3,655 5,484 6,605US 1,349 1,264 1,724 1,770 1,939Chile 581 592 999 1,475 1,765Netherlands 1,212 1,271 1,180 1,191 1,224Spain 486 495 584 696 723Italy 525 505 654 736 720Uruguay 384 512 650 654 718Iran 324 248 229 510 637China 324 248 229 510 604Paraguay 272 358 498 631 583Mercosur 2,327 3,684 4,803 6,769 7,906EU 3,732 3,646 3,891 4,424 4,560NAFTA 1,614 1,557 2,070 2,029 2,322Total exports 12,235 13,118 15,839 20,963 23,811
Imports from:Brazil 3,339 3,570 4,286 4,175 5,309US 3,226 3,859 4,928 4,177 4,715Italy 760 980 1,431 1,259 1,503Germany 1,083 1,024 1,382 1,251 1,426France 574 739 1,072 1,040 1,180Spain 406 507 865 930 1,064Japan 697 669 620 711 725China 170 215 217 608 698UK 197 259 355 413 563Chile 646 706 831 514 558Mercosur 1,805 3,755 4,214 5,129 5,783 EU 3,633 4,140 6,168 6,009 6,900NAFTA 3,453 4,184 5,344 4,819 5,562Total imports 14,872 16,784 21,590 20,122 23,762Source: INDEC.
Argentina: Reference tables 69
EIU Country Profile 1997-98 © The Economist Intelligence Unit Limited 1997
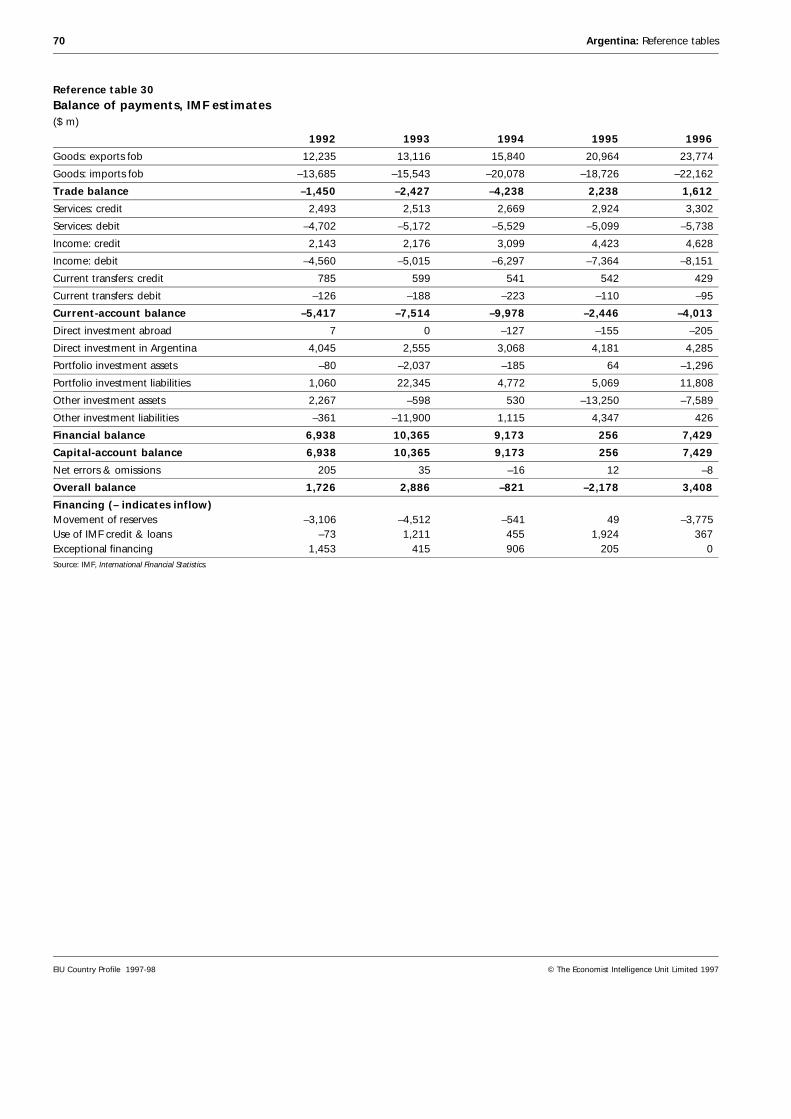
Reference table 30
Balance of payments, IMF estimates($ m)
1992 1993 1994 1995 1996
Goods: exports fob 12,235 13,116 15,840 20,964 23,774
Goods: imports fob –13,685 –15,543 –20,078 –18,726 –22,162
Trade balance –1,450 –2,427 –4,238 2,238 1,612
Services: credit 2,493 2,513 2,669 2,924 3,302
Services: debit –4,702 –5,172 –5,529 –5,099 –5,738
Income: credit 2,143 2,176 3,099 4,423 4,628
Income: debit –4,560 –5,015 –6,297 –7,364 –8,151
Current transfers: credit 785 599 541 542 429
Current transfers: debit –126 –188 –223 –110 –95
Current-account balance –5,417 –7,514 –9,978 –2,446 –4,013
Direct investment abroad 7 0 –127 –155 –205
Direct investment in Argentina 4,045 2,555 3,068 4,181 4,285
Portfolio investment assets –80 –2,037 –185 64 –1,296
Portfolio investment liabilities 1,060 22,345 4,772 5,069 11,808
Other investment assets 2,267 –598 530 –13,250 –7,589
Other investment liabilities –361 –11,900 1,115 4,347 426
Financial balance 6,938 10,365 9,173 256 7,429
Capital-account balance 6,938 10,365 9,173 256 7,429
Net errors & omissions 205 35 –16 12 –8
Overall balance 1,726 2,886 –821 –2,178 3,408
Financing (– indicates inflow)Movement of reserves –3,106 –4,512 –541 49 –3,775Use of IMF credit & loans –73 1,211 455 1,924 367Exceptional financing 1,453 415 906 205 0Source: IMF, International Financial Statistics.
70 Argentina: Reference tables
EIU Country Profile 1997-98 © The Economist Intelligence Unit Limited 1997
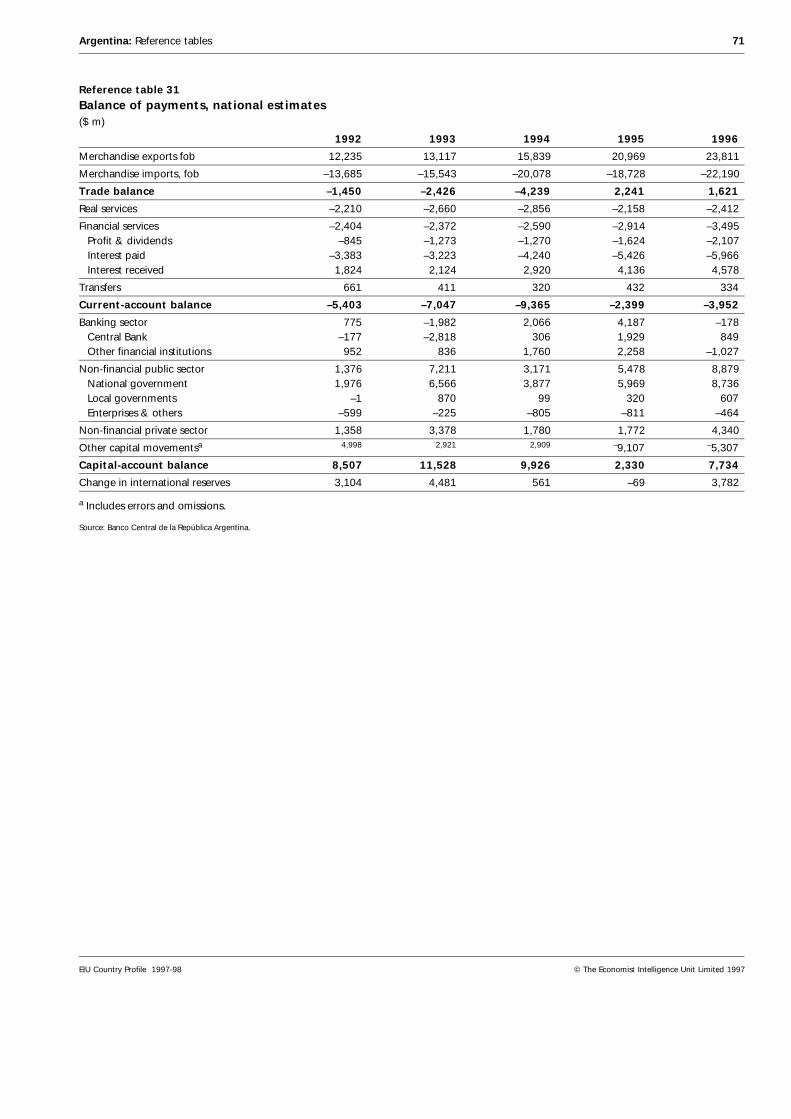
Reference table 31
Balance of payments, national estimates($ m)
1992 1993 1994 1995 1996
Merchandise exports fob 12,235 13,117 15,839 20,969 23,811
Merchandise imports, fob –13,685 –15,543 –20,078 –18,728 –22,190
Trade balance –1,450 –2,426 –4,239 2,241 1,621
Real services –2,210 –2,660 –2,856 –2,158 –2,412
Financial services –2,404 –2,372 –2,590 –2,914 –3,495 Profit & dividends –845 –1,273 –1,270 –1,624 –2,107 Interest paid –3,383 –3,223 –4,240 –5,426 –5,966 Interest received 1,824 2,124 2,920 4,136 4,578
Transfers 661 411 320 432 334
Current-account balance –5,403 –7,047 –9,365 –2,399 –3,952
Banking sector 775 –1,982 2,066 4,187 –178 Central Bank –177 –2,818 306 1,929 849 Other financial institutions 952 836 1,760 2,258 –1,027
Non-financial public sector 1,376 7,211 3,171 5,478 8,879 National government 1,976 6,566 3,877 5,969 8,736 Local governments –1 870 99 320 607 Enterprises & others –599 –225 –805 –811 –464
Non-financial private sector 1,358 3,378 1,780 1,772 4,340
Other capital movementsa 4,998 2,921 2,909 –9,107 –5,307
Capital-account balance 8,507 11,528 9,926 2,330 7,734
Change in international reserves 3,104 4,481 561 –69 3,782
a Includes errors and omissions.
Source: Banco Central de la República Argentina.
Argentina: Reference tables 71
EIU Country Profile 1997-98 © The Economist Intelligence Unit Limited 1997
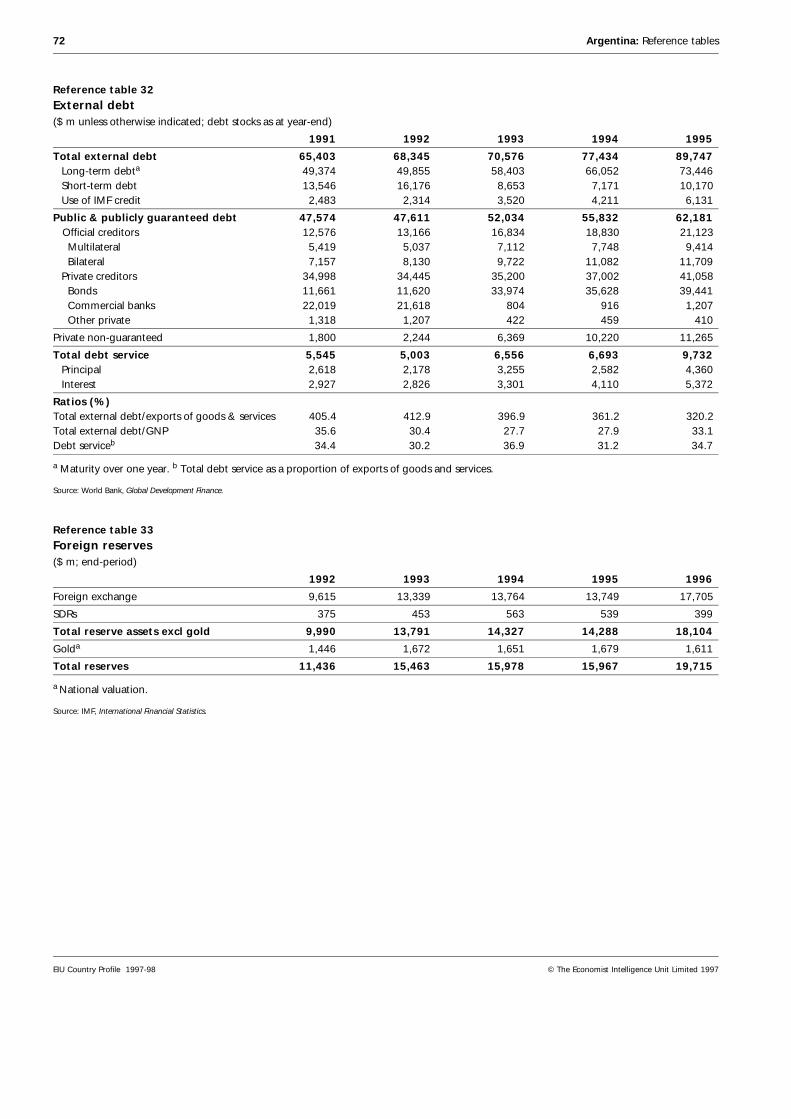
Reference table 32
External debt($ m unless otherwise indicated; debt stocks as at year-end)
1991 1992 1993 1994 1995
Total external debt 65,403 68,345 70,576 77,434 89,747 Long-term debta 49,374 49,855 58,403 66,052 73,446 Short-term debt 13,546 16,176 8,653 7,171 10,170 Use of IMF credit 2,483 2,314 3,520 4,211 6,131
Public & publicly guaranteed debt 47,574 47,611 52,034 55,832 62,181 Official creditors 12,576 13,166 16,834 18,830 21,123 Multilateral 5,419 5,037 7,112 7,748 9,414 Bilateral 7,157 8,130 9,722 11,082 11,709 Private creditors 34,998 34,445 35,200 37,002 41,058 Bonds 11,661 11,620 33,974 35,628 39,441 Commercial banks 22,019 21,618 804 916 1,207 Other private 1,318 1,207 422 459 410
Private non-guaranteed 1,800 2,244 6,369 10,220 11,265
Total debt service 5,545 5,003 6,556 6,693 9,732 Principal 2,618 2,178 3,255 2,582 4,360 Interest 2,927 2,826 3,301 4,110 5,372
Ratios (%)Total external debt/exports of goods & services 405.4 412.9 396.9 361.2 320.2Total external debt/GNP 35.6 30.4 27.7 27.9 33.1Debt serviceb 34.4 30.2 36.9 31.2 34.7
a Maturity over one year. b Total debt service as a proportion of exports of goods and services.
Source: World Bank, Global Development Finance.
Reference table 33
Foreign reserves($ m; end-period)
1992 1993 1994 1995 1996
Foreign exchange 9,615 13,339 13,764 13,749 17,705
SDRs 375 453 563 539 399
Total reserve assets excl gold 9,990 13,791 14,327 14,288 18,104
Golda 1,446 1,672 1,651 1,679 1,611
Total reserves 11,436 15,463 15,978 15,967 19,715
a National valuation.
Source: IMF, International Financial Statistics.
72 Argentina: Reference tables
EIU Country Profile 1997-98 © The Economist Intelligence Unit Limited 1997

Reference table 34
Exchange rates
1992 1993 1994 1995 1996
Nominal (end-period)Ps:$ 0.9905 0.9985 0.9995 1.0000 1.0000Ps: SDRs 1.3619 1.3715 1.4591 1.4865 1.4372
Real (annual averages; 1990=100)a
Ps:$ 61.3 56.2 54.5 54.6 55.8Ps:DM 67.7 60.2 60.5 67.4 65.0Ps:R 62.5 63.3 70.1 78.5 81.2
Effective real exchange rate index 63.8 59.4 60.5 64.7 65.6
a Deflated by consumer prices.
Sources: Carta Económica.
Editor:All queries:
Graham StockTel: (44.171) 830 1007 Fax: (44.171) 830 1023
Argentina: Reference tables 73
EIU Country Profile 1997-98 © The Economist Intelligence Unit Limited 1997