Embed Size (px)
Citation preview

Argela Network Performance Analytics Suite Provides• End to end visibility of your network by capturing and correlating different protocols
• Tools and applications for faster problem/issue troubleshooting and diagnostics
• Real-time detection of the network problems, outages and degradations before
having negative impact on customers
• Identification of the network utilization for optimum network planning
• Performance statistics and trends with the use of KPIs
Gain Visibility to Your Network Performance with Argela Network Performance Analytics
Argela Network Performance Analytics
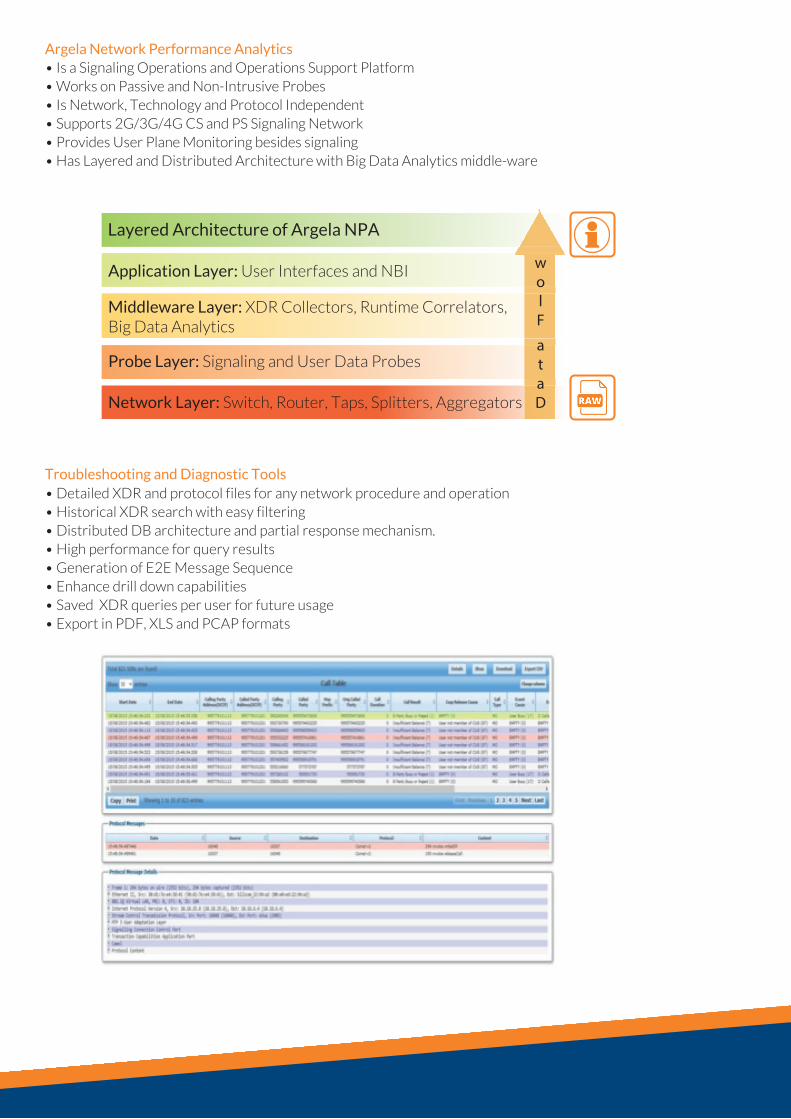
Argela Network Performance Analytics• Is a Signaling Operations and Operations Support Platform • Works on Passive and Non-Intrusive Probes• Is Network, Technology and Protocol Independent• Supports 2G/3G/4G CS and PS Signaling Network• Provides User Plane Monitoring besides signaling• Has Layered and Distributed Architecture with Big Data Analytics middle-ware
Troubleshooting and Diagnostic Tools• Detailed XDR and protocol files for any network procedure and operation• Historical XDR search with easy filtering• Distributed DB architecture and partial response mechanism.• High performance for query results• Generation of E2E Message Sequence• Enhance drill down capabilities• Saved XDR queries per user for future usage• Export in PDF, XLS and PCAP formats
Application Layer: User Interfaces and NBI
Probe Layer: Signaling and User Data Probes
Network Layer: Switch, Router, Taps, Splitters, Aggregators
Middleware Layer: XDR Collectors, Runtime Correlators, Big Data Analytics
Layered Architecture of Argela NPA
wolF ataD

Performance, Trends and Statistics• Real Time measurement of KPIs • Extensive ready KPI set• Historical trend analysis• Hourly KPI averages per network node and location• Multidimensional graphics to display multiple KPIs of different types • Multi-Dimensional KPIs for interoperability monitoring• Identification of poor performance nodes and locations by comparative analysis• Live graphics for NOC
Problem Detection• Detection and alarm generation for abnormal deviations and performance degradations• Alarm Notification via SMS, Email, SNMP• Customized alarm rule generation with combination of KPIs• Constant and Relative threshold usage in alarm definitions
Enhanced Features• Ready Scenarios for faster problem analysis (drop call analysis, handover analysis, etc.)• IMSI, MSISDN, IMEI enrichment on XDRs• Drop call detection• Handover and Paging correlation• Loop detection• Multi-domain, multi-protocol correlation
Service Enabler• XDR Feeeder for external systems - Customer Experience Management Systems - Regulatory Bodies/Applications - Location and Event Based Services• Open interfaces for XDR query• Real time event streaming to external systems
For more please contact us:
www.argela.com

www.argela.com
Key Benefits
• Increases Loyalty • By enabling proactive care - with network and service quality assurance - and real time problem detection • Shortening problem resolution time
• Decreases Opex / Capex • With fast resolution of problems thanks to troubleshooting tools • By creating valuable network utilization figures for network planning • By decreasing number of escalations
• Brings Full Visibility • By monitoring whole network with passive probes • By assessing the performance and interoperability of network in real time
• Enables New Revenue Streams • By providing event and location based real time triggers to value added services • By enriching real time offer/campaign management systems
IP Electrical: Ethernet, Fast and Giga EthernetIP Optical: Giga EthernetE1: TDM LSL, TDM HSL, ATM HSL
2G,3G,4G, GSM, GPRS, LTE, NGN, IMS, PSTNNetworks and Technologies
Protocols BSSAP, RANAP, DTAP, BSSMAP, MAP, CAP, INAP, BICC, ISUP, SIP, H248, GTP-C, GTP-U, S1-AP, SGs-AP, DIAMETER, RADIUS, SMPP, RTP, RTCP
Physical Transmission Interfaces
Applications and Categories
Categories: Web Browsing, Video/Audio, Streaming, Mail, P2P, VoIP, DNS,Applications: Youtube, Facebook, Whatsapp, Google, Twitter, etc.
Application Specific KPIs
Browsing Success, Page Response Delay, Streaming Throughput, Streaming Response Delay, Download Time, etc.
Network KPIs ASR, NER, Call Setup Success, Call Drop Ration, Paging Success Rate, Call Setup Time, Short Call Ratio, Average Call Duration, Packet Loss Rate, Jitter, Delay, Throughput, Out of Order Rate, etc..
Supported
CS Core: Aif, Iu-CS, C, D, E, F, Lc, Nc, McPS Core: Iu-PS, Gb, Gn, Gi, Gc, Gp, Gx, Gy, GzLTE: S1-MME, SGs, S6a/S6d, S4/S11, S5/S8, S1-U, S10, SgiNGN & IMS: Rf, Ro, Rx, Sh, Gx, Gy, Mg, Mi, Mj, Mk, Si
Interfaces