Embed Size (px)
Citation preview
© Cop yr ig h t 201 4 OSIso f t , LLC .
Presented by
Are you really using your information to increase
the effectiveness of assets and people?
Osvaldo A. Bascur, Metals Industry Principal, OSIsoft, LLC.

2
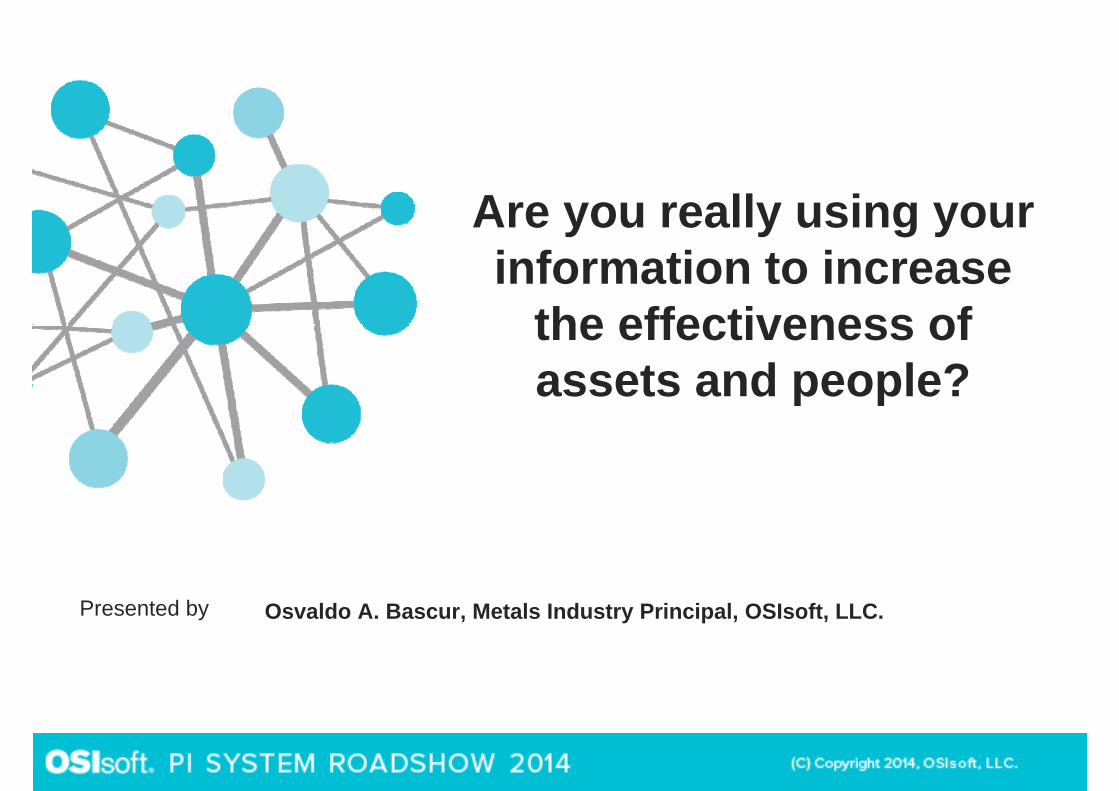
Competence Centers
Further work: Cloud
3
Early work and challenges
Current Forcing Factors
What is being done?

4
Where is the ‘PI System’ Used in Metals and Mining?Coal and Energy
• Alpha Natural Resources
• BHP Billiton• Cameco• Consol Energy• Energy Coal• Glencore• Murray Energy
Corporation• Peabody• Rio Tinto Coal• Sasol• Suncor Energy• Syncrude• Xstrata Coal
Iron Ore
• Arcelor Mittal• BHP Billiton• CAP• CLIFFS• Companhia Siderurgica
Nacional• Dongbu• Rio Tinto• SeverStal Resurs• TATA Steel• Usiminas• Vale
Copper
• Anglo American• Aurubis• BHP Billiton• Chinalco• Codelco• Escondida• Glencore• Freeport-McMoRan• Grupo Mexico• Ivanhoe Mines• Kennecott Utah Copper• KGHM• Rio Tinto• Southern Copper• Sumitomo Corporation• JianChi Copper
Nickel, Zinc, Lead and Silver
• Asturiana de Zinc• Grupo Paranapanama• KGHM• Glencore• Nyrstar• Penoles• QNI• Teckcominco• Vale• Votorantim
PGM and Gold
• Anglo American• Anglo Platinum• Barrick• Cameco• Goldcorp, Inc. • Umicore• Newmont• Kinross• Oceana Gold• Gold Fields
Diversified and Other Mining Companies
• Aditya Birla Group• Alcoa• Anglo American• Bhpbilliton• Cemex• Climax Molybdenum• Dubai Aluminum• Glencore• Italcementi• Hydro• Logan Aluminum• Mosaic• Rio Tinto
Mining Mineral Processing Metal Processing Product Manufacturing
Upstream Midstream Downstream

Energy/Water In Mineral Processing Plants
5
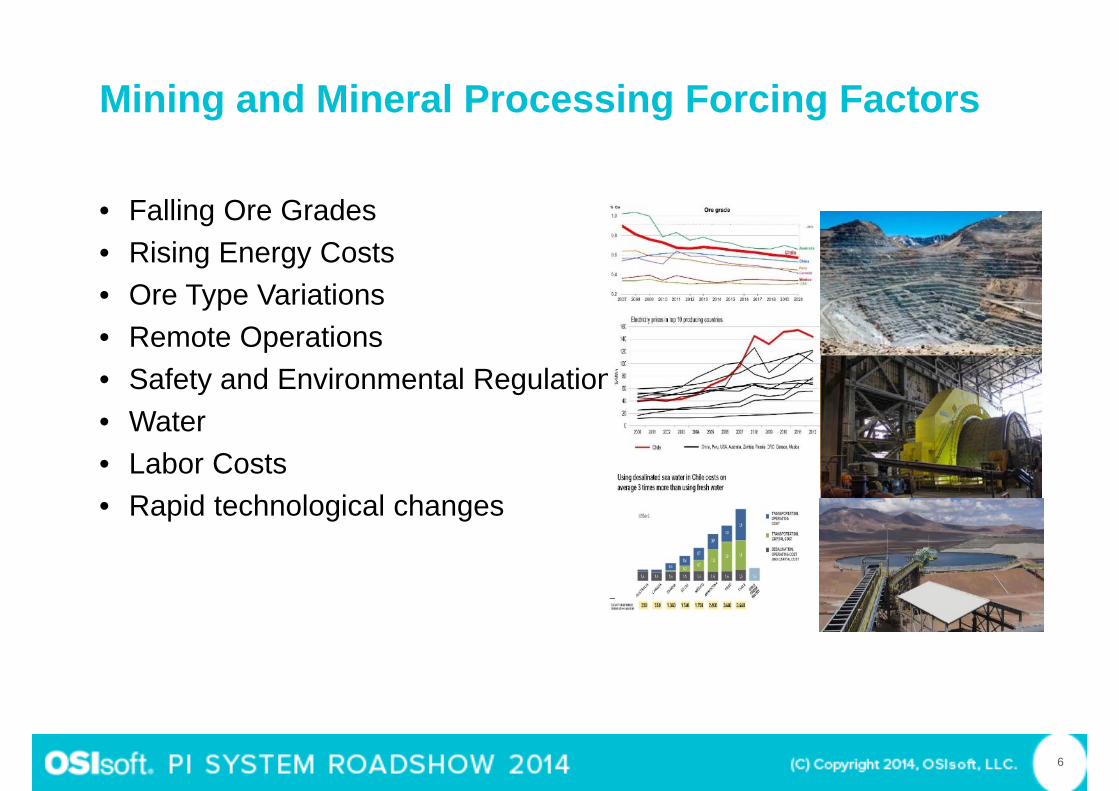
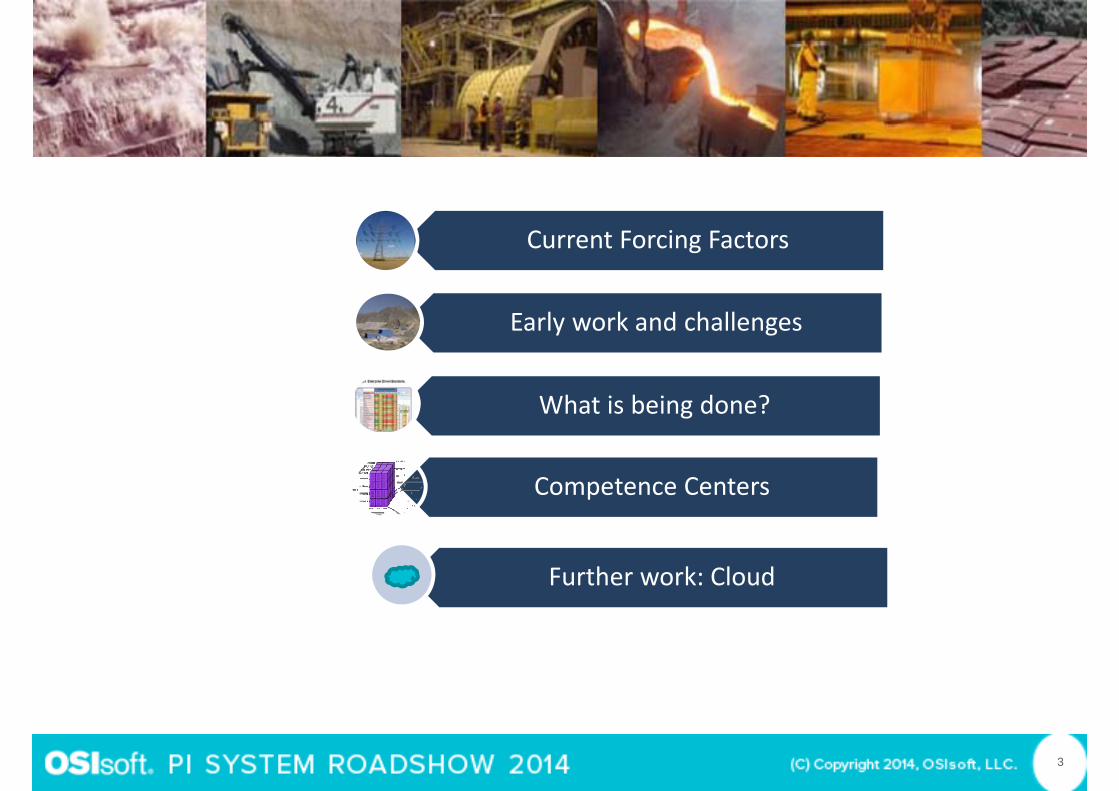
Mining and Mineral Processing Forcing Factors
• Falling Ore Grades• Rising Energy Costs• Ore Type Variations• Remote Operations• Safety and Environmental Regulations• Water• Labor Costs • Rapid technological changes
6

TailIngs
Dam
PRIMARYCRUSHER
4%
SAG Mill, 21 % Ball Mills, 31% Flotation
, 14 %
ThIckeners,
5%
Crushing andMilling, 58%
MINE,3%
Flotation, 23%
Oth
er, 7
%
Infra
stru
ctur
e an
d W
ater
, 8%
Oth
er, 7
%
Infra
stru
ctur
e an
d W
ater
, 8%
Electricity consumption in copper mineral processing
MINE,3%

Process AnalyticsRobotics
RemoteSensors
SmartSensors
Advanced Process Control
Continuous Video Monitoring
LearningOn-demand
OfflineDecisionMaking
MobileApps
ModernDesign Tools
BigData
Cloud Based andCollaborative Technologies
New Tools and Technologies in the 21st Century

Information – A Key Enabler for Manufacturing Excellence
10
New Technology Enables Improved Productivity through Employee Engagement and Enhanced Functionality to the Business Operating System
11
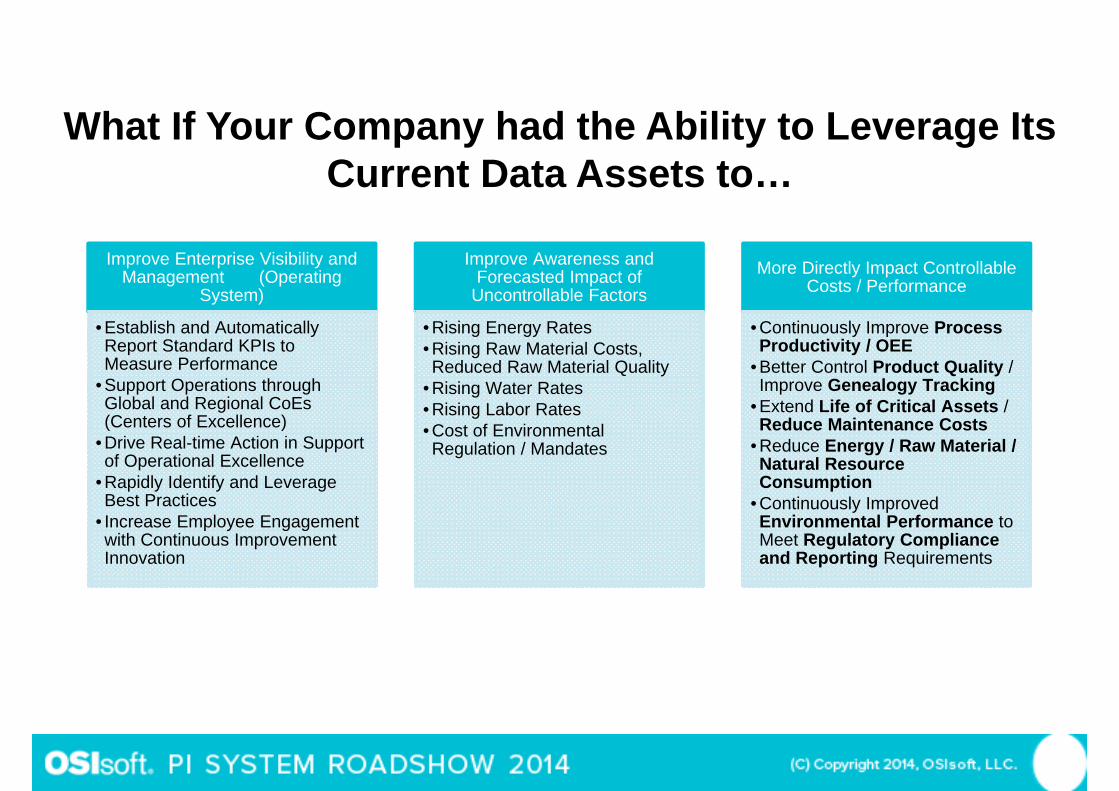
What If Your Company had the Ability to Leverage Its Current Data Assets to…
Improve Enterprise Visibility and Management (Operating
System)
• Establish and Automatically Report Standard KPIs to Measure Performance
• Support Operations through Global and Regional CoEs(Centers of Excellence)
• Drive Real-time Action in Support of Operational Excellence
• Rapidly Identify and Leverage Best Practices
• Increase Employee Engagement with Continuous Improvement Innovation
Improve Awareness and Forecasted Impact of
Uncontrollable Factors
• Rising Energy Rates• Rising Raw Material Costs, Reduced Raw Material Quality
• Rising Water Rates• Rising Labor Rates• Cost of Environmental Regulation / Mandates
More Directly Impact Controllable Costs / Performance
• Continuously Improve Process Productivity / OEE
• Better Control Product Quality / Improve Genealogy Tracking
• Extend Life of Critical Assets / Reduce Maintenance Costs
• Reduce Energy / Raw Material / Natural Resource Consumption
• Continuously Improved Environmental Performance to Meet Regulatory Compliance and Reporting Requirements

Who drives the Value?
12
- Operators leverage critical information when and where is needed in the field- Process Engineers develop ad-hoc analysis and “Best Practice” process
- And Visualization standards to improve location production management- And performance
- Supervisors and Area Managers review real time KPI and have drill down - Capability for root cause analysis and problem resolution
- TICoE leverage “Best Practices” analysis and visualization standards - Across the business for “Power Comparison”, root cause analysis- And improved performance
- Business Leadership is insured of timely, accurate and consistent information- For evaluating performance improvements and driving decisions

13
What would be the Results?
Improve Operating Cost Position• Reduce Sustaining Operations Cost / Improve Productivity• Reduce Working Capital (Inventory)• Improve Supply Chain Options / Performance
Increase Revenue Stream• Improve Overall Production Capacity / Quality• Improve Capacity / Mix of Higher Margin Products• Increase Asset Availability
Reduce Capital Requirements• Reduce Sustaining Capital Requirements• Reduce Capital Requirements for Information Solutions / System
Integration

The Evolution of the OSIsoft ‘PI System’
14
• Deployed in Support of Defined Process / Project Initiatives
• Provides Process Historian Functionality
• Component Pricing / Purchases
• Provides an Information Infrastructure
• Deployed as Data Foundation for the Plant / Enterprise Operating System
• Software / Services Purchased as Enterprise Agreements
What is Driving the Growth with Existing Customers?
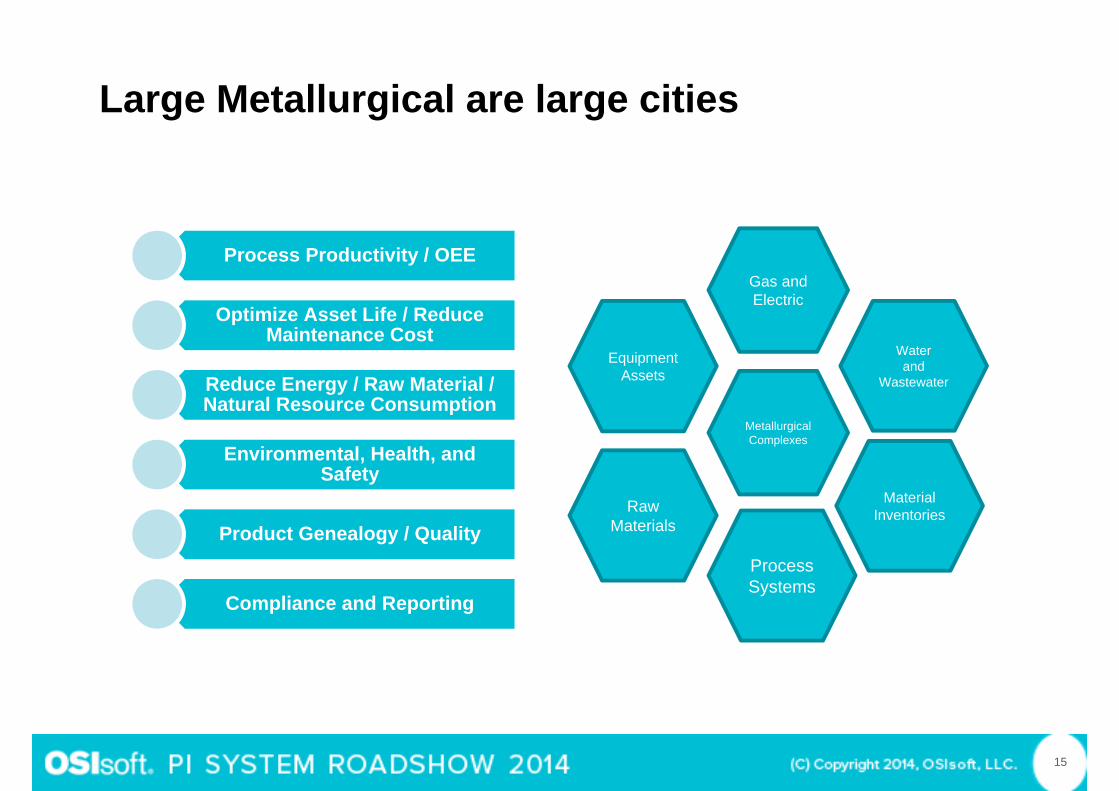
Large Metallurgical are large cities
15
Metallurgical Complexes
EquipmentAssets
Gas and Electric
Water and
Wastewater
Raw Materials
Process Systems
Material Inventories
Process Productivity / OEE
Optimize Asset Life / Reduce Maintenance Cost
Reduce Energy / Raw Material / Natural Resource Consumption
Environmental, Health, and Safety
Product Genealogy / Quality
Compliance and Reporting

Initiatives for Ore Types, Energy, Water and Metals Recovery
16
Harder andVariableOre
IncreasedEnergyConsumption
Sag MillingConcentrate
IncreasedWaterConsumption
MetalProducts
Time

Local vs. Collaborative Decision Making
17
KPI Examples: Production, Quality, Costs, Equipment Availability, Environmental and Safety alerts with fast resolution and improved decision making.
Continuous Improvement and Innovation
MONITOR
In Control?
Identify RootCauses
Yes Yes
NoNoKPIs ->
Local Operations/Maintenance
MONITOR
In Control?
Identify RootCauses
YesNo
IMPROVE
EstablishAlternatives
Satisfied?
Operations/Maintenance
Strategic Competence CentersMaintenance/Engineering/Management
Mines, Mills,
Smelters, Refineries
²Min
$$
TechnologyChangeBehavior
OneCenter

Information as an Enabler for the Business Operating System
18
18
The Infrastructure serves as a foundation for competitive advantage through:
With common data, talent across the globe will engage in collective innovation and the pursuit and sharing of best practices. The SMART architecture allows for the rapid deployment of ‘Best Practices’ through leverage of a common computing infrastructure
People Engagement & Best Practice
Process Measurement (KPI) Sharing a common language with other plants will allow us to truly realize Enterprise Advantage. A discovery in one plant can result in procedure, training, and policy changes in the other plants. SMART measures will become common measures. They will allow us to share best practices from one plant to another. Conventional manual data entry / transfers will be reduced.
Continuous Improvement
Better Results

Competence Centers:
19
ORE
WATER
CONCENTRATE
ENERGY
EQUIPMENT

The Mining, Mineral and Metals Industries
Mining Mineral Processing
MetallurgicalProcessing
MetalRefining
MetalManufacturing
Asset Optimization
Costs Reduction, Energy, Water, Environmental,
COMPETENCE CENTER Knowledge and Collaboration Data Integration, Validation, Event Frames and Notifications
ISO50001S95

Benefits of the Center Monitoring Diagnostics
• Common model for the operational and maintenance of the processing plants
• On-line expert support distributed for the operations and maintenance
• Transmitting core best practices to the operations• Maintain internal know how• Technological center of operational excellence
21

Transforming Data into Actionable Information
Zero SpanCommunications
Low HighFlow Compensation
If ( F>200 and T>100 Then ST=OKIf ( F < 200) Then ST = Trouble
Model PREDICTIONS
Debottleneck
Data Acquisition
Data Validation
Classification &Analysis
Model Selection
Coordination
HIERARCHY
Data History
Events
Actionable Information
Predictive Analytics

Leveraging Mine Mill Integration and Advanced Analysis
23

24
Integrated Mineral Processing

Ore Type 2
Ore Type 1
Grade
Recovery
Optimize Efficiency
OptimizeRecovery and Grade
Optimize Recovery
Optimize Grade
Grade Recovery Maps
Grade Recovery Performance Management

Southern Peru Copper: Cuajone
26
Cuajone Production 87,000 MT fine Copper per day. Conventional open-pit mine Concentrator - 10 Grinding Lines.

Traditional Strategy for Grade Recovery Optimization
27
TraditionalData Handling

Interface Mining SCADA
DISPATCH(Ultimos datos: )
Round
29/11/2001 20:06:39 418
Meteorización31316
pHDureza
Cu soluble %
Cu %Au g/t
5
0,09
Tipo de roca
4 - Pórfiro P23 - Pórfiro P3
5 - Pórfiro Los Amarillos6 - Andesita9 - Andesita Rubble Zone
Tipo de roca 1°
Tipo alteración
2 - Cuarzo-Magnetita1 - Potásica fuerte
3 - Epídoto-Clorita4 - Fílica5 - Argílica
Meteorización/Enriquecimiento
2 - Completamente meteorizada/alterada. Roca descompuesta y friable1 - Suelo residual. Fábrica original, destruida
3 - "Zona de Lixiviación" No visible Pyrita/Calcopirita.Alta meteorización/alteraciónRoca decolorada y de reducida resistencia por meteorización
4 - "Zona de enriquecimiento" Visible Calcosina/Covelina. Moderada meteorización/alteraciónRoca decolorada, pero su resistencia poco afectada solo en discontinuidades con meteorización
5 - Suave meteorización/alteración, resisrencia inalterada,meteorización solo en diaclasas6 - Fresca e inalterada. Alteración puede resultar en una mayor competencia de la roca (ej.silicificacion).
Dureza de roca
2 - Roca muy blanda1 - Roca extremadamente blanda
3 - Roca blanda4 - Roca de media a dura5 - Roca dura6 - Roca muy dura
3% Tipo de roca 1° 91,1Tipo de roca 2° 6% Tipo de roca 2° 8,9
7,614
0,75
0,84
Datos de mineral de mina al chancador, actualizado por hora.
Leyes Cu-Au-Cu soluble 01/12/2001 13:46:55
15:00 17:00 19:00 21:00 23:00 1:00 3:00 5:00 7:00 9:00 11:000,
1,6
0,
1,6
0,
1,
Round-Tipo de roca . 01/12/2001 13:46:55
15:00 17:00 19:00 21:00 23:00 1:00 3:00 5:00 7:00 9:00 11:0020000,
35000,
0,
6,
0,
6,
0,
100,
0,
100,
Round-Dureza-pH-Meteorización 01/12/2001 13:46:55
15:00 17:00 19:00 21:00 23:00 1:00 3:00 5:00 7:00 9:00 11:0020000,
35000,
0,
7,
5,
10,
0,
6,
Tendencias de las últimas 24 horas - Hacer doble click para ampliar
Ore Type Events
GPS
Mine Planning
Round #
Rock Type
Hardness
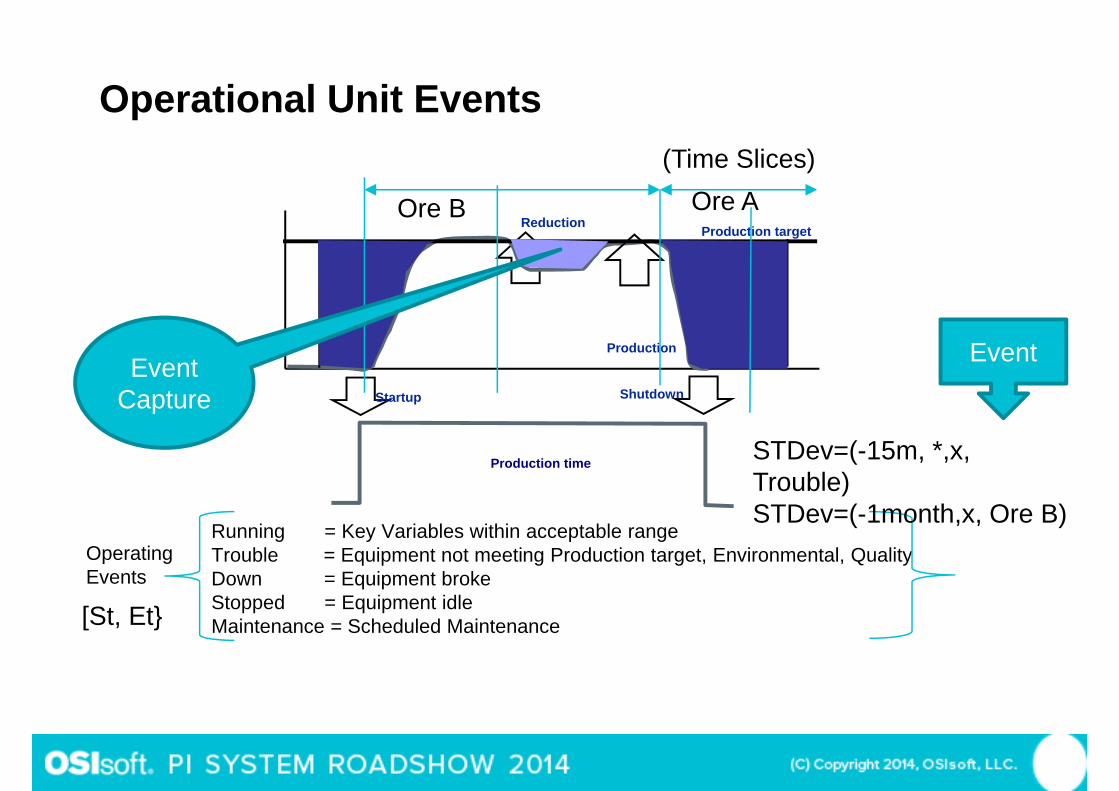
Operational Unit Events
Production
Production time
Production target
Startup Shutdown
Reduction
Running = Key Variables within acceptable rangeTrouble = Equipment not meeting Production target, Environmental, QualityDown = Equipment brokeStopped = Equipment idleMaintenance = Scheduled Maintenance
OperatingEvents
Ore B Ore A
EventCapture
(Time Slices)
[St, Et}
STDev=(-15m, *,x, Trouble)STDev=(-1month,x, Ore B)
Event

30

New Strategy for Grade Recovery Improvements
31
Events
EventsEvents

Big Data, Events and Business Intelligence tools
ProductionLines
Prod 1
Prod 3Prod 4
Prod 2
Mineral 1
Mineral 2
Mineral 3
Mineral 4
Ore Type
Time
01:00 02:00 03:00
44.70044.79044.70044.790
44.70044.79044.70044.790
69.03093.79069.03093.790
69.03069.79069.03069.790
42.793242.84042.793242.840
42.793242.84042.793242.840
85.13285.98085.13285.980
85.13285.98085.13285.980
94.11094.85394.11094.853
94.11094.85394.11094.853
81.23081.23481.23081.234
85.23085.23485.23085.234
Crushing
Thickening
Grinding
Flotation
Process Characteristics
Historical
OKTroubleDownStoppedMaintenance
Events
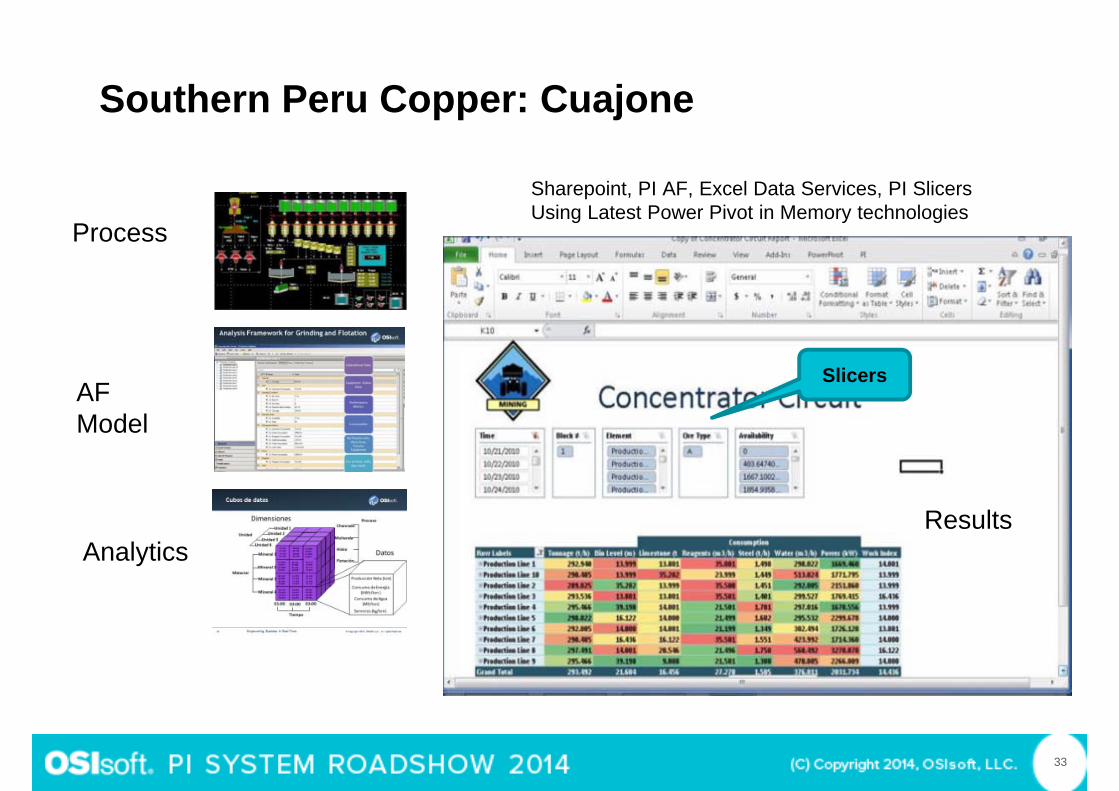
Southern Peru Copper: Cuajone
33
Sharepoint, PI AF, Excel Data Services, PI Slicers Using Latest Power Pivot in Memory technologies
Slicers
Process
AF Model
AnalyticsResults
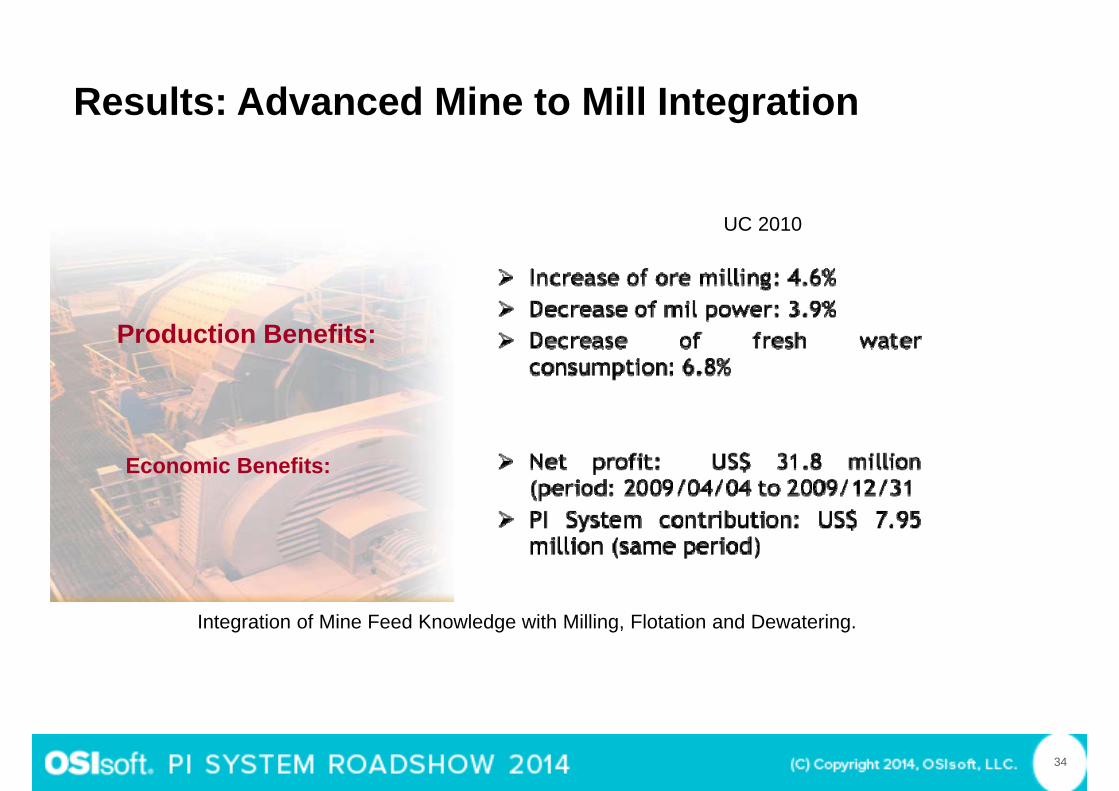
Results: Advanced Mine to Mill Integration
34
Economic Benefits:
Production Benefits:
Integration of Mine Feed Knowledge with Milling, Flotation and Dewatering.
UC 2010

Brought to you by
THANKYOU

© Cop yr ig h t 201 4 OSIso f t , LLC .
Brought to you by
THANKYOU