Embed Size (px)
Citation preview

Are you missing important peaks?Get better Monoclonal Antibody Resolution with MAbPac RP columns for High Performance Reverse Phase Chromatography
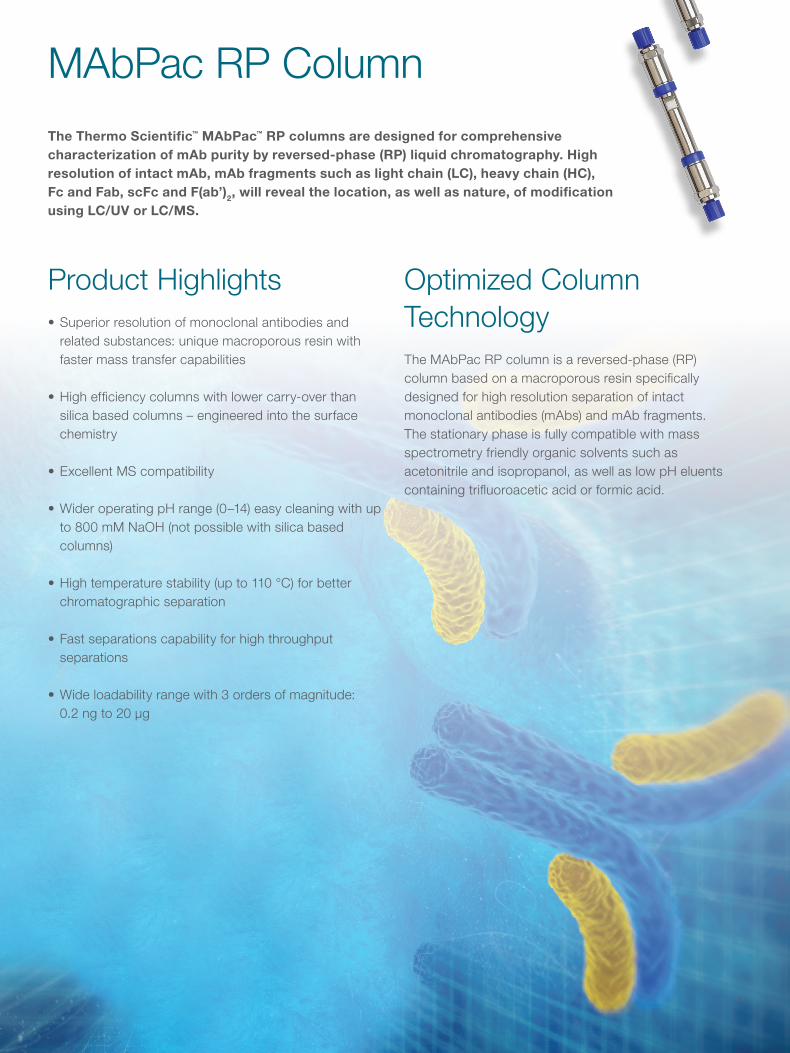
MAbPac RP ColumnThe Thermo Scientific™ MAbPac™ RP columns are designed for comprehensive characterization of mAb purity by reversed-phase (RP) liquid chromatography. High resolution of intact mAb, mAb fragments such as light chain (LC), heavy chain (HC), Fc and Fab, scFc and F(ab’)2, will reveal the location, as well as nature, of modification using LC/UV or LC/MS.
Product Highlights• Superior resolution of monoclonal antibodies and related substances: unique macroporous resin with faster mass transfer capabilities
• High efficiency columns with lower carry-over than silica based columns – engineered into the surface chemistry
• Excellent MS compatibility
• Wider operating pH range (0–14) easy cleaning with up to 800 mM NaOH (not possible with silica based columns)
• High temperature stability (up to 110 °C) for better chromatographic separation
• Fast separations capability for high throughput separations
• Wide loadability range with 3 orders of magnitude: 0.2 ng to 20 µg
Optimized Column TechnologyThe MAbPac RP column is a reversed-phase (RP) column based on a macroporous resin specifically designed for high resolution separation of intact monoclonal antibodies (mAbs) and mAb fragments. The stationary phase is fully compatible with mass spectrometry friendly organic solvents such as acetonitrile and isopropanol, as well as low pH eluents containing trifluoroacetic acid or formic acid.
2

Abso
rban
ce (m
AU)
Retention Time (min)
1.0 3.0 6.0 9.0 12.0 15.0
50
-10
100
50
-10
90
50
-10
80-20
140 mAb
LC
HC
Fc
Fab
scFc
Intact trastuzumab
Light chain/Heavy chain using DTT reduction
Fragments generatedusing papain digestion
Fragments generatedusing IdeS digestion
F(ab’)2
Papain digestion
Fab Fab
Fc
Reduction
IdeS
IgG
DTT
HC
LC
(ab')F2
IgG scFc
Column: MAbPac RP, 4 μmFormat: 3 × 50 mmMobile phase A: H
2O/FA/TFA (99.88 : 0.1:0.02 v/v/v)
Mobile phase B: MeCN/ H2O/FA/TFA (90: 9.88 : 0.1:0.02 v/v/v/v)
Gradient: Time (min) %A %B 0.0 80 20 1.0 80 20 11.0 55 45 12.0 55 45 14.0 80 20 15.0 80 20Temperature: 80 ºCFlow Rate: 0.5 mL/minInj. Volume: 5 μLDetection: UV (280 nm) Sample: (a) Trastuzumab (5 mg/mL) (b) Trastuzumab + DTT (4 mg/mL) (c) Trastuzumab + Papain (2 mg/mL) (d) Trastuzumab + IdeS (2 mg/mL)
Figure 1. Separation of mAb and mAb fragments.
Fast Separation of Intact Proteins/mAbs and Fragments
Superior Separation of mAb
Abso
rban
ce (m
AU)
7.00 8.00 10.00 12.00 13.00 Time (min)
-20
0
100
200
220
0.046
0.081
0.082
Competitor W, 3.5 μm
Competitor A, 3.5 μm
MAbPac RP, 4 μm
Column: RP columnsFormat: 3 × 50 mm or 4.6 × 50 mm Mobile phase A: H
2O/TFA (99.9 : 0.1 v/v)
Mobile phase B: MeCN/ H2O/TFA (90: 9.9 :0.1 v/v/v)
Gradient: Time (min) %A %B -3.0 80 20 1.0 80 20 11.0 50 50 12.0 50 50 12.1 80 20 15.0 80 20
Temperature: 80 ºCFlow Rate: 0.5 mL/min or 1.0 mL/minInj. Volume: 0.5 µL or 1 µL Detection: UV (280 nm)
Sample: NISTmAb (10.0 mg/mL)Peak Label: PWHH (min)
Figure 2. Comparison of NISTmAb separation.
MAbPac RP chemistry and morphology provides superior resolution of intact mAb and variants, as shown in this comparison with other column suppliers. Twice as many variants, with almost half of the peak width half height, are clearly resolved using the MAbPac RP column: resulting in easier and better identification throughout the analysis (Figure 2).
3

m/z
1200 1300 1400 1500 1600 18001700 1900 2000 2100 2200 2300 2400
0
10
20
30
40
50
60
70
80
90
100
Time (min)
3.0 3.5 4.0 4.5 5.0 5.5 6.0 6.5 7.0 7.5 8.0 8.5 9.0 9.5 10.0 10.5 11.00
50000100000150000200000250000300000350000400000450000500000550000600000
Rela
tive
Abun
danc
e
0
10
20
30
40
50
60
70
80
90
100
Rela
tive
Abun
danc
e
0
100
LC HC8.28
7.43
8.58 8.86 10.7710.373.943.63 9.114.793.2310.02
4.349.76
5.20 5.50 5.95 6.10 7.956.416.96
8.28
7.42
8.859.10
7.736.806.636.35
Rela
tive
Abun
danc
e
m/z
16101600 1620 1630 1640 1650 1660 1670
1638.29
1633.01
1643.60
1631.64
1640.08
1634.91
1628.28
1625.61
1646.93
1671.37
1624.16
1661.33
1605.32
1608.89
1666.591653.79
1620.16
1600.00
1615.28
31+
Rela
tive
Abun
danc
e
1638.291539.03
1692.831493.851751.18
1446.471813.69
1410.901880.81
1953.111368.362031.28
2115.811336.67
2200.692308.14
2253.372358.10
2418.02
1269.96
1238.96
2472.971180.58
2158.66
1954.16
1803.88
2131.631675.14
1563.47 2344.74
1465.80
1379.681303.03 1967.87 2146.62
1234.47 1687.01 2361.042233.121575.62
1819.281478.76
1762.962095.001392.8610
20
30
40
50
60
70
80
90
0
100
10
20
30
40
50
60
70
80
90
TIC
UV
LC: Light Chain MS Spectrum
HC: Heavy Chain MS Spectrum with multiple glycosylation forms
Column: MAbPac RP, 4 μmFormat: 3 × 50 mmMobile phase A: H
2O/FA/TFA (99.88 : 0.1:0.02 v/ v/v)
Mobile phase B: MeCN/ H2O/FA/TFA (90: 9.88 : 0.1:0.02 v/v/v/v)
Gradient: Time (min) %A %B 0.0 80 20 1.0 80 20 11.0 55 45 12.0 55 45 14.0 80 20 15.0 80 20Temperature: 80 ºCFlow Rate: 0.5 mL/minInj. Volume: 1 μLUV Detection: 280 nmMS Detection: Positive-ion modeMass Spec: Q Exactive Plus Sample: Reduced trastuzumab (4 mg/mL)
Figure 3. Reduced mAb LC/MS analysis.
LC/MS Analysis of Intact mAb and mAb Fragments The MAbPac RP column can be directly coupled to the mass spectrometer for MS detection of mAb and mAb fragments. Combination with the Thermo Scientific™ Q Exactive™ HF Hybrid Quadrupole-Orbitrap™ Mass Spectrometer enables accurate mass measurement of mAbs (Figure 3).
4

Column: MAbPac RP, 4 μmFormat: 1.0 × 150 mmMobile phase A: H
2O/FA (99.9 : 0.1 v/v)
Mobile phase B: MeCN/FA (99.0: 0.1 v/v)Gradient: Time (min) %A %B 0.0 90 10 1.0 80 20 15.0 55 45 16.0 10 90 20.0 10 90 20.1 90 10 25.0 90 10Temperature: 60 ºCFlow Rate: 0.1 mL/minInj. Volume: 1 μLMS Detection: positive-ion modeMass Spec: Q Exactive HF Sample: Pierce Intact Protein Standard Mix, 500 ng/μL (P/N A35526) 1. IGF-I LR3 (9 kDa) 2. Thioredoxin (12 kDa) 3. Protein G (21 kDa) 4. Carbonic Anhydrase II (29 kDa) 5. Protein AF (51 kDa) 6. Exo Klenow (68 kDa)
Figure 4a. Total ion chromatogram of the LC/MS analysis of the Intact Protein Standard Mix.
Relat
ive A
bund
ance
6 8
Time (min)
10 12 14 16
1
4
5
3
2
6
180
10
20
30
40
50
60
70
80
90
100
Figure 4c. List of identified proteins using Proteome Discoverer 2.1 software.
Thermo Scientific™ Pierce™ Intact Protein Mix consists of six recombinant proteins: IGF-I LR3 (9 kDa), thioredoxin (12 kDa), protein G (21 kDa), carbonic anhydrase II (29 kDa), protein AF (51 kDa), and exo klenow (68 kDa). These proteins are selected to satisfy the following criteria: 1) evenly covering a MW range of 10kD–66kD, 2) presenting mostly clean, modification and adduct-free ESI spectra, and 3) having ESI charge state distributions covered a wide m/z range from 500–2,000. A 1 mm ID MAbPac RP column was chosen to analyze these proteins because it provides higher sensitivity than larger internal diameter columns, when sample size is limited.
Figure 4a shows baseline separation of all six proteins using an acetonitrile/H2O/formic acid mobile phase. Top-down MS/MS spectra were acquired on a Q Exactive HF Hybrid Quadrupole-Orbitrap Mass Spectrometer using top 3–5 DDA method. OT MS1 data was acquired at resolution settings of 15 at m/z 200 and OTMS2 at a resolution of 120K at m/z 200. Figure 4b shows deconvolution results from Thermo Scientific™ Protein Deconvolution™ 4.0 software and Figure 4c shows top-down results from ProSight PD 1.1 node in Proteome Discoverer 2.1 software.
0
50
10068000.88Klenow
50459.42Protein AG
29038.2221441.92Protein G
11864.58Thioredoxin
9110.80
10000 20000 30000 40000 50000 60000 70000
Mass
IGF-I LR3
CA II
Top-down LC/MS/MS Analysis of Intact Protein Standards
5
Figure 4b. Average masses for all six proteins in the Intact Protein Standard Mix.

Column Column ID (mm)
Flow Rate(mL/min)
Pressure Limit (psi)
Temperature(ºC)
pH Range
MAbPac RP 3.0 0.50–1.00 4,000 < 110 0–14MAbPac RP 2.1 0.30–0.60 4,000 < 110 0–14MAbPac RP 1.0 0.075–0.15 4,000 < 110 0–14
Operational Specifications
Description Particle Size (μm)
Length (mm)
1.0 mm ID
2.1 mm ID
3.0 mm ID
MAbPac RP Columns
Analytical 4 50 302597 088648 088645100 302695 088647 088644150 302598
Guard Cartridges (2/pk)* 10 088649 088646
Ordering Information
Physical Data
Chemistry PhenylPolymer substrate DVB particlesParticle size 4 µmPore size 1,500 Å
Column housingStainless steel for the 3.0 and 2.1 mm ID PEEK for the 1.0 mm ID
Find out more at thermofisher.com/mabpac
For Research Use Only. Not for use in diagnostic procedures. © 2017 Thermo Fisher Scientific Inc. All rights reserved. All trademarks are the property of Thermo Fisher Scientific and its subsidiaries unless otherwise specified. BR21696-EN 0517S
* Standard Guard Cartridge Holder Required: P/N 069580