Embed Size (px)
Citation preview
RESEARCH ARTICLE
Are we validly assessing major depression
disorder risk and associated factors among
mothers of young children? A cross-sectional
study involving home visitation programs
Arthur H. OworaID1*, Helène Carabin2, Tabitha Garwe2, Michael P. Anderson2
1 Department of Public Health, Falk College, Syracuse University, Syracuse, New York, United States of
America, 2 Department of Biostatistics and Epidemiology, University of Oklahoma Health Sciences Center,
Oklahoma City, Oklahoma, United States of America
Abstract
Failure to account for misclassification error accruing from imperfect case-finding instru-
ments can produce biased estimates of suspected major depression disorder (MDD) risk
factor associations. The objective of this study was to estimate the impact of misclassifica-
tion error on the magnitude of measures of association between suspected risk factors and
MDD assessed using the Center of Epidemiological Studies on Depression—Short Form
during the prenatal and postnatal periods. Baseline data were collected from 520 mothers
participating in two home visitation studies in Oklahoma City between 2010 and 2014. A
Bayesian binomial latent class model was used to compare the prevalence proportion ratio
(PPR) between suspected risk factors and MDD with and without adjustment for misclassifi-
cation error and confounding by period of MDD symptom on-set. Adjustment for misclassifi-
cation error and confounding by period of MDD on-set (prenatal vs postnatal) showed that
the association between suspected risk factors and MDD is underestimated (-) and overesti-
mated (+) differentially in different source populations of low-income mothers. The median
bias in the magnitude of PPR estimates ranged between -.47 (95% Bayesian Credible Inter-
vals [BCI]: -10.67, 1.90) for intimate partner violence to +.06 (95%BCI: -0.37, 0.47) for race/
ethnicity among native-born US residents. Among recent Hispanic immigrants, bias ranged
from -.77 (95%BCI: -15.31, 0.96) for history of childhood maltreatment to +.10 (95%BCI:
-0.17, 0.39) for adequacy of family resources. Overall, the extent of bias on measures of
association between maternal MDD and suspected risk factors is considerable without
adjustment for misclassification error and is even higher for confounding by period of MDD
assessment. Consideration of these biases in MDD prevention research is warranted.
Introduction
Major depression disorder (MDD) is prevalent among women and is correlated with poor
health and psychosocial outcomes for both mothers and the children under their care [1, 2].
PLOS ONE | https://doi.org/10.1371/journal.pone.0209735 January 7, 2019 1 / 18
a1111111111
a1111111111
a1111111111
a1111111111
a1111111111
OPEN ACCESS
Citation: Owora AH, Carabin H, Garwe T, Anderson
MP (2019) Are we validly assessing major
depression disorder risk and associated factors
among mothers of young children? A cross-
sectional study involving home visitation
programs. PLoS ONE 14(1): e0209735. https://doi.
org/10.1371/journal.pone.0209735
Editor: Laura C. Rosella, University of Toronto,
CANADA
Received: June 15, 2017
Accepted: December 11, 2018
Published: January 7, 2019
Copyright: © 2019 Owora et al. This is an open
access article distributed under the terms of the
Creative Commons Attribution License, which
permits unrestricted use, distribution, and
reproduction in any medium, provided the original
author and source are credited.
Data Availability Statement: Data underlying this
study cannot be made publicly available due to
legal and ethical restrictions, imposed by the
Administration of Children, Youth, and Families,
USDHHS, the Health Resources and Services
Administration, and the Oklahoma University
Health Sciences Center (OUHSC) IRB, as the data
contains potentially identifying, sensitive participant
information. Data requests can be sent to the
Oklahoma University Health Sciences Center
Institutional Review Board and Director of Office of
Depressed women have poorer health, psychosocial outcomes and lower quality of life than
non-depressed women [3, 4]. Children of depressed mothers are more likely to exhibit general
difficulties in functioning, attachment problems, and develop mood disorders than children of
non-depressed mothers [5, 6]. These negative outcomes for both mother and child make the
accuracy of MDD detection critical for the identification of malleable risk factors with inter-
vention potential that could aid MDD prevention efforts.
The results of five meta-analyses of factors associated with maternal MDD have classified
the magnitude of effects as being small (obstetric and pregnancy complications, cognitive attri-
butions, relationship problems and social economic status), moderate (childcare stress, low
self-esteem, and neuroticism) and strong (stressful life events, lack of social support, maternal
age and a history of depression)[7–11]. Most of these factors are prevalent among socially dis-
advantaged women, potentially resulting in large numbers of mothers developing MDD and
consequently a substantial public health burden.
To address this issue, all 50 states have now adopted home visitation programs to support
socially disadvantaged mothers and enhance efforts to improve maternal and child health out-
comes (including reduction of the burden of MDD)[2, 12, 13]. In order to maximize the
potential benefit of home visitation programs, it is essential to accurately identify which factors
are associated with MDD, so that modifiable factors are intervened on to reduce the risk of
MDD. Significant bivariate associations between MDD and trauma history[14, 15], young
maternal age[12, 14], history of intimate partner violence[16], parent distress[16, 17], history
of child abuse[14, 15] and anxiety/distrust problems[12] have been reported in studies con-
ducted among high risk populations in home visitation settings. However, these results may be
biased by the presence of confounders such as period of MDD assessment (prenatal versus
postnatal). Moreover, most of these associations are based on MDD assessments using imper-
fect (i.e. less than 100% sensitivity and specificity) case-finding instruments.
MDD case-finding instruments rely on the self-report of MDD-related symptoms which is
particularly prone to misclassification error because mothers are likely to report what is
expected of them (social desirability bias), may interpret MDD symptom descriptions differ-
ently according to their cultures[18–20] and may confuse MDD symptoms with normal symp-
toms felt by women during the prenatal and postnatal period [21]. Additionally, the reliability
of MDD case-finding instrument symptom assessments within and between reporters (moth-
ers) vary widely [13, 22–24].
The validity (i.e. sensitivity and specificity) of MDD case-finding instruments also vary
depending on cutoff-point thresholds and period of MDD assessment [25]. The resulting false
positives and negatives (misclassification error) can over or under-estimate the prevalence of
MDD [26] and consequently measures of association between risk factors and MDD [27, 28].
In the context of home visitation programs, MDD case-finding instruments (e.g. Center for
Epidemiologic Studies Depression Scale–Short Form—CESD-SF) are conducted at home [29],
which by itself could increase or reduce the level of misclassification error compared to struc-
tured diagnostic interviews (based on Diagnostic and Statistical Manual of Mental Disorders
criteria for MDD) in a clinical setting. Indeed, it is possible that a mother would feel uncom-
fortable admitting to some of the symptoms measured in the MDD case-finding instrument in
front of her children, partner or other household members. She may also feel less at ease
admitting to such symptoms in front of a home visitor, who often lacks the training needed to
identify and address depressive symptoms.
We recently applied Bayesian latent class methodology to estimate the impact of mis-
classification error on the estimated prevalence proportion of MDD among mothers of young
children (0–5 years old) during prenatal and postnatal periods; our findings showed that com-
bining these periods confounded bias estimates (i.e. amount by which the prevalence
Major depression disorder risk factors among mothers of young children
PLOS ONE | https://doi.org/10.1371/journal.pone.0209735 January 7, 2019 2 / 18
Human Research Participant Protection (donna-
Funding: This work was supported by
Administration of Children, Youth, and Families
(grant number 90CA1764), Health Resources and
Services Administration (grant number
D89MC23154). The funders had no role in study
design, data collection and analysis, decision to
publish, or preparation of the manuscript.
Competing interests: The authors have declared
that no competing interests exist.
proportion was under- or over-estimated) [26]. To our knowledge, no study has examined the
individual or joint impact of misclassification error and confounding by period of MDD
assessment on measures of association between suspected risk factors and MDD in home visi-
tation settings or among women in general. Therefore, the objective of our study is to extend
our previous work [26] by examining (1) the impact of CESD-SF case-finding instrument mis-
classification error, and (2) the joint impact of misclassification error and confounding by
period of MDD assessment on measures of association between MDD and suspected risk fac-
tors among mothers of young children enrolled at two home visitation program study sites.
We also compare and contrast the impact of these issues between the two study sites.
Methods and procedures
Oklahoma University Health Sciences Center IRB approved study related procedures and
activities.
Data source
This study is a secondary analysis of the baseline component of two ongoing home visitation stud-
ies targeting mothers of young children in Oklahoma, which targeted two distinct populations.
One study site, SITE I, targeted a diverse racial/ethnic mix of low-income mothers while the
other, SITE II, targeted a population of low-income, first and second-generation Hispanic immi-
grant mothers. The objective of these studies was to examine the effectiveness of evidence-based
home visitation programs on improving parent-infant/child outcomes such as prevention of child
maltreatment, reducing parent substance and alcohol abuse, intimate partner violence and parent-
ing stress. The two study populations had very different distributions of risk factors and frequency
of MDD [26], which resulted in important differences in the measures of association between the
sites. This led to the decision to report the results separately for the two study sites.
Study design
The baseline components of two conveniently chosen ongoing home visitation study sites were
analyzed as cross-sectional designs. Baseline data were collected between December 2010 and
December 2014 from consecutively enrolled mothers of children aged five years or younger.
Study setting
Participants in the ongoing home visitation studies were recruited from physician offices,
medical centers, faith-based organizations, schools, mental health agencies, other HV pro-
grams, and welfare programs (e.g. Women, Infants and Children program) in Oklahoma City.
At baseline, prior to enrollment in home visitation services, mothers completed a battery of
questionnaires including questions on basic socio-demographic information, family and social
supports, history of intimate partner violence, childhood maltreatment and MDD symptoms
(using the CESD-SF). These questionnaires were completed using an audio computer assisted
self-interview (ACASI) application with assistance from a trained data collector if needed.
Study participants
The three inclusion criteria for the current analysis were: 1) being a mother, 2) having at least
one child who was five years old or younger at baseline (pregnant women with no other chil-
dren were ineligible), and 3) having a completed CESD-SF at baseline. For our study analyses,
because we focused on baseline data, miscarriages, stillbirth or death of children after baseline
assessments did not influence our study findings.
Major depression disorder risk factors among mothers of young children
PLOS ONE | https://doi.org/10.1371/journal.pone.0209735 January 7, 2019 3 / 18
Informed verbal and written consent was obtained from all eligible study participants. For
minors, involved in the study, we obtained their verbal and written consent as well as that of
their parents or guardians. Differences in the distribution of study characteristics at the two
study sites (SITE I and II) were examined and are summarized elsewhere [26].
MDD outcome ascertainment
The operational definition of MDD status was determined using the CESD-SF. Here, the
results of the CESD-SF are not used as a diagnosis of MDD but rather are indicative of the
presence of MDD-related symptoms. Only a qualified health professional can diagnose MDD
through a more thorough diagnostic interview. Mothers at baseline completed the CESD-SF in
English or Spanish prior to initiation of home visitation services. The CESD-SF is a 12-item
multi-choice instrument designed to assess if an individual has exhibited some level of MDD-
related symptoms during the past week with scores ranging from 0 to 36 [29]. The CESD-SF is
derived from the 20-item scale originally developed as a measure of MDD-related symptoms
in community-based epidemiological studies [29, 30]. This instrument has been used to screen
for MDD during the prenatal, postnatal and combined periods [31–33]. Having moderate
MDD symptoms was defined operationally as a CESD-SF score of 10 or above [29]. This
threshold is comparable to the cut-off point threshold of 16 (�16) on the CESD20 [29]. The
CESD-SF showed good internal consistency (Cronbach’s alpha) for the assessment of depres-
sion-related symptoms at both SITE I (0.92) and II (0.93).
We operationally define periods of MDD assessment among study participants as ‘prenatal’
or ‘postnatal’ depending on whether the CESD-SF baseline assessment were administered during
pregnancy or after childbirth, respectively. Eligible pregnant women or mothers had at least one
child who was five years old or younger. In this study, the term the ‘misclassification error’ refers
to the incorrect classification of an individual as either a false positive or false negative by the
CESD-SF. ‘Confounding by period of MDD assessment’ refers to the distortion of the relation-
ship (measured by the prevalence proportion ratio) between an individual’s true MDD status
and suspected risk factor as a function of the differential proportion distribution of assessments
(prenatal versus postnatal) among individuals with and without a risk factor of interest.
Measurement and definition of suspected risk factors
Information on suspected MDD risk factors (e.g. socio-demographic characteristics, adequacy of
family resources and social support, history of childhood maltreatment and intimate partner vio-
lence) is derived from self-report questionnaires administered at baseline. Factors that have been
previously identified as risk factors for MDD among mothers were examined [2]. Self-reported
race and ethnicity was categorized as White, Black, and Other (i.e. Hispanic, Native American
and Asians). The adequacy of resources in households with children and the degree to which a
respondent’s social relationships provide various dimensions of social support were measured
using the 30-items Family Resources Scale-Revised [34] and the 12-items Social Provisions Scale-
Short Form [35], respectively. A history of childhood maltreatment was determined based on a
self-report of any child abuse or neglect event that occurred during a mother’s childhood. Pres-
ence of intimate partner violence (among mothers who reported being in a relationship at base-
line) was determined based on a self-report of physical assault by a partner (i.e. physical assault
victimization sub-scale) in the past six months on the Conflict Tactics Scale Second version [36].
Statistical analysis
Measures of association (estimated by prevalence proportion ratios) were generated for each
study site separately since they targeted very different populations of mothers and the impact
Major depression disorder risk factors among mothers of young children
PLOS ONE | https://doi.org/10.1371/journal.pone.0209735 January 7, 2019 4 / 18
of the different risk factors were expected to vary between sites. Prevalence proportion ratios
(PPRs) were obtained by comparing prevalence proportions between sub-groups defined by
levels or categories of a characteristic/risk factor to a reference sub-group (i.e.
PPR = prevalence proportion in sub-group 1/ prevalence proportion in sub-group 2 [reference
group]).
The Bayesian latent class models used for the estimation of prevalence proportions are
described in our previous study [26]. Briefly, the probability of a test result and probability of
MDD are related via conditional probability concepts as follows: P (T+) = P (T+|D+) P (D+)
+ P (T+|D-) P (D-) where P(T+) corresponds to the proportion of participants testing positive
for MDD (observed prevalence), P (T+|D+) to the sensitivity of the test, P (T+|D-) corresponds
to one minus the specificity of the test, and P (D+) to the true prevalence of MDD.
Therefore, P (D+) = (P (T+|D+) + P (T-|D+))/ (P (T+|D+) + P (T+|D-) + P (T-|D-) + P (T-|
D+)). In the absence of a gold standard, this equation cannot be solved directly since there are
three unknown parameters (sensitivity, specificity and true prevalence) but only one degree of
freedom from the observed data (number of positive tests out of the total sample size fixes the
number testing negative). A Gibbs sampler is used to randomly sample the joint posterior den-
sity of the parameters of interest (sensitivity, specificity and true prevalence) which is the prod-
uct of the likelihood of the data (latent and observed) and prior distributions of all parameters.
The samples from the joint posterior distribution are then used to generate the marginal poste-
rior densities of prevalence proportion, sensitivity and specificity parameters.
For PPR estimation, all investigated risk factors were dichotomized. The FRS and SPS scales
were dichotomized based on the median value of the participants’ scores to represent high ver-
sus low family resources and social support respectively. Marital status was dichotomized into
married or living with a partner versus single (i.e. never married, divorced, separated or wid-
owed). Being born in the US, having healthcare insurance, history of childhood maltreatment
and history of intimate partner violence were dichotomized as yes/no variables. Educational
level was dichotomized as attainment of high school or General Education Development
(GED) equivalent or higher versus less than a high school diploma/GED. Employment status
was dichotomized as full or part-time versus unemployed and maternal age was dichotomized
(based on the median age of 25 years old).
For each sub-group defined by the presence or absence of a characteristic, the MDD preva-
lence proportions were obtained using a Bayesian latent class analysis model in the absence of
a ‘gold standard’ with and without adjustment for CESD-SF misclassification error and con-
founding by period of MDD assessment. The median estimate of the posterior density distri-
bution of each PPR for each investigated characteristic including its 95% Bayesian Credible
Interval (95%BCI) were obtained separately. The 95% BCIs give us the 95% probability cover-
age range of median PPR values. S1 File shows the WinBUGS program code used to generate
these estimates.
Convergence was assessed by examining the plots of chain histories, the results from the
Geweke test [37], Heidelberger-Welch stationary test [38], and Gelman-Rubin test [39]. Win-
BUGS software (version 1.4.3, MRC Biostatistics Unit, Cambridge, UK) was used to imple-
ment the Bayesian latent class models [40].
Handling of missing data
WinBUGS automatically simulates values for missing observations according to the specified
likelihood distribution (in our case—binomial distribution), conditional on the current
values of all relevant unknown parameters (i.e. prevalence proportions and PPRs) described
above.
Major depression disorder risk factors among mothers of young children
PLOS ONE | https://doi.org/10.1371/journal.pone.0209735 January 7, 2019 5 / 18
Prior distributions
Informative prior estimates of CESD-SF sensitivity and specificity among mothers of young
children were based on a previous systematic review where the posterior estimates of sensitiv-
ity and specificity were obtained for CESD20 with consideration for misclassification error
in the reference standards [41]. Only one study, Tandon et al [33], provided prenatal and
postnatal period specific diagnostic performance estimates. The period-specific posterior esti-
mates derived from a Bayesian Hierarchical Summary Receiver-Operating Characteristic
Curve (HSROC) meta-analysis model [41] are considered as prior information (Table 1).
Informative priors are a key part of Bayesian inference that represent information about an
uncertain parameter (in our case the sensitivity and specificity estimates of the CESD-SF).
These priors are combined with the probability distribution of new data (True Positives, True
Negatives, False Positives, and False Negatives) to yield a posterior distribution of case-finding
instrument sensitivity and specificity estimates from which summary estimates of parameters
(i.e. median prevalence proportion, PPRs and 95% Bayesian Credible Intervals [BCI]) are
estimated.
Bias estimation
Bias was measured as the median and 95% Bayesian Credible Interval (95%BCI) of the differ-
ence between the observed PPR [P (T+)1/ P (T+)2] and the misclassification error-adjusted
PPR [P (D+)1/ P (D+)2]. The 95%BCI is interpreted as the 95% probability coverage of the true
median bias [Bias = P (T+)1/ P (T+)2 minus P (D+)1/ P (D+)2] value assuming adequate statisti-
cal model and prior distribution assumptions. Two estimates of misclassification error-
adjusted PPR estimates were examined.
The first misclassification error-adjusted PPR estimate (without adjustment for confound-
ing by period of MDD assessment) was generated by (a) combining data across prenatal and
postnatal periods, and (b) using prior values based on combined periods to compare MDD
prevalence proportions in risk factor sub-groups (i.e. prevalence proportion1 / prevalence
proportion2)
The second misclassification error-adjusted PPR estimate (with adjustment for confounding
by period of MDD assessment) was generated by (a) separating data into prenatal versus post-
natal period MDD assessments and (b) using period-specific prior values to compare MDD
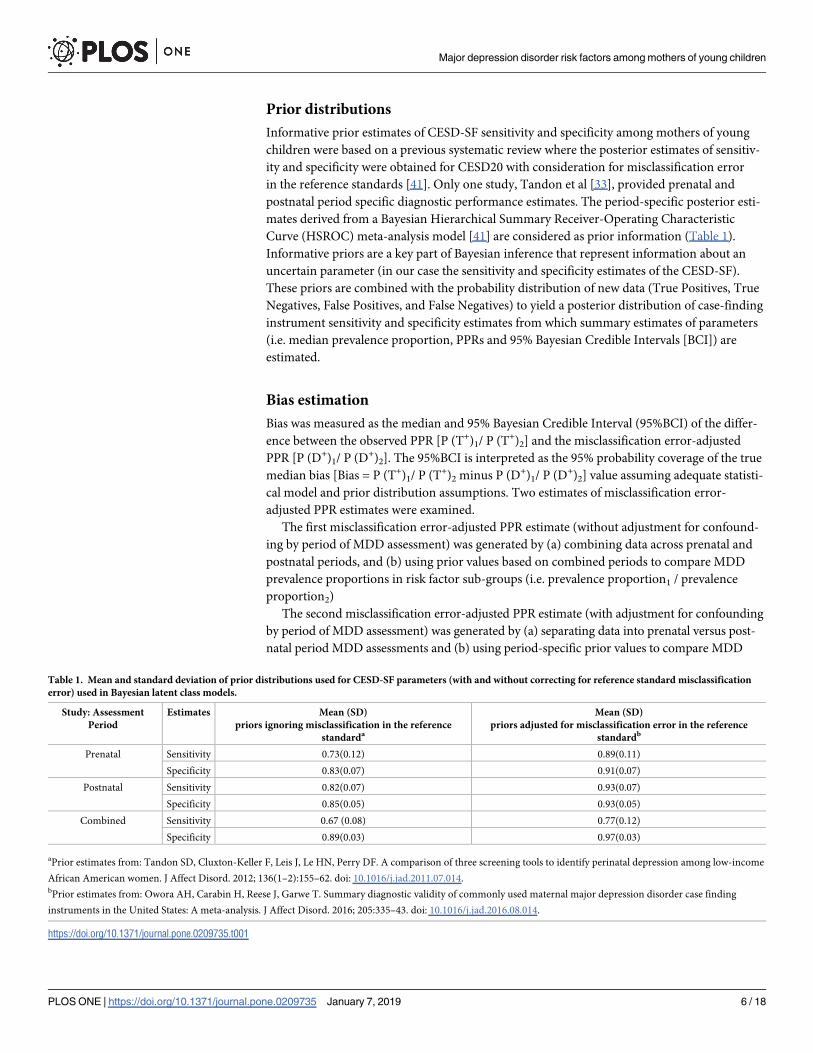
Table 1. Mean and standard deviation of prior distributions used for CESD-SF parameters (with and without correcting for reference standard misclassification
error) used in Bayesian latent class models.
Study: Assessment
Period
Estimates Mean (SD)
priors ignoring misclassification in the reference
standarda
Mean (SD)
priors adjusted for misclassification error in the reference
standardb
Prenatal Sensitivity 0.73(0.12) 0.89(0.11)
Specificity 0.83(0.07) 0.91(0.07)
Postnatal Sensitivity 0.82(0.07) 0.93(0.07)
Specificity 0.85(0.05) 0.93(0.05)
Combined Sensitivity 0.67 (0.08) 0.77(0.12)
Specificity 0.89(0.03) 0.97(0.03)
aPrior estimates from: Tandon SD, Cluxton-Keller F, Leis J, Le HN, Perry DF. A comparison of three screening tools to identify perinatal depression among low-income
African American women. J Affect Disord. 2012; 136(1–2):155–62. doi: 10.1016/j.jad.2011.07.014.bPrior estimates from: Owora AH, Carabin H, Reese J, Garwe T. Summary diagnostic validity of commonly used maternal major depression disorder case finding
instruments in the United States: A meta-analysis. J Affect Disord. 2016; 205:335–43. doi: 10.1016/j.jad.2016.08.014.
https://doi.org/10.1371/journal.pone.0209735.t001
Major depression disorder risk factors among mothers of young children
PLOS ONE | https://doi.org/10.1371/journal.pone.0209735 January 7, 2019 6 / 18
prevalence proportions in risk factor sub-groups (i.e. prevalence proportion1(prenatal + postnatal) /
prevalence proportion2(prenatal + postnatal)).
Results
Study population
As of December 31 2014 (date analytical sample was obtained), 429 and 687 referrals had been
received by SITE I and II, respectively; 318 (74%) and 467 (68%) were eligible. Among eligible
participants, 179 (56%) and 341 (73%) mothers were successfully recruited into the study and
completed baseline assessments at SITE I (low income mothers who were US residents) and
SITE II (recent Hispanic immigrant mothers), respectively. Most socio-demographic charac-
teristics differed between the two study sites [26]. Specifically, there were older (>25 years
old), more married (or living with a partner), less high school graduates, more foreign-born
mothers at SITE II than SITE I (p<0.05).
Observed measures of association (PPR) between maternal MDD and
suspected risk factors
The measures of association (i.e. PPR) of investigated risk factors were quite different between
the study sites (Tables 2 and 3: crude estimates). Being single, having a history of intimate part-
ner violence, low levels of social supports and family resource were associated with a higher
prevalence of MDD at SITE I (Table 2). At SITE II, in addition to risk factors identified at
SITE I, having a history of childhood maltreatment and unemployment were also associated
with MDD (Table 3). Overall, the prevalence of MDD was 50% higher at SITE I than II (PPR:
1.50; 95% BCI: 1.23; 1.83).
Magnitude of bias in measures of association (PPR) ignoring confounding
by period of MDD assessment
When all data were combined (i.e. prenatal and postnatal MDD assessments) and analyzed
using diagnostic performance priors for the combined periods as a whole, the association
between MDD and suspected risk factors seemed to be biased towards the null at both study
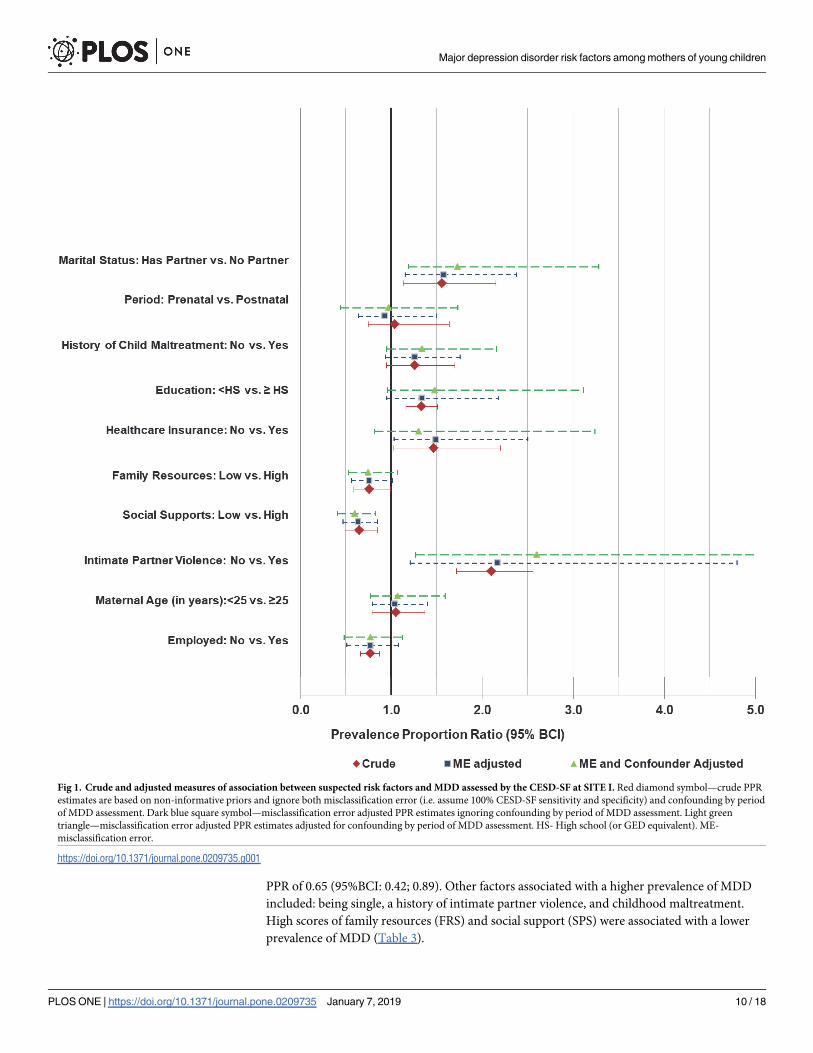
sites (Tables 2 and 3). Figs 1 and 2 are a visual illustration of the median and 95%BCIs of risk
factor associations examined at SITE I and II, respectively.
The prevalence of MDD was higher at SITE I than SITE II (PPR: 1.54; 95%BCI: 1.22, 2.00)
indicating negligible bias (-0.04; 95% BCI: -0.56, 0.40).
For SITE I, the magnitude of bias was small but with substantial uncertainty for all the risk
factors. The level of bias in risk factor measures of association (PPR) ranged from -0.08 (95%
BCI: -2.78, 1.90) for intimate partner violence [under-estimation of PPR] to 0.02 (95%BCI:
-0.38, 0.42) for race/ethnicity comparisons [over-estimation of PPR]. For level of education,
employment status, and FRS, the adjustment for misclassification error shifted the posterior
distribution of PPRs towards one and reduced their 95% probability coverage (95% BCI). Hav-
ing a history of intimate partner violence (adjusted PPR: 2.17; 95%BCI: 1.21; 4.80), healthcare
insurance (adjusted PPR: 1.49; 95%BCI: 1.03; 2.50), being born in the US (adjusted PPR: 1.71;
95%BCI: 1.04; 3.86) and being a single mother (adjusted PPR: 1.58; 95%BCI: 1.15; 2.38) were
associated with a higher prevalence of MDD. High scores of social support (SPS) were associ-
ated with a lower prevalence of MDD (adjusted PPR: 0.65; 95%BCI: 0.47; 0.85).
For SITE II, the magnitude of bias estimates were generally higher ranging from 0.08 (95%
BCI: <0.01, 0.15) for social support to -0.01 (95%BCI: -0.81; 0.68) for period of MDD assess-
ment. Although, adjustment for misclassification error increased uncertainty (wider 95%
Major depression disorder risk factors among mothers of young children
PLOS ONE | https://doi.org/10.1371/journal.pone.0209735 January 7, 2019 7 / 18
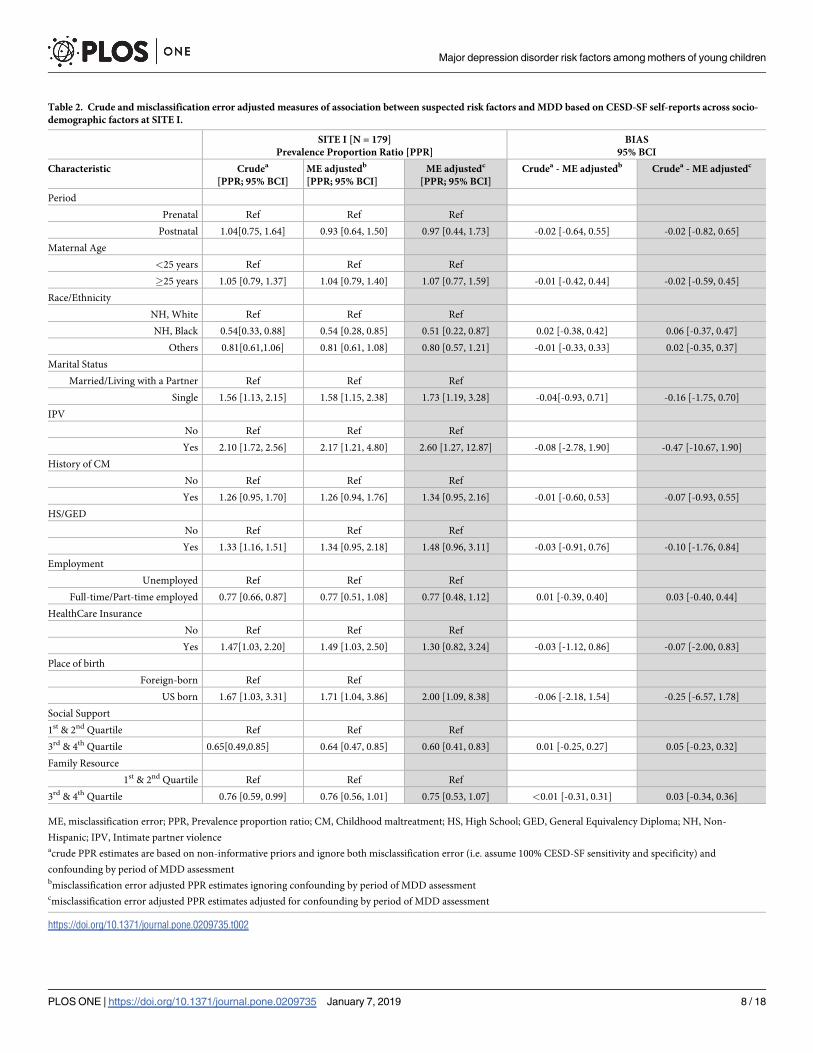
Table 2. Crude and misclassification error adjusted measures of association between suspected risk factors and MDD based on CESD-SF self-reports across socio-
demographic factors at SITE I.
SITE I [N = 179]
Prevalence Proportion Ratio [PPR]
BIAS
95% BCI
Characteristic Crudea
[PPR; 95% BCI]
ME adjustedb
[PPR; 95% BCI]
ME adjustedc
[PPR; 95% BCI]
Crudea - ME adjustedb Crudea - ME adjustedc
Period
Prenatal Ref Ref Ref
Postnatal 1.04[0.75, 1.64] 0.93 [0.64, 1.50] 0.97 [0.44, 1.73] -0.02 [-0.64, 0.55] -0.02 [-0.82, 0.65]
Maternal Age
<25 years Ref Ref Ref
�25 years 1.05 [0.79, 1.37] 1.04 [0.79, 1.40] 1.07 [0.77, 1.59] -0.01 [-0.42, 0.44] -0.02 [-0.59, 0.45]
Race/Ethnicity
NH, White Ref Ref Ref
NH, Black 0.54[0.33, 0.88] 0.54 [0.28, 0.85] 0.51 [0.22, 0.87] 0.02 [-0.38, 0.42] 0.06 [-0.37, 0.47]
Others 0.81[0.61,1.06] 0.81 [0.61, 1.08] 0.80 [0.57, 1.21] -0.01 [-0.33, 0.33] 0.02 [-0.35, 0.37]
Marital Status
Married/Living with a Partner Ref Ref Ref
Single 1.56 [1.13, 2.15] 1.58 [1.15, 2.38] 1.73 [1.19, 3.28] -0.04[-0.93, 0.71] -0.16 [-1.75, 0.70]
IPV
No Ref Ref Ref
Yes 2.10 [1.72, 2.56] 2.17 [1.21, 4.80] 2.60 [1.27, 12.87] -0.08 [-2.78, 1.90] -0.47 [-10.67, 1.90]
History of CM
No Ref Ref Ref
Yes 1.26 [0.95, 1.70] 1.26 [0.94, 1.76] 1.34 [0.95, 2.16] -0.01 [-0.60, 0.53] -0.07 [-0.93, 0.55]
HS/GED
No Ref Ref Ref
Yes 1.33 [1.16, 1.51] 1.34 [0.95, 2.18] 1.48 [0.96, 3.11] -0.03 [-0.91, 0.76] -0.10 [-1.76, 0.84]
Employment
Unemployed Ref Ref Ref
Full-time/Part-time employed 0.77 [0.66, 0.87] 0.77 [0.51, 1.08] 0.77 [0.48, 1.12] 0.01 [-0.39, 0.40] 0.03 [-0.40, 0.44]
HealthCare Insurance
No Ref Ref Ref
Yes 1.47[1.03, 2.20] 1.49 [1.03, 2.50] 1.30 [0.82, 3.24] -0.03 [-1.12, 0.86] -0.07 [-2.00, 0.83]
Place of birth
Foreign-born Ref Ref
US born 1.67 [1.03, 3.31] 1.71 [1.04, 3.86] 2.00 [1.09, 8.38] -0.06 [-2.18, 1.54] -0.25 [-6.57, 1.78]
Social Support
1st & 2nd Quartile Ref Ref Ref
3rd & 4th Quartile 0.65[0.49,0.85] 0.64 [0.47, 0.85] 0.60 [0.41, 0.83] 0.01 [-0.25, 0.27] 0.05 [-0.23, 0.32]
Family Resource
1st & 2nd Quartile Ref Ref Ref
3rd & 4th Quartile 0.76 [0.59, 0.99] 0.76 [0.56, 1.01] 0.75 [0.53, 1.07] <0.01 [-0.31, 0.31] 0.03 [-0.34, 0.36]
ME, misclassification error; PPR, Prevalence proportion ratio; CM, Childhood maltreatment; HS, High School; GED, General Equivalency Diploma; NH, Non-
Hispanic; IPV, Intimate partner violenceacrude PPR estimates are based on non-informative priors and ignore both misclassification error (i.e. assume 100% CESD-SF sensitivity and specificity) and
confounding by period of MDD assessmentbmisclassification error adjusted PPR estimates ignoring confounding by period of MDD assessmentcmisclassification error adjusted PPR estimates adjusted for confounding by period of MDD assessment
https://doi.org/10.1371/journal.pone.0209735.t002
Major depression disorder risk factors among mothers of young children
PLOS ONE | https://doi.org/10.1371/journal.pone.0209735 January 7, 2019 8 / 18
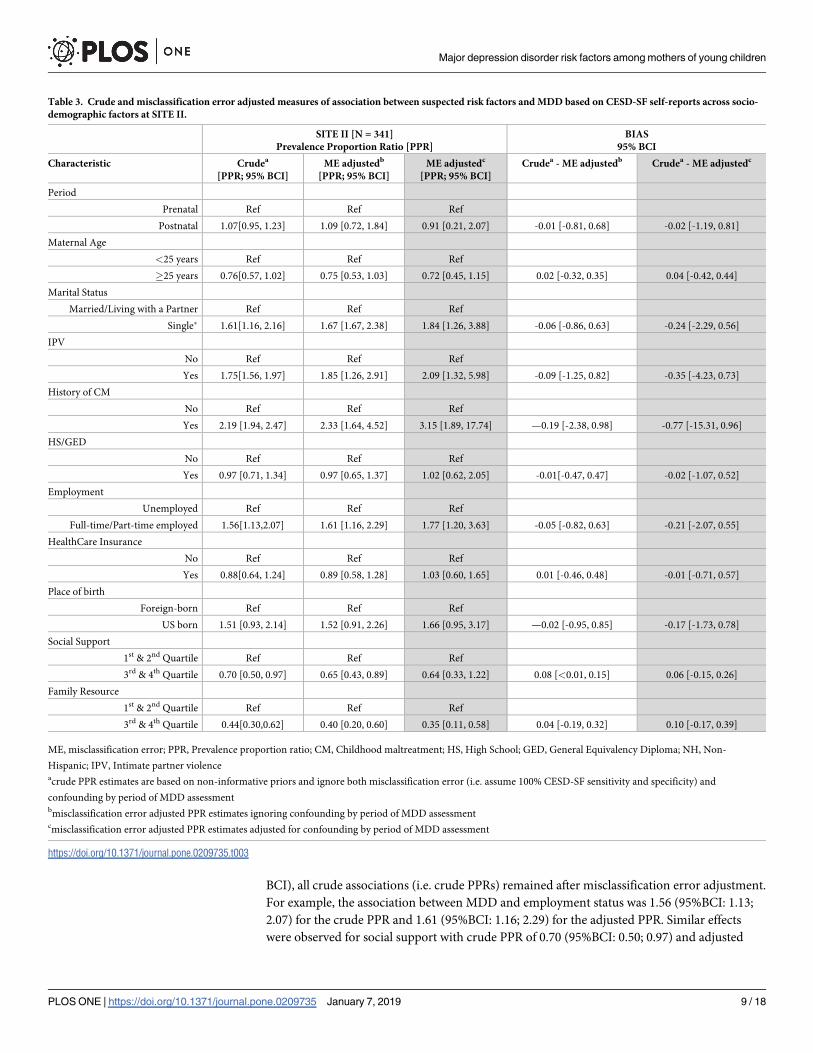
BCI), all crude associations (i.e. crude PPRs) remained after misclassification error adjustment.
For example, the association between MDD and employment status was 1.56 (95%BCI: 1.13;
2.07) for the crude PPR and 1.61 (95%BCI: 1.16; 2.29) for the adjusted PPR. Similar effects
were observed for social support with crude PPR of 0.70 (95%BCI: 0.50; 0.97) and adjusted
Table 3. Crude and misclassification error adjusted measures of association between suspected risk factors and MDD based on CESD-SF self-reports across socio-
demographic factors at SITE II.
SITE II [N = 341]
Prevalence Proportion Ratio [PPR]
BIAS
95% BCI
Characteristic Crudea
[PPR; 95% BCI]
ME adjustedb
[PPR; 95% BCI]
ME adjustedc
[PPR; 95% BCI]
Crudea - ME adjustedb Crudea - ME adjustedc
Period
Prenatal Ref Ref Ref
Postnatal 1.07[0.95, 1.23] 1.09 [0.72, 1.84] 0.91 [0.21, 2.07] -0.01 [-0.81, 0.68] -0.02 [-1.19, 0.81]
Maternal Age
<25 years Ref Ref Ref
�25 years 0.76[0.57, 1.02] 0.75 [0.53, 1.03] 0.72 [0.45, 1.15] 0.02 [-0.32, 0.35] 0.04 [-0.42, 0.44]
Marital Status
Married/Living with a Partner Ref Ref Ref
Single� 1.61[1.16, 2.16] 1.67 [1.67, 2.38] 1.84 [1.26, 3.88] -0.06 [-0.86, 0.63] -0.24 [-2.29, 0.56]
IPV
No Ref Ref Ref
Yes 1.75[1.56, 1.97] 1.85 [1.26, 2.91] 2.09 [1.32, 5.98] -0.09 [-1.25, 0.82] -0.35 [-4.23, 0.73]
History of CM
No Ref Ref Ref
Yes 2.19 [1.94, 2.47] 2.33 [1.64, 4.52] 3.15 [1.89, 17.74] —0.19 [-2.38, 0.98] -0.77 [-15.31, 0.96]
HS/GED
No Ref Ref Ref
Yes 0.97 [0.71, 1.34] 0.97 [0.65, 1.37] 1.02 [0.62, 2.05] -0.01[-0.47, 0.47] -0.02 [-1.07, 0.52]
Employment
Unemployed Ref Ref Ref
Full-time/Part-time employed 1.56[1.13,2.07] 1.61 [1.16, 2.29] 1.77 [1.20, 3.63] -0.05 [-0.82, 0.63] -0.21 [-2.07, 0.55]
HealthCare Insurance
No Ref Ref Ref
Yes 0.88[0.64, 1.24] 0.89 [0.58, 1.28] 1.03 [0.60, 1.65] 0.01 [-0.46, 0.48] -0.01 [-0.71, 0.57]
Place of birth
Foreign-born Ref Ref Ref
US born 1.51 [0.93, 2.14] 1.52 [0.91, 2.26] 1.66 [0.95, 3.17] —0.02 [-0.95, 0.85] -0.17 [-1.73, 0.78]
Social Support
1st & 2nd Quartile Ref Ref Ref
3rd & 4th Quartile 0.70 [0.50, 0.97] 0.65 [0.43, 0.89] 0.64 [0.33, 1.22] 0.08 [<0.01, 0.15] 0.06 [-0.15, 0.26]
Family Resource
1st & 2nd Quartile Ref Ref Ref
3rd & 4th Quartile 0.44[0.30,0.62] 0.40 [0.20, 0.60] 0.35 [0.11, 0.58] 0.04 [-0.19, 0.32] 0.10 [-0.17, 0.39]
ME, misclassification error; PPR, Prevalence proportion ratio; CM, Childhood maltreatment; HS, High School; GED, General Equivalency Diploma; NH, Non-
Hispanic; IPV, Intimate partner violenceacrude PPR estimates are based on non-informative priors and ignore both misclassification error (i.e. assume 100% CESD-SF sensitivity and specificity) and
confounding by period of MDD assessmentbmisclassification error adjusted PPR estimates ignoring confounding by period of MDD assessmentcmisclassification error adjusted PPR estimates adjusted for confounding by period of MDD assessment
https://doi.org/10.1371/journal.pone.0209735.t003
Major depression disorder risk factors among mothers of young children
PLOS ONE | https://doi.org/10.1371/journal.pone.0209735 January 7, 2019 9 / 18
PPR of 0.65 (95%BCI: 0.42; 0.89). Other factors associated with a higher prevalence of MDD
included: being single, a history of intimate partner violence, and childhood maltreatment.
High scores of family resources (FRS) and social support (SPS) were associated with a lower
prevalence of MDD (Table 3).
Fig 1. Crude and adjusted measures of association between suspected risk factors and MDD assessed by the CESD-SF at SITE I. Red diamond symbol—crude PPR
estimates are based on non-informative priors and ignore both misclassification error (i.e. assume 100% CESD-SF sensitivity and specificity) and confounding by period
of MDD assessment. Dark blue square symbol—misclassification error adjusted PPR estimates ignoring confounding by period of MDD assessment. Light green
triangle—misclassification error adjusted PPR estimates adjusted for confounding by period of MDD assessment. HS- High school (or GED equivalent). ME-
misclassification error.
https://doi.org/10.1371/journal.pone.0209735.g001
Major depression disorder risk factors among mothers of young children
PLOS ONE | https://doi.org/10.1371/journal.pone.0209735 January 7, 2019 10 / 18
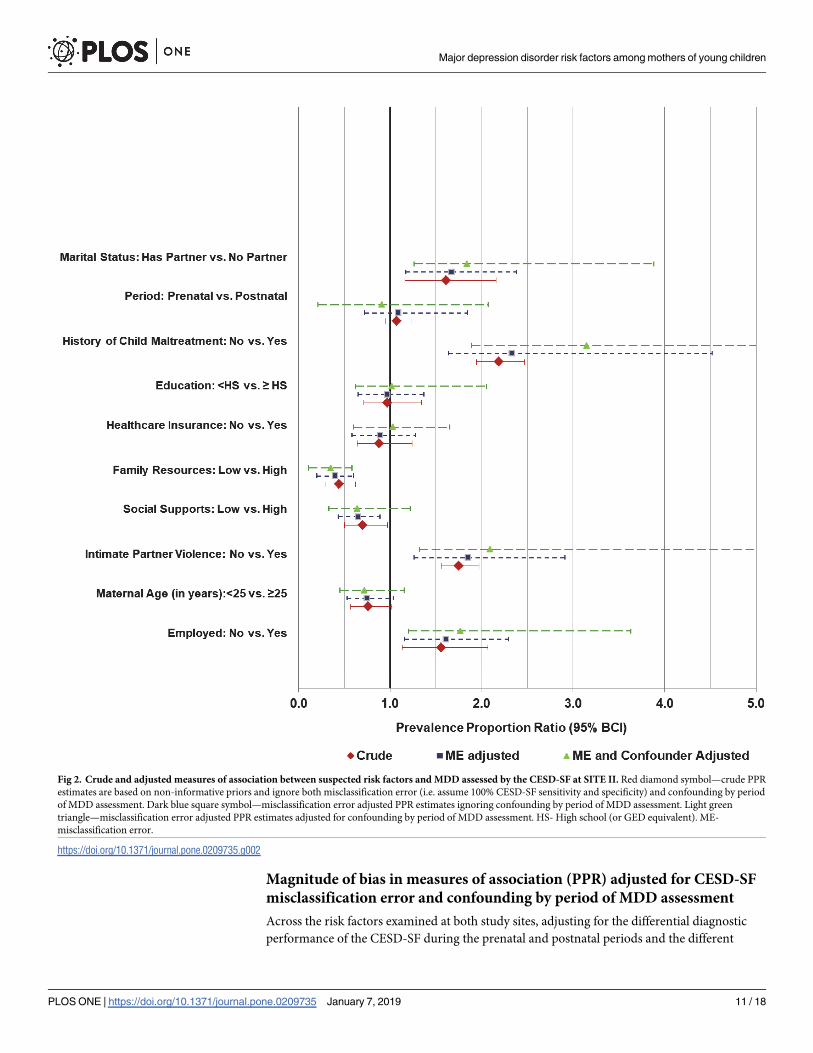
Magnitude of bias in measures of association (PPR) adjusted for CESD-SF
misclassification error and confounding by period of MDD assessment
Across the risk factors examined at both study sites, adjusting for the differential diagnostic
performance of the CESD-SF during the prenatal and postnatal periods and the different
Fig 2. Crude and adjusted measures of association between suspected risk factors and MDD assessed by the CESD-SF at SITE II. Red diamond symbol—crude PPR
estimates are based on non-informative priors and ignore both misclassification error (i.e. assume 100% CESD-SF sensitivity and specificity) and confounding by period
of MDD assessment. Dark blue square symbol—misclassification error adjusted PPR estimates ignoring confounding by period of MDD assessment. Light green
triangle—misclassification error adjusted PPR estimates adjusted for confounding by period of MDD assessment. HS- High school (or GED equivalent). ME-
misclassification error.
https://doi.org/10.1371/journal.pone.0209735.g002
Major depression disorder risk factors among mothers of young children
PLOS ONE | https://doi.org/10.1371/journal.pone.0209735 January 7, 2019 11 / 18
proportions of mothers who had assessments in these periods showed that a higher magnitude
of bias (Tables 2 and 3) was present than was observed when the analysis was conducted on
the combined periods. The prevalence of MDD was higher at SITE I than SITE II after adjust-
ing for both misclassification error and the confounding by period of MDD assessment (PPR:
1.66; 95%BCI: 1.28; 2.78) than when only misclassification error was adjusted for (adjusted
PPR: 1.54; 95%BCI: 1.23, 2.00).
At SITE I, the bias in the PPR ranged from -0.47 (95%BCI: -10.67, 1.90) for intimate partner
violence to -0.02 (95%BCI: -0.82, 0.65) for period of MDD assessment (Table 2). The high
magnitude of bias for intimate partner violence resulted in an increase in the median PPR of
nearly 23%, but also greater uncertainty (i.e. wider 95%BCI). Similar to the misclassification
error-adjusted PPRs, PPRs adjusted for both confounding and misclassification error sug-
gested a higher MDD prevalence among single mothers, those who reported intimate partner
violence and White mothers (compared to Black mothers) with the exception of having health-
care insurance (Table 2). Before adjustment for confounding, there was an association between
MDD and healthcare insurance (misclassification error-adjusted PPR: 1.49; 95%BCI: 1.03;
2.50; Bias: -0.03; 95%BCI: -1.12; 0.86); however, joint adjustment for confounding and misclas-
sification error resulted in a 95% PPR estimate probability coverage that overlaps one (adjusted
PPR: 1.30; 95%BCI: 0.82; 3.24; Bias: -0.07; 95%BCI: -2.00; 0.83).
At SITE II, the bias in the PPR estimates was generally larger and ranged from -0.77 (95%
BCI: -15.31; 0.96) for history of childhood maltreatment to 0.10 (95%BCI: -0.17; 0.39) for ade-
quacy of family resources. Similar to SITE I, bias in risk factor measures of association was high
and most variable for intimate partner violence (-0.77; 95%BCI: -15.31; 0.96). Compared to mis-
classification error-adjusted median PPR estimates, joint adjustment for both misclassification
error and confounding suggested a much higher prevalence of MDD among mothers that were
single, had a history of intimate partner violence, low family resource scores, childhood mal-
treatment, and unemployed (Table 3). There was also more uncertainty in the joint misclassifi-
cation error and confounding adjusted PPRs estimates (i.e. wider 95% BCIs). For some factors
(e.g. social support), this increased uncertainty resulted in a 95% PPR estimate probability cov-
erage whose posterior distribution overlapped one (misclassification error-adjusted PPR: 0.65;
95%BCI: 0.43; 0.89; Bias: 0.08; 95%BCI:<0.01; 0.15) versus misclassification error and con-
founding-adjusted PPR: 0.64; 95%BCI: 0.33, 1.22; Bias: 0.06; 95%BCI: -0.15; 0.26).
Discussion
This study is the first to demonstrate that misclassification error and confounding by period of
MDD assessment (prenatal versus postnatal) can introduce bias and considerable uncertainty
in estimating the association between potential risk factors and MDD among two distinct
groups of mothers involved in home visitation programs. This analysis extends our previous
work (i.e. impact of misclassification error on MDD prevalence proportion estimates) [26] to
encompass measures of association (PPR) comparing prevalence proportions.
Our previous work [26] showed that when using prenatal and postnatal period specific sen-
sitivity and specificity of the CESD-SF, associated misclassification error led to nearly no bias
in prevalence estimates. In contrast, ignoring differences in CESD-SF sensitivity and specificity
between these periods showed considerable MDD prevalence bias. Our current analyses extend
this previous work to show that misclassification error and confounding by period of MDD
assessment can also lead to the underestimation in some (e.g. intimate partner violence at
SITE I and II) and overestimation in other (e.g. period of MDD assessment at SITE I and II)
measures of risk-factor associations (i.e. Prevalence Proportion Ratios) with varying magnitudes
depending on the source population of interest.
Major depression disorder risk factors among mothers of young children
PLOS ONE | https://doi.org/10.1371/journal.pone.0209735 January 7, 2019 12 / 18

Our current findings show that failure to account for the differential diagnostic perfor-
mance of the CESD-SF during prenatal and postnatal periods and associated confounding
effects can erroneously create an impression of negligible bias and uncertainty in estimation of
measures of association than actually exists. Indeed, as evidenced by the generally larger
median bias estimates for suspected MDD risk factor associations based on the joint-adjust-
ment for misclassification error and confounding versus adjustment for misclassification error
only, the strength of an association could be underestimated or overestimated. Our results also
suggest that adjustment for misclassification error and confounding come with the cost of
diminished precision of PPR estimates; however, this could be due to the small sample sizes in
our stratified sub-group analysis as illustrated by the study site comparisons examining the
same risk factors (where, SITE I has a smaller sample size [hence wider 95%BCI] than SITE
II).
Differential diagnostic performance of the CESD-SF between prenatal and postnatal peri-
ods was reflected in the prior values, which were based on a study by Tandon et al [33]. The
sensitivity and specificity values for the CESD20 were similar in the prenatal and postnatal
period, but differed when these periods were combined. When data from these periods are
combined, sensitivity is underestimated while the specificity is overestimated compared to the
period-specific estimates. When period-specific adjustments are made for misclassification
error and then combined, a lower proportion of false negatives is presumed. This results in a
lower or negligible impact of misclassification error adjustments on the magnitude of MDD
prevalence estimates in the risk factor sub-groups (i.e. risk present versus absent) across assess-
ment periods.
In light of the misclassification error that could result from the use of case-finding instru-
ment cut-point thresholds to identify, compare and contrast mothers with and without MDD-
related symptoms, the use of continuous scores from these instruments should be explored as
an alternative approach to investigate risk factor associations in future research. While mea-
surement error (i.e. misclassification involving a continuous scale test result) cannot be ruled
out even when using case-finding instrument scores, this approach can provide a useful dose-
response gradient at different levels or categories of suspected risk factors. This is central to
determining “safe”, “hazardous” or beneficial levels of modifiable factors with intervention
potential.
The impact of confounding by period of MDD assessment on the extent of bias observed
could be explained by the: 1) differential proportion distribution of mothers with a particular
risk factor (characteristic) who had assessments in the prenatal versus postnatal periods and 2)
differential diagnostic performance of the CESD-SF during these periods.
In our study, the impact of the differential proportion distribution of prenatal and postnatal
mothers in risk factor categories or strata (i.e. presence versus absence of a characteristic) is
illustrated by a 95% probability coverage indicative of a protective effect for high social sup-
ports scores on MDD (crude PPR) at SITE II. After adjustment for misclassification error, the
median PPR was lower with a narrower 95%BCI indicating an attenuation effect. However,
joint-adjustment for misclassification error and confounding resulted in a 95% probability
coverage of the PPR that suggested a null association could not be ruled out. In this example,
the proportion of mothers who had low levels social supports (i.e. 1st and 2nd quartiles) was
26% higher among mothers who had postnatal versus prenatal MDD assessments. Generally,
although the median bias tended to increase after joint adjustment for misclassification error
and confounding at both study sites (I and II), it did not do so all the time (e.g. social support
at SITE II, where median bias decreased). This makes it challenging to predict the direction of
bias on measures of association without valid data analysis (i.e. addressing outcome [MDD]
misclassification error within categories of a confounder [prenatal versus postnatal].
Major depression disorder risk factors among mothers of young children
PLOS ONE | https://doi.org/10.1371/journal.pone.0209735 January 7, 2019 13 / 18
Observed variations in the extent of bias on measures of association across different risk
factors in our study data have been demonstrated before in a general population study. Find-
ings from a study by Savoca [42] examining the impact of misclassification error on socio-
demographic correlates of MDD using National Comorbidity Survey (NCS) data found that
without adjustment for misclassified MDD diagnoses, the magnitude of the measure of associ-
ation between gender and MDD (prevalence odds ratios) and marital status and MDD were
underestimated by 42% and 60%, respectively. Unlike the validation approach (criterion stan-
dard based on psychiatrist diagnoses) used by Savoca, the use of the Bayesian approach in our
study is a more cost efficient approach for the adjustment of misclassification error when
examining epidemiological associations. That is, the Bayesian approach does not require re-
administration of reference standards or use of experts to verify MDD diagnoses but rather
uses existing information (as priors) to correct for and estimate impact of misclassification
error on investigated associations.
Our study findings also reinforce the fact that some risk factors of MDD may be different in
different source populations after adjustment for misclassification error and confounding by
period of MDD assessment. Therefore, preventive interventions that are designed for specific
populations may not necessary be ideal in other populations with potentially different indica-
tors of MDD risk. As demonstrated by our results, characteristics such as adequacy of family
resources may have a stronger protective association among low-income recent Hispanic
immigrants (SITE II) than among US resident mothers (SITE I).
Study limitations
One limitation of this study was that the eligibility criteria of the parent studies were such that
only mothers at high risk of child maltreatment (an outcome correlated with MDD)[2] were
recruited for home visitation services [43]. Therefore, because the study population may have
been more homogenous than the general population of mothers, the observed magnitude of
measures of association between suspected risk factors and MDD may be lower than those
observed in general population studies. However, this probably had little impact on our assess-
ment of misclassification error impact on measures of association (PPR).
Another limitation of the study is the fact that the CESD-SF uses a seven-day reference
period for MDD symptoms (at baseline assessment). This probably underestimated the ‘true’
prevalence of MDD if symptoms present during 8 to 14 days prior to the interview disappeared
the following week. However, because MDD symptoms (i.e. an episode of MDD) usually last
for two to six months without treatment [44, 45], the impact of the short symptom reference
period on risk factor associations investigated is likely small. Moreover, comparisons of sensi-
tivity and specificity between one week and two week symptom reference period instruments
have shown substantial overlap in previous studies [46].
Furthermore, the prior estimates used for the CESD-SF in our analysis are based on the
assumption that the sensitivity and specificity values of the 20- and 12-item CESD instrument
are comparable. Although this assumption is supported by validity equipoise between even
shorter versions (2- and 5- item CESD instruments) of the 20-item CESD in previous literature
[47], it is plausible that the use of CESD12 prior values may have resulted in different (but
comparable) findings than those reported in this study. Ideally, while the use of prior values
from a similar version of the 12-item CESD-SF is recommended, the impact of using CESD20
(versus CESD12) prior values on our findings is likely small but nonetheless cannot be ruled
out.
Due to the small study sample sizes, simultaneous control for multiple potential confound-
ing factors was not possible. This means reported misclassification adjusted PPR may be biased
Major depression disorder risk factors among mothers of young children
PLOS ONE | https://doi.org/10.1371/journal.pone.0209735 January 7, 2019 14 / 18

by potential confounders not controlled for other than period of MDD assessment. Future
research should simultaneously examine the joint influence of misclassification error and con-
founding by other population characteristics on epidemiological associations.
Additionally, given the fact that only one test (CESD-SF) was examined in this study, the
prior information suggested for sensitivity and specificity was not updated by the observed
data. Moreover, the small sub-group sample sizes, especially after stratification by period of
MDD assessment resulted in very uncertain posterior distribution summary estimates (i.e.
wide 95% BCI for PPR estimates). Given the relatively high levels of uncertainty associated
with our adjusted measures of associations (especially at SITE I), future studies or simulation
studies with larger sample sizes are needed to further support recommendations for joint
adjustment for misclassification error and confounding by period of MDD assessment. The
use of multiple (or more than one) case-finding instrument to determine the operational defi-
nition of MDD could also be explored to reduce the level of uncertainty in observed measures
of association.
It can also be argued that our study exposures or risk factors of interest (e.g. intimate part-
ner violence) may have been misclassified. Such misclassification could be either differential
(i.e. sensitivity and specificity of the violence assessment tool is different depending on a moth-
er’s MDD status) or non-differential (i.e. sensitivity and specificity of the violence assessment
tool is the same irrespective of a mother’s MDD status). Assuming non-differential misclassifi-
cation of risk factors, our observed level of bias may be underestimated [48]. In contrast, the
directionality and magnitude of bias under differential misclassification scenarios is not pre-
dictable. Future research (with larger sample sizes) should examine the composite effects of
confounding, MDD and exposure (risk factor) misclassification on measures of association.
Despite these limitations, our study findings underscore the substantial impact differential
misclassification error and confounding by period of MDD assessment can have on inferences
regarding suspected MDD risk factors. Biased measures of association can result in poorly
planned preventive interventions that ignore or miss etiologic risk factors related to MDD
illness.
Supporting information
S1 File. WinBUGS Syntax for estimating crude and adjusted prevalence proportion ratios
(PPR) summarizing the relationship between suspected risk factors and major depression
disorder among mothers of young children.
(PDF)
Acknowledgments
We acknowledge and thank Dr. Jane Silovsky for allowing us to use the data from her studies
(at SITE I and II) and her comments on an earlier draft of this manuscript. We thank the fami-
lies who participated and willingly welcomed the data collectors and home visitors into their
homes and shared their experiences. Further, we appreciate the individuals and agencies
involved in our collaborative partnership among University-based intervention scientists and
staff, state agencies, legislative staff, clinical consultants, and community-based service agencies.
Author Contributions
Conceptualization: Arthur H. Owora, Helène Carabin.
Data curation: Arthur H. Owora.
Major depression disorder risk factors among mothers of young children
PLOS ONE | https://doi.org/10.1371/journal.pone.0209735 January 7, 2019 15 / 18
Formal analysis: Arthur H. Owora.
Methodology: Arthur H. Owora, Helène Carabin.
Software: Arthur H. Owora.
Visualization: Arthur H. Owora.
Writing – original draft: Arthur H. Owora.
Writing – review & editing: Arthur H. Owora, Helène Carabin, Tabitha Garwe, Michael P.
Anderson.
References1. Gaynes BN, Gavin N, Meltzer-Brody S, Lohr KN, Swinson T, Gartlehner G, et al. Perinatal depression:
prevalence, screening accuracy, and screening outcomes. EvidRep Technol Assess. 2005; 119:1–8.
2. Ammerman RT, Putnam FW, Bosse NR, Teeters AR, Van Ginkel JB. Maternal Depression in Home
Visitation: A Systematic Review. Aggress Violent Behav. 2010; 15(3):191–200. https://doi.org/10.1016/
j.avb.2009.12.002 PMID: 20401324
3. Farr SL, Hayes DK, Bitsko RH, Bansil P, Dietz PM. Depression, Diabetes, and Chronic Disease Risk
Factors Among US Women of Reproductive Age. Prev Chronic Dis. 2011; 8(6):A119. PMID: 22005612
4. Ertel KA, Rich-Edwards JW, Koenen KC. Maternal depression in the United States: nationally represen-
tative rates and risks. J Womens Health. 2011; 20(11):1609–1617.
5. Goodman SH, Rouse MH, Connell AM, Broth MR, Hall CM, Heyward D. Maternal depression and child
psychopathology: a meta-analytic review. Clin Child Fam Psychol Rev. 2011; 14(1):1–27. https://doi.
org/10.1007/s10567-010-0080-1 PMID: 21052833
6. Beardslee WR, Versage EM, Gladstone TR. Children of affectively ill parents: a review of the past 10
years. J Am Acad Child Adolesc Psychiatry. 1998; 37(11):1134–1141. PMID: 9808924
7. O’Hara MW, Swain AM. Rates and risk of postpartum depression-a meta-analysis. Int Rev Psychiatry.
1996; 8:37–54.
8. Lancaster CA, Gold KJ, Flynn HA, Yoo H, Marcus SM, Davis MM. Risk factors for depressive symptoms
during pregnancy: a systematic review. Am J Obstet Gynecol. 2010; 202(1):5–14. https://doi.org/10.
1016/j.ajog.2009.09.007 PMID: 20096252
9. Beck CT. A meta-analysis of predictors of postpartum depression. Nurs Res. 1996; 45(5):297–303.
PMID: 8831657
10. Stewart DE, Robertson E, Dennis C-L, Grace SL, Wallington T. Postpartum depression: Literature
review of risk factors and interventions; 2003. Available from: https://www.who.int/mental_health/
prevention/. . ./lit_review_postpartum_depression.pdf. Cited 18 September 2018.
11. Beck CT. Predictors of postpartum depression: an update. Nurs Res. 2001; 50(5):275–285. PMID:
11570712
12. Duggan AK, Berlin LJ, Cassidy J, Burrell L, Tandon SD. Examining Maternal Depression and Attach-
ment Insecurity as Moderators of the Impacts of Home Visiting for At-Risk Mothers and Infants. J Con-
sul Clin Psychol. 2009; 77(4):788–799.
13. Tandon SD, Parillo KM, Jenkins C, Duggan AK. Formative evaluation of home visitors’ role in address-
ing poor mental health, domestic violence, and substance abuse among low-income pregnant and par-
enting women. Matern Child Health J. 2005; 9(3):273–283. https://doi.org/10.1007/s10995-005-0012-8
PMID: 16240078
14. Ammerman RT, Putnam FW, Altaye M, Chen L, Holleb LJ, Stevens J, et al. Changes in depressive
symptoms in first time mothers in home visitation. Child Abuse Negl. 2009; 33(3):127–138. https://doi.
org/10.1016/j.chiabu.2008.09.005 PMID: 19328548
15. Stevens J, Ammerman R., Putnam F., & Van Ginkel J. Depression and trauma history in first-time moth-
ers receiving home visitation. J Community Psychol. 2002(30):551–564.
16. Chazan-Cohen R, Ayoub C, Pan BA, Roggman L, Raikes H, McKelvey L, et al. It takes time: Impacts of
Early Head Start that lead to reductions in maternal depression two years later. Infant Ment Health J.
2007; 28(2):151–170.
17. Chaffin M, Bard D, Bigfoot DS, Maher EJ. Is a Structured, Manualized, Evidence-Based Treatment Pro-
tocol Culturally Competent and Equivalently Effective Among American Indian Parents in Child Wel-
fare? Child Maltreat. 2012; 17(3):242–252. https://doi.org/10.1177/1077559512457239 PMID:
22927674
Major depression disorder risk factors among mothers of young children
PLOS ONE | https://doi.org/10.1371/journal.pone.0209735 January 7, 2019 16 / 18
18. Kessler RC, Bromet EJ. The epidemiology of depression across cultures. Annu Rev Public Health.
2013; 34:119–138. https://doi.org/10.1146/annurev-publhealth-031912-114409 PMID: 23514317
19. Kerr LK, Kerr LD Jr. Screening tools for depression in primary care: the effects of culture, gender, and
somatic symptoms on the detection of depression. West J Med. 2001; 175(5):349–352. PMID:
11694495
20. Simon GE, Goldberg DP, Von Korff M, Ustun TB. Understanding cross-national differences in depres-
sion prevalence. Psychol Med. 2002; 32(4):585–594. PMID: 12102373
21. Pereira AT, Marques M, Soares MJ, Maia BR, Bos S, Valente J, et al. Profile of depressive symptoms in
women in the perinatal and outside the perinatal period: similar or not? J Affect Disord. 2014; 166:71–
78. https://doi.org/10.1016/j.jad.2014.04.008 PMID: 25012412
22. Bright JI, Baker KD, Neimeyer RA. Professional and paraprofessional group treatments for depression:
a comparison of cognitive-behavioral and mutual support interventions. J Consult Clin Psychol. 1999;
67(4):491–501. PMID: 10450619
23. Kernot J, Olds T, Lewis LK, Maher C. Test-retest reliability of the English version of the Edinburgh Post-
natal Depression Scale. Arch Womens Ment Health. 2015; 18(2):255–257. https://doi.org/10.1007/
s00737-014-0461-4 PMID: 25209355
24. Chaudron LH, Szilagyi PG, Tang W, Anson E, Talbot NL, Wadkins HIM, et al. Accuracy of Depression
Screening Tools for Identifying Postpartum Depression Among Urban Mothers. Pediatrics. 2010; 125
(3):e609–e617. https://doi.org/10.1542/peds.2008-3261 PMID: 20156899
25. Ji S, Long Q, Newport DJ, Na H, Knight B, Zach EB, et al. Validity of depression rating scales during
pregnancy and the postpartum period: impact of trimester and parity. J Psychiatr Res. 2011; 45(2):213–
219. https://doi.org/10.1016/j.jpsychires.2010.05.017 PMID: 20542520
26. Owora AH, Carabin H. Impact of misclassification error in the estimation of maternal major depression
disorder prevalence in home visitation programs. Psychiatry Res. 2018; 261:80–87. https://doi.org/10.
1016/j.psychres.2017.12.047 PMID: 29289025
27. Rothman KJ, Greenland S. Modern Epidemiology. 2nd ed. Philadelphia: Lippincott Williams and Wil-
kins; 1998.
28. Brenner H, Savitz DA, Gefeller O. The effects of joint misclassification of exposure and disease on epi-
demiologic measures of association. J Clin Epidemiol. 1993; 46(10):1195–1202. PMID: 8410104
29. Caronongan P, Boller K, Vogel C, Bradley C, Barrett K, Malone L. Family and Child Outcomes Data Col-
lection Manual for the Evidence-Based Home Visiting to Prevent Child Maltreatment Cross-Site Evalua-
tion. Princeton (NJ): Mathematica Policy Research; 2011 May. Contract No.: GS-10F-0050L/
HHSP233200800065W. Sponsored by the Children’s Bureau, Administration for Children and Families,
U.S. Department of Health and Human Services.
30. Radloff LS. The CESD scale: a self report scale for research in the general population. Appl Psychol
Meas. 1977; 1:385–401.
31. Beeghly M, Olson KL, Weinberg MK, Pierre SC, Downey N, Tronick EZ. Prevalence, stability, and
socio-demographic correlates of depressive symptoms in Black mothers during the first 18 months post-
partum. Matern Child Health J. 2003; 7(3):157–168. PMID: 14509411
32. Orr ST, James SA, Blackmore Prince C. Maternal prenatal depressive symptoms and spontaneous pre-
term births among African-American women in Baltimore, Maryland. Am J Epidemiol. 2002; 156
(9):797–802. PMID: 12396996
33. Tandon SD, Cluxton-Keller F, Leis J, Le HN, Perry DF. A comparison of three screening tools to identify
perinatal depression among low-income African American women. J Affect Disord. 2012; 136(1–
2):155–162. https://doi.org/10.1016/j.jad.2011.07.014 PMID: 21864914
34. Dunst CJ, Leet HE. Measuring the adequacy of resources in households with young children. Child
Care Health Dev. 1987; 13(2):111–125. PMID: 3581439
35. Weiss RS. The provisions of social relationships. In: Rubin Z, editor. Doing unto others. New Jersey:
Prentice-Hall; 1974. p. 17–26.
36. Straus MA, Douglas EM. A short form of the Revised Conflict Tactics Scales, and typologies for severity
and mutuality. Violence Vict. 2004; 19(5):507–520. PMID: 15844722
37. Geweke J. Evaluating the accuracy of sampling-based approaches to calculating posterior moments.
In: Bernardo JM, Berger J, Dawid AP, Smith JFM, editors. Bayesian Statistics 4: Oxford University
Press; 1992. p. 169–193.
38. Heidelberger P, Welch PD. Simulation Run Length Control in the Presence of an Initial Transient. Oper
Res. 1983; 31:1109–1145.
39. Gelman A, Rubin DB. Inference from Iterative Simulation Using Multiple Sequences. Stat Sci. 1992; 7
(4):457–472.
Major depression disorder risk factors among mothers of young children
PLOS ONE | https://doi.org/10.1371/journal.pone.0209735 January 7, 2019 17 / 18

40. Lunn DJ, Thomas A, Best N, Spiegelhalter DJS. WinBUGS—A Bayesian modelling framework: Con-
cepts, structure, and extensibility. Stat Comput. 2000; 10(4):325–337.
41. Owora AH, Carabin H, Reese J, Garwe T. Summary diagnostic validity of commonly used maternal
major depression disorder case finding instruments in the United States: A meta-analysis. J Affect Dis-
ord. 2016; 205:335–343. https://doi.org/10.1016/j.jad.2016.08.014 PMID: 27566453
42. Savoca E. Sociodemographic Correlates of Psychiatric Diseases: Accounting for Misclassification in
Survey Diagnoses of Major Depression, Alcohol, and Drug Use Disorders. Health Serv Outcomes Res
Methodol. 2004(5):175–191.
43. Adirim T, Supplee L. Overview of the Federal Home Visiting Program. Pediatrics. 2013; 132(Suppl 2):
S59–S64.
44. Spijker J, de Graaf R, Bijl RV, Beekman AT, Ormel J, Nolen WA. Duration of major depressive episodes
in the general population: results from The Netherlands Mental Health Survey and Incidence Study
(NEMESIS). Br J Psychiatry. 2002; 181:208–213. PMID: 12204924
45. Ghio L, Gotelli S, Cervetti A, Respino M, Natta W, Marcenaro M, et al. Duration of untreated depression
influences clinical outcomes and disability. J Affect Disord. 2015; 175:224–228. https://doi.org/10.1016/
j.jad.2015.01.014 PMID: 25658495
46. Owora AH, Carabin H, Reese J, Garwe T. Diagnostic performance of major depression disorder case-
finding instruments used among mothers of young children in the United States: A systematic review. J
Affect Disord. 2016; 201:185–93. https://doi.org/10.1016/j.jad.2016.05.015 PMID: 27240311
47. Shrout PE, Yager TJ. Reliability and validity of screening scales: effect of reducing scale length. J Clin
Epidemiol. 1989; 42 (1): 69–78. PMID: 2913189
48. Jurek AM, Greenland S, Maldonado G, Church TR. Proper interpretation of non-differential misclassifi-
cation effects: expectations vs observations. Int J Epidemiol. 2005; 34(3):680–687. https://doi.org/10.
1093/ije/dyi060 PMID: 15802377
Major depression disorder risk factors among mothers of young children
PLOS ONE | https://doi.org/10.1371/journal.pone.0209735 January 7, 2019 18 / 18