Embed Size (px)
Citation preview

Aremorepeopledyingbecausethericharege5ngricherattheexpenseoftherest?
DannyDorlingPopula;onHealthResearchGroup
14/1/2016,UniversityofSouthampton
Evidenceisbeginningtosurfaceofthepossiblehealtheffectsoftherapidsocialpolarisa;onthatistakingplaceintheUK.ThisevidenceisoOenhidden,orattheveryleasthardtofind,butitwillsoonemergemorefullyintopublicdebate:therehasbeenastallinginoneofthekeyofficialindicatorsofhealthimprovementintheUKinrecentyears. 1

Isaidandwrotethis4monthsagoanditalreadyfeelsdated:Thereisnowaythateveryonecanberich.Only1%ofpeoplecanbeinthebest-off1%.AstheUKbecomesmoreunequalthefutureformanyyoungpeopleisalifeworkinginservicefortherich.ThiswillincludeworkinginjobsuchasteachingintheSouthEastofEnglandwherethepayisnow(rela;vely)toolowtoallowsomeonetorentahomeinwhichtheycouldstartafamily.Willmedicinebethenexttosuffer?Ifweareheadingbacktothepasthaveweonlyourselvestoblame?Orisamoreequitablefutures;llpossible,andhow?
Wequicklybecomeacclima;zedtochange.InSeptember2015ItalkedinYorkabouttheissueOfschoolteachersbecomingservants–peoplewhoCouldnothavechildreninsomepartsoftheUKduetohousingprices.LastweekItalkedtoawealthymaninOxfordwhoexpressedpityforthejuniordoctorswhoweretrea;nghim–whohadtorentfromhim.
2

TheNHShasstalledonprogressonitshighestprioritytarget–toreduceprematuredeathfrom
preventablecauses–possiblyforthefirst;meever.hdp://www.dannydorling.org/?p=4909
“Declininghealthoutcomes,risinghealthinequalityandextremeeconomicinequality”2/10/2015 3

Geographyisneededbecausesomuchisgoingonatthesame;me…
OnekeyindicatorconcernsPoten;alYearsLostofLifeorearlymortality,amongmen.Duringlate2015italsoemergedthattherehadbeenarapidriseinmortalityduetodrugpoisoninginEngland.EarlierdeathsofelderlywomenhadriseninabsolutetermsandlifeexpectancyfellforthatgroupintheUK.HoweveroveralllifeexpectancyintheUKroseasimmigra;onroseandmorehealthymigrantsarrived.Howcanwebegintotrytounderstandallthisinacontextofhighinequali;esofincomeandrisinginequalityinwealth?Andwhereareweheadingintermsoffutureeconomicprecarityandlikelyhealthoutcomes,includingforourmentalhealth?
4

• Thistalkwillconsiderwhatevidencewehavetodateofsomeofthepossiblehealtheffectsoftherapidsocialpolariza;onthatistakingplaceintheUK.
• Mighttherisingmortalityratesamongelderlywomenwhomostlylivealonebepartlyadributedtothispolariza;on?
• Whatofanxietyanddepressionlevelsasmeasuredamongtheyoung,andespeciallyforthosewhocanseelidlefutureandhaveinrecentyearsbeen‘sanc;oned’many;mes,includingpeoplewhosehealthisalreadyverypoor?
• Moreques;onsareraisedthananswersgiven,butwhatwedoknowforsureisthatinmanywayswearereturningtothesocial,poli;calandeconomicdividesofthepast.
• Sowhatwillbedifferentthis;meandwhatcanweseewhenwelookahead?
WewillseemoreYearsofLifeLostChartslikethissoonshowingstallingwhen2012,2013and2014dataadded:
5

Andmoremyopia(distantobjectsblurred),eg:
GeorgeOsborne,Budget2015“ItwastheConserva;veswhofirstprotectedworkingpeopleinthemills;itwastheConserva;veswhotookagreatsteptowardsstateeduca;on;itwastheConserva;veswhointroducedequalvotesforwomen;itwastheConserva;veswhogavepeopletheright-to-buy.So,ofcourse,itisnowtheConserva;veswhoaretransformingwelfareandintroducingana;onallivingwage.ThisisthepartyfortheworkingpeopleofBritain.” Finalad-libatendofhisspeech 6

JohnMaynardKeynes,EconomicPossibili;esforourGrandchildren
Hisbankingfriend,OswaldFalk,toldhimthatforallitsveneeroftheory,hehadsimplycodifiedthe“….moralfeelingofanage”
(cleartoOswaldby1936)
“Wearesufferingjustnowfromabadadackofeconomicpessimism.Itiscommontohearpeoplesaythattheepochofenormouseconomicprogresswhichcharacterisedthenineteenthcenturyisover;thattherapidimprovementinthestandardoflifeisnowgoingtoslowdown--atanyrateinGreatBritain;thatadeclineinprosperityismorelikelythananimprovementinthedecadewhichliesaheadofus.”
(wridenbyJohnin1930)
7

We’rebackto1936(aOertax)
Butisn’tthishappeningeverywhere–it’sjustthe‘globalrace’isn’tit?
8

Howmuchmoredothebest-offtenthgetayearascomparedtotheworst?
Ipublishedthistableofinequalityintherichestlarge25countriesintheworldin20109

Somepeopleinsomecountriestoleratefargreaterinequali;esthanothers
ThisisthemiddleofthetableandbythismeasuretheNetherlandsisinthemiddleofthetable10

Andinsomethedifferenceshavebecomesogreatthatpeoplefindithardtoseeeachotheraspeople(ofequalworth)
11
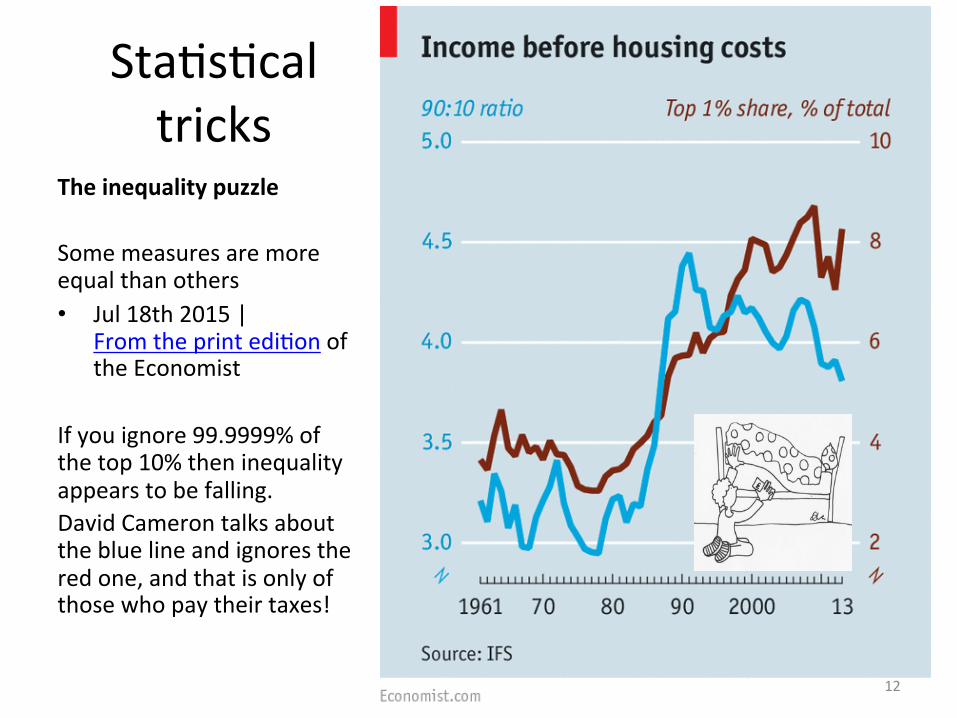
Sta;s;caltricks
TheinequalitypuzzleSomemeasuresaremoreequalthanothers• Jul18th2015|
Fromtheprintedi;onoftheEconomist
Ifyouignore99.9999%ofthetop10%theninequalityappearstobefalling.DavidCamerontalksaboutthebluelineandignorestheredone,andthatisonlyofthosewhopaytheirtaxes!
12
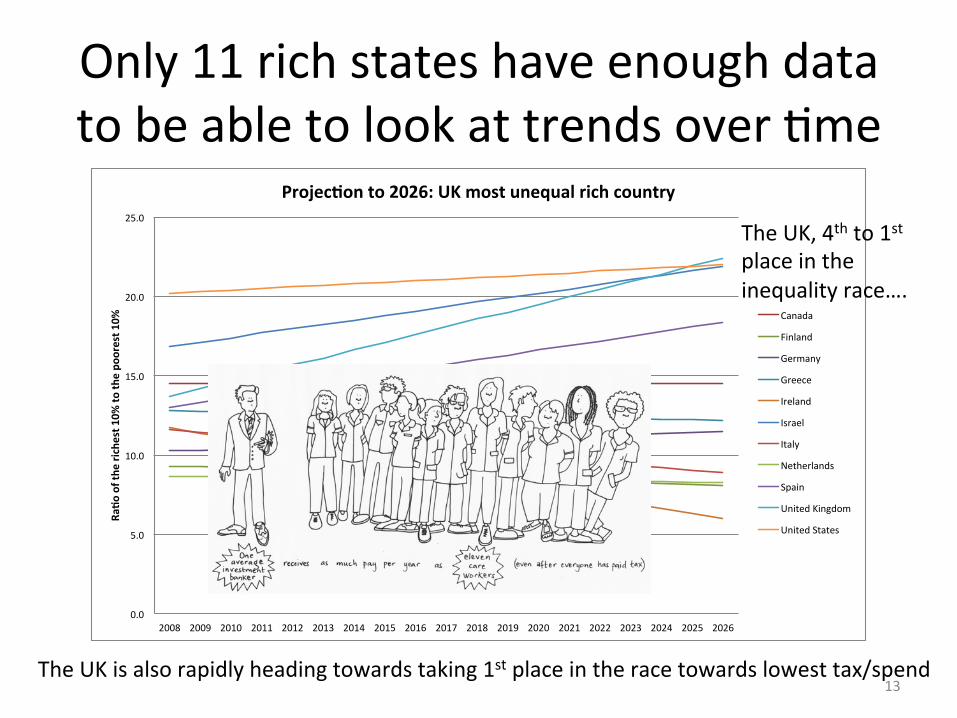
Only11richstateshaveenoughdatatobeabletolookattrendsover;me
0.0#
5.0#
10.0#
15.0#
20.0#
25.0#
2008# 2009# 2010# 2011# 2012# 2013# 2014# 2015# 2016# 2017# 2018# 2019# 2020# 2021# 2022# 2023# 2024# 2025# 2026#
Ra#o
%of%the
%richest%1
0%%to
%the%po
orest%1
0%%
Projec#on%to%2026:%UK%most%unequal%rich%country%
Canada#
Finland#
Germany#
Greece#
Ireland#
Israel#
Italy#
Netherlands#
Spain#
United#Kingdom#
United#States#
TheUK,4thto1stplaceintheinequalityrace….
TheUKisalsorapidlyheadingtowardstaking1stplaceintheracetowardslowesttax/spend13

LatestWHOinfantmortalityratesfortherichest25na;onssingleoutfourcountries.ThreeofthosefourcountriesareinthetopfiOhbyincomeinequalityin2015.SingaporeandNZmayhaveslightlydifferentstories…
Countryby2015(real90:10ra@o) IncomeInequality
UnitedStates 20.3Singapore 18.5Israel 17.4UnitedKingdom 17.4Canada 14.5Spain 13.6Greece 12.7Italy 11.3Ireland 11.1Germany 10.4Portugal 10.1SouthKorea 10.1Finland 9.2Australia 8.8Netherlands 8.6NewZealand 8.2France 7.4Japan 7.3Austria 7.0Switzerland 6.7Sweden 6.3Norway 6.2Belgium 5.9Slovenia 5.5Denmark 5.2
Infant Mortality Country 7 United States 6 New Zealand 5 United Kingdom 5 Canada 4 Denmark 4 Switzerland 4 Australia 4 Israel 4 Germany 4 Ireland 4 Austria 4 France 4 Netherlands 4 Greece 4 Italy 4 Spain 4 Belgium 4 Portugal 4 South Korea 3 Singapore 3 Norway 3 Finland 3 Sweden 3 Slovenia 3 Japan 14
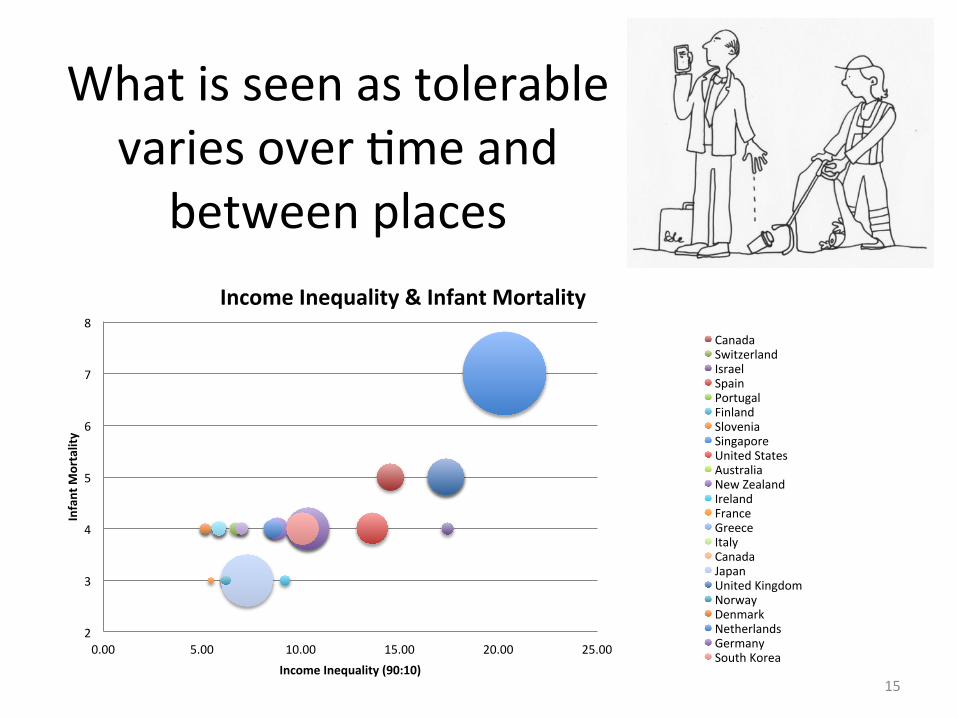
Whatisseenastolerablevariesover;meandbetweenplaces
2
3
4
5
6
7
8
0.00 5.00 10.00 15.00 20.00 25.00
InfantM
ortality
IncomeInequality(90:10)
IncomeInequality&InfantMortality
CanadaSwitzerlandIsraelSpainPortugalFinlandSloveniaSingaporeUnitedStatesAustraliaNewZealandIrelandFranceGreeceItalyCanadaJapanUnitedKingdomNorwayDenmarkNetherlandsGermanySouthKorea
15
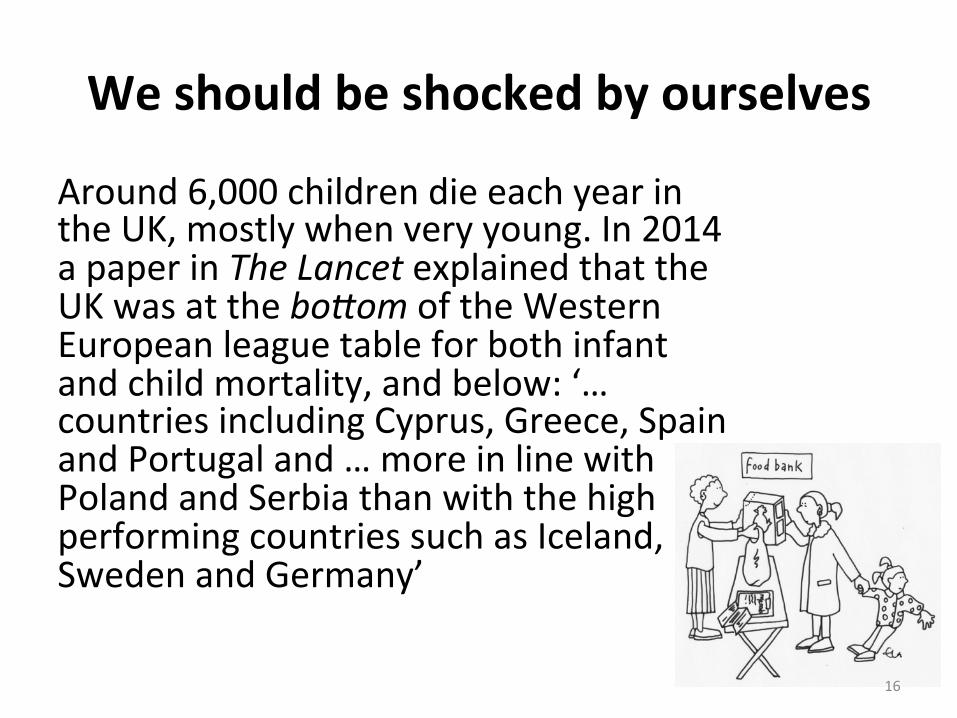
Weshouldbeshockedbyourselves
Around6,000childrendieeachyearintheUK,mostlywhenveryyoung.In2014apaperinTheLancetexplainedthattheUKwasatthebo9omoftheWesternEuropeanleaguetableforbothinfantandchildmortality,andbelow:‘…countriesincludingCyprus,Greece,SpainandPortugaland…moreinlinewithPolandandSerbiathanwiththehighperformingcountriessuchasIceland,SwedenandGermany’
16
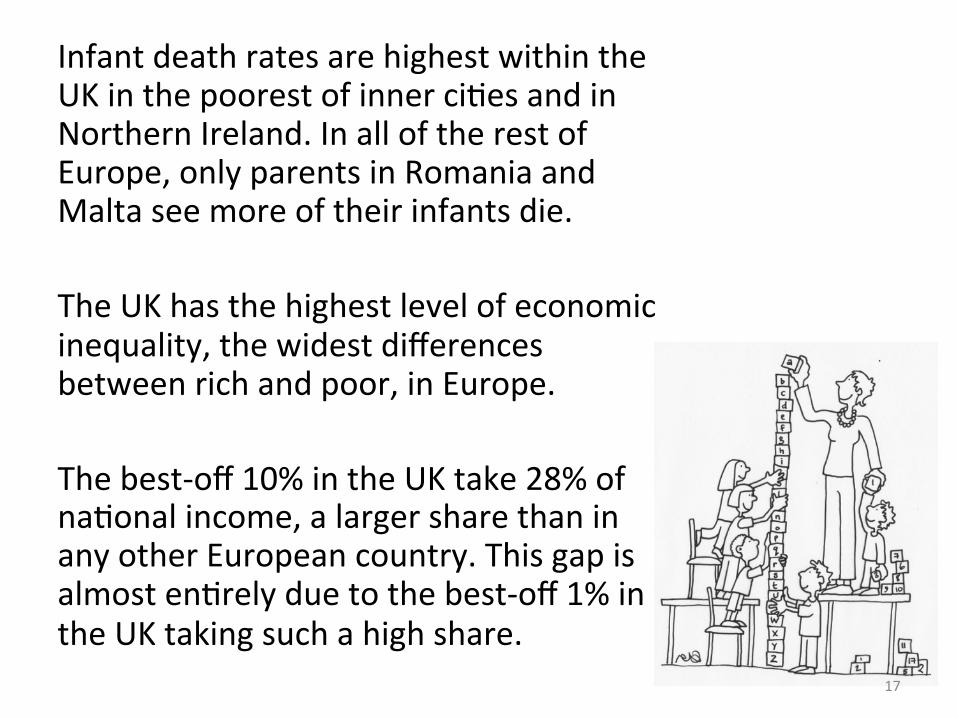
InfantdeathratesarehighestwithintheUKinthepoorestofinnerci;esandinNorthernIreland.InalloftherestofEurope,onlyparentsinRomaniaandMaltaseemoreoftheirinfantsdie.TheUKhasthehighestlevelofeconomicinequality,thewidestdifferencesbetweenrichandpoor,inEurope.Thebest-off10%intheUKtake28%ofna;onalincome,alargersharethaninanyotherEuropeancountry.Thisgapisalmosten;relyduetothebest-off1%intheUKtakingsuchahighshare.
17

Butwedon’tseeeachotherasequals,assimilar,asthesamepeople…
Peopleinmoreeconomicallyunequalcountriestrusteachotherlessandthinkofmanyothersaroundthemaslessdeserving.Lowertrustandgreaterinequalitymovetogetherhandinhand.Itisbecauseofhowweorganiseoursocietythat,foreverychildborn,twiceasmanychildrendieinchildhoodintheUKascomparedwithSweden.TherewerenocausesofdeaththatweresignificantlymorefrequentinSwedenthanintheUK.Howsocietyisorganisedaffectsallcausesofdeath,frominfec;ontocongenitalmalforma;on,toroadaccidents 18

Andwealreadyknowallthis• Wolfe,I.(2014)WhytheUKhasahighchilddeathrate,BBCNews,May3rd,
hdp://www.bbc.co.uk/news/health-27260371• Foster,D.(2015)CanfamilysupportreduceNorthernIreland’shighinfantdeathrates?The
Guardian,March25th,hdp://www.theguardian.com/society/2015/mar/25/family-support-northern-ireland-infant-death-rates
• Aroundhalfofthe28%istakenjustbythebest-off1%intheUK.TheUKalsohasthehighestGinicoefficientofincomeinequalityintheEurope(0.351):OECD(2015)InItTogether-WhyLessInequalityBenefitsAll,Paris:OECD,See:Chapter1,Table1.A1.1:‘Keyindicatorsonthedistribu;onofhouseholddisposableincomeandpoverty,2007,2011and2013ormostrecent’,hdp://www.oecd.org/social/in-it-together-why-less-inequality-benefits-all-9789264235120-en.htm
• Offer,A.(2006)TheChallengeofAffluence:Self-ControlandWell-BeingintheUnitedStatesandBritainsince1950,Oxford:OUP.
• TambeP,Sammons,H.M.andChoonara,I.(2015)WhydoyoungchildrendieintheUK?AcomparisonwithSweden,ArchivesofDiseaseinChildhood,August13th,doi:10.1136/archdischild-2014-308059hdp://adc.bmj.com/content/early/2015/07/15/archdischild-2014-308059.full
19

IfwecaredmorewewouldactChildrenintheUKaretwiceaslikelytobekilledwhencrossingtheroadacomparedtothoseinFrance,NorwayortheNetherlands.Noneoftheseindividualdeathsis‘expected’,butthenumberisverypredictableyearonyear,asistheeffectonthesurvivingfamilyandfriends.Similarly,itisalsoadevasta;ngshockwhenpeoplekillthemselvesordiefromdrugpoisoningoroverdoses.Despiterecentrisesinthefigures,thesedeathscon;nuetosurprise,anddestroy,families.Becauseatanyone;methechancesofsuchaneventarerare,wetendtodiscounttheoverallriskandburden.Wealsodisliketalkingaboutmentalillness.Becauseofthis,asasociety,weignoretoomuchavoidablesuffering.Ofthe11affluentcountriesforwhichcomparablesta;s;csexist,weintheUKaresecondonlytotheUSintermsofthefrequencyofmentalillness.
20

Studies of depression in adolescent girls in North America, 1984–2010 (see table 7, page 274 of the first edition of this book for details):
0.56 Correlation Coefficient (ignoring last observation)2.2600 Test Statistic; 0.024 p value0.46 mean percentage point rise per year 1983–2000
0.7 Correlation Coefficient (including last observation)3.2447 Test Statistic; 0.001 p value0.48 mean percentage point rise per year 1983–2009
Year Rate (%) Observations Born (year) Age Study # Location
1984.5 7.6 776 65–74 10–20 2 USA1983.5 2.3 2852 66–79 6–16 6 Canada1987.5 3.8 1710 69–74 14–18 8 USA1987.5 3.7 1710 69–74 14–18 9 USA1984.5 2.2 792 71–72 13 10 USA
1990 5.6 336 73–81 9–17 17 USA1990 3.4 542 73–81 9–17 18 USA
1990.5 2.4 2762 74–83 8–16 20 USA1994 12.5 1847 75–82 12–19 22 Canada1995 13.9 4023 78–83 12–17 26 USA1994 4.5 558 79–82 12–15 29 USA-Anglo1994 6.5 665 79–82 12–15 30 USA-African-American1994 11.4 429 79–82 12–15 31 USA-Mexican-American
1994.5 4.2 4984 80–84 9–16 34 USA1994.5 4.2 1691 80–84 9–16 35 USA1999.5 9.7 1886 82–96 4–17 41 Puerto Rico
2009 15.2 5625 94 15 New USA (SAMHSA)
-2
0
2
4
6
8
10
12
14
16
18
1980
1982
1984
1986
1988
1990
1992
1994
1996
1998
2000
2002
2004
2006
2008
2010
2012
Source: Re-analysis of Costello, E.J. et al (2006) ‘Is there an epidemic of child or adolescent depression?’, Journal of Child Psychology and Psychiatry, vol 47, no 12, pp 1263-71. The data shown above are for those studies where the children lived in the USA, the US territory of Puerto Rico, or Canada. The final study was published in 2012 by Substance Abuse and Mental Health Services Administration (SAMHSA) and based on combined data from the 2008 to 2010 SAMHSA National Survey on Drug Use and Health.
Note: Each circle represents a study; the area of the circle is drawn in proportion to study size. An additional very recent study has been added to the figure which was not included in the first edition of this book.
Figure 21: Adolescent girls assessed as depressed (%) as reported in various studies in North America, 1984–2010No
wonderratesof
mentalillnessarerisingamongthe
young 21

Butisn’titall‘justnumbers’….Of32Europeancountries,theUKhasthefourthhighestrateofdrug-induceddeathamongstthoseaged15-64,andthatwasbeforerecentrisesinUKdrug-relateddeaths.InSeptember2015itwasreportedthat3,346peopleinEnglandandWaleshaddiedasaresultofdrugpoisoningintheyear2014.Thisisthehighestnumbersincerecordsbegan,andtwo-thirdsofthosedeathsinvolvedillegaldrugs.Therewasa64%increaseindeathsinvolvingheroinand/ormorphineinEnglandandWalesbetween2012and2014.Thatisanunprecedentedincreaseinsuchashort;me.WhydosomanymorepeoplebecomeaddictedtodrugsintheUKascomparedwithmanyotheraffluentcountriesandwhyistheraterisingnow?Deathsinvolvingcocaineroseby46%overthesameperiod.Figuresfor2015willnotbeavailableun;llatein2016.
22

Rate of prescribing antidepressants by NHS Board: Defined Daily Doses per 1,000 population (aged 15+), Scotland, 1992–2014:
92-93
94-95
96-97
98-99
00-01
02-03
04-05
06-07
08-09
10-11
12-13
13-14
Scotland 19 26 37 48 62 76 84 88 97 112 123 130
Ayrshire & Arran 19 26 37 51 65 81 90 95 107 123 136 145 Borders 20 26 35 43 54 68 78 84 93 110 123 132 Dum. & Galloway 21 27 39 48 64 78 83 85 92 105 118 125 Fife 21 26 36 47 60 74 80 84 93 109 121 129 Forth Valley 22 29 42 53 65 81 88 91 98 114 125 132 Grampian 15 20 28 37 48 59 67 71 78 92 103 108 Greater Glasgow 19 27 39 53 68 84 94 103 113 129 139 157 Highland 15 22 31 41 54 66 71 75 80 93 103 107 Lanarkshire 19 27 37 49 63 80 88 95 105 123 137 128 Lothian 20 27 37 46 57 70 75 78 85 99 110 115 Orkney 22 26 34 39 45 58 64 65 73 86 99 109 Shetland 14 20 29 40 52 53 55 61 70 81 96 104 Tayside 20 26 37 49 65 79 87 91 98 113 121 128 Western Isles 18 25 33 43 54 63 69 73 82 96 105 108
Note: In 2006/07, NHS Argyll & Clyde was dissolved as an NHS Board and its CHPs were absorbed into NHS Greater Glasgow and NHS Highland. From 2006/07 onwards 'Inverclyde and Renfrewshire' CHP became part of NHS Greater Glasgow & Clyde, and 'Argyll & Bute' CHP became part of NHS Highland. Beware changes in these Health Boards between those two years.
0102030405060708090100110120130140
92-
93 9
3-94
94-
95 9
5-96
96-
97 9
7-98
98-
99 9
9-00
00-
01 0
1-02
02-
03 0
3-04
04-
05 0
5-06
06-
07 0
7-08
08-
09 0
9-10
10-
11 1
1-12
12-
13 1
3-14
Source: NHS Quality Improvement Scotland (2007) NHS quality improvement Scotland: Clinical indicators 2007, Glasgow: NHS Quality Improvement Scotland, Table 1.1, p. 12.Updated using: ISD Scotland (2015) Better Information, Better Decisions, Better Health: Data Tables, NHS Scotland (http://www.isdscotland.org/Health-Topics/Prescribing-and-medicines/Publications/data-tables.asp?id=1309#1309)
Note: The NHS uses financial years when reporting on prescribing rates. The measure shown is what is called standardised defined daily doses (the commonest amount prescribed in mg/day for each anti-depressant drug) per 1,000 people aged 15+. In the first edition of this book the latest data available was for 2005–6.
Figure 25: The rate of prescribing anti-depressants by the NHS in Scotland, 1992–2014.Including
increasesinthelegaltakingofmind
alteringdrugs(nowmorethanatenthofthepopula;on)
23

Thereac;onofthegovernmenttothenewsofrisingmortalityin2015wastosay:“…anydeathrelatedtodrugsisatragedy…Ourdrugsstrategyisabouthelpingpeoplegetoffdrugsandstayoffthemforgood,andwewillcon;nuetohelplocalauthori;esgivetailoredtreatmenttousers."Yet,atthesame;me,localauthoritybudgetswerebeingcut,andcutagain.Oneresulthasbeenthelossofmuchvaluablelocalcollec;veexperienceofdealingwithdrugaddic;on.InNovember2015onelocalresidentofOxfordshirewrotetothecouncilcomplainingabouttheextentofthecutstolocalservices,sayinghecouldnotunderstandwhyserviceswerebeingcutwhenfundinghadonlyhada‘slightfall’.TheConserva;veleaderofOxfordshireCountyCouncilwrotebacktohimtoexplainthatthefallwas£72million,or37%oflocalbudgets,andwasnot‘slight’.Thatresidentwastheprimeminister,DavidCameron
24
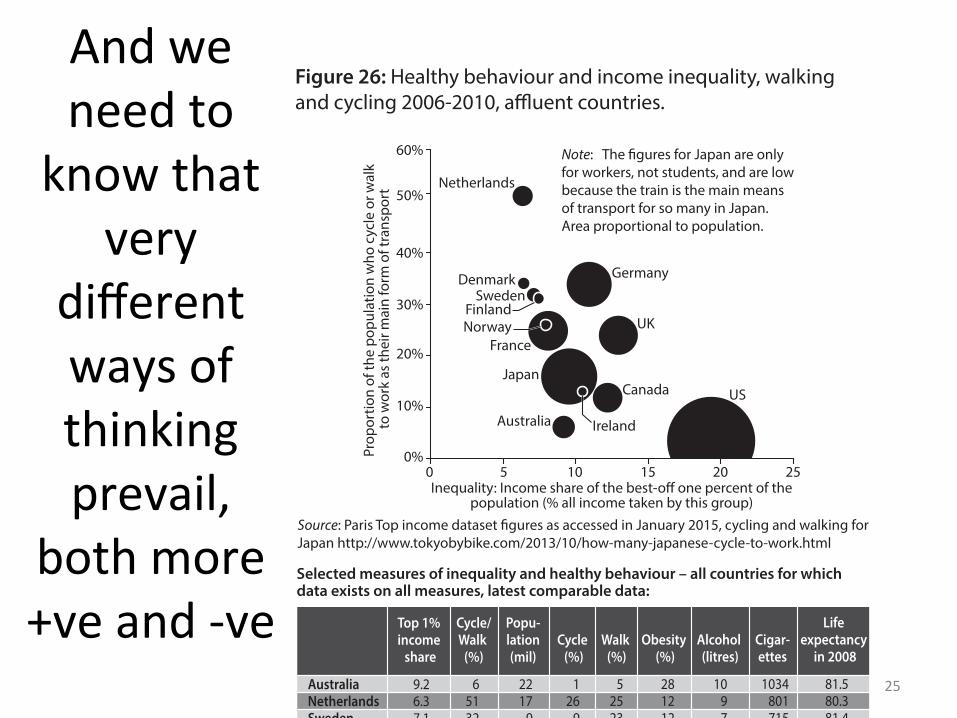
Selected measures of inequality and healthy behaviour – all countries for which data exists on all measures, latest comparable data:
AustraliaNetherlandsSwedenNorwayFranceCanadaFinlandIrelandGermanyUKDenmarkUSJapan
Top 1% income
share
9.26.37.17.98.1
12.17.5
10.510.912.9
6.419.3
9.5
Cycle/Walk
(%)
651322625123113342434
3.516
Popu-lation(mil)
2217
95
6334
55
8262
6310127
Cycle (%)
126
943192
102
180.5
9
Walk (%)
525232222112211242216
37
Obesity (%)
281212101525162315251335
4
Alcohol (litres)
10977
138
1012121011
97
Cigar-ettes
1034801715534854809671
10061045
750141310281841
Life expectancy
in 2008
81.580.381.480.681.280.779.979.980.279.778.877.982.7
Prop
ortio
n of
the
popu
latio
n w
ho c
ycle
or w
alk
to w
ork
as th
eir m
ain
form
of t
rans
port
0%
20%
40%
60%
10%
30%
50%
0 5 10 15Inequality: Income share of the best-off one percent of the
population (% all income taken by this group)
20 25
Netherlands
DenmarkSweden
Finland
Germany
NorwayFrance
UK
JapanCanada
IrelandAustralia
US
Source: Paris Top income dataset figures as accessed in January 2015, cycling and walking for Japan http://www.tokyobybike.com/2013/10/how-many-japanese-cycle-to-work.html
Note: The figures for Japan are only for workers, not students, and are low because the train is the main means of transport for so many in Japan. Area proportional to population.
Note: Data sources as above except obesity data, which is % of population obese aged 15 years and over in 2012 (source http://www.oecd.org/els/health-systems/Obesity-Update-2014.pdf ). Cigarettes is number of cigarettes smoked per adult per year in 2007 (source http://en.wikipedia.org/wiki/List_of_countries_by_cigarette_consumption_per_capita)Alcohol consumption measured in equivalent litres of pure ethanol per capita per year 2008 –2012 (source http://en.wikipedia.org/wiki/List_of_countries_by_alcohol_consumption_per_capita). Life expectancy source is http://www.oecd.org/berlin/47570143.pdf
Figure 26: Healthy behaviour and income inequality, walking and cycling 2006-2010, affluent countries.
Andweneedtoknowthat
verydifferentwaysofthinkingprevail,
bothmore+veand-ve
25

Healthspendingperpersonis49%higherinGermany,41%higherinDenmark,and27%higherinFrancecomparedtotheUK.ItistwiceasmuchinSwitzerland,81%higherinNorway,59%higherintheNetherlands.TheUKcommitsfewerresourcesthananycomparablecountrytohealthcare.
26

TheChancellordescribestheUKasahighpublicspending,highwelfarespendingcountry.Itispossiblethatheactuallybelievesthistobetrue.Weneedtoworryaboutthatpossibility.(Alldataandsourcesnotshownherearein“Abederpoli;cs”tobepublishedon-lineinMarch2016)
27

Ourgovernmentnowaimstogetspendingdownto36%ofGDP;apost-
warandEuropeanlow.
In2020Finlandisprojectedtospend57%ofGDPonpublicservices,France54%,andDenmark,BelgiumandAustriawillspend51%onpublicservices,Swedenwillspend49%,Italy48%,Portugal47%,Norway47%,Germany43%,theNetherlands42%,Greece41%,Japan40%,andCanadaandSpaineach39%.
28
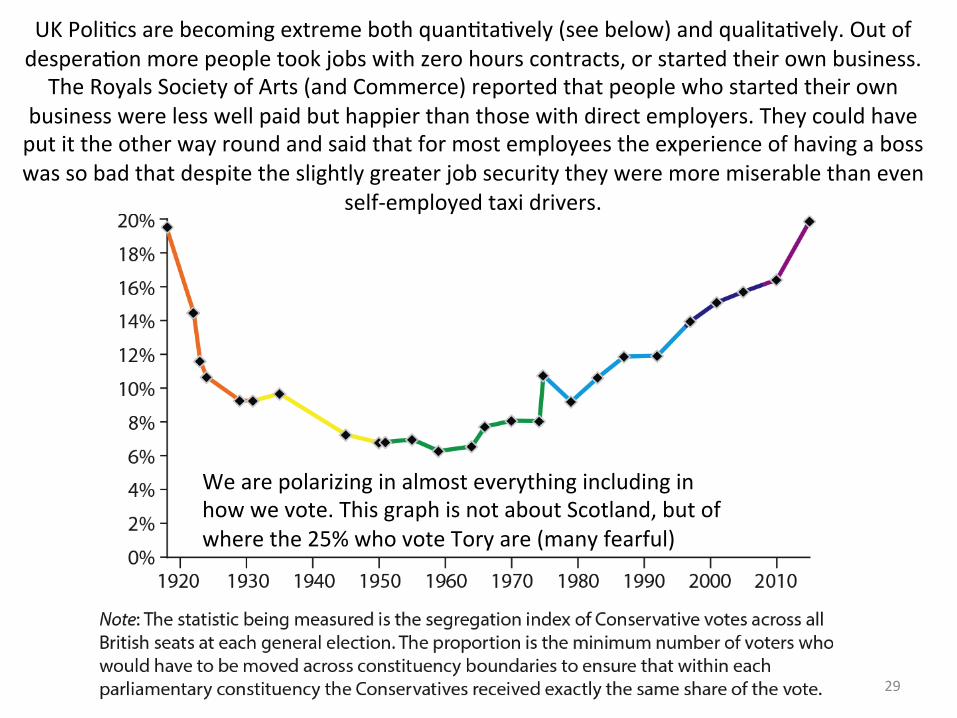
UKPoli;csarebecomingextremebothquan;ta;vely(seebelow)andqualita;vely.Outofdespera;onmorepeopletookjobswithzerohourscontracts,orstartedtheirownbusiness.TheRoyalsSocietyofArts(andCommerce)reportedthatpeoplewhostartedtheirown
businesswerelesswellpaidbuthappierthanthosewithdirectemployers.Theycouldhaveputittheotherwayroundandsaidthatformostemployeestheexperienceofhavingabosswassobadthatdespitetheslightlygreaterjobsecuritytheyweremoremiserablethaneven
self-employedtaxidrivers.
Wearepolarizinginalmosteverythingincludinginhowwevote.ThisgraphisnotaboutScotland,butofwherethe25%whovoteToryare(manyfearful)
29

ThistalkbeganwithaquotefromKeynessoitendswithone
In1930JohnKeyneslookedforwardto2030.Hesaidwewereina“temporaryphaseofmaladjustment[…andthatthe]loveofmoneyasapossession–asdis;nguishedfromtheloveofmoneyasameanstotheenjoymentsandreali;esoflife–willberecognisedforwhatitis,asomewhatdisgus;ngmorbidity,oneofthosesemi-criminal,semi-pathologicalpropensi;eswhichonehandsoverwithashuddertothespecialistsinmentaldisease.”[email protected]@meinwhichtoestablishthattheloveofmoneypurelyforitselfisadisgus@ngdisease,todeterminewhatarethecausesandconsequencesofthatdisease,andtoactonthosefindings…..
30