Embed Size (px)
Citation preview

ARE CONSUMERS BENEFITING FROM COMPETITION?An Analysis of the Individual Residential Electric Supply Market in Massachusetts: 2021 Update
OFFICE OF MASSACHUSETTS ATTORNEY GENERAL MAURA HEALEY
Are Consumers Benefiting from Competition? An Analysis of the Individual Residential Electric Supply Market in Massachusetts:
2021 Update
A Report by the Massachusetts Attorney General’s Office Prepared by Susan M. Baldwin
March 2021

Are Residential Consumers Benefiting from Electric Supply Competition? Massachusetts 2021 Update
Prepared for the Massachusetts Attorney General’s Office
i
Table of Contents
Glossary of Terms ............................................................................................................... v Executive Summary .......................................................................................................... vii Introduction ......................................................................................................................... 1 1. Data examined ............................................................................................................ 2 2. Are residential consumers benefiting from participation in the electric supply market in Massachusetts? ................................................................................................................ 6
2.1 Introduction ............................................................................................................... 6 2.2 What is the annual consumer gain or loss associated with households’ participation in the individual residential electric supply market? ...................................................... 6 2.3 Minority of suppliers who provided limited consumer gains ................................... 9 2.4 Consumer loss examined at the supplier level .......................................................... 9 2.5 Residential consumers still do not benefit from direct participation in the electric supply market. ............................................................................................................... 12
3. What is the consumer loss associated with low-income households’ participation in the individual residential electric supply market? ............................................................ 13
3.1 Introduction ............................................................................................................. 13 3.2 What is the consumer loss associated with low-income households’ participation in the individual residential electric supply market? ........................................................ 13 3.3 What is the consumer harm to low-income households that purchase electricity directly from competitive suppliers? ............................................................................ 14 3.4 Low-income customers are overrepresented in the individual residential electric supply market. ............................................................................................................... 15 3.5 Potential targeting of vulnerable communities. ...................................................... 16 3.6 Statistical analysis shows negative correlation between income and participation. 19 3.7 Consumer loss examined at the supplier level ........................................................ 21 3.8 Conclusions about the low-income market ............................................................. 23
4. Conclusion ................................................................................................................ 24

Are Residential Consumers Benefiting from Electric Supply Competition? Massachusetts 2021 Update
Prepared for the Massachusetts Attorney General’s Office
ii
List of Tables Executive Summary Table ES.1 Net Consumer Loss from Participation in the Individual Residential
Electric Supply Market Compared to Electric Company Basic Service Section 2 Table 2.1 Average Annual Household Losses – Five-Year Comparison
Table 2.2 Overview of Electric Supply Market – Five-Year Comparison
Table 2.3 Ten Suppliers with the Highest Average Premium – All Households (July 2019 – June 2020)
Table 2.4 Ten Suppliers with the Highest Number of Bills – All Households (July 2019 – June 2020)
Table 2.5 Ten Suppliers Responsible for the Greatest Aggregate Consumer Loss – All Households (July 2019 – June 2020)
Section 3
Table 3.1 Participation Rates and Premiums Paid Based on Communities’ Demographics (September 2019)
Table 3.2 Ten Municipalities and Neighborhoods with the Highest Aggregate Net Consumer Loss – All Incomes (monthly loss (September 2019))
Table 3.3 Ten Municipalities with the Highest Aggregate Net Consumer Loss – All Incomes (monthly loss (September 2019, 2018, and 2017))
Table 3.4 Ten Suppliers with the Highest Average Premium – Low-Income
Households (July 2019 – June 2020)
Table 3.5 Ten Suppliers with the Highest Number of Bills – Low-Income Households (July 2019 – June 2020)
Table 3.6 Ten Suppliers Responsible for the Greatest Aggregate Consumer Loss – Low-Income Households (July 2019 – June 2020)

Are Residential Consumers Benefiting from Electric Supply Competition? Massachusetts 2021 Update
Prepared for the Massachusetts Attorney General’s Office
iii
List of Figures
Executive Summary Figure ES.1 Low-Income and Non-Low-Income Consumer Participation Rates Figure ES.2 Low-Income and Non-Low-Income Consumer Average Annual Loss Section 1 Figure 1.1 Average Monthly Numbers of Households Purchasing from Competitive
Suppliers, Electric Companies, and Municipal Aggregations Figure 1.2 Average Monthly Numbers of Low-Income Households Purchasing from
Competitive Suppliers, Electric Companies, and Municipal Aggregations Figure 1.3 Average Monthly Numbers of Non-Low-Income Households Purchasing
from Competitive Suppliers, Electric Companies, and Municipal Aggregations
Section 2 Figure 2.1 Gap Between Average Rate Paid to Competitive Suppliers and Rate Had
Participants Purchased from Electric Companies Section 3 Figure 3.1 Boston, Springfield, and Worcester Zip Codes by Share of Low-Income
Customers and Rate of Participation in the Individual Residential Electric Supply Market (September 2019)
List of Appendices
Appendix ES1 Experience and Qualifications of Susan M. Baldwin Appendix 1A Map of EDC Service Areas and Municipal Light Plant Towns Appendix 2A EDC Rates During Study Period: July 2015 – June 2016; July 2016 – June
2017; July 2017 – June 2018; July 2018 – June 2019; and July 2019 – June 2020
Appendix 2B Consumer Loss, Premium, and Participation by Municipality – All
Households (September 2019 and September 2018)

Are Residential Consumers Benefiting from Electric Supply Competition? Massachusetts 2021 Update
Prepared for the Massachusetts Attorney General’s Office
iv
Appendix 2C Consumer Loss, Premium, and Participation by Municipality – Low-Income Households (September 2019 and September 2018)
Appendix 2D Supplier-Specific Information – All Households (September 2019 and September 2018)
Appendix 3A Supplier-Specific Information – Low-Income Households (September
2019 and September 2018) Appendix 3B Zip Code and Municipality Participation in the Individual Residential
Electric Supply Market September 2019: Majority-Minority vs. Rest of State (September 2019 and September 2018)
Appendix 3C Zip Code and Municipality Participation in the Individual Residential
Electric Supply Market, September 2019: Bottom 20 Median Income vs. Rest of State (September 2019 and September 2018)
Appendix 3D Zip Code and Municipality Participation in the Individual Residential
Electric Supply Market, September 2019: Top 20 Median Income vs. Rest of State (September 2019 and September 2018)

Are Residential Consumers Benefiting from Electric Supply Competition? Massachusetts 2021 Update
Prepared for the Massachusetts Attorney General’s Office
v
Glossary of Terms Basic service: For those consumers who do not receive their electric supply from a competitive supplier, their electric company purchases their electricity on their behalf, providing them supply services that are known as “basic service.” Electric company (this is also referred to as an “electric distribution company” or “EDC”): In Massachusetts the electric companies are NSTAR Electric Company d/b/a Eversource Energy (“NSTAR”); Massachusetts Electric Company d/b/a National Grid (“MECo”); Nantucket Electric Company d/b/a National Grid (“Nantucket”); and Fitchburg Gas and Electric Light Company d/b/a Unitil (“Fitchburg”). See Appendix 1A for a map of the Massachusetts electric companies’ non-overlapping service territories. Individual residential electric supply market: In this report, this term is used to describe the market in which residential consumers may choose to purchase electric service directly from a company other than their electric company. kWh: A kilowatt hour describes energy used over a period of time, specifically, 1,000 watts per hour. Low-income: In this report, the term “low-income” refers to consumers that receive subsidized electricity rates. To qualify for this rate, a consumer’s annual income may not exceed 60 percent of the median income in Massachusetts. For a family of four, this would translate to a household income of $75,201 or less in fiscal year 2020.1 The report’s analysis of low-income customers does not encompass those consumers who may be eligible for subsidized rates but who have not enrolled in the program for subsidized rates. “Non-low-income” refers to residential customers who do not receive a low-income rate. Municipal aggregation and municipal aggregation suppliers: Municipal aggregations are programs, created pursuant to G.L. c. 164, § 134, where a municipality or a group of municipalities aggregate the electrical load of participating residents and businesses in the respective community. This report refers to competitive suppliers that serve municipal aggregations as “municipal aggregation suppliers.” Consumers residing in towns and cities with municipal aggregations programs also may choose to be served directly by a competitive supplier other than the one that serves the municipal aggregation.
Municipal light plants: A municipal light plant is a municipality-owned distribution company responsible for the transmission and supply of electricity to the residents and businesses in the municipality. Participation rate: As used in this report, the participation rate is the ratio of the number of consumers participating in the individual residential electric supply market to the total number of residential electric consumers. The total number of residential electric

Are Residential Consumers Benefiting from Electric Supply Competition? Massachusetts 2021 Update
Prepared for the Massachusetts Attorney General’s Office
vi
consumers includes those purchasing electricity from any of these three sources: competitive suppliers, electric companies, and municipal aggregations. Consumers served by municipal light plants are not included in the analyses contained in this report. Premium: This term is used in the report to denote the difference between the average residential competitive supply rate and the average basic service rate. It could also be referred to as a “mark-up.” Restructuring: In 1997, the Massachusetts Legislature restructured the electricity industry, creating a competitive market for the supply of electricity (“Restructuring”). The purpose of Restructuring was to reduce electricity costs through the new competitive market. In restructuring the electricity industry, the Legislature recognized that “electricity service is essential to the health and well-being of all residents of the commonwealth.” St. 1997, c. 164, § 1(a).

Are Residential Consumers Benefiting from Electric Supply Competition? Massachusetts 2021 Update
Prepared for the Massachusetts Attorney General’s Office
vii
Executive Summary In March of 2018, the Massachusetts Attorney General’s Office (“AGO”) issued the first comprehensive analysis of the individual residential electric supply market2 in Massachusetts (“Massachusetts 2018 Report”).3 Analyzing data from July 2015 through June 2017, that report specifically undertook to answer whether (1) residential consumers in Massachusetts pay more or less for their electric supply when they buy it directly from a competitive supplier rather than through their electric company (such as National Grid, Eversource, and Unitil); and (2) if so, what remedies might be warranted. The Massachusetts 2018 Report found that, between July 2015 and June 2017, Massachusetts consumers paid $176.8 million more for individual residential electric supply than they would have paid for basic service from their electric company. In 2019, the AGO issued an update to the original report to include new data for the one-year period beginning in July 2017 and ending in June 2018 (“Massachusetts 2019 Update”).4 Using the same types of data and analytical methodology, the Massachusetts 2019 Update showed that Massachusetts consumers in the individual residential electric supply market paid $253 million more than they would have paid if they had received electric supply from their electric company during the three-year period from July 2015 to June 2018. This new report5 updates the earlier reports to include new data for two consecutive one-year periods: the first period spans July 2018 through June 2019, and the second period spans July 2019 through June 2020 (“Massachusetts 2021 Update”).6 Massachusetts consumers in the individual residential electric supply market paid $426 million more than they would have paid if they had received electric supply from their electric company during the five-year period from July 2015 to June 2020. As Table ES.1 below shows, the net consumer loss continues to be substantial. Table ES.1. Net Consumer Loss from Participation in the Individual Residential Electric Supply Market Compared to the Electric Company’s Basic Service
July 2015 - June 2016
July 2016 - June 2017
July 2017 - June 2018
July 2018 - June 2019
July 2019 - June 2020
Five-Year Total Net Loss
Total Net Consumer Loss (millions)
$65.4 m $111.4 m $76.2 m $87.0 m $85.7 m $425.7 m
Low-income customers still make up a disproportionately large share of the individual residential electric supply market. Figure ES.1, below, shows that low-income

Are Residential Consumers Benefiting from Electric Supply Competition? Massachusetts 2021 Update
Prepared for the Massachusetts Attorney General’s Office
viii
households continue to participate in the individual residential electric supply market at almost twice the rate of non-low-income households.7 Figure ES.1. Low-Income and Non-Low-Income Consumer Participation Rates
My analysis also shows that these low-income customers pay especially high prices in the individual residential electric supply market. Figure ES.2, below, shows that, assuming an average monthly usage of 600 kWh across both income groups,8 the annual consumer loss for low-income participants is $241, which is 24 percent higher than the annual consumer loss of $194 for non-low-income participants.9
31%
17%
0%
5%
10%
15%
20%
25%
30%
35%
Low-income Non-low-income

Are Residential Consumers Benefiting from Electric Supply Competition? Massachusetts 2021 Update
Prepared for the Massachusetts Attorney General’s Office
ix
Figure ES.2. Low-Income and Non-Low-Income Consumer Average Annual Loss10
Additionally, I analyzed the impact of the individual residential electric supply market on residential consumers by zip code. My analysis shows that, viewed on a municipality-by-municipality basis, in September 2019,11 in all but two of the Commonwealth’s towns and cities that were open to competition, residents who signed up directly with a supplier experienced a net consumer loss. In two towns, a total of 23 customers saved a nominal amount ($14) in aggregate in September 2019. By contrast, Worcester residents collectively experienced $390,078 and $353,290 in net losses for September 2019 and September 2018, respectively, more than any other town or city in the Commonwealth. Fall River experienced net losses of $271,862 in September 2019 and $201,267 in September 2018.
I also analyzed the impact of the individual residential electric supply market based on the demographics of the Commonwealth’s various communities. My analysis shows that competitive suppliers charged higher rates to residents in communities with the following demographics:
• Communities with low median incomes and
• Communities with high percentages of minority households.12
Further, regression analyses of zip code-level data for the month of September 2019 as well as for the month of September 2018 provide findings—similar to prior studies—that are consistent with disparate targeting of low-income customers for enrollment to competitive supply accounts. Put simply, a customer who resides in a low-income community is more likely to participate in the individual residential electric supply market, even if that particular customer is not a low-income customer herself.
$194
$241
$0 $50 $100 $150 $200 $250 $300
Low-income Non-low-income

Are Residential Consumers Benefiting from Electric Supply Competition? Massachusetts 2021 Update
Prepared for the Massachusetts Attorney General’s Office
x
Conclusion The Massachusetts 2021 Update demonstrates that individual residential consumers have suffered large financial losses by directly signing contracts for their electric supply with individual residential electric suppliers. In addition, Massachusetts low-income customers continue to suffer a disproportionate amount of the consumer harm. The size of the harm to consumers, the significant losses in all four years of this study, and the continuing loss from one year to the next all strongly suggest that consumer harm will continue. The scope of this report is limited to the individual residential electric supply marketplace. I do not analyze the commercial and industrial market, because, as a general rule, commercial customers have access to expertise when purchasing electric supply and have greater negotiating power than an individual residential consumer. Therefore, these customers may have benefited from competition in the supply market. I also have not analyzed the Commonwealth’s various municipal aggregations.

Are Residential Consumers Benefiting from Electric Supply Competition? Massachusetts 2021 Update
Prepared for the Massachusetts Attorney General’s Office
1
Introduction
The AGO commissioned the Massachusetts 2021 Update as part of the AGO’s ongoing effort to provide greater transparency regarding the operation of the individual residential electric supply market in Massachusetts. This Massachusetts 2021 Update is organized as follows:
• In Section 1, I describe my methodology for computing the consumer loss associated with participation in the individual residential electric supply market. My methodology is largely unchanged from the Massachusetts 2018 Report and the Massachusetts 2019 Update.13
• In Section 2, I discuss my findings relative to the entire residential class (with the exception of households participating in a municipal aggregation and those households served by municipal light plants). Some of my tables display results for each of the two study periods: July 2018 through June 2019 and July 2019 through June 2020.
• In Section 3, I discuss the experience of low-income households in the individual
residential electric supply market, including analyses regarding suppliers’ possible targeting of low-income populations. I also discuss analyses regarding suppliers’ presence among the Commonwealth’s communities, including analyses regarding suppliers’ possible targeting of vulnerable populations.
• Appendices provide additional information and analyses, especially based on my
analysis of zip code level data for September 2019 and September 2018. I have updated the appendices included in the Massachusetts 2019 Update and include results for each of the two study periods since the Massachusetts 2019 Update (i.e., September 2018 for July 2018 – June 2019 and September 2019 for July 2019 – June 2020).
Are Residential Consumers Benefiting from Electric Supply Competition? Massachusetts 2021 Update
Prepared for the Massachusetts Attorney General’s Office
2
1. Data examined The three electric companies that serve Massachusetts provided the AGO with detailed supplier-specific data separately for five consecutive 12-month time periods: July 2015 – June 2016; July 2016 – June 2017; July 2017 – June 2018; July 2018 – June 2019; and July 2019 – June 2020. These data include monthly information specific to each of the fourservice territories of Massachusetts’ electric companies:
• NSTAR Electric Company d/b/a Eversource Energy (“NSTAR”); • Massachusetts Electric Company d/b/a National Grid (“MECo”); • Nantucket Electric Company d/b/a National Grid (“Nantucket”); and • Fitchburg Gas and Electric Light Company d/b/a Unitil (“Fitchburg”).14
In the course of analyzing the data from the electric companies, my principal question was whether or not residential consumers are saving money by directly purchasing their electric supply from competitive suppliers.15 I provide an update to this analysis in Section 2 of my report. Based on the electric companies’ datasets, I was able to deduce several statistics concerning the size and scope of the Massachusetts individual residential electric supply market. My review of the updated supplier billing data shows that the number of participants decreased by approximately 6 percent between the third (2017–2018) and fourth study periods and by approximately 3 percent between the fourth (2018–2019) and fifth (2019–2020) study periods. Examining the overall distribution of customers across the three most recent 12-month periods (2017–2020) demonstrates that basic service customers comprised 55 percent of households in the first of the two years and only 51 percent in the most recent year; the percentage of customers purchasing from individual residential suppliers declined only slightly (from 20 percent in the first of the three most recent years to approximately 19 percent in the most recent two years). Meanwhile, there has been a shift to municipal aggregation (25 percent in the 2017–2018 study period, 26 percent in the 2018–2019 study period, and 30 percent in the 2019–2020 study period). Additional statistics for the most recent study period (July 2019–June 2020) include:16
• Suppliers, in the aggregate, billed Massachusetts consumers more than $449 million.
• Suppliers issued 5,427,350 monthly bills to Massachusetts residential consumers during a 12-month period, suggesting that suppliers serve an average of 452,279 households in Massachusetts, of which 84,291 are low-income households.17
• Low-income households make up 19 percent of the customers participating in the individual residential electric supply market yet make up only 11 percent of the market for all electric customers.18

Are Residential Consumers Benefiting from Electric Supply Competition? Massachusetts 2021 Update
Prepared for the Massachusetts Attorney General’s Office
3
• Almost one-third (31 percent) of all low-income customers in Massachusetts take service from an individual residential supplier.
• Approximately 60 different suppliers are active in the Massachusetts market.19
• The average monthly usage for all households in Massachusetts that participated in the individual residential electric supply market during the study period was 562 kWh.20
Figure 1.1, Figure 1.2, and Figure 1.3, below, show the participation rates separately for all customers, low-income customers, and non-low-income customers, respectively. Figure 1.1 shows that approximately 452,000 consumers (19 percent of all residential consumers) participate in the individual residential electric supply market in Massachusetts. The average monthly numbers of customers shown in these three figures correspond with the average of 12 months of data for the period spanning July 2019 through June 2020.

Are Residential Consumers Benefiting from Electric Supply Competition? Massachusetts 2021 Update
Prepared for the Massachusetts Attorney General’s Office
4
Figure 1.1. Average Monthly Numbers of Households Purchasing from Competitive Suppliers, Electric Companies, and Municipal Aggregations
452,279 19%
1,259,939 51%
736,850 30%
Competitive Supply Basic ServiceMuni. Aggregation

Are Residential Consumers Benefiting from Electric Supply Competition? Massachusetts 2021 Update
Prepared for the Massachusetts Attorney General’s Office
5
Figure 1.2 and Figure 1.3 show the proportion of low-income households and non-low-income households that participate in the individual residential supply market, as opposed to the proportion that receives basic service and the proportion that is served through a municipal aggregation. Low-income customers and non-low-income customers have participation rates of 31 percent and 17 percent in the individual residential supply market, respectively.
The electric companies also provided supplier-specific data disaggregated to the zip code level for a single month of each of the most recent 12-month study periods (September 2018 and September 2019), as well as electric company-specific counts of bills for both low-income and all non-low-income residential consumers at the zip code level.21 I used this geographically granular data to examine competitive suppliers’ presence among the Commonwealth’s communities and to compare participation in the individual residential electric supply market between low-income customers and all non-low-income residential customers. I discuss my findings based on my zip code analysis in Section 3, below, and provide more detailed findings in the corresponding appendices. I found patterns consistent with possible supplier targeting of economically disadvantaged communities and households similar to those shown by my prior analyses of corresponding zip code data for June 2016, June 2017, and June 2018. The Massachusetts 2021 Update summarizes my zip code analysis for September 2019. I also analyzed data at the zip code level for September 2018, and the results of that analysis are consistent with my findings for September 2019.

Are Residential Consumers Benefiting from Electric Supply Competition? Massachusetts 2021 Update
Prepared for the Massachusetts Attorney General’s Office
6
2. Are residential consumers benefiting from participation in the electric supply market in Massachusetts?
2.1 Introduction In this section, I summarize my findings about the price of participation in the individual residential electric supply market. For the purposes of this Section 2, I analyzed suppliers’ billing data in order to:
(1) Compute the total annual consumer gain or loss associated with the participation by households in the individual residential electric supply market in Massachusetts;
(2) Analyze average consumer loss, when expressed on a per-household basis; and (3) Analyze the range of average rates charged by suppliers.
2.2 What is the annual consumer gain or loss associated with households’ participation in the individual residential electric supply market? Massachusetts residential electricity consumers who took service directly from a competitive supplier paid approximately $426 million more than they would have paid if they had received basic service from their electric company over the course of the five study periods. Specifically, consumers overpaid by $65.4 million during the 2015–2016 study period, by $111.4 million during the 2016–2017 study period, by $76.2 million during the 2017–2018 study period, by $87.0 million during the 2018-2019 study period, and by $85.7 million during the 2019–2020 study period. My analysis shows that substantial consumer losses continue to characterize this market. Table 2.1, below, summarizes average annual household losses for five consecutive study years. Table 2.1. Average Annual Household Losses – Five-Year Comparison
The size of the individual residential electric supply market has been relatively stable during these five years (the number of bills rendered fell seven percent and the total dollars billed declined by less than one percent). Although the size of the market has
Year 1 Year 2 Year 3 Year 4 Year 5July 2015 - June 2016
July 2016 - June 2017
July 2017 - June 2018
July 2018 - June 2019
July 2019 - June 2020
134$ 226$ 155$ 187$ 190$

Are Residential Consumers Benefiting from Electric Supply Competition? Massachusetts 2021 Update
Prepared for the Massachusetts Attorney General’s Office
7
remained stable, the weighted average basic service rate provided through the electric companies has varied significantly. I summarize these findings in Table 2.2, below. Table 2.2. Overview of Individual Residential Electric Supply Market – Five-Year Comparison
Figure 2.1, below, shows that individual residential supply consumers continued to pay a premium during the 12 months spanning July 2019 through June 2020 (consistent with the pattern shown in the Massachusetts 2018 Report and the Massachusetts 2019 Update for and with my analysis of data for July 2018 – June 2019). That is, these consumers continued to pay a higher average rate per kWh to individual residential suppliers than the average rate per kWh that they would have paid if they had purchased basic service through their electric company.22 Moreover, Figure 2.1 shows that low-income participants in the individual residential electric supply market consistently pay more for electricity than do non-low-income customers in the individual residential electric supply market. On average, low-income customers paid a premium of $0.0334 per kWh, 24 percent more than the $0.0270 per kWh premium paid by non-low-income customers of competitive suppliers. Assuming a use of 600 kWh per month, this premium would equate to almost $50 in additional losses ($46.08) over a year.

Are Residential Consumers Benefiting from Electric Supply Competition? Massachusetts 2021 Update
Prepared for the Massachusetts Attorney General’s Office
8
Figure 2.1, Gap Between Average Rate Paid to Competitive Suppliers and Rate Had Participants Purchased from Electric Companies (July 2019 – June 2020)
My methodology remains the same as described on pages 8–9 of the Massachusetts 2018 Report, and Appendix 2B of that report. Appendix 2A provides the basic service rates in effect during the five-year-study period (July 2015 – June 2020). Appendix 2B shows, separately by municipality for all households, the average number of households participating in the individual residential electric supply market, the average per-household net consumer loss, and the aggregate consumer loss for September 2018 and for September 2019. Appendix 2C shows the same information for low-income households. In Section 3, below, Table 3.2 shows the ten municipalities and neighborhoods with the highest aggregate net consumer loss in September 2019 (which includes many but not all of the same communities as those based on my analysis of data for September 2018).

Are Residential Consumers Benefiting from Electric Supply Competition? Massachusetts 2021 Update
Prepared for the Massachusetts Attorney General’s Office
9
2.3 Minority of suppliers who provided limited consumer gains Only one in five bills issued to Massachusetts customers served by an individual residential supplier included supply rates that were lower than the basic service rates charged through their electric companies. As seen in further detail in Appendix 2D-2021 (which includes two separate analyses of the two most recent 12-month periods), during the course of the 12-month period between July 2019 and June 2020, suppliers provided savings of $11,286,389 to some customers. Those savings were offset by losses of $97,031,408 during the same time period, for a total net loss of $85,745,019.23 Suppliers that serve 91 percent of the Massachusetts customer base that receives individual residential electric supply provided customers with net losses on average. These “net-loss” suppliers account for almost $88 million in consumer loss. By contrast, the few individual residential suppliers (9 percent) that provided net gains to Massachusetts customers on average provided only $2 million in net gains in total. Moreover, the per-customer net savings that suppliers with net average savings provided were small. The average annual savings per consumer was $46.61, and the average rate (weighted by kWh) paid by this group of consumers was $0.1136 per kWh. By comparison, the average loss per customer (for the approximate 91 percent of the total individual residential supplier customer base who experienced net losses), expressed on an annual basis, was $213.55, and the average rate paid by this group of consumers was $0.1501 per kWh.24
2.4 Consumer loss examined at the supplier level Table 2.3, below, shows the ten suppliers25 (with their identities withheld) who charged the highest average premium over basic service during the 2019–2020 study period.26 In short, Table 2.3 shows which suppliers charged the most, relative to the corresponding basic service rates charged through the electric companies, for residential electric supply on average during the 2019–2020 study period. Table 2.3 shows that one supplier charged, on average, over $0.06 per kWh more than the corresponding electric company rate, five suppliers charged over $0.05 per kWh more than the corresponding electric company rate, and all ten suppliers charged, on average, greater than $0.04 per kWh more than the corresponding electric company rate. It is worth noting that the premiums paid by any individual consumer could be much higher than that amount. Because electric company rates vary throughout the Commonwealth, I rank suppliers based on the premiums they charge relative to the electric companies’ rates rather than ranking them based on the suppliers’ rates. Three of the “top ten” suppliers shown (#25, #1, and #39) have been in the top ten ranking for premiums for four consecutive years (i.e., during the 2016–2017, the 2017–2018, the 2018–2019, and the 2019–2020 study periods). One supplier in the “top ten” in this report (#15) has been in the top ten ranking for three of the four years studied. Supplier #48 and Supplier #35 were in the "top ten” for both the 2018–2019 and the 2019–2020 study periods.

Are Residential Consumers Benefiting from Electric Supply Competition? Massachusetts 2021 Update
Prepared for the Massachusetts Attorney General’s Office
10
Table 2.3. Ten Suppliers with the Highest Average Premium – All Households (ranked by premium): July 2019-June 2020
Table 2.4, below, shows the ten suppliers for which electric companies rendered the most bills. These ten suppliers account for 60 percent of the bills rendered in the individual residential electric supply market. The bills rendered on behalf of these ten suppliers included instances of prices above electric company rates (resulting in $53.4 million in losses) and instances of prices below electric company rates (resulting in gains of $6.1 million).
Supplier ID Average Rate # of Bills Average Premium
Share of Accounts
Loss Associated with High
Prices
Gain Associated with Low
Prices
Net Consumer
LossShare of
LossShare of
Gain
Supplier #24 $0.1782 42,312 $0.0631 0.78% $1,420,571 -$55,948 $1,364,623 1.5% 0.5%Supplier #15 $0.1754 72,026 $0.0575 1.33% $1,943,757 -$56,815 $1,886,942 2.0% 0.5%Supplier #6 $0.1741 160,629 $0.0568 2.96% $4,906,883 -$106,275 $4,800,608 5.1% 0.9%Supplier #1 $0.1730 27,319 $0.0553 0.50% $912,899 -$23,503 $889,396 0.9% 0.2%Supplier #25 $0.1726 330,142 $0.0528 6.08% $8,097,116 -$231,530 $7,865,586 8.3% 2.1%Supplier #48 $0.1616 30,738 $0.0465 0.57% $842,164 -$5,363 $836,800 0.9% 0.0%Supplier #39 $0.1640 31,672 $0.0454 0.58% $712,087 -$10,450 $701,637 0.7% 0.1%Supplier #66 $0.1621 120,316 $0.0443 2.22% $2,477,159 -$29,890 $2,447,269 2.6% 0.3%Supplier #60 $0.1634 290,972 $0.0440 5.36% $6,683,700 -$440,653 $6,243,047 6.9% 3.9%Supplier #35 $0.1641 72,770 $0.0439 1.34% $1,822,240 -$18,016 $1,804,224 1.9% 0.2%
Total associated with top 10 1,178,896 22% 29,818,575$ (978,443)$ 28,840,132$ 31% 9%

Are Residential Consumers Benefiting from Electric Supply Competition? Massachusetts 2021 Update
Prepared for the Massachusetts Attorney General’s Office
11
Table 2.4. Ten Suppliers with the Highest Number of Bills – All Households (ranked by number of bills): July 2019-June 2020
Table 2.5, below, shows the ten suppliers responsible for the largest total consumer losses in Massachusetts. In aggregate, these suppliers account for $62.7 million of the bills attributable to overpayment and $3.0 million of the bills attributable to underpayment, with Supplier #37 accountable, again, for the greatest portion of net consumer loss. Supplier #37 has been accountable for the greatest portion of consumer loss for four consecutive study periods: in the Massachusetts 2018 Report, the Massachusetts 2019 Update, and here, in the Massachusetts 2021 Update (during both the 2018–2019 and the 2019–2020 study periods that the 2021 Update examines).
Supplier IDAverage
Rate # of Bills Average Premium
Share of Accounts
Loss Associated with High
Prices
Gain Associated with
Low Prices Net
Consumer LossShare of
LossShare of
Gain
Supplier #37 $0.1590 526,480 $0.0397 9.70% $12,643,496 -$349,338 $12,294,159 13.03% 3.10%Supplier #34 $0.1145 442,846 -$0.0047 8.16% $1,753,193 -$3,214,162 -$1,460,969 1.81% 28.48%Supplier #42 $0.1446 434,772 $0.0244 8.01% $7,049,113 -$937,895 $6,111,217 7.27% 8.31%Supplier #25 $0.1726 330,142 $0.0528 6.08% $8,097,116 -$231,530 $7,865,586 8.35% 2.05%Supplier #60 $0.1634 290,972 $0.0440 5.36% $6,683,700 -$440,653 $6,243,047 6.89% 3.90%Supplier #22 $0.1453 275,503 $0.0325 5.08% $5,164,957 -$133,707 $5,031,249 5.32% 1.18%Supplier #41 $0.1475 263,443 $0.0394 4.85% $6,079,749 -$297,011 $5,782,738 6.27% 2.63%Supplier #12 $0.1597 244,713 $0.0412 4.51% $4,688,555 -$149,885 $4,538,670 4.83% 1.33%Supplier #43 $0.1431 225,583 $0.0311 4.16% $3,872,939 -$191,290 $3,681,648 3.99% 1.70%Supplier #32 $0.1429 221,178 $0.0242 4.08% $3,463,834 -$163,803 $3,300,031 3.57% 1.45%
Total associated with top 10 3,255,632 60% 59,496,651$ (6,109,275)$ 53,387,376$ 61% 54%
Are Residential Consumers Benefiting from Electric Supply Competition? Massachusetts 2021 Update
Prepared for the Massachusetts Attorney General’s Office
12
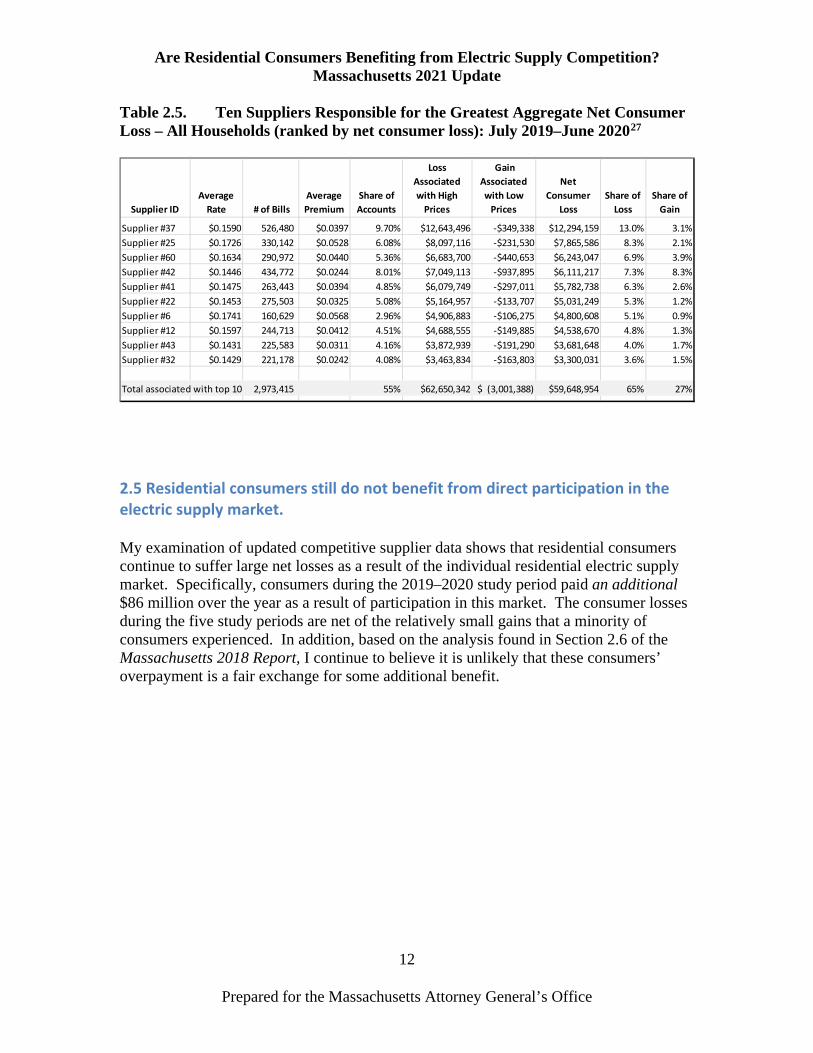
Table 2.5. Ten Suppliers Responsible for the Greatest Aggregate Net Consumer Loss – All Households (ranked by net consumer loss): July 2019–June 202027
2.5 Residential consumers still do not benefit from direct participation in the electric supply market. My examination of updated competitive supplier data shows that residential consumers continue to suffer large net losses as a result of the individual residential electric supply market. Specifically, consumers during the 2019–2020 study period paid an additional $86 million over the year as a result of participation in this market. The consumer losses during the five study periods are net of the relatively small gains that a minority of consumers experienced. In addition, based on the analysis found in Section 2.6 of the Massachusetts 2018 Report, I continue to believe it is unlikely that these consumers’ overpayment is a fair exchange for some additional benefit.
Supplier IDAverage
Rate # of Bills Average Premium
Share of Accounts
Loss Associated with High
Prices
Gain Associated with Low
Prices
Net Consumer
LossShare of
LossShare of
Gain
Supplier #37 $0.1590 526,480 $0.0397 9.70% $12,643,496 -$349,338 $12,294,159 13.0% 3.1%Supplier #25 $0.1726 330,142 $0.0528 6.08% $8,097,116 -$231,530 $7,865,586 8.3% 2.1%Supplier #60 $0.1634 290,972 $0.0440 5.36% $6,683,700 -$440,653 $6,243,047 6.9% 3.9%Supplier #42 $0.1446 434,772 $0.0244 8.01% $7,049,113 -$937,895 $6,111,217 7.3% 8.3%Supplier #41 $0.1475 263,443 $0.0394 4.85% $6,079,749 -$297,011 $5,782,738 6.3% 2.6%Supplier #22 $0.1453 275,503 $0.0325 5.08% $5,164,957 -$133,707 $5,031,249 5.3% 1.2%Supplier #6 $0.1741 160,629 $0.0568 2.96% $4,906,883 -$106,275 $4,800,608 5.1% 0.9%Supplier #12 $0.1597 244,713 $0.0412 4.51% $4,688,555 -$149,885 $4,538,670 4.8% 1.3%Supplier #43 $0.1431 225,583 $0.0311 4.16% $3,872,939 -$191,290 $3,681,648 4.0% 1.7%Supplier #32 $0.1429 221,178 $0.0242 4.08% $3,463,834 -$163,803 $3,300,031 3.6% 1.5%
Total associated with top 10 2,973,415 55% $62,650,342 (3,001,388)$ $59,648,954 65% 27%

Are Residential Consumers Benefiting from Electric Supply Competition? Massachusetts 2021 Update
Prepared for the Massachusetts Attorney General’s Office
13
3. What is the consumer loss associated with low-income households’ participation in the individual residential electric supply market? 3.1 Introduction Section 2 discussed my findings regarding the individual residential electric supply market as a whole. In this section, I discuss various attributes of a subset of this market, specifically households that receive a low-income rate from their electric companies. I analyzed suppliers’ billing data to (1) quantify the consumer loss (or gain) associated with the participation by low-income households in the individual residential electric supply market in Massachusetts; (2) compare average rates charged to low-income customers with those charged non-low-income residential consumers; and (3) assess whether there is any evidence of competitive suppliers targeting low-income households. Appendix 3A includes detailed supplier-specific information for low-income customers who are served by competitive suppliers. As I demonstrate in Section 3.2, below, living in low-income communities increases the probability of participation in the over-priced individual residential electric supply market, and also increases the size of the premium for such participation, an association also identified and discussed in the Massachusetts 2018 Report and Massachusetts 2019 Update.28
3.2 What is the consumer loss associated with low-income households’ participation in the individual residential electric supply market? The annual consumer loss associated with competitive suppliers’ charges to, on average, 84,291 low-income customers was $17 million during the 2019–2020 study period. Expressed on a per-household basis, the annual loss was $205 (in comparison with $196 in the 2018–2019 study period, $166 in the 2017–2018 study period, $231 in the 2016–2017 study period and $145 in the 2015–2016 study period). Individual consumers’ experiences vary widely. The average annual net loss for the approximately 10 percent of low-income customers served by the supplier that served the highest number of low-income customers and that accounted for the highest percentage of total net consumer low-income loss (Supplier #37) was $280. The average annual net loss for the consumers served by Supplier #24 (which served the highest premium to low-income customers) was $387, and that supplier served just under one percent of all low-income customers. Moreover, these losses are averaged across each of the suppliers’ customer base and so individual consumers’ losses could be higher.

Are Residential Consumers Benefiting from Electric Supply Competition? Massachusetts 2021 Update
Prepared for the Massachusetts Attorney General’s Office
14
3.3 What is the consumer harm to low-income households that purchase electricity directly from competitive suppliers? Massachusetts low-income households, on average, paid significantly more directly to competitive suppliers than if they had taken service from their respective electric companies. Specifically, low-income customers paid an average premium of $0.0334 per kWh over what they would have paid for basic service electric supply during the 2019–2020 study period, an eight percent increase relative to the premium of $0.0309 per kWh paid by low-income customers during the 2018–2019 study period. Moreover, the average premium that low-income customers paid for competitive service was 24 percent higher than the average premium that non-low-income customers paid during the same period (non-low-income customers paid a premium of “only” $0.0270 per kWh).29 Across all incomes, the average premium was $0.0281 per kWh. Accordingly, low-income households pay an extra 24 percent to participate in the individual residential electric supply market relative to other households. These higher rates translate, on an annual basis (assuming an average annual kWh usage of 600), to an average premium of $241 for low-income customers to participate in the individual residential electric supply market as compared to an average annual premium of $194 for non-low-income customers.30 Notably, this premium reflects those who saved money as well as those who were charged rates higher than those that the electric companies would have charged for basic service. Of the 34 suppliers which, on average, each served more than 100 low-income customers during the entire 12-month period (meaning that more than 1,200 bills were rendered to low-income customers on each supplier’s behalf),31 only one supplier provided its low-income customers with net gains on average (Supplier #34). This supplier served four percent of low-income customers served by individual residential suppliers in Massachusetts, and the average annual gain was only $33.66. Among suppliers serving at least 100 low-income customers over all 12 months of the study period, 26 individual residential suppliers had average markups (rates above what consumers would have paid for basic service) greater than $0.02/kWh, a premium that corresponds to a $10.20 loss per monthly bill at the typical monthly usage for low-income customers of 510 kWh. Of that group, 20 suppliers (over half) charged low-income customers rates over $0.03/kWh, on average, in excess of the basic service rate in effect at the time. Eleven suppliers charged low-income customers, on average, rates over $0.04/kWh in excess of the basic service rate in effect at the time. Four suppliers charged premiums over $0.05/kWh and two suppliers charged premiums over $0.06/kWh, on average, in excess of the basic service rate in effect at the time. The number of suppliers charging low-income customers high rates far exceeds the number of suppliers who save consumers money. Among the 34 suppliers that served an average of more than 100 low-income customers, 29 suppliers (approximately 85 percent) had average rates at least $0.01/kWh over the basic service rates charged by the

Are Residential Consumers Benefiting from Electric Supply Competition? Massachusetts 2021 Update
Prepared for the Massachusetts Attorney General’s Office
15
electric companies, together serving about 78,704 low-income customers monthly (corresponding with approximately 944,450 bills rendered to low-income customers during the 12-month study period). Savings Estimates As described in Section 2.3, above, most suppliers in the individual residential electric supply market did not provide savings on average to residential households during the study periods. The suppliers who did provide savings provided savings that were relatively insignificant as compared to the massive losses inflicted by a majority of suppliers. The same dynamic also holds true for low-income households specifically. Approximately one in six low-income bills are associated with rates per kWh that were lower than the corresponding electric company rates for the same time period. As seen in further detail in Appendix 3A, during the course of the 12-month period between July 2019 and June 2020, low-income customers suffered a total net loss of approximately $17 million.32 A minority of suppliers—whose customers represent only 4.4 percent of the total supplier low-income customer base—provided net savings to their customers (compared with 9.2 percent for all residential customers of suppliers, as described in Section 2 above), collectively $133,387 in net savings.33 Meanwhile, a majority of suppliers—whose customers represent approximately 95.6 percent of the total supplier low-income customer base—provided net losses, collectively, of $17,393,927 to their customers. Moreover, the net savings associated with electricity supplied by the minority of suppliers was small. The average gain per consumer, expressed on an annual basis, was $36.24 (as compared to the $215.81 loss experienced by customers of the majority of suppliers), and the average rates paid by the two groups of consumers were $0.1158 and $0.1525 per kWh.
3.4 Low-income customers are overrepresented in the individual residential electric supply market. My analysis demonstrates that low-income households continue to be overrepresented in the individual residential electric supply market relative to their representation in the general population of households receiving electricity. Low-income households represent only 11 percent of all electric consumers. However, according to data received from the electric companies, low-income households represented 19 percent of all customers who participated in the individual residential electric supply market during the 2019–2020 study period. This measure changed only slightly from the prior study year (2018–2019), when the corresponding numbers were 11 percent and 20 percent.
Are Residential Consumers Benefiting from Electric Supply Competition? Massachusetts 2021 Update
Prepared for the Massachusetts Attorney General’s Office
16
The electric companies’ data also shows that 31 percent—almost a third of all Massachusetts low-income households—participated in the individual residential electric supply market (the remaining 69 percent received basic service or participated in a municipal aggregation) during the 2019–2020 study period. By contrast, only 17 percent of Massachusetts non-low-income households participated in the individual residential electric supply market—approximately half of the participation rate of low-income households. These results are substantially similar to the pattern shown in the study periods covered by my first report and its update. Although, on average, both low-income and non-low-income customers suffer harm as a result of the individual residential electric supply market, my analysis suggests that the individual residential electric supply market has a disproportionate impact on low-income customers. As discussed above, during the 2019–2020 study period, low-income households paid a premium of 24 percent relative to other households. Section 3.5, below, analyzes other demographic aspects of the individual residential electric supply market.
3.5 Potential targeting of vulnerable communities. I also examined whether the electric companies’ billing data provides demographic evidence that competitive suppliers may have targeted certain demographic populations in Massachusetts. I examined data at the geographically granular level34 corresponding with Massachusetts’ zip codes,35 paying special attention to demographics such as the percent designated as minority,36 and the median income. As part of my analyses of various demographic characteristics, I also assessed participation rates by (1) all households; (2) low-income households;37 and (3) non-low-income households. Also, because the participation rate in municipalities that are served by municipal aggregation suppliers is approximately the same as that in municipalities without municipal aggregations,38 I included those towns as well (excluding from my analysis those consumers served by municipal aggregation suppliers). I found that participation rates are significantly higher in areas with certain demographics and thus consumer harm is occurring disproportionately among these populations. Specifically, as is shown in Appendix 3B and Appendix 3C respectively, communities with majority-minority populations and with low median incomes correlate with higher rates of participation in the individual residential market for electric supply. Conversely, Appendix 3D shows that communities with higher median incomes tended to have significantly lower participation rates than more economically disadvantaged communities. Appendix 3B shows that, regardless of a household’s income, participation rates in communities of color are significantly higher than in the rest of the Commonwealth. Moreover, the premiums paid by residents in these communities who are served by

Are Residential Consumers Benefiting from Electric Supply Competition? Massachusetts 2021 Update
Prepared for the Massachusetts Attorney General’s Office
17
competitive suppliers is greater than in other areas of Massachusetts. Therefore, these communities of color are harmed not only as a result of disproportionately higher levels of participation in the individual residential market for electric supply, but also as a result of paying larger premiums for their participation. These results are consistent with the results that I discussed in the Massachusetts 2018 Report and the Massachusetts 2019 Update. They are also consistent with my analysis of data for the time period spanning July 2018 to June 2019. Table 3.1, below, summarizes the information that is provided on a community-specific basis in Appendix 3B (the Commonwealth’s majority-minority communities), Appendix 3C (the Commonwealth’s poorest communities), and Appendix 3D (the Commonwealth’s most affluent communities). Table 3.1. Participation Rates and Premiums Paid Based on Communities’ Demographics (September 2019)39
Another way to consider community harm is to compute the aggregate municipal loss (realizing that, among other things, population affects the magnitude of the harm). Table 3.2 below shows the ten municipalities and neighborhoods with the highest aggregate net consumer monthly loss.
Premium
Communities vs. Rest of State AllLow-
IncomeNon-Low-
IncomeAll
Majority-Minority 27% 39% 23% 0.0375$ Rest of State 17% 28% 16% 0.0338$
Bottom 20 Median Incomes 28% 39% 23% 0.0387$ Rest of State 18% 30% 17% 0.0343$
Top 20 Median Incomes 13% 17% 13% 0.0212$ Rest of State 19% 32% 17% 0.0349$
Participation
Are Residential Consumers Benefiting from Electric Supply Competition? Massachusetts 2021 Update
Prepared for the Massachusetts Attorney General’s Office
18
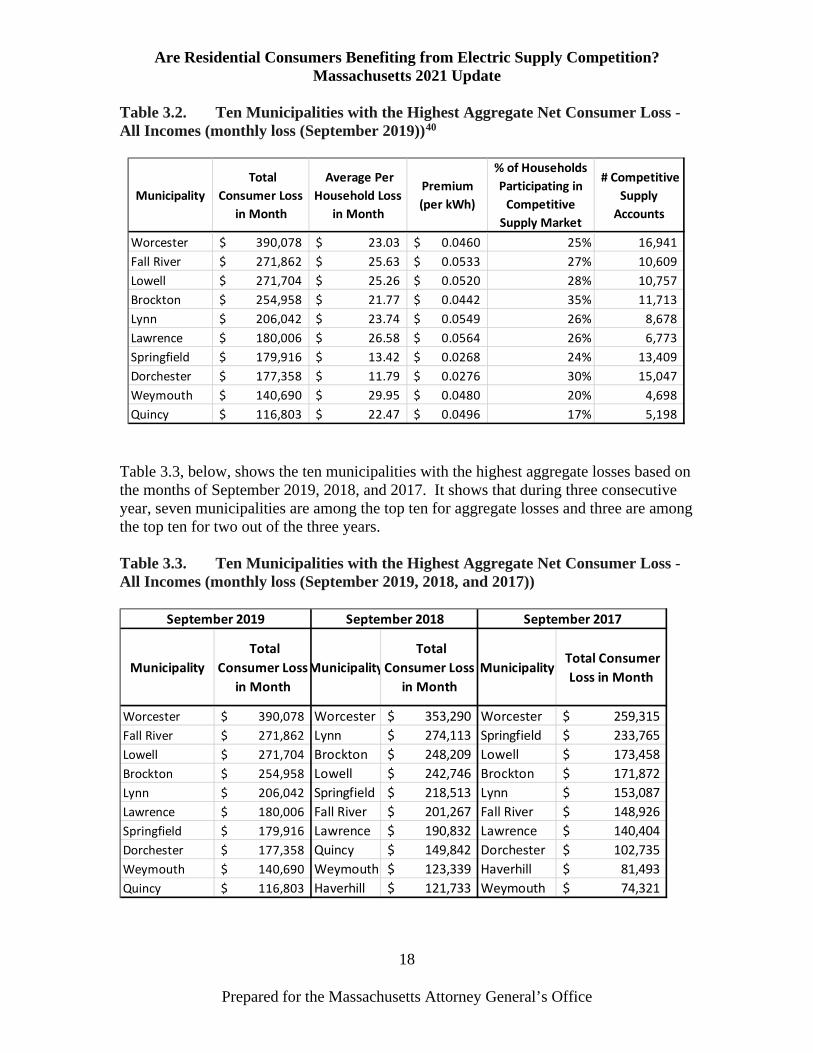
Table 3.2. Ten Municipalities with the Highest Aggregate Net Consumer Loss - All Incomes (monthly loss (September 2019))40
Table 3.3, below, shows the ten municipalities with the highest aggregate losses based on the months of September 2019, 2018, and 2017. It shows that during three consecutive year, seven municipalities are among the top ten for aggregate losses and three are among the top ten for two out of the three years. Table 3.3. Ten Municipalities with the Highest Aggregate Net Consumer Loss - All Incomes (monthly loss (September 2019, 2018, and 2017))
Municipality Total
Consumer Loss in Month
Average Per Household Loss
in Month
Premium (per kWh)
% of Households Participating in
Competitive Supply Market
# Competitive Supply
Accounts
Worcester 390,078$ 23.03$ 0.0460$ 25% 16,941 Fall River 271,862$ 25.63$ 0.0533$ 27% 10,609 Lowell 271,704$ 25.26$ 0.0520$ 28% 10,757 Brockton 254,958$ 21.77$ 0.0442$ 35% 11,713 Lynn 206,042$ 23.74$ 0.0549$ 26% 8,678 Lawrence 180,006$ 26.58$ 0.0564$ 26% 6,773 Springfield 179,916$ 13.42$ 0.0268$ 24% 13,409 Dorchester 177,358$ 11.79$ 0.0276$ 30% 15,047 Weymouth 140,690$ 29.95$ 0.0480$ 20% 4,698 Quincy 116,803$ 22.47$ 0.0496$ 17% 5,198
Municipality Total
Consumer Loss in Month
Municipality Total
Consumer Loss in Month
Municipality Total Consumer
Loss in Month
Worcester 390,078$ Worcester 353,290$ Worcester 259,315$ Fall River 271,862$ Lynn 274,113$ Springfield 233,765$ Lowell 271,704$ Brockton 248,209$ Lowell 173,458$ Brockton 254,958$ Lowell 242,746$ Brockton 171,872$ Lynn 206,042$ Springfield 218,513$ Lynn 153,087$ Lawrence 180,006$ Fall River 201,267$ Fall River 148,926$ Springfield 179,916$ Lawrence 190,832$ Lawrence 140,404$ Dorchester 177,358$ Quincy 149,842$ Dorchester 102,735$ Weymouth 140,690$ Weymouth 123,339$ Haverhill 81,493$ Quincy 116,803$ Haverhill 121,733$ Weymouth 74,321$
September 2019 September 2018 September 2017

Are Residential Consumers Benefiting from Electric Supply Competition? Massachusetts 2021 Update
Prepared for the Massachusetts Attorney General’s Office
19
My analysis, shown in Appendix 2B (All Households) shows that, viewed on a municipality-by-municipality basis, in September 201941 in all but two of the Commonwealth’s towns and cities that were open to competition, residents who were served by a residential electric supplier experienced a net consumer loss. In those two towns, a total of 23 customers saved, in aggregate $14 in September 2019. Similarly, Appendix 2C (Low-Income Households) shows that among the 395 municipalities where low-income households purchased from competitive suppliers, all but ten of those municipalities show net aggregate losses for low-income households.42
3.6 Statistical analysis shows negative correlation between income and participation. Participation rates in the individual residential electric supply market vary substantially across Massachusetts. Following my previous years’ analysis, I re-examined whether any observable characteristics of individual zip codes predict participation rates with statistical significance. Previous findings Using zip code-level data from June 2017 and June 2018, I found a negative relationship between a zip code’s typical income level—as measured by either median household income, or the proportion of all accounts that are non-low-income—and its participation in the individual residential electric supply market. In other words, neighborhoods with lower incomes tend to have higher rates of participation in the individual residential electric supply market among both low-income customers and all other consumers. These findings are described in the Massachusetts 2018 Report and in the Massachusetts 2019 Update. Approach Individual residential electric supply market participation rates are defined as the number of accounts billed by competitive suppliers (excluding suppliers serving municipal aggregations) divided by the total number of residential accounts, and correspondingly for just the subset of low-income accounts. The approach replicates the previous analyses, using updated zip code- and municipality-specific participation rates from September 2019 data. I considered socio-demographic characteristics of zip codes as possible predictors of participation rates. For each zip code, the median household income approximates the income of a typical consumer. An additional indicator for neighborhood affluence is the share of all electric accounts that are identified by the electric company as low-income. In general, more affluent neighborhoods have higher median incomes and lower shares of low-income accounts. Zip code-level variation in minority residents (households identifying as non-white and/or Hispanic) was also considered.

Are Residential Consumers Benefiting from Electric Supply Competition? Massachusetts 2021 Update
Prepared for the Massachusetts Attorney General’s Office
20
Findings Using September 2019 data, I found no substantive change from prior years’ analyses. There continues to be a positive (the correlation coefficient, r, is 0.61)43 and statistically significant (the p-value is less than <0.05) association of lower household incomes with higher market participation rates across all households. That is, on average, households in zip codes with higher proportions of low-income households tend to participate more in the individual residential electric supply market. Additionally, unlike in my analysis of June 2017 and June 2018 data, the magnitude of the higher rates charged in the individual residential electric supply market in September 2019 is positively associated (the correlation coefficient is 0.20 and the p-value is <0.05) with the proportion of lower income households in the zip code, again with statistical significance.44 That is, households in zip codes with more low-income customers tend not just to be more likely to purchase from the individual residential electric supply market, they also pay higher rates for each kWh purchased there, relative to households in zip codes with fewer low-income customers. The correlation between low-income status and participation rates and high supply rates is not necessarily causal; the data do not allow us to determine what causes consumers to enter the individual residential electric supply market nor why the magnitude of markups in the individual residential electric supply market varies across the state. However, it merits investigation because the observed and persistent pattern is consistent with suppliers targeting economically disadvantaged areas for marketing and advertising, which may drive higher sign-ups. Figure 3.1, below, is a scatter plot showing how zip codes with greater shares of low-income households tend to also have higher rates of participation in the individual residential electric supply market within Boston, Springfield, and Worcester.45

Are Residential Consumers Benefiting from Electric Supply Competition? Massachusetts 2021 Update
Prepared for the Massachusetts Attorney General’s Office
21
Figure 3.1 Boston, Springfield, and Worcester Zip Codes by Share of Low-Income Customers and Rate of Participation in the Individual Residential Electric Supply Market (September 2019)
3.7 Consumer loss examined at the supplier level I also computed net loss and average premiums for low-income customers separately by each of the suppliers that serve them.46 I analyzed various attributes of the competitive suppliers serving low-income households: their average premiums (weighted by usage), the number and percent of bills associated with each supplier, and the amount and percent of consumer loss (or gain) associated with each supplier.47 Table 3.4 below shows the ten suppliers (with their identities concealed) that charged the highest premiums to low-income households during the 2019–2020 study period. One supplier charged a premium of almost $0.07 per kWh; two suppliers in total charged a premium of more than $0.06; three other suppliers charged premiums above $0.05 per kWh and the other five charged premiums above $0.04 per kWh to low-income households.

Are Residential Consumers Benefiting from Electric Supply Competition? Massachusetts 2021 Update
Prepared for the Massachusetts Attorney General’s Office
22
Table 3.4. Ten Suppliers with the Highest Average Premium – Low-Income Households (ranked by premium) – July 2019–June 2020
Table 3.5 below shows the ten suppliers for which electric companies rendered the most bills to low-income households. These ten suppliers account for 60 percent of the bills rendered in the individual low-income residential electric supply market, and viewed separately, each of them charges prices that lead to an aggregate net consumer loss for their customers. Table 3.5. Ten Suppliers with the Highest Number of Bills – Low-Income Households (ranked by number of bills) – July 2019–June 2020
Table 3.6 below shows the ten suppliers responsible for the largest absolute net low-income consumer loss in Massachusetts. Almost one in five low-income households are served by the top two suppliers (one in three low-income households are served by the top five suppliers).
Supplier IDAverage
Rate # of Bills
Average Premium
Share of Accounts
Loss Associated with High
Prices
Gain Associated with Low
Prices
Net Consumer
Loss
Share of Loss
Share of Gain
Supplier #15 $0.1857 23,323 $0.0687 2.31% $706,542 -$4,207 $702,335 3.8% 0.3%Supplier #24 $0.1741 9,870 $0.0621 0.98% $312,553 -$8,424 $304,129 1.7% 0.6%Supplier #6 $0.1753 36,348 $0.0577 3.59% $1,082,204 -$17,458 $1,064,745 5.8% 1.3%Supplier #39 $0.1742 3,447 $0.0569 0.34% $98,457 -$575 $97,882 0.5% 0.0%Supplier #1 $0.1692 1,136 $0.0532 0.11% $32,955 -$674 $32,281 0.2% 0.1%Supplier #60 $0.1692 117,072 $0.0498 11.57% $2,963,755 -$112,376 $2,851,380 16.0% 8.6%Supplier #57 $0.1650 11,894 $0.0455 1.18% $270,832 -$3,128 $267,704 1.5% 0.2%Supplier #48 $0.1601 4,473 $0.0444 0.44% $98,317 -$107 $98,210 0.5% 0.0%Supplier #35 $0.1636 15,532 $0.0442 1.54% $371,201 -$2,288 $368,913 2.0% 0.2%Supplier #12 $0.1612 66,885 $0.0439 6.61% $1,348,136 -$15,504 $1,332,632 7.3% 1.2%
Total associated with top 10 289,980 29% $7,284,952 -$164,742 $7,120,210 39% 13%
Supplier IDAverage
Rate # of Bills
Average Premium
Share of Accounts
Loss Associated with High
Prices
Gain Associated with Low
Prices
Net Consumer
Loss
Share of Loss
Share of Gain
Supplier #60 $0.1692 117,072 $0.0498 11.57% $2,963,755 -$112,376 $2,851,380 16.0% 8.6%Supplier #12 $0.1612 66,885 $0.0439 6.61% $1,348,136 -$15,504 $1,332,632 7.3% 1.2%Supplier #37 $0.1536 63,553 $0.0331 6.28% $1,280,877 -$66,676 $1,214,200 6.9% 5.1%Supplier #42 $0.1505 62,766 $0.0304 6.21% $1,156,659 -$108,178 $1,048,480 6.2% 8.2%Supplier #43 $0.1474 57,227 $0.0365 5.66% $1,098,398 -$17,915 $1,080,483 5.9% 1.4%Supplier #22 $0.1394 56,077 $0.0261 5.54% $865,669 -$49,096 $816,573 4.7% 3.7%Supplier #41 $0.1475 48,160 $0.0405 4.76% $1,051,651 -$41,714 $1,009,937 5.7% 3.2%Supplier #27 $0.1322 47,573 $0.0143 4.70% $463,216 -$114,446 $348,771 2.5% 8.7%Supplier #25 $0.1425 44,120 $0.0219 4.36% $464,584 -$52,865 $411,719 2.5% 4.0%Supplier #4 $0.1552 42,083 $0.0380 4.16% $758,925 -$35,106 $723,818 4.1% 2.7%
Total associated with top 10 605,516 60% 11,451,869$ (613,876)$ 10,837,993$ 62% 47%

Are Residential Consumers Benefiting from Electric Supply Competition? Massachusetts 2021 Update
Prepared for the Massachusetts Attorney General’s Office
23
Table 3.6. Ten Suppliers Responsible for the Greatest Aggregate Net Consumer Loss – Low-Income Households (ranked by net consumer loss) – July 2019–June 2020
3.8 Conclusions about the Massachusetts low-income market Based on my examination of supplier data, I found that, on average, 84,291 Massachusetts low-income households paid $17 million more during the July 2019 – June 2020 study period than they would have paid if they had not contracted with competitive suppliers and instead paid the electric company’s fixed basic service rates. The average low-income household purchasing from the individual residential electric supply market lost $205 over the course of the year (a five percent increase relative to the average loss per low-income household in the prior study year). The evidence of harm to low-income households is overwhelming—their participation rate is almost double that of non-low-income households, and suppliers, on average, charge low-income households higher rates than non-low-income households. Moreover, these findings are consistent with findings by the Connecticut Public Utilities Regulatory Authority (“PURA”). On December 18, 2019, the PURA issued a decision that found that, over a two-year study period, hardship customers contracting with a supplier not only paid more than standard service, but they paid 69 percent more than non-hardship customers contracting with a supplier.48
Supplier IDAverage
Rate # of Bills
Average Premium
Share of Accounts
Loss Associated with High
Prices
Gain Associated with Low
Prices
Net Consumer
Loss
Share of Loss
Share of Gain
Supplier #60 $0.1692 117,072 $0.0498 11.57% $2,963,755 -$112,376 $2,851,380 16.0% 8.6%Supplier #12 $0.1612 66,885 $0.0439 6.61% $1,348,136 -$15,504 $1,332,632 7.3% 1.2%Supplier #37 $0.1536 63,553 $0.0331 6.28% $1,280,877 -$66,676 $1,214,200 6.9% 5.1%Supplier #43 $0.1474 57,227 $0.0365 5.66% $1,098,398 -$17,915 $1,080,483 5.9% 1.4%Supplier #6 $0.1753 36,348 $0.0577 3.59% $1,082,204 -$17,458 $1,064,745 5.8% 1.3%Supplier #42 $0.1505 62,766 $0.0304 6.21% $1,156,659 -$108,178 $1,048,480 6.2% 8.2%Supplier #41 $0.1475 48,160 $0.0405 4.76% $1,051,651 -$41,714 $1,009,937 5.7% 3.2%Supplier #22 $0.1394 56,077 $0.0261 5.54% $865,669 -$49,096 $816,573 4.7% 3.7%Supplier #66 $0.1599 36,911 $0.0437 3.65% $799,093 -$10,036 $789,058 4.3% 0.8%Supplier #4 $0.1552 42,083 $0.0380 4.16% $758,925 -$35,106 $723,818 4.1% 2.7%
Total associated with top 10 587,082 58% 12,405,366$ (474,060)$ 11,931,307$ 67% 36%

Are Residential Consumers Benefiting from Electric Supply Competition? Massachusetts 2021 Update
Prepared for the Massachusetts Attorney General’s Office
24
4. Conclusion The updated data analyzed in this report show that Massachusetts residential consumers continue to lose tens of millions of dollars per year buying electric supply directly from competitive suppliers; low-income customers continue to be disproportionately affected; and communities with low median incomes and high percentages of minority households continue to be charged higher rates than more affluent communities.
Endnotes
1 https://www.mass.gov/doc/fy-2021-liheap-income-eligibility-and-benefit-level-chart-updated-december 2020/download 2 Other terms that are used in other states include “energy service companies,” “third-party suppliers,” and “alternative retail energy suppliers.” 3 “Are Consumers Benefiting from Competition? An Analysis of the Individual Residential Electric Supply Market in Massachusetts,” Susan M. Baldwin, prepared for the Massachusetts Attorney General’s Office, March 29, 2018 (“Massachusetts 2018 Report”). 4 “Are Consumers Benefiting from Competition? An Analysis of the Individual Residential Electric Supply Market in Massachusetts: August 2019 Update,” Susan M. Baldwin, prepared for the Massachusetts Attorney General’s Office, August 1, 2019 (“Massachusetts 2019 Update”). 5 Timothy E. Howington, who has been active in utility regulation since 2003, contributed to this report. See Exhibit ES1 Update for Ms. Baldwin’s experience and qualifications. 6 Except where otherwise noted, I refer to results from the most recent time period (July 2019 through June 2020). 7 Participation of low-income customers in the competitive supply market has mostly remained constant in the two one-year periods covered by this update. (During the 12-month period ending June 2018, 35 percent of low-income customers participated in the individual residential electric supply market in comparison with 18 percent of non-low-income customers. During the 12-month period ending June 2019, 33 percent of low-income customers participated in the individual residential electric supply market in comparison with 17 percent of non-low-income customers.) Moreover, because the utilities’ billing data captures only those consumers who participate in energy assistance programs, these participation rates do not reflect the participation by low-income households who may qualify for but not participate in energy assistance programs. 8 Based on the actual billing data, the average usage for low-income customers was 510 kWh per month and it was 574 kWh per month for non-low-income customers. Prior year numbers, i.e., for the 12-month period spanning July 2018 to June 2019, were 527 kWh per month (low-income customers) and 602 kWh (non-low-income customers). 9 The consumer loss for low-income customers in the prior year was twenty percent higher than that for non-low-income participants (similarly assuming the same kWh usage across income groups). 10 Actual consumer losses depend on consumers’ usage, their choice of supplier, and the rate that the supplier charges (individual suppliers charge a wide range of rates to their various consumers). 11 The Massachusetts 2021 Update analyzes September zip code-level data in 2018 and in 2019 in lieu of the June zip code-level data used in the Massachusetts 2018 Report and Massachusetts 2019 Update. The month of a September provides a good basis to compare supplier charges across municipalities. Both Eversource and National Grid have their summer basic service rates in effect in September. My analysis

Are Residential Consumers Benefiting from Electric Supply Competition? Massachusetts 2021 Update
Prepared for the Massachusetts Attorney General’s Office
25
shows that, in September 2018, in 98 percent of the Commonwealth’s towns and cities that were open to competition, residents who had signed up directly with a supplier experienced net consumer loss. 12 My updated analyses of communities appear herein as follows: majority-minority (meaning the majority of the households in these communities are minority households) in Appendix 3B; lowest median income in Appendix 3C; and highest median income in Appendix 3D. I include results separately for each of the two study periods encompassed by this report: September 2018 and September 2019. The analyses contained in these appendices provide ample evidence of disparate participation by the Commonwealth’s most vulnerable populations in the individual residential electric supply market. I did not update the analysis that is included in the Massachusetts 2018 Report regarding participation levels and premiums paid in communities with relatively higher percentages of Blacks, Hispanics, limited English proficiency and participation in low-income programs. I have no reason to believe, however, that if these analyses were updated, the pattern would differ from that described in my Massachusetts 2018 Report, especially because of the high overlap between these demographics and the demographics that I did analyze in this update. 13 The lone exception is that this report uses the month of September, rather than June, to compare the customer losses on a municipality-by-municipality basis and to analyze participation for the communities that have the highest median income, the lowest median income, and that are majority-minority. 14 Although three electric companies serve Massachusetts, the billing data correspond with five non-overlapping territories because some mergers within the industry retained the separate billing of the acquired utilities. 15 The electric companies’ monthly billing data show separately for each supplier (and for the most recent three 12-month periods, the electric companies provided information separately for each of the different rates that the supplier charged its consumer base during the month): the number of bills rendered, the total amount charged, and the total kWh associated with each distinct rate. I was able to isolate those bills with charges greater than if the usage had been billed at electric company rates from those bills with charges less than if the usage had been billed at electric company rates. 16 All data in the bulleted list below is based on the 2019–2020 study period unless otherwise noted, and it can be compared with the corresponding data for the 2016–2017 study period in the Massachusetts 2018 Report and the 2017–2018 study period in the Massachusetts 2019 Update. See Table 2.2 for many corresponding statistics for July 2018–June 2019. 17 The 5,427,350 bills correspond with the total number of bills rendered over a 12-month period to residential customers of all incomes. Assuming that a customer receives 12 bills each year results in an estimated average of at least 452,279 customers participating (5,427,350 divided by 12). Some customers may discontinue service with a supplier during the 12-month study period and other customers may sign up at some point during that time period—that is, customers come and go. Therefore, it is likely that more than 452,279 different customers participated during the study period, and that some percentage of customers participated for only part of the study period. EDCs are able to separately identify the bills they render on behalf of low-income customers, and the estimate of 84,291 low-income customers was computed similarly (based on total bills rendered to low-income customers during the same period), with the same caveat that the actual number could be higher if some customers exited the market and different customers entered the market during the 12-month study period. 18 Low-income households can apply for reduced electricity distribution rates. Eligibility for the discount rates is based upon verification of a low-income consumer’s receipt of any means-tested public benefit, or verification of eligibility for the low-income home energy assistance program (“LIHEAP”) or its successor program, for which eligibility does not exceed 60 percent of the state median income for the size of the household. G.L. c. 164, § 1F(4); https://www.mass.gov/files/documents/2019/10/25/FY20LIHEAPEligibility.pdf..https://www.mass.gov/doc/fy-2021-liheap-income-eligibility-and-benefit-level-chart-updated-december-2020/download. Thus, “any household that receives help from an income-tested government assistance program—whether SNAP (Food

Are Residential Consumers Benefiting from Electric Supply Competition? Massachusetts 2021 Update
Prepared for the Massachusetts Attorney General’s Office
26
Stamps), public housing, Medicaid, free school lunch, etc.—and whose income is at or below 60 percent of median income qualifies for the discount rates.” Charlie Harak, Jenifer Bosco and Ana Girón Vives, Utility Advocacy for Low-Income Households in Massachusetts (National Consumer Law Center 4th ed. 2019), available at https://www.nclc.org/images/pdf/energy_utility_telecom/stay%20connected/stay-connected-handbook.pdf The low-income rate provides a discount of approximately 25 percent to 36 percent off the entire electric bill, which includes both distribution and supply charges. See https://www.eversource.com/Content/docs/default-source/rates-tariffs/ema-greater-boston-rates.pdf?sfvrsn=10; https://www9.nationalgridus.com/masselectric/home/rates/4_res.asp; https://unitil.com/energy-for-residents/electric-information/assistance-programs. The electricity consumption for income-qualified households is billed at distribution rates that are lower than distribution rates for other residential consumers. However, as described above, they receive a subsidy calculated as a percentage of the consumer’s total bill. The consumer’s total bill includes the consumer’s supply charge, regardless of whether the consumer receives basic service or competitive supply. 19 Because, in some instances, the electric companies’ billing records show slightly different spellings of suppliers’ names, I had to make assumptions about whether similar, but not identical, names likely corresponded with the same supplier. As a general rule, if the first five letters were the same, I treated the suppliers as the same. 20 Average monthly usage among low-income households participating in the individual residential electric supply market is 510 kWh in comparison with average monthly usage of 574 kWh among non-low-income households—this difference affects the calculation of annual average per-household losses for the two groups. In Figure ES.2, I assume monthly usage of 600 kWh for both low-income and non-low-income households to illustrate the effect of the differential premium more accurately. 21 The Massachusetts 2021 Update analyzes September zip code-level data in lieu of the June zip code-level data used in the Massachusetts 2018 Report and Massachusetts 2019 Update. The month of September provides a good basis to compare supplier charges across municipalities. Both Eversource and National Grid have their summer basic service rates in effect in September. 22 The electric company basic service rate shown is a statewide average computed based on the customers’ actual usage and the rates that their respective electric companies would have charged in each of the months for that usage. 23 This finding is consistent with the 12-month period between July 2018 and June 2019, when suppliers provided savings of $13,043,992, which were offset by losses of $100,038,116 during the same time period, for a total net loss of $86,994,123. 24 The numbers for the July 2018 – June 2019 study period are similar to those of the July 2019 – June 2020 study period. During the July 2018 – June 2019 period, the average annual gain per consumer was $60.54, and the average rate (weighted by kWh) paid by this group of consumers was $0.1148 per kWh. By comparison, the average annual loss per consumer (for the approximate 98 percent of the total supplier customer base who experienced net losses) was $192.57, and the average rate paid by this group of consumers was $0.1486 per kWh. 25Appendix 2D provides complete information for all suppliers for which electric companies rendered bills to residential consumers between July 2019 and June 2020, and also separately for bills rendered to residential consumers between July 2018 and June 2019. 26 See Section 3 for a parallel analysis of suppliers and low-income households. 27 I do not disclose the identity of the individual suppliers because suppliers in Massachusetts have kept this information confidential through agreements with the electric companies. In sharp contrast with the treatment of supplier information in Massachusetts, there is far greater transparency in Connecticut, and among other things, the Connecticut Office of Consumer Counsel (OCC) distributes an annual fact sheet

Are Residential Consumers Benefiting from Electric Supply Competition? Massachusetts 2021 Update
Prepared for the Massachusetts Attorney General’s Office
27
with supplier-specific consumer gains and losses. See “OCC Fact Sheet: Electric Supplier Market, August 2019 through July 2020,” Office of Consumer Counsel, updated on October 26, 2020, https://portal.ct.gov/-/media/OCC/Fact-sheet-electric-supplier-market-July-2020.pdf 28 For examples of low-income communities with disproportionate participation in the individual residential electric supply market, see Figure 3.1 and also Appendix 3A, which shows the 20 zip codes (and the associated municipalities) with the lowest median incomes in the Commonwealth. 29 During the 2018–2019 study period, the average premium that low-income customers paid for competitive services was 20 percent higher than the average premium that non-low-income customers paid during the same period. 30 Actual average monthly usage among low-income households participating in the individual residential electric supply market is 510 kWh in comparison with average monthly usage of 574 kWh among non-low-income households, which affects the calculation of annual average per-household losses for the two groups. 31 This analysis excludes 17 suppliers, each of which served fewer than 100 low-income customers (i.e., for which fewer than 1,200 bills were rendered during the 12-month study period) 32 Between July 2018 and June 2019, low-income customers suffered a total net loss of approximately $18 million. 33 Customers served by a single supplier — Supplier #34 — represent the vast majority (88 percent) of the low-income customers served by suppliers with net savings. 34 The electric companies provided data with rate and usage information corresponding with approximately 557,000 bills rendered on behalf of competitive suppliers during September 2019 disaggregated to the geographically granular level corresponding with zip codes. The electric companies provided comparable data for September 2018. 35 Zip code shapefiles are from MassGIS (http://www.mass.gov/anf/research-and-tech/it-serv-and-support/application-serv/office-of-geographic-information-massgis/datalayers/zipcodes.html), to which Census data at the ZCTA level was joined using a publicly available crosswalk (https://www.udsmapper.org/zcta-crosswalk.cfm). 36 Using the same data, “percent minority” was constructed as the percentage of the population who are not both White and non-Hispanic, so this group captures non-White races and/or Hispanic ethnicities. 37 For the purpose of comparing participation rates, low-income corresponds with those households receiving discounted electricity rates. For the purpose of identifying the 20 town-zip code areas with the lowest incomes, I examined municipalities’ median incomes. 38 For the July 2019–June 2020 study period, participation rates in municipalities with a municipal aggregation was 17.41 percent and participation rates in municipalities without a municipal aggregation was 19.54 percent. For the study period spanning July 2018 through June 2019, participation rates in municipalities with a municipal aggregation was 18.78 percent and participation rates in municipalities without a municipal aggregation was 20.15 percent. 39 See Appendices 3B, 3C, and 3D for community-specific information based on my analyses of zip code data for September 2019 and September 2018. The premiums in September are generally higher than the 12-month averages shown in Table 2.2 because, as Appendix 2A shows, basic service rates are relatively lower in this month than in some other months of the 12-month study period. See also Figure 2.1. 40 See Appendix 2C (All Households) and Appendix 2D (Low-Income Households) for a complete list of municipalities and associated net consumer losses. Note that the participation rates for Ashby and Lunenburg may be biased upward because the data may include some accounts that are served by

Are Residential Consumers Benefiting from Electric Supply Competition? Massachusetts 2021 Update
Prepared for the Massachusetts Attorney General’s Office
28
municipal aggregators. This potential bias does not affect the statewide results shown elsewhere in the Massachusetts 2021 Update nor the results of my demographic analyses. 41 The Massachusetts 2021 Update analyzes September zip code-level data in 2018 and in 2019 in lieu of the June zip code-level data used in the Massachusetts 2018 Report and Massachusetts 2019 Update. The month of a September provides a good basis to compare supplier charges across municipalities. Both Eversource and National Grid have their summer basic 42 This finding is consistent with my analysis of data for September 2018. See Appendix 2B and Appendix 2C, which include analyses of data in September 2018 and September 2019. 43 Analysis of September 2018 data shows a correlation coefficient, r, of 0.52. 44 The correlation coefficient for September 2018 data was 0.12. 45 The results are consistent with those shown in Figure 3.13 in the Massachusetts 2018 Report and Figure 3.1 in the Massachusetts 2019 Update. 46 See Section 2.5, above, for the corresponding analysis for all residential consumers. 47 Appendix 3A provides complete information for all suppliers for which electric companies rendered bills to low-income residential consumers during the 2019-2020 study period and the 2018–2019 study period. 48 See Review of Feasibility, Costs and Benefits of Placing Certain Customers on Standard Service Pursuant to Conn. Gen. Stat. § 16-2450(M), Connecticut Public Utilities Regulatory Authority Docket No. 18-06-02, Decision, December 18, 2019.

Are Residential Consumers Benefiting from Electric Supply Competition? 2021 Update
Prepared for the Massachusetts Attorney General’s Office
Appendix ES1
Experience and Qualifications of Susan M. Baldwin

Appendix ES1
Experience and Qualifications of Susan M. Baldwin
Susan M. Baldwin has forty-three years of experience in public policy, which includes five years analyzing solar energy and energy efficiency for local, state and regional agencies, one year analyzing low-income issues for the budget office of a state welfare agency, and, most recently, 37 years analyzing the economics and regulation of the telecommunications and energy industries. She served as the Director of the Telecommunications Division for the, Massachusetts Department of Public Utilities (which was subsequently reorganized), as a Senior Vice President for a consulting firm, and, since 2001, has been an independent consultant.
Since 2013, in addition to her ongoing contributions to state and federal telecommunications policy, Ms. Baldwin has assisted consumer advocate agencies with the customer service of electric and gas utilities and with in-depth analyses of residential and small business retail energy supply markets. In her capacity as an independent consultant, Ms. Baldwin sponsors expert testimony and reports submitted in state and federal regulatory proceedings, contributes to the policy-making by state legislatures, and writes detailed reports on telecommunications and energy policy. She has testified before 24 state public utility commissions in more than 75 regulatory proceedings as well as before five state legislative committees. She has submitted expert reports in four state taxation proceedings, and has contributed to dozens of comments and declarations filed in Federal Communications Commission proceedings.
Ms. Baldwin earned her Master of Economics from Boston University, her Master of Public Policy from the Harvard Kennedy School, and her Bachelor of Arts degree in Mathematics and English from Wellesley College.
Are Residential Consumers Benefiting from Electric Supply Competition? 2021 Update
Prepared for the Massachusetts Attorney General’s Office
Appendix 1A
Map of EDC Service Areas and Municipal Light Plant Towns

SANDISFIELD
MIDDLEFIELD
WORTHINGTON
GRANVILLE
CUMMINGTON
ROWE
ASHFIELD
WESTHAMPTON
WILLIAMSBURG
WHATELY
LEYDEN
CHICOPEE
BERNARDSTON
GRANBY
BELCHERTOWN
BROOKFIELDWEST
STURBRIDGE
TEMPLETON
FIELDBROOK-
FITCHBURG
ASHBY
LEOMINSTER
STERLING
SHREWSBURY
HARVARD
AYER
SOUTHBOROUGH
BOXBOROUGH
ASHLAND
WESTFORD
FOXBOROUGH
NORWOOD
ANDOVER
CANTON
BROOKLINE
EASTON
SOMERVILLE
FALL RIVER
RANDOLPH
CHELSEA
WEST
BOXFORD
MERRIMAC
LAKEVILLE
DANVERS
ROWLEY
HINGHAM
MARBLEHEAD
MARSHFIELD
GLOUCESTER
HANCOCK
MONTEREY
CLARKSBURG MONROE
RUSSELL
NORTHAMPTON
SUND
ERLA
ND
LUDLOW
NEW SALEM
ATHOL
HOLLAND
PHILLIPSTON
GARDNER
DUDLEY
WESTMINSTER
PRINCETON
WEBSTER
WEST
LUNENBURG
TOWNSEND
HOPEDALE
LITTLETON
HOLLISTON
NORFOLK
NORTH
LINCOLN
NEEDHAM
SWANSEA
NORTON
WAKEFIELD
TOPSFIELD
CHILMARK
PLYMOUTH
EDGARTOWN
DENNIS
BREWSTER
WASHINGTONMOUNT
RICHMOND
STOCKBRIDGE
TYRINGHAM
BECKET
WESTFIELD
SHELBURNE
SHUTESBURY
WARREN
NORTH
EAST
RUTLAND
HOLDENBOYLSTON
MILLBURY
SUTTON
SHIRLEY
WESTBOROUGH
MARLBOROUGH
HOPKINTON
SHERBORN
CHELMSFORD
NATICK
SEEKONK
WESTON
DOVER
BEDFORD
BILLERICA
WALPOLE
ARLINGTON
WOBURN
TAUNTON
WESTPORT
ANDOVER
MELROSE
BRIDGEWATER
LYNN
WEST
WHITMAN
BEVERLY
DUXBURY
TISBURY
YARMOUTH
TRURO
PITTSFIELD
WILLIAMSTOWN
LEE
DALTON
ADAMS
WINDSOR
TOLLAND
FLORIDA
CHESTER
GOSHEN
SOUTHWICK
BUCKLAND
CONWAY
EASTHAMPTON
HOLYOKE
SOUTH.HADLEY
GREENFIELD
SPRINGFIELD
NORTHFIELD
PELHAM
WENDELL
MONSON
WARWICK
WARE
NEW
WINCHENDON
SPENCER
CHARLTON
DOUGLAS
LANCASTER
MENDON
BLACKSTONE
STOW
ATTLEBOROUGH
LEXINGTON
NEWTON
WILMINGTON
BELMONT
WINCHESTER
CAMBRIDGE
HAVERHILL
MILTON
BERKLEY
LYNNFIELD
AVON
BRAINTREE
BRIDGEWATER
NEWBURY
NAHANT
IPSWICH
SALISBURY
HANSON
HALIFAX
MATTAPOISETT
MARIONBOURNE
WELLFLEET
ALFORD
NEW MARLBOROUGH
NEW ASHFORD
WASHINGTON
HINSDALE
SAVOY
BLANDFORD
MONTGOMERY
AGAWAM
WEST
HATFIELD
MONTAGUE
LEVERETT
WILBRAHAM
OAKHAM
LEICESTER
AUBURN
WORCESTER
BOYLSTON
GRAFTON
CLINTON
NORTHBOROUGH
BOLTON
MEDWAY
MILLIS
LOWELL
ATTLEBORO
METHUEN
DIGHTON
NORTH READING
RAYNHAM
GROVELAND
HOLBROOK
BRIDGEWATER
WEYMOUTH
BEDFORD
NEWBURY
NEWBURYPORT
HULL
PLYMPTON
PEMBROKE
KINGSTON
GOSNOLD
WEST TISBURY
FALMOUTH
BARNSTABLE
NANTUCKET
CHATHAM
ORLEANS
LANESBOROUGH
CHESHIRE
PERU
HEATHCOLRAIN
SPRINGFIELD
HADLEY
LONGMEADOW
AMHERST
HAMPDEN
ERVING
BRAINTREE
SOUTHBRIDGE
PAXTON
MILL
VILL
E
GROTON
HUDSON
BELL
INGH
AM
ACTON
SUDBURY
CONCORD
CARLISLE
PLAINVILLE
MEDFIELD
WELLESLEY
REHOBOTH
WALTHAM
TEWKSBURY
EVERETT
MIDDLETON
DARTMOUTH
REVERE
ABINGTON
PEABODY
WINTHROP
EAST
FAIRHAVEN
HAMILTON
AQUINNAH
CARVER
ROCKPORT
MASHPEE
EASTHAM
EGREMONT
WEST
GREAT BARRINGTON
NORTH ADAMS
HAWLEY
CHARLEMONT
HUNTINGTON
SOUTHAMPTON
LONGMEADOW
GILL
EAST
PALMER
HARDWICK
BARRE
BROOKFIELD
HUBBARDSTON
OXFORD
UXBRIDGE
PEPPERELL
MILFORD
DUNSTABLE
TYNGSBOROUGH
FRAMINGHAM
FRANKLIN
DRACUT
MANSFIELD
READING
BROCKTON
SAUGUS
AMESBURY
ROCKLAND
ACUSHNET
MIDDLEBOROUGH
SWAMPSCOTT
ROCHESTER
MANCHESTER
PROVINCETOWN
STOCKBRIDGE
SHEFFIELD
LENOX
OTIS
PLAINFIELD
CHESTERFIELD
DEERFIELD
ORANGE
WALES
BRIMFIELD
PETERSHAM
ROYALSTON
BROOKFIELD
ASHBURNHAM
NORTHBRIDGE
BERLIN
UPTON
MAYNARD
WAYLAND
WRENTHAM
WESTWOOD
BURLINGTON
SHARON
WATERTOWN
DEDHAM
LAWRENCE
SOME RSE T
MEDFORD
STOUGHTON
STONEHAM
BOSTON
NORTH
MALDEN
FREETOWN
QUINCY
GEORGETOWN
NEW
SALEM
WENHAM
HANOVER
NORWELL
COHASSET
ESSEX
SCITUATE
WAREHAM
OAKBLUFFS
SANDWICH
HARWICH
MunicipalNational GridNational Grid; WMECONSTARUNITILWMECO
Electricity Providers (2008), by Town
Lakeville, Middleboroughand Russell were changedto 'Municipal' in Dec. '09. 0 10 20 30 40 505
Miles
±
Map of EDC Areas and Municipal Light Plant Towns
Are Residential Consumers Benefiting from Electric Supply Competition?2021 Update
Appendix 1A
Prepared for the Massachusetts Attorney General's Office 1/1

Are Residential Consumers Benefiting from Electric Supply Competition? 2021 Update
Prepared for the Massachusetts Attorney General’s Office
Appendix 2A
EDC Rates During Study Period: July 2015 – June 2016; July 2016 – June 2017; July 2017 – June 2018;
July 2018 – June 2019; and July 2019 – June 2020

Are Residential Consumers Benefiting from Electric Supply Competition?2021 Update
Appendix 2A
Prepared for the Massachusetts Attorney General’s Office 1/1
MonthsNumber of
MonthsJuly 2015 - June 2016
July 2016 - June 2017
July 2017- June 2018
July 2018 - June 2019
July 2019 - June 2020
July - Sept 3 $0.09257 0.08042$ 0.09432$ 0.10870$ 0.10793$ Oct 1 $0.09257 0.08084$ 0.09432$ 0.10870$ 0.10793$ Nov - April 6 $0.13038 0.09787$ 0.12673$ 0.13718$ 0.13982$ May - June 2 $0.08042 0.09432$ 0.10870$ 0.10793$ 0.09898$
July - Dec 6 $0.10050 0.08208$ 0.10759$ 0.11397$ 0.10836$ Jan - June 6 $0.10844 0.10318$ 0.12881$ 0.13588$ 0.12517$
July - Dec 6 $0.09767 0.07708$ 0.08653$ 0.10003$ 0.09851$ Jan 1 $0.10426 0.09126$ 0.10486$ 0.11678$ 0.11666$ Feb - June 5 $0.10426 0.09126$ 0.10503$ 0.11678$ 0.11666$
July - Nov 5 $0.07878 0.07878$ 0.09934$ 0.10556$ 0.09980$ Dec - May 6 $0.12239 0.09704$ 0.12340$ 0.12915$ 0.12388$ June 1 $0.11191 0.09934$ 0.10556$ 0.09980$ 0.09300$
July 2017 – June 2018; July 2018 – June 2019; andJuly 2019 - June 2020
Rate
National Grid (MECo and Nantucket)
NSTAR
WMECo
Fitchburg
EDC Rates During Five Study Periods: July 2015 – June 2016; July 2016 – June 2017;

Are Residential Consumers Benefiting from Electric Supply Competition? 2021 Update
Prepared for the Massachusetts Attorney General’s Office
Appendix 2B
Consumer Loss, Premium, and Participation by Municipality – All Households
September 2018 and September 2019

Are Residential Consumers Benefiting from Electric Supply Competition?2021 Update
Appendix 2BSeptember 2019
Municipality
Total Consumer Loss in Month
Average Per Household Loss in Month
Premium (per kWh)
% of Households
Participating in Competitive Supply Market
# Competitive Supply Accounts
Abington 41,604$ 32.66$ 0.0483$ 19% 1,274 Acton 10,829$ 9.33$ 0.0178$ 13% 1,161 Acushnet 11,608$ 15.48$ 0.0228$ 18% 750 Adams 14,261$ 18.14$ 0.0499$ 19% 786 Agawam 14,654$ 11.92$ 0.0198$ 17% 1,229 Alford 2,304$ 32.00$ 0.0428$ 20% 72 Allston 13,698$ 8.12$ 0.0204$ 18% 1,688 Amesbury 26,500$ 26.79$ 0.0474$ 13% 989 Amherst 10,976$ 10.50$ 0.0228$ 11% 1,045 Andover 60,368$ 32.88$ 0.0410$ 14% 1,836 Aquinnah 1,527$ 20.91$ 0.0266$ 15% 73 Arlington 26,158$ 9.83$ 0.0214$ 13% 2,662 Ashby 9,391$ 6.88$ 0.0169$ 47% 1,364 Ashfield 1,429$ 12.99$ 0.0283$ 12% 110 Ashland 11,900$ 10.48$ 0.0177$ 15% 1,135 Assonet 2,592$ 10.94$ 0.0167$ 15% 237 Athol 30,101$ 27.09$ 0.0469$ 22% 1,111 Attleboro 85,799$ 27.51$ 0.0493$ 17% 3,119 Auburn 26,914$ 21.50$ 0.0438$ 19% 1,252 Auburndale 3,925$ 13.35$ 0.0233$ 12% 294 Avon 9,728$ 27.56$ 0.0464$ 20% 353 Ayer 17,421$ 24.99$ 0.0452$ 19% 697 Barnstable 3,561$ 16.41$ 0.0199$ 19% 217 Barre 11,917$ 25.09$ 0.0414$ 22% 475 Bass River 2,678$ 10.18$ 0.0189$ 14% 263 Becket 1,802$ 9.34$ 0.0215$ 11% 193 Bedford 6,695$ 8.58$ 0.0131$ 14% 780 Belchertown 22,342$ 19.77$ 0.0403$ 18% 1,130 Bellingham 3,155$ 11.19$ 0.0217$ 17% 282 Berlin 5,721$ 31.61$ 0.0419$ 15% 181 Bernardston 1,661$ 10.79$ 0.0179$ 15% 154 Beverly 70,761$ 26.79$ 0.0466$ 16% 2,641 Billerica 83,881$ 37.77$ 0.0499$ 15% 2,221 Blackstone 24,526$ 28.99$ 0.0412$ 23% 846 Blandford 628$ 10.83$ 0.0176$ 9% 58 Bolton 10,421$ 33.84$ 0.0353$ 16% 308 Boston 51,659$ 6.83$ 0.0157$ 11% 7,560 Bourne 5,015$ 10.15$ 0.0184$ 18% 494 Boxford 16,998$ 42.71$ 0.0443$ 14% 398
Appendix 2BConsumer Loss, Premium, and Participation by Municipality ‐ All Households
(Sorted Alphabetically)
Prepared for the Massachusetts Attorney General's Office 1 / 11

Are Residential Consumers Benefiting from Electric Supply Competition?2021 Update
Appendix 2BSeptember 2019
Municipality
Total Consumer Loss in Month
Average Per Household Loss in Month
Premium (per kWh)
% of Households
Participating in Competitive Supply Market
# Competitive Supply Accounts
Appendix 2BConsumer Loss, Premium, and Participation by Municipality ‐ All Households
(Sorted Alphabetically)
Brant Rock 343$ 9.79$ 0.0206$ 15% 35 Brewster 20,565$ 14.15$ 0.0209$ 18% 1,453 Bridgewater 43,443$ 28.98$ 0.0446$ 16% 1,499 Brighton 26,311$ 9.08$ 0.0209$ 15% 2,897 Brimfield 8,775$ 23.65$ 0.0402$ 23% 371 Brockton 254,958$ 21.77$ 0.0442$ 35% 11,713 Brookfield 10,284$ 23.53$ 0.0371$ 28% 437 Brookline 31,286$ 13.63$ 0.0240$ 10% 2,296 Buckland 1,495$ 13.00$ 0.0267$ 13% 115 Burlington 14,850$ 9.72$ 0.0182$ 15% 1,527 Buzzards Bay 4,934$ 14.10$ 0.0209$ 19% 350 Cambridge 45,105$ 13.29$ 0.0360$ 11% 3,395 Canton 19,069$ 14.20$ 0.0214$ 15% 1,343 Carlisle 4,248$ 16.15$ 0.0177$ 14% 263 Carver 9,811$ 15.35$ 0.0192$ 15% 639 Cataumet 1,363$ 11.65$ 0.0223$ 16% 117 Centerville 16,012$ 13.31$ 0.0181$ 20% 1,203 Charlemont 3,028$ 26.80$ 0.0570$ 16% 113 Charlestown 2,155$ 1.92$ 0.0036$ 14% 1,120 Charlton 29,307$ 28.04$ 0.0386$ 21% 1,045 Chatham 12,677$ 20.41$ 0.0268$ 16% 621 Chelmsford 52,461$ 26.96$ 0.0469$ 14% 1,946 Chelsea 39,471$ 10.22$ 0.0268$ 30% 3,863 Cheshire 7,382$ 24.69$ 0.0482$ 19% 299 Chester 126$ 17.95$ 0.0400$ 11% 7 Chesterfield 679$ 13.06$ 0.0292$ 8% 52 Chestnut Hill 16,597$ 18.52$ 0.0222$ 13% 896 Chicopee 17$ 16.64$ 0.0383$ 13% 1 Chilmark 4,691$ 27.27$ 0.0288$ 11% 172 Clarksburg 2,554$ 19.06$ 0.0463$ 18% 134 Clinton 40,018$ 25.60$ 0.0438$ 24% 1,563 Cohasset 13,140$ 35.51$ 0.0479$ 11% 370 Colrain 1,967$ 13.20$ 0.0229$ 17% 149 Concord 117$ 58.48$ 0.1008$ 11% 2 Conway 1,439$ 11.79$ 0.0221$ 14% 122 Cotuit 4,857$ 12.52$ 0.0197$ 16% 388 Cummaquid 1,900$ 17.27$ 0.0223$ 22% 110 Cummington 397$ 6.62$ 0.0152$ 11% 60 Dalton 4,004$ 9.53$ 0.0202$ 14% 420
Prepared for the Massachusetts Attorney General's Office 2 / 11

Are Residential Consumers Benefiting from Electric Supply Competition?2021 Update
Appendix 2BSeptember 2019
Municipality
Total Consumer Loss in Month
Average Per Household Loss in Month
Premium (per kWh)
% of Households
Participating in Competitive Supply Market
# Competitive Supply Accounts
Appendix 2BConsumer Loss, Premium, and Participation by Municipality ‐ All Households
(Sorted Alphabetically)
Dartmouth 15$ 14.61$ 0.0547$ 50% 1 Dedham 24,781$ 15.84$ 0.0242$ 16% 1,564 Deerfield 434$ 6.02$ 0.0082$ 13% 72 Dennis 7,013$ 13.26$ 0.0197$ 17% 529 Dennis Port 6,278$ 11.42$ 0.0216$ 12% 550 Dighton 12,654$ 32.04$ 0.0450$ 15% 395 Dorchester 177,358$ 11.79$ 0.0276$ 30% 15,047 Douglas 17,874$ 28.33$ 0.0414$ 17% 631 Dover 3,362$ 12.45$ 0.0107$ 13% 270 Dracut 46,245$ 24.70$ 0.0474$ 15% 1,872 Dudley 22,091$ 21.18$ 0.0367$ 23% 1,043 Dunstable 8,127$ 37.98$ 0.0413$ 18% 214 Duxbury 11,415$ 13.70$ 0.0156$ 13% 833 East Boston 36,694$ 10.47$ 0.0293$ 21% 3,504 East Bridgewat 34,040$ 30.86$ 0.0435$ 22% 1,103 East Brookfield 7,512$ 29.57$ 0.0417$ 25% 254 East Cambridge 8,698$ 10.87$ 0.0291$ 11% 800 East Dennis 3,645$ 14.82$ 0.0200$ 14% 246 East Falmouth 22,058$ 13.11$ 0.0213$ 20% 1,682 East Freetown 3,319$ 12.29$ 0.0207$ 14% 270 East Harwich 5,105$ 13.09$ 0.0181$ 19% 390 East Longmead 39,355$ 33.87$ 0.0425$ 19% 1,162 East Orleans 3,713$ 20.63$ 0.0252$ 13% 180 East Otis 732$ 9.15$ 0.0234$ 8% 80 East Sandwich 5,623$ 10.96$ 0.0155$ 18% 513 East Walpole 2,696$ 13.90$ 0.0211$ 11% 194 East Wareham 7,091$ 15.45$ 0.0239$ 22% 459 Eastham 7,626$ 14.28$ 0.0207$ 15% 534 Easthampton 11,014$ 9.93$ 0.0231$ 14% 1,109 Easton 50,136$ 31.26$ 0.0441$ 18% 1,604 Edgartown 11,792$ 15.16$ 0.0177$ 15% 778 Egremont 5,196$ 32.07$ 0.0503$ 17% 162 Erving 459$ 10.68$ 0.0196$ 11% 43 Essex 6,673$ 31.04$ 0.0449$ 13% 215 Everett 94,917$ 22.13$ 0.0570$ 26% 4,289 Fairhaven 16,262$ 15.06$ 0.0257$ 15% 1,080 Fall River 271,862$ 25.63$ 0.0533$ 27% 10,609 Falmouth 10,025$ 10.98$ 0.0236$ 17% 913 Feeding Hills 8,532$ 11.14$ 0.0168$ 16% 766
Prepared for the Massachusetts Attorney General's Office 3 / 11

Are Residential Consumers Benefiting from Electric Supply Competition?2021 Update
Appendix 2BSeptember 2019
Municipality
Total Consumer Loss in Month
Average Per Household Loss in Month
Premium (per kWh)
% of Households
Participating in Competitive Supply Market
# Competitive Supply Accounts
Appendix 2BConsumer Loss, Premium, and Participation by Municipality ‐ All Households
(Sorted Alphabetically)
Fitchburg 77,985$ 24.59$ 0.0604$ 18% 3,171 Florida‐Drury 1,340$ 20.61$ 0.0449$ 18% 65 Forestdale 2,928$ 9.79$ 0.0146$ 20% 299 Foxboro 25,540$ 26.58$ 0.0449$ 13% 961 Framingham 57,201$ 9.39$ 0.0203$ 23% 6,094 Franklin 68,175$ 31.90$ 0.0415$ 18% 2,137 Gardner 40,248$ 21.35$ 0.0491$ 21% 1,885 Gill 916$ 10.07$ 0.0185$ 14% 91 Gloucester 71,815$ 28.84$ 0.0493$ 17% 2,490 Goshen 1,007$ 17.07$ 0.0453$ 10% 59 Grafton 25,763$ 22.74$ 0.0414$ 15% 1,133 Granby 10,830$ 22.38$ 0.0426$ 20% 484 Granville 820$ 5.94$ 0.0086$ 20% 138 Green Harbor 164$ 6.58$ 0.0156$ 11% 25 Greenfield 14,243$ 13.59$ 0.0298$ 12% 1,048 Gt Barrington 17,441$ 24.26$ 0.0463$ 20% 719 Hadley 3,540$ 11.64$ 0.0219$ 11% 304 Halifax 17,709$ 29.27$ 0.0452$ 20% 605 Hamilton 14,939$ 36.80$ 0.0478$ 14% 406 Hampden 9,606$ 25.82$ 0.0406$ 19% 372 Hancock 1,172$ 11.84$ 0.0289$ 14% 99 Hanover 31,417$ 41.01$ 0.0424$ 15% 766 Hanson 24,856$ 35.36$ 0.0450$ 18% 703 Hardwick 7,289$ 29.04$ 0.0436$ 20% 251 Harvard 9,510$ 34.09$ 0.0380$ 14% 279 Harwich 7,727$ 9.96$ 0.0158$ 20% 776 Harwich Port 6,313$ 20.36$ 0.0265$ 14% 310 Hatfield 1,757$ 11.87$ 0.0245$ 12% 148 Haverhill 112,972$ 21.56$ 0.0459$ 20% 5,240 Hawley 579$ 17.03$ 0.0360$ 17% 34 Heath 1,940$ 23.95$ 0.0512$ 14% 81 Hingham 147$ 36.77$ 0.0540$ 14% 4 Hinsdale 1,389$ 9.14$ 0.0172$ 13% 152 Holbrook 34,919$ 33.29$ 0.0496$ 25% 1,049 Holland 9,010$ 25.82$ 0.0371$ 24% 349 Holliston 10,277$ 15.98$ 0.0218$ 12% 643 Hopedale 15,353$ 31.27$ 0.0389$ 22% 491 Hopkinton 9,096$ 10.98$ 0.0129$ 13% 828 Hubbardston 8,382$ 23.16$ 0.0403$ 20% 362
Prepared for the Massachusetts Attorney General's Office 4 / 11

Are Residential Consumers Benefiting from Electric Supply Competition?2021 Update
Appendix 2BSeptember 2019
Municipality
Total Consumer Loss in Month
Average Per Household Loss in Month
Premium (per kWh)
% of Households
Participating in Competitive Supply Market
# Competitive Supply Accounts
Appendix 2BConsumer Loss, Premium, and Participation by Municipality ‐ All Households
(Sorted Alphabetically)
Humarock 596$ 8.40$ 0.0214$ 10% 71 Huntington 1,477$ 13.55$ 0.0235$ 11% 109 Hyannis 25,819$ 11.61$ 0.0187$ 29% 2,224 Hyannis Port 529$ 12.59$ 0.0138$ 11% 42 Hyde Park 46,446$ 13.18$ 0.0274$ 29% 3,524 Indian Orchard 10,445$ 12.52$ 0.0248$ 22% 834 Jamaica Plain 26,978$ 9.86$ 0.0237$ 17% 2,736 Kingston 8,533$ 12.79$ 0.0164$ 13% 667 Lake Pleasant 34$ 4.79$ 0.0103$ 8% 7 Lakeville 417$ 5.79$ 0.0095$ 17% 72 Lancaster 12,804$ 30.56$ 0.0397$ 15% 419 Lanesborough 1,859$ 9.68$ 0.0197$ 12% 192 Lawrence 180,006$ 26.58$ 0.0564$ 26% 6,773 Lee 1,312$ 2.53$ 0.0043$ 17% 519 Leicester 19,896$ 20.86$ 0.0381$ 22% 954 Lenox 7,869$ 29.25$ 0.0503$ 13% 269 Lenoxdale 103$ 7.36$ 0.0202$ 6% 14 Leominster 114,984$ 27.72$ 0.0435$ 24% 4,148 Leverett 961$ 8.58$ 0.0224$ 11% 112 Lexington 19,111$ 13.22$ 0.0214$ 12% 1,446 Leyden 332$ 8.10$ 0.0180$ 12% 41 Lincoln 6,108$ 17.81$ 0.0259$ 15% 343 Longmeadow 10,882$ 12.35$ 0.0183$ 15% 881 Lowell 271,704$ 25.26$ 0.0520$ 28% 10,757 Ludlow 13,205$ 11.16$ 0.0215$ 14% 1,183 Lunenburg 34,030$ 7.25$ 0.0178$ 47% 4,692 Lynn 206,042$ 23.74$ 0.0549$ 26% 8,678 Malden 105,416$ 20.13$ 0.0508$ 21% 5,238 Manchester 13,706$ 41.91$ 0.0538$ 14% 327 Manomet 401$ 12.16$ 0.0236$ 11% 33 Marion 6,036$ 14.94$ 0.0192$ 15% 404 Marlboro 78,445$ 23.64$ 0.0510$ 20% 3,318 Marshfield 17,023$ 9.89$ 0.0160$ 16% 1,722 Marshfld Hls 236$ 13.89$ 0.0217$ 12% 17 Marstons Mls 7,716$ 11.74$ 0.0163$ 20% 657 Mashpee 22,051$ 10.91$ 0.0169$ 19% 2,022 Mattapan 36,249$ 12.07$ 0.0264$ 37% 3,004 Mattapoisett 6,608$ 15.48$ 0.0208$ 12% 427 Maynard 6,100$ 8.31$ 0.0167$ 16% 734
Prepared for the Massachusetts Attorney General's Office 5 / 11
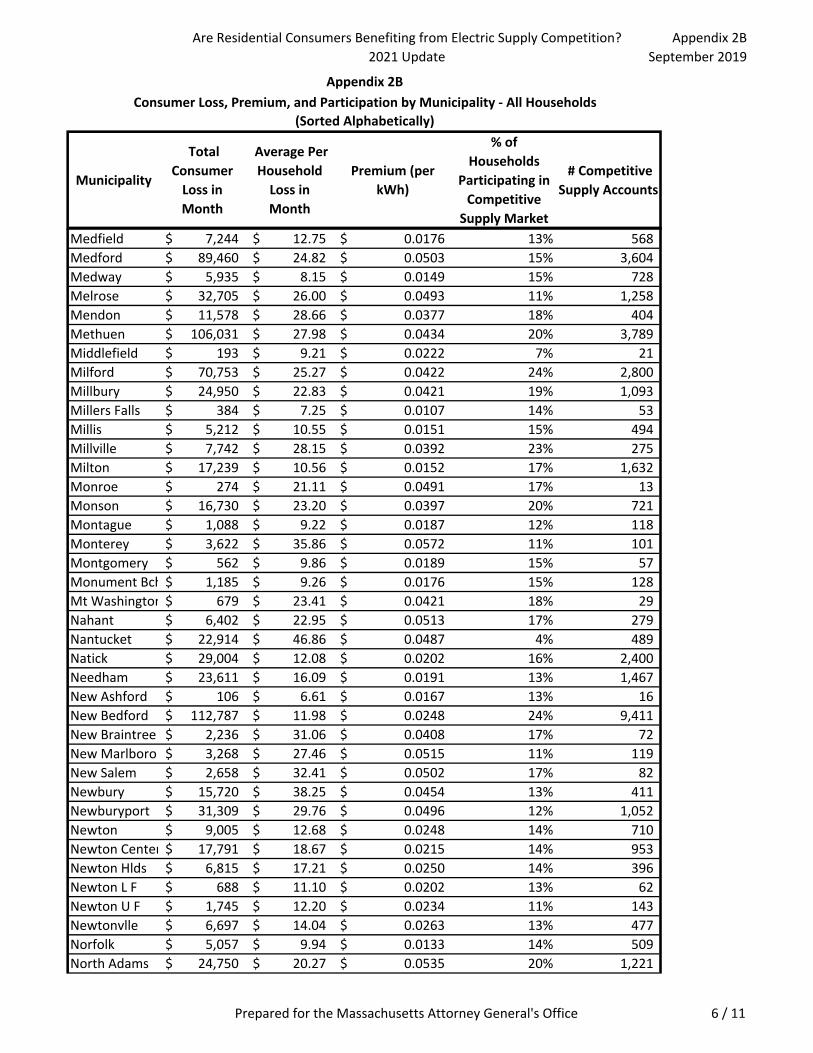
Are Residential Consumers Benefiting from Electric Supply Competition?2021 Update
Appendix 2BSeptember 2019
Municipality
Total Consumer Loss in Month
Average Per Household Loss in Month
Premium (per kWh)
% of Households
Participating in Competitive Supply Market
# Competitive Supply Accounts
Appendix 2BConsumer Loss, Premium, and Participation by Municipality ‐ All Households
(Sorted Alphabetically)
Medfield 7,244$ 12.75$ 0.0176$ 13% 568 Medford 89,460$ 24.82$ 0.0503$ 15% 3,604 Medway 5,935$ 8.15$ 0.0149$ 15% 728 Melrose 32,705$ 26.00$ 0.0493$ 11% 1,258 Mendon 11,578$ 28.66$ 0.0377$ 18% 404 Methuen 106,031$ 27.98$ 0.0434$ 20% 3,789 Middlefield 193$ 9.21$ 0.0222$ 7% 21 Milford 70,753$ 25.27$ 0.0422$ 24% 2,800 Millbury 24,950$ 22.83$ 0.0421$ 19% 1,093 Millers Falls 384$ 7.25$ 0.0107$ 14% 53 Millis 5,212$ 10.55$ 0.0151$ 15% 494 Millville 7,742$ 28.15$ 0.0392$ 23% 275 Milton 17,239$ 10.56$ 0.0152$ 17% 1,632 Monroe 274$ 21.11$ 0.0491$ 17% 13 Monson 16,730$ 23.20$ 0.0397$ 20% 721 Montague 1,088$ 9.22$ 0.0187$ 12% 118 Monterey 3,622$ 35.86$ 0.0572$ 11% 101 Montgomery 562$ 9.86$ 0.0189$ 15% 57 Monument Bch 1,185$ 9.26$ 0.0176$ 15% 128 Mt Washington 679$ 23.41$ 0.0421$ 18% 29 Nahant 6,402$ 22.95$ 0.0513$ 17% 279 Nantucket 22,914$ 46.86$ 0.0487$ 4% 489 Natick 29,004$ 12.08$ 0.0202$ 16% 2,400 Needham 23,611$ 16.09$ 0.0191$ 13% 1,467 New Ashford 106$ 6.61$ 0.0167$ 13% 16 New Bedford 112,787$ 11.98$ 0.0248$ 24% 9,411 New Braintree 2,236$ 31.06$ 0.0408$ 17% 72 New Marlboro 3,268$ 27.46$ 0.0515$ 11% 119 New Salem 2,658$ 32.41$ 0.0502$ 17% 82 Newbury 15,720$ 38.25$ 0.0454$ 13% 411 Newburyport 31,309$ 29.76$ 0.0496$ 12% 1,052 Newton 9,005$ 12.68$ 0.0248$ 14% 710 Newton Center 17,791$ 18.67$ 0.0215$ 14% 953 Newton Hlds 6,815$ 17.21$ 0.0250$ 14% 396 Newton L F 688$ 11.10$ 0.0202$ 13% 62 Newton U F 1,745$ 12.20$ 0.0234$ 11% 143 Newtonvlle 6,697$ 14.04$ 0.0263$ 13% 477 Norfolk 5,057$ 9.94$ 0.0133$ 14% 509 North Adams 24,750$ 20.27$ 0.0535$ 20% 1,221
Prepared for the Massachusetts Attorney General's Office 6 / 11

Are Residential Consumers Benefiting from Electric Supply Competition?2021 Update
Appendix 2BSeptember 2019
Municipality
Total Consumer Loss in Month
Average Per Household Loss in Month
Premium (per kWh)
% of Households
Participating in Competitive Supply Market
# Competitive Supply Accounts
Appendix 2BConsumer Loss, Premium, and Participation by Municipality ‐ All Households
(Sorted Alphabetically)
North Andover 36,853$ 21.38$ 0.0398$ 15% 1,724 North Brookfie 11,320$ 25.61$ 0.0389$ 21% 442 North Cambrid 12,805$ 12.31$ 0.0340$ 11% 1,040 North Carver 805$ 23.00$ 0.0164$ 16% 35 North Chatham 3,995$ 22.57$ 0.0246$ 16% 177 North Dartmou 9,592$ 11.08$ 0.0197$ 12% 866 North Eastham 4,855$ 13.34$ 0.0200$ 14% 364 North Falmout 5,283$ 13.55$ 0.0246$ 15% 390 North Hatfield 237$ 33.89$ 0.0513$ 5% 7 North Truro 2,915$ 15.75$ 0.0211$ 11% 185 Northampton 44,828$ 22.85$ 0.0528$ 15% 1,962 Northboro 30,268$ 33.63$ 0.0433$ 15% 900 Northfield 1,904$ 10.40$ 0.0192$ 13% 183 Norton 25,215$ 23.33$ 0.0416$ 16% 1,081 Norwell 24,077$ 43.86$ 0.0416$ 15% 549 Oak Bluffs 9,424$ 13.70$ 0.0173$ 16% 688 Oakham 7,088$ 32.22$ 0.0348$ 25% 220 Ocean Bluff 161$ 8.45$ 0.0188$ 11% 19 Onset 5,210$ 12.35$ 0.0209$ 18% 422 Orange 21,439$ 18.61$ 0.0308$ 33% 1,152 Orleans 8,177$ 14.03$ 0.0192$ 18% 583 Osterville 8,398$ 19.22$ 0.0192$ 15% 437 Otis 565$ 6.07$ 0.0089$ 10% 93 Oxford 29,819$ 24.66$ 0.0388$ 22% 1,209 Palmer 26,878$ 24.70$ 0.0441$ 19% 1,088 Pelham 706$ 7.43$ 0.0130$ 15% 95 Pembroke 46,509$ 43.06$ 0.0435$ 16% 1,080 Pepperell 24,511$ 31.14$ 0.0431$ 17% 787 Peru 644$ 12.15$ 0.0258$ 12% 53 Petersham 2,582$ 24.83$ 0.0390$ 18% 104 Phillipston 3,387$ 22.73$ 0.0401$ 18% 149 Pittsfield 38,714$ 11.93$ 0.0259$ 15% 3,244 Plainfield 542$ 9.03$ 0.0214$ 16% 60 Plainville 13,693$ 24.02$ 0.0453$ 13% 570 Plymouth 37,684$ 9.96$ 0.0168$ 14% 3,783 Plympton 1,671$ 12.29$ 0.0144$ 13% 136 Pocasset 4,903$ 11.27$ 0.0261$ 19% 435 Provincetown 6,737$ 10.88$ 0.0195$ 13% 619 Quincy 116,803$ 22.47$ 0.0496$ 17% 5,198
Prepared for the Massachusetts Attorney General's Office 7 / 11

Are Residential Consumers Benefiting from Electric Supply Competition?2021 Update
Appendix 2BSeptember 2019
Municipality
Total Consumer Loss in Month
Average Per Household Loss in Month
Premium (per kWh)
% of Households
Participating in Competitive Supply Market
# Competitive Supply Accounts
Appendix 2BConsumer Loss, Premium, and Participation by Municipality ‐ All Households
(Sorted Alphabetically)
Randolph 113,477$ 31.00$ 0.0475$ 30% 3,661 Rehoboth 19,455$ 27.06$ 0.0439$ 15% 719 Revere 103,010$ 23.33$ 0.0531$ 21% 4,416 Richmond 1,300$ 12.50$ 0.0184$ 11% 104 Rochester 3,415$ 11.57$ 0.0140$ 13% 295 Rockland 51,493$ 33.01$ 0.0491$ 22% 1,560 Rockport 16,319$ 23.68$ 0.0470$ 16% 689 Roslindale 33,825$ 11.93$ 0.0269$ 24% 2,835 Rowe 826$ 22.95$ 0.0440$ 16% 36 Roxbry Xng 11,023$ 10.36$ 0.0239$ 20% 1,064 Roxbury 38,030$ 10.97$ 0.0243$ 33% 3,468 Royalston 1,880$ 18.07$ 0.0398$ 16% 104 Russell 320$ 16.82$ 0.0187$ 9% 19 Rutland 13,625$ 19.38$ 0.0394$ 21% 703 Sagamore 771$ 7.56$ 0.0144$ 17% 102 Sagamore Bch 3,109$ 13.12$ 0.0165$ 16% 237 Salem 86,110$ 29.52$ 0.0520$ 16% 2,917 Salisbury 11,133$ 17.78$ 0.0400$ 13% 626 Sandisfield 911$ 7.52$ 0.0137$ 16% 121 Sandwich 10,316$ 10.97$ 0.0165$ 18% 940 Saugus 74,214$ 38.29$ 0.0457$ 18% 1,938 Savoy 491$ 7.67$ 0.0156$ 17% 64 Scituate 39,805$ 35.19$ 0.0460$ 15% 1,131 Seekonk 30,170$ 34.36$ 0.0473$ 16% 878 Sharon 10,052$ 11.98$ 0.0176$ 14% 839 Sheffield 7,212$ 25.13$ 0.0485$ 16% 287 Shelburne 266$ 9.87$ 0.0259$ 12% 27 Shelburne Fls 1,102$ 10.20$ 0.0214$ 15% 108 Sherborn 3,189$ 15.04$ 0.0157$ 13% 212 Shirley 10,512$ 20.98$ 0.0415$ 19% 501 Shutesbury 3,053$ 24.43$ 0.0431$ 14% 125 Somerset 35,060$ 22.80$ 0.0494$ 21% 1,538 Somerville 43,141$ 11.31$ 0.0317$ 16% 3,816 South Boston 15,331$ 8.97$ 0.0181$ 8% 1,709 South Carver 615$ 14.31$ 0.0181$ 9% 43 South Chatham 2,330$ 12.66$ 0.0214$ 13% 184 South Dartmou 9,985$ 12.13$ 0.0215$ 14% 823 South Deerfield 2,037$ 9.52$ 0.0187$ 12% 214 South Dennis 9,303$ 14.67$ 0.0239$ 17% 634
Prepared for the Massachusetts Attorney General's Office 8 / 11

Are Residential Consumers Benefiting from Electric Supply Competition?2021 Update
Appendix 2BSeptember 2019
Municipality
Total Consumer Loss in Month
Average Per Household Loss in Month
Premium (per kWh)
% of Households
Participating in Competitive Supply Market
# Competitive Supply Accounts
Appendix 2BConsumer Loss, Premium, and Participation by Municipality ‐ All Households
(Sorted Alphabetically)
South Harwich 1,488$ 15.34$ 0.0215$ 16% 97 South Lee 84$ 16.80$ 0.0302$ 8% 5 South Orleans 2,803$ 21.90$ 0.0250$ 16% 128 South Walpole 492$ 15.87$ 0.0203$ 9% 31 South Wellfleet 2,307$ 15.28$ 0.0222$ 14% 151 South Yarmout 11,068$ 10.84$ 0.0190$ 21% 1,021 Southampton 2,680$ 8.93$ 0.0149$ 12% 300 Southborough 23,026$ 38.90$ 0.0336$ 16% 592 Southbridge 45,585$ 20.07$ 0.0443$ 31% 2,271 Southwick 8,624$ 13.71$ 0.0187$ 16% 629 Spencer 28,396$ 22.36$ 0.0384$ 24% 1,270 Springfield 179,916$ 13.42$ 0.0268$ 24% 13,409 Stockbridge 8,809$ 40.41$ 0.0536$ 14% 218 Stoneham 12,537$ 9.38$ 0.0194$ 13% 1,337 Stoughton 84,095$ 34.52$ 0.0480$ 23% 2,436 Sturbridge 20,968$ 20.86$ 0.0358$ 24% 1,005 Sudbury 10,615$ 13.79$ 0.0192$ 12% 770 Sunderland 1,982$ 10.17$ 0.0232$ 10% 195 Sutton 19,948$ 33.08$ 0.0401$ 16% 603 Swampscott 22,251$ 29.16$ 0.0510$ 14% 763 Swansea 43,120$ 33.19$ 0.0490$ 19% 1,299 Teaticket 5,035$ 12.19$ 0.0251$ 20% 413 Tewksbury 69,725$ 40.35$ 0.0486$ 15% 1,728 Tolland 474$ 5.16$ 0.0091$ 17% 92 Topsfield 16,652$ 52.36$ 0.0426$ 13% 318 Townsend 5,850$ 23.40$ 0.0575$ 6% 250 Truro 3,054$ 13.76$ 0.0188$ 16% 222 Turners Falls 3,992$ 10.65$ 0.0212$ 14% 375 Tyngsboro 23,398$ 31.96$ 0.0446$ 16% 732 Tyringham (13)$ (0.61)$ (0.0007)$ 7% 21 Upton 13,569$ 26.76$ 0.0419$ 17% 507 Uxbridge 23,852$ 20.21$ 0.0395$ 20% 1,180 Vineyard Hvn 10,032$ 18.01$ 0.0206$ 18% 557 Vlg Nag Wd 384$ 12.39$ 0.0280$ 11% 31 Waban 5,751$ 20.54$ 0.0238$ 12% 280 Wakefield (1)$ (0.52)$ (0.0006)$ 8% 2 Wales 4,128$ 19.29$ 0.0331$ 23% 214 Walpole 12,265$ 14.13$ 0.0218$ 12% 868 Waltham 50,149$ 10.22$ 0.0207$ 19% 4,905
Prepared for the Massachusetts Attorney General's Office 9 / 11

Are Residential Consumers Benefiting from Electric Supply Competition?2021 Update
Appendix 2BSeptember 2019
Municipality
Total Consumer Loss in Month
Average Per Household Loss in Month
Premium (per kWh)
% of Households
Participating in Competitive Supply Market
# Competitive Supply Accounts
Appendix 2BConsumer Loss, Premium, and Participation by Municipality ‐ All Households
(Sorted Alphabetically)
Waquoit 2,476$ 9.98$ 0.0156$ 20% 248 Ware 29,834$ 27.86$ 0.0437$ 24% 1,071 Wareham 16,652$ 12.61$ 0.0203$ 20% 1,321 Warren 14,086$ 26.23$ 0.0361$ 25% 537 Warwick 1,746$ 20.07$ 0.0548$ 21% 87 Washington 533$ 12.11$ 0.0233$ 15% 44 Watertown 22,156$ 8.11$ 0.0180$ 17% 2,732 Wayland 8,053$ 10.53$ 0.0147$ 15% 765 Webster 40,856$ 24.13$ 0.0434$ 21% 1,693 Wellfleet 7,401$ 16.86$ 0.0261$ 14% 439 Wendall 0$ 0.22$ 0.0066$ 20% 2 Wenham 12,526$ 59.93$ 0.0473$ 15% 209 West Barnstab 4,613$ 16.30$ 0.0186$ 21% 283 West Bridgewa 11,069$ 24.54$ 0.0431$ 16% 451 West Brookfiel 9,177$ 18.14$ 0.0293$ 30% 506 West Chatham 1,546$ 14.06$ 0.0196$ 12% 110 West Dennis 3,730$ 12.39$ 0.0195$ 13% 301 West Falmouth 2,400$ 17.27$ 0.0276$ 14% 139 West Harwich 3,153$ 16.25$ 0.0224$ 13% 194 West Hatfield 423$ 9.61$ 0.0211$ 14% 44 West Hyannisp 1,555$ 14.40$ 0.0200$ 15% 108 West Newbury 9,945$ 36.70$ 0.0388$ 16% 271 West Newton 10,346$ 17.02$ 0.0262$ 14% 608 West Roxbury 19,923$ 9.13$ 0.0181$ 19% 2,181 West Somervill 9,667$ 9.74$ 0.0284$ 9% 992 West Springfie 26,330$ 12.45$ 0.0222$ 19% 2,115 West Stockbrid 5,033$ 35.20$ 0.0534$ 16% 143 West Tisbury 8,016$ 24.97$ 0.0246$ 14% 321 West Wareham 3,768$ 11.63$ 0.0160$ 21% 324 West Yarmouth 14,746$ 11.97$ 0.0198$ 20% 1,232 Westboro 24,544$ 27.64$ 0.0446$ 12% 888 Westford 29,494$ 29.00$ 0.0476$ 11% 1,017 Westhampton 1,175$ 11.63$ 0.0190$ 13% 101 Westminster 12,227$ 23.16$ 0.0419$ 16% 528 Weston 12,636$ 22.77$ 0.0172$ 14% 555 Westport 24,323$ 18.86$ 0.0351$ 17% 1,290 Westport Pt 405$ 12.66$ 0.0249$ 13% 32 Westwood 10,894$ 16.31$ 0.0190$ 12% 668 Weymouth 140,690$ 29.95$ 0.0480$ 20% 4,698
Prepared for the Massachusetts Attorney General's Office 10 / 11
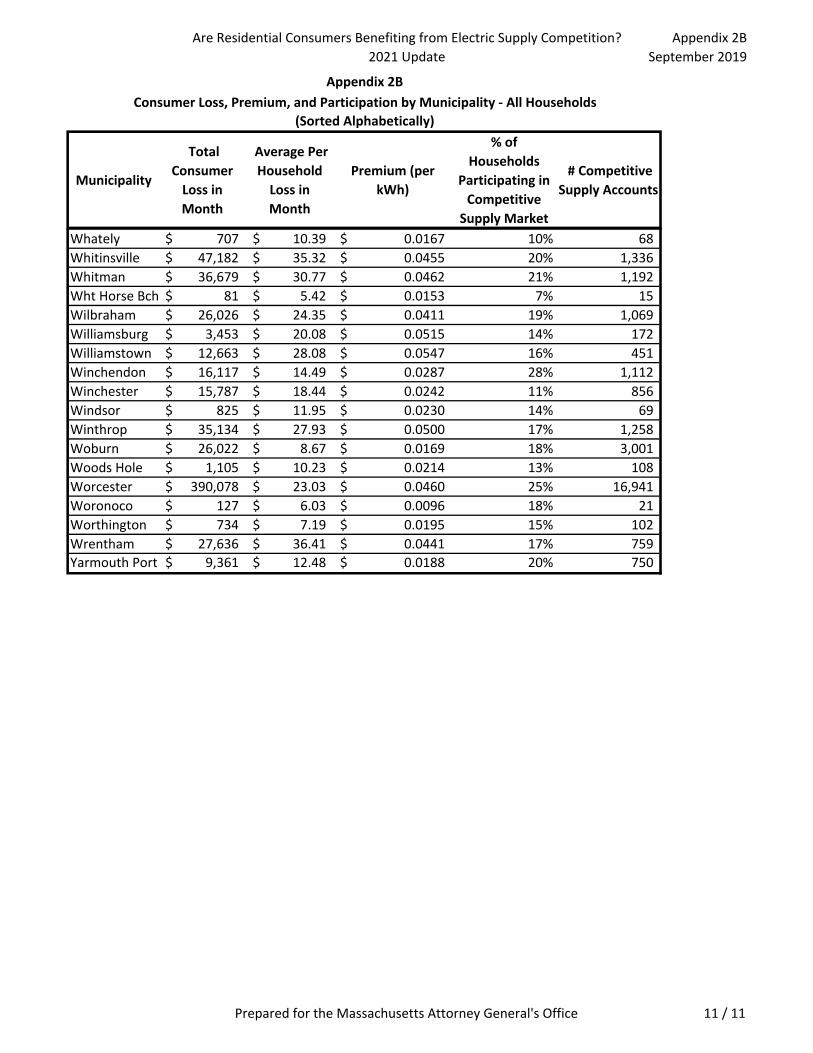
Are Residential Consumers Benefiting from Electric Supply Competition?2021 Update
Appendix 2BSeptember 2019
Municipality
Total Consumer Loss in Month
Average Per Household Loss in Month
Premium (per kWh)
% of Households
Participating in Competitive Supply Market
# Competitive Supply Accounts
Appendix 2BConsumer Loss, Premium, and Participation by Municipality ‐ All Households
(Sorted Alphabetically)
Whately 707$ 10.39$ 0.0167$ 10% 68 Whitinsville 47,182$ 35.32$ 0.0455$ 20% 1,336 Whitman 36,679$ 30.77$ 0.0462$ 21% 1,192 Wht Horse Bch 81$ 5.42$ 0.0153$ 7% 15 Wilbraham 26,026$ 24.35$ 0.0411$ 19% 1,069 Williamsburg 3,453$ 20.08$ 0.0515$ 14% 172 Williamstown 12,663$ 28.08$ 0.0547$ 16% 451 Winchendon 16,117$ 14.49$ 0.0287$ 28% 1,112 Winchester 15,787$ 18.44$ 0.0242$ 11% 856 Windsor 825$ 11.95$ 0.0230$ 14% 69 Winthrop 35,134$ 27.93$ 0.0500$ 17% 1,258 Woburn 26,022$ 8.67$ 0.0169$ 18% 3,001 Woods Hole 1,105$ 10.23$ 0.0214$ 13% 108 Worcester 390,078$ 23.03$ 0.0460$ 25% 16,941 Woronoco 127$ 6.03$ 0.0096$ 18% 21 Worthington 734$ 7.19$ 0.0195$ 15% 102 Wrentham 27,636$ 36.41$ 0.0441$ 17% 759 Yarmouth Port 9,361$ 12.48$ 0.0188$ 20% 750
Prepared for the Massachusetts Attorney General's Office 11 / 11

Are Residential Consumers Benefiting from Electric Supply Competition?2021 Update
Appendix 2BSeptember 2018
Municipality Total
Consumer Loss in Month
Average Per Household Loss
in Month
Premium (per kWh)
% of Households
Participating in Competitive Supply Market
# Competitive Supply Accounts
Abington 35,171$ 28.30$ 0.0306 19% 1,243 Acton 6,610$ 5.50$ 0.0090 14% 1,201 Acushnet 6,538$ 8.11$ 0.0097 19% 806 Adams 13,392$ 15.43$ 0.0331 20% 868 Agawam 15,759$ 12.38$ 0.0157 18% 1,273 Alford 2,398$ 29.98$ 0.0354 22% 80 Allston 7,522$ 4.20$ 0.0096 19% 1,791 Amesbury 25,332$ 24.06$ 0.0361 14% 1,053 Amherst 6,834$ 8.57$ 0.0169 8% 797 Andover 57,260$ 29.96$ 0.0318 15% 1,911 Aquinnah 714$ 10.06$ 0.0128 15% 71 Arlington 20,811$ 8.20$ 0.0127 13% 2,537 Ashby 111$ 0.08$ 0.0244 48% 1,385 Ashfield 1,273$ 10.03$ 0.0192 14% 127 Ashland 6,695$ 5.97$ 0.0075 15% 1,121 Assonet 734$ 2.89$ 0.0032 16% 254 Athol 29,838$ 24.42$ 0.0338 24% 1,222 Attleboro 84,757$ 25.23$ 0.0352 19% 3,359 Auburn 28,476$ 20.89$ 0.0303 20% 1,363 Auburndale 3,060$ 10.66$ 0.0152 12% 287 Avon 7,859$ 24.95$ 0.0337 18% 315 Ayer 15,878$ 21.78$ 0.0319 20% 729 Barnstable 1,650$ 7.30$ 0.0087 20% 226 Barre 9,872$ 19.06$ 0.0298 24% 518 Bass River 531$ 1.83$ 0.0030 16% 290 Becket 1,449$ 6.62$ 0.0130 13% 219 Bedford 1,692$ 2.08$ 0.0027 15% 814 Belchertown 26,417$ 21.12$ 0.0300 20% 1,251 Bellingham 31,863$ 24.16$ 0.0278 20% 1,319 Berlin 5,765$ 27.45$ 0.0280 18% 210 Bernardston 1,425$ 10.55$ 0.0135 14% 135 Beverly 69,242$ 25.44$ 0.0364 17% 2,722
Appendix 2BConsumer Loss, Premium, and Participation by Municipality ‐ All Households
(Sorted Alphabetically)
Prepared for the Massachusetts Attorney General’s Office 1/12
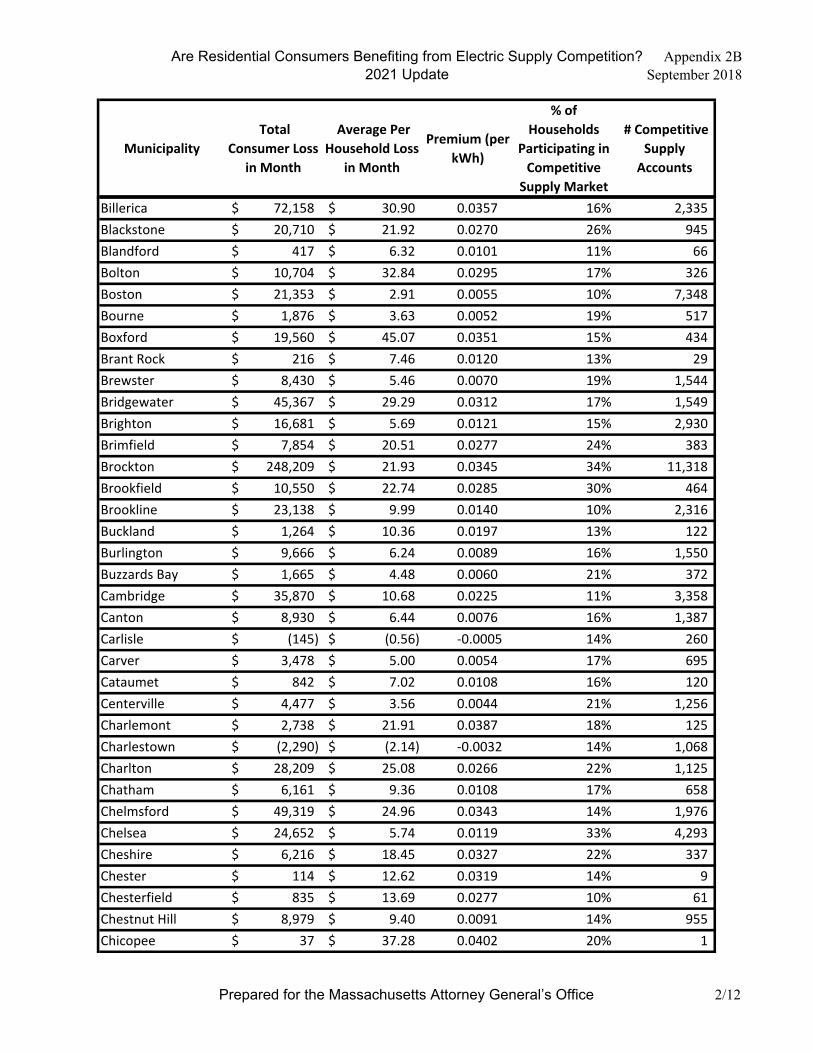
Are Residential Consumers Benefiting from Electric Supply Competition?2021 Update
Appendix 2BSeptember 2018
Municipality Total
Consumer Loss in Month
Average Per Household Loss
in Month
Premium (per kWh)
% of Households
Participating in Competitive Supply Market
# Competitive Supply Accounts
Billerica 72,158$ 30.90$ 0.0357 16% 2,335 Blackstone 20,710$ 21.92$ 0.0270 26% 945 Blandford 417$ 6.32$ 0.0101 11% 66 Bolton 10,704$ 32.84$ 0.0295 17% 326 Boston 21,353$ 2.91$ 0.0055 10% 7,348 Bourne 1,876$ 3.63$ 0.0052 19% 517 Boxford 19,560$ 45.07$ 0.0351 15% 434 Brant Rock 216$ 7.46$ 0.0120 13% 29 Brewster 8,430$ 5.46$ 0.0070 19% 1,544 Bridgewater 45,367$ 29.29$ 0.0312 17% 1,549 Brighton 16,681$ 5.69$ 0.0121 15% 2,930 Brimfield 7,854$ 20.51$ 0.0277 24% 383 Brockton 248,209$ 21.93$ 0.0345 34% 11,318 Brookfield 10,550$ 22.74$ 0.0285 30% 464 Brookline 23,138$ 9.99$ 0.0140 10% 2,316 Buckland 1,264$ 10.36$ 0.0197 13% 122 Burlington 9,666$ 6.24$ 0.0089 16% 1,550 Buzzards Bay 1,665$ 4.48$ 0.0060 21% 372 Cambridge 35,870$ 10.68$ 0.0225 11% 3,358 Canton 8,930$ 6.44$ 0.0076 16% 1,387 Carlisle (145)$ (0.56)$ ‐0.0005 14% 260 Carver 3,478$ 5.00$ 0.0054 17% 695 Cataumet 842$ 7.02$ 0.0108 16% 120 Centerville 4,477$ 3.56$ 0.0044 21% 1,256 Charlemont 2,738$ 21.91$ 0.0387 18% 125 Charlestown (2,290)$ (2.14)$ ‐0.0032 14% 1,068 Charlton 28,209$ 25.08$ 0.0266 22% 1,125 Chatham 6,161$ 9.36$ 0.0108 17% 658 Chelmsford 49,319$ 24.96$ 0.0343 14% 1,976 Chelsea 24,652$ 5.74$ 0.0119 33% 4,293 Cheshire 6,216$ 18.45$ 0.0327 22% 337 Chester 114$ 12.62$ 0.0319 14% 9 Chesterfield 835$ 13.69$ 0.0277 10% 61 Chestnut Hill 8,979$ 9.40$ 0.0091 14% 955 Chicopee 37$ 37.28$ 0.0402 20% 1
Prepared for the Massachusetts Attorney General’s Office 2/12

Are Residential Consumers Benefiting from Electric Supply Competition?2021 Update
Appendix 2BSeptember 2018
Municipality Total
Consumer Loss in Month
Average Per Household Loss
in Month
Premium (per kWh)
% of Households
Participating in Competitive Supply Market
# Competitive Supply Accounts
Chilmark 2,208$ 12.13$ 0.0113 11% 182 Clarksburg 2,701$ 18.89$ 0.0312 19% 143 Clinton 32,390$ 19.65$ 0.0315 25% 1,648 Cohasset 14,327$ 34.52$ 0.0354 13% 415 Colrain 1,952$ 11.76$ 0.0192 19% 166 Concord 58$ 29.24$ 0.0302 11% 2 Conway 1,292$ 10.95$ 0.0170 14% 118 Cotuit 1,900$ 4.69$ 0.0067 17% 405 Cummaquid 1,103$ 9.19$ 0.0098 24% 120 Cummington 286$ 4.61$ 0.0093 12% 62 Dalton 4,469$ 9.76$ 0.0168 16% 458 Dartmouth 20$ 19.72$ 0.0546 50% 1 Dedham 16,565$ 10.16$ 0.0128 17% 1,631 Deerfield 245$ 3.36$ 0.0040 14% 73 Dennis 2,960$ 5.25$ 0.0066 18% 564 Dennis Port 2,661$ 4.72$ 0.0090 12% 564 Dighton 13,369$ 32.53$ 0.0320 16% 411 Dorchester 116,741$ 7.31$ 0.0145 32% 15,974 Douglas 18,820$ 28.01$ 0.0321 18% 672 Dover 1,197$ 4.23$ 0.0029 14% 283 Dracut 51,277$ 25.46$ 0.0322 16% 2,014 Dudley 26,464$ 23.42$ 0.0293 25% 1,130 Dunstable 7,003$ 32.72$ 0.0303 18% 214 Duxbury 3,889$ 4.44$ 0.0044 14% 875 East Boston 28,497$ 7.41$ 0.0164 25% 3,845 East Bridgewater 33,563$ 29.86$ 0.0301 22% 1,124 East Brookfield 6,361$ 24.00$ 0.0310 26% 265 East Cambridge 5,174$ 6.17$ 0.0135 12% 838 East Dennis 730$ 2.77$ 0.0031 15% 264 East Falmouth 11,528$ 6.52$ 0.0085 21% 1,769 East Freetown 1,399$ 4.74$ 0.0059 15% 295 East Harwich 1,230$ 2.92$ 0.0035 20% 421 East Longmeadow 39,688$ 31.50$ 0.0334 21% 1,260 East Orleans 2,128$ 11.08$ 0.0112 14% 192 East Otis 570$ 6.63$ 0.0157 9% 86
Prepared for the Massachusetts Attorney General’s Office 3/12

Are Residential Consumers Benefiting from Electric Supply Competition?2021 Update
Appendix 2BSeptember 2018
Municipality Total
Consumer Loss in Month
Average Per Household Loss
in Month
Premium (per kWh)
% of Households
Participating in Competitive Supply Market
# Competitive Supply Accounts
East Sandwich 926$ 1.76$ 0.0023 18% 527 East Walpole 2,187$ 10.27$ 0.0124 12% 213 East Wareham 3,274$ 6.32$ 0.0083 25% 518 Eastham 4,296$ 7.64$ 0.0096 16% 562 Easthampton 12,466$ 10.97$ 0.0190 15% 1,136 Easton 48,644$ 28.94$ 0.0318 19% 1,681 Edgartown 5,855$ 7.25$ 0.0081 16% 808 Egremont 5,875$ 33.38$ 0.0416 18% 176 Erving 653$ 15.18$ 0.0246 11% 43 Essex 7,357$ 32.27$ 0.0394 13% 228 Everett 111,416$ 23.39$ 0.0397 29% 4,763 Fairhaven 10,458$ 9.00$ 0.0121 16% 1,162 Fall River 201,267$ 21.74$ 0.0376 28% 9,259 Falmouth 6,367$ 6.75$ 0.0112 17% 943 Feeding Hills 8,577$ 10.93$ 0.0122 17% 785 Fitchburg 48,073$ 12.63$ 0.0311 21% 3,805 Florida‐Drury 1,087$ 15.31$ 0.0312 19% 71 Forestdale 935$ 3.02$ 0.0037 20% 310 Foxboro 32,759$ 31.08$ 0.0356 14% 1,054 Framingham 33,174$ 5.29$ 0.0088 24% 6,271 Franklin 67,299$ 30.07$ 0.0319 19% 2,238 Gardner 33,918$ 17.21$ 0.0354 22% 1,971 Gill 969$ 9.79$ 0.0145 15% 99 Gloucester 71,295$ 24.97$ 0.0380 19% 2,855 Goshen 1,013$ 16.07$ 0.0353 10% 63 Grafton 34,955$ 26.97$ 0.0317 17% 1,296 Granby 27,228$ 38.68$ 0.0319 27% 704 Granville 83$ 6.37$ 0.0090 2% 13 Green Harbor 191$ 7.95$ 0.0146 11% 24 Greenfield 12,704$ 11.32$ 0.0207 13% 1,122 Gt Barrington 15,980$ 20.81$ 0.0321 21% 768 Hadley 76$ 3.79$ 0.0115 1% 20 Halifax 14,665$ 22.60$ 0.0247 21% 649 Hamilton 16,065$ 35.38$ 0.0372 16% 454 Hampden 12,671$ 30.68$ 0.0309 21% 413
Prepared for the Massachusetts Attorney General’s Office 4/12

Are Residential Consumers Benefiting from Electric Supply Competition?2021 Update
Appendix 2BSeptember 2018
Municipality Total
Consumer Loss in Month
Average Per Household Loss
in Month
Premium (per kWh)
% of Households
Participating in Competitive Supply Market
# Competitive Supply Accounts
Hancock 924$ 10.26$ 0.0204 13% 90 Hanover 28,050$ 35.15$ 0.0322 16% 798 Hanson 20,990$ 28.40$ 0.0295 19% 739 Hardwick 5,393$ 20.99$ 0.0316 20% 257 Harvard 8,946$ 29.43$ 0.0298 15% 304 Harwich 1,545$ 1.95$ 0.0029 20% 791 Harwich Port 3,722$ 10.98$ 0.0127 15% 339 Hatfield 2,557$ 17.88$ 0.0259 12% 143 Haverhill 121,733$ 25.50$ 0.0390 19% 4,773 Hawley 511$ 12.16$ 0.0186 21% 42 Heath 2,011$ 19.34$ 0.0353 18% 104 Hingham 124$ 24.82$ 0.0256 17% 5 Hinsdale 1,259$ 8.34$ 0.0142 13% 151 Holbrook 25,739$ 25.33$ 0.0331 24% 1,016 Holland 6,166$ 19.15$ 0.0242 22% 322 Holliston 4,896$ 7.14$ 0.0081 13% 686 Hopedale 12,968$ 25.18$ 0.0285 24% 515 Hopkinton 4,023$ 5.13$ 0.0044 12% 784 Hubbardston 8,180$ 21.36$ 0.0282 21% 383 Humarock 330$ 4.78$ 0.0097 10% 69 Huntington 1,849$ 17.61$ 0.0259 10% 105 Hyannis 6,991$ 2.96$ 0.0046 32% 2,363 Hyannis Port 72$ 1.64$ 0.0018 12% 44 Hyde Park 28,653$ 7.67$ 0.0136 31% 3,735 Indian Orchard 13,222$ 14.34$ 0.0243 25% 922 Jamaica Plain 18,269$ 6.65$ 0.0133 18% 2,747 Kingston 3,699$ 5.06$ 0.0053 14% 731 Lake Pleasant 52$ 5.79$ 0.0063 10% 9 Lakeville 285$ 4.19$ 0.0050 16% 68 Lancaster 10,750$ 24.49$ 0.0303 16% 439 Lanesborough 1,600$ 8.04$ 0.0120 13% 199 Lawrence 190,832$ 25.61$ 0.0407 29% 7,451 Lee 563$ 0.99$ 0.0016 19% 569 Leicester 41,818$ 31.11$ 0.0264 29% 1,344 Lenox 7,836$ 21.89$ 0.0319 14% 358
Prepared for the Massachusetts Attorney General’s Office 5/12

Are Residential Consumers Benefiting from Electric Supply Competition?2021 Update
Appendix 2BSeptember 2018
Municipality Total
Consumer Loss in Month
Average Per Household Loss
in Month
Premium (per kWh)
% of Households
Participating in Competitive Supply Market
# Competitive Supply Accounts
Lenoxdale 145$ 8.08$ 0.0187 8% 18 Leominster 96,513$ 22.26$ 0.0315 25% 4,336 Leverett 1,304$ 10.35$ 0.0204 15% 126 Lexington 11,484$ 7.49$ 0.0099 13% 1,534 Leyden 562$ 11.46$ 0.0204 14% 49 Lincoln 4,530$ 12.73$ 0.0129 16% 356 Longmeadow 15,667$ 15.89$ 0.0174 17% 986 Lowell 242,746$ 22.11$ 0.0350 28% 10,977 Ludlow 15,116$ 11.43$ 0.0169 15% 1,322 Lunenburg 1,788$ 0.37$ 0.0269 48% 4,805 Lynn 274,113$ 27.05$ 0.0397 30% 10,134 Malden 112,275$ 20.92$ 0.0371 21% 5,368 Manchester 12,348$ 35.48$ 0.0421 14% 348 Manomet 315$ 8.99$ 0.0136 12% 35 Marion 2,822$ 6.93$ 0.0078 15% 407 Marlboro 75,345$ 21.28$ 0.0345 21% 3,540 Marshfield 7,345$ 4.29$ 0.0055 16% 1,711 Marshfld Hls 206$ 10.30$ 0.0145 14% 20 Marstons Mls 2,283$ 3.31$ 0.0041 21% 689 Mashpee 5,136$ 2.40$ 0.0032 20% 2,144 Mattapan 20,292$ 6.37$ 0.0131 40% 3,185 Mattapoisett 3,390$ 7.21$ 0.0081 14% 470 Maynard 4,374$ 6.33$ 0.0101 15% 691 Medfield 4,759$ 8.11$ 0.0086 13% 587 Medford 101,688$ 25.93$ 0.0398 17% 3,921 Medway 3,433$ 4.62$ 0.0062 16% 743 Melrose 37,954$ 28.20$ 0.0408 11% 1,346 Mendon 11,905$ 27.82$ 0.0263 19% 428 Methuen 113,565$ 29.34$ 0.0350 21% 3,870 Middlefield 244$ 8.71$ 0.0181 10% 28 Milford 70,373$ 24.44$ 0.0321 25% 2,880 Millbury 28,705$ 23.21$ 0.0302 21% 1,237 Millers Falls 578$ 10.90$ 0.0143 14% 53 Millis 2,923$ 5.91$ 0.0060 15% 495 Millville 6,001$ 20.91$ 0.0254 24% 287
Prepared for the Massachusetts Attorney General’s Office 6/12

Are Residential Consumers Benefiting from Electric Supply Competition?2021 Update
Appendix 2BSeptember 2018
Municipality Total
Consumer Loss in Month
Average Per Household Loss
in Month
Premium (per kWh)
% of Households
Participating in Competitive Supply Market
# Competitive Supply Accounts
Milton 12,447$ 8.09$ 0.0100 16% 1,538 Monroe 165$ 11.01$ 0.0310 20% 15 Monson 17,478$ 22.94$ 0.0294 22% 762 Montague 1,875$ 13.49$ 0.0218 14% 139 Monterey 3,543$ 32.50$ 0.0441 12% 109 Montgomery 648$ 10.80$ 0.0144 16% 60 Monument Bch 978$ 6.61$ 0.0103 17% 148 Mt Washington 777$ 26.80$ 0.0341 18% 29 Nahant 33$ 4.65$ 0.1423 22% 7 Nantucket 19,193$ 29.71$ 0.0268 5% 646 Natick 20,723$ 8.25$ 0.0108 17% 2,512 Needham 20,228$ 13.17$ 0.0115 14% 1,536 New Ashford 71$ 4.45$ 0.0070 13% 16 New Bedford 44,632$ 4.53$ 0.0078 25% 9,852 New Braintree 1,601$ 21.06$ 0.0267 18% 76 New Marlboro 3,029$ 24.23$ 0.0337 12% 125 Newbury 14,487$ 34.09$ 0.0374 14% 425 Newburyport 31,728$ 26.40$ 0.0376 14% 1,202 Newton 7,346$ 9.67$ 0.0134 15% 760 Newton Center 10,854$ 10.80$ 0.0102 15% 1,005 Newton Hlds 5,696$ 13.47$ 0.0170 15% 423 Newton L F 439$ 6.37$ 0.0094 14% 69 Newton U F 1,396$ 9.12$ 0.0149 12% 153 Newtonvlle 6,284$ 12.04$ 0.0160 15% 522 Norfolk 2,581$ 5.10$ 0.0054 14% 506 North Adams 26,775$ 18.96$ 0.0363 23% 1,412 North Andover 42,970$ 23.85$ 0.0320 16% 1,802 North Brookfield 10,000$ 20.12$ 0.0288 24% 497 North Cambridge 10,715$ 10.61$ 0.0237 11% 1,010 North Carver (81)$ (2.25)$ ‐0.0024 17% 36 North Chatham 2,094$ 11.20$ 0.0110 17% 187 North Dartmouth 4,859$ 5.02$ 0.0073 14% 968 North Eastham 1,962$ 5.16$ 0.0071 15% 380 North Falmouth 2,408$ 5.92$ 0.0085 15% 407 North Hatfield 280$ 40.03$ 0.0447 5% 7
Prepared for the Massachusetts Attorney General’s Office 7/12

Are Residential Consumers Benefiting from Electric Supply Competition?2021 Update
Appendix 2BSeptember 2018
Municipality Total
Consumer Loss in Month
Average Per Household Loss
in Month
Premium (per kWh)
% of Households
Participating in Competitive Supply Market
# Competitive Supply Accounts
North Truro 2,302$ 11.17$ 0.0140 12% 206 Northampton 46,315$ 21.87$ 0.0396 17% 2,118 Northboro 32,729$ 32.86$ 0.0315 17% 996 Northfield 2,348$ 12.97$ 0.0187 13% 181 Norton 65,607$ 43.56$ 0.0315 12% 1,506 Norwell 23,720$ 39.73$ 0.0318 16% 597 Oak Bluffs 5,379$ 7.80$ 0.0086 16% 690 Oakham 5,303$ 22.38$ 0.0243 27% 237 Ocean Bluff 88$ 4.02$ 0.0073 13% 22 Onset 877$ 1.96$ 0.0030 19% 448 Orange 15,125$ 15.85$ 0.0260 27% 954 Orleans 4,216$ 6.76$ 0.0080 20% 624 Osterville 4,355$ 9.45$ 0.0084 16% 461 Otis 419$ 4.23$ 0.0073 11% 99 Oxford 27,776$ 20.71$ 0.0277 24% 1,341 Palmer 26,034$ 22.23$ 0.0309 21% 1,171 Pelham 931$ 10.58$ 0.0120 15% 88 Pembroke 42,691$ 36.68$ 0.0333 17% 1,164 Pepperell 24,741$ 29.63$ 0.0339 18% 835 Peru 416$ 6.71$ 0.0127 14% 62 Petersham 2,127$ 16.49$ 0.0228 22% 129 Phillipston 3,174$ 20.61$ 0.0293 18% 154 Pittsfield 40,518$ 11.03$ 0.0202 17% 3,672 Plainfield 596$ 8.90$ 0.0188 19% 67 Plainville 18,665$ 28.76$ 0.0360 15% 649 Plymouth 13,673$ 3.33$ 0.0046 16% 4,107 Plympton (113)$ (0.77)$ ‐0.0008 14% 148 Pocasset 2,654$ 5.86$ 0.0104 19% 453 Provincetown 2,036$ 3.08$ 0.0050 14% 661 Quincy 149,842$ 20.21$ 0.0379 18% 7,413 Randolph 79,792$ 22.26$ 0.0312 29% 3,585 Rehoboth 22,732$ 31.23$ 0.0332 16% 728 Revere 116,837$ 24.25$ 0.0402 23% 4,818 Richmond 906$ 7.43$ 0.0104 13% 122 Rochester 604$ 1.89$ 0.0020 15% 319
Prepared for the Massachusetts Attorney General’s Office 8/12

Are Residential Consumers Benefiting from Electric Supply Competition?2021 Update
Appendix 2BSeptember 2018
Municipality Total
Consumer Loss in Month
Average Per Household Loss
in Month
Premium (per kWh)
% of Households
Participating in Competitive Supply Market
# Competitive Supply Accounts
Rockland 50,954$ 30.66$ 0.0349 24% 1,662 Rockport 13,403$ 22.41$ 0.0384 13% 598 Roslindale 23,952$ 8.18$ 0.0149 25% 2,928 Rowe 894$ 19.03$ 0.0379 21% 47 Roxbry Xng 8,017$ 6.77$ 0.0139 23% 1,185 Roxbury 23,259$ 6.35$ 0.0125 36% 3,665 Royalston 2,292$ 21.03$ 0.0327 17% 109 Russell 332$ 17.45$ 0.0186 9% 19 Rutland 15,896$ 21.45$ 0.0290 22% 741 Sagamore 499$ 4.66$ 0.0082 18% 107 Sagamore Bch 492$ 1.95$ 0.0021 17% 252 Salem 77,498$ 25.81$ 0.0406 17% 3,003 Salisbury 12,700$ 19.01$ 0.0324 14% 668 Sandisfield (3)$ (0.06)$ ‐0.0002 18% 49 Sandwich 2,325$ 2.29$ 0.0030 20% 1,014 Saugus 59,056$ 29.63$ 0.0311 19% 1,993 Savoy 447$ 6.04$ 0.0118 20% 74 Scituate 41,088$ 33.06$ 0.0356 16% 1,243 Seekonk 34,520$ 36.30$ 0.0348 17% 951 Sharon 4,731$ 5.65$ 0.0065 13% 837 Sheffield 9,162$ 29.75$ 0.0394 17% 308 Shelburne 270$ 9.32$ 0.0220 13% 29 Shelburne Fls 1,134$ 10.21$ 0.0219 15% 111 Sherborn 2,254$ 10.68$ 0.0089 13% 211 Shirley 11,996$ 23.43$ 0.0312 19% 512 Shutesbury 83$ 5.92$ 0.0077 19% 14 Somerset 42,689$ 26.63$ 0.0387 22% 1,603 Somerville 34,609$ 8.68$ 0.0179 17% 3,988 South Boston 12,145$ 7.91$ 0.0138 7% 1,536 South Carver 341$ 6.08$ 0.0066 11% 56 South Chatham 1,391$ 7.60$ 0.0113 13% 183 South Dartmouth 5,462$ 6.53$ 0.0091 14% 837 South Deerfield 1,601$ 7.05$ 0.0117 13% 227 South Dennis 3,942$ 5.90$ 0.0087 18% 668 South Harwich 719$ 7.41$ 0.0097 16% 97
Prepared for the Massachusetts Attorney General’s Office 9/12

Are Residential Consumers Benefiting from Electric Supply Competition?2021 Update
Appendix 2BSeptember 2018
Municipality Total
Consumer Loss in Month
Average Per Household Loss
in Month
Premium (per kWh)
% of Households
Participating in Competitive Supply Market
# Competitive Supply Accounts
South Lee 87$ 9.64$ 0.0152 15% 9 South Orleans 1,527$ 11.57$ 0.0107 17% 132 South Walpole 195$ 5.56$ 0.0063 10% 35 South Wellfleet 1,328$ 8.68$ 0.0120 14% 153 South Yarmouth 1,851$ 1.67$ 0.0025 23% 1,107 Southampton 3,020$ 9.41$ 0.0118 13% 321 Southborough 21,274$ 30.97$ 0.0241 19% 687 Southbridge 46,965$ 19.79$ 0.0308 33% 2,373 Southwick 11,353$ 17.88$ 0.0175 16% 635 Spencer 28,653$ 20.48$ 0.0281 27% 1,399 Springfield 218,513$ 15.03$ 0.0245 26% 14,537 Stockbridge 7,227$ 31.29$ 0.0348 15% 231 Stoneham 8,847$ 6.15$ 0.0093 15% 1,438 Stoughton 100,814$ 32.98$ 0.0328 26% 3,057 Stow NA NA NA 0% ‐ Sturbridge 21,023$ 20.59$ 0.0255 24% 1,021 Sudbury 6,273$ 7.81$ 0.0074 13% 803 Sunderland 1,930$ 10.61$ 0.0180 9% 182 Sutton 19,512$ 28.74$ 0.0297 19% 679 Swampscott 3,760$ 33.87$ 0.0437 16% 111 Swansea 40,201$ 30.18$ 0.0369 20% 1,332 Teaticket 2,150$ 4.73$ 0.0077 22% 455 Tewksbury 59,156$ 32.68$ 0.0361 15% 1,810 Tolland 420$ 4.46$ 0.0069 18% 94 Townsend 3,079$ 11.40$ 0.0255 7% 270 Truro 2,709$ 11.83$ 0.0141 16% 229 Turners Falls 3,843$ 9.13$ 0.0153 16% 421 Tyngsboro 21,354$ 28.55$ 0.0320 17% 748 Tyringham (33)$ (1.57)$ ‐0.0014 7% 21 Upton 15,894$ 29.11$ 0.0320 19% 546 Uxbridge 24,473$ 19.63$ 0.0277 22% 1,247 Vineyard Hvn 6,204$ 10.94$ 0.0112 18% 567 Vlg Nag Wd 100$ 3.02$ 0.0052 12% 33 Waban 3,597$ 12.07$ 0.0108 13% 298 Wakefield (52)$ (26.09)$ ‐0.0214 8% 2
Prepared for the Massachusetts Attorney General’s Office 10/12

Are Residential Consumers Benefiting from Electric Supply Competition?2021 Update
Appendix 2BSeptember 2018
Municipality Total
Consumer Loss in Month
Average Per Household Loss
in Month
Premium (per kWh)
% of Households
Participating in Competitive Supply Market
# Competitive Supply Accounts
Wales 2,899$ 13.81$ 0.0195 23% 210 Walpole 6,867$ 7.19$ 0.0090 13% 955 Waltham 39,444$ 8.12$ 0.0126 19% 4,858 Waquoit 929$ 3.59$ 0.0047 21% 259 Ware 20,798$ 18.29$ 0.0264 25% 1,137 Wareham 6,830$ 4.66$ 0.0061 22% 1,465 Warren 9,826$ 17.80$ 0.0230 26% 552 Warwick 1,675$ 18.01$ 0.0367 22% 93 Washington 499$ 11.34$ 0.0232 15% 44 Watertown 16,832$ 6.95$ 0.0123 15% 2,421 Wayland 5,483$ 7.22$ 0.0075 15% 759 Webster 42,913$ 21.70$ 0.0314 25% 1,978 Wellfleet 4,098$ 8.70$ 0.0134 15% 471 Wenham 6,502$ 34.77$ 0.0362 15% 187 West Barnstable 1,704$ 5.64$ 0.0059 22% 302 West Bridgewater 12,189$ 25.93$ 0.0330 17% 470 West Brookfield 8,139$ 18.05$ 0.0241 26% 451 West Chatham 673$ 5.91$ 0.0071 13% 114 West Dennis 1,893$ 6.13$ 0.0096 14% 309 West Falmouth 1,482$ 9.94$ 0.0131 15% 149 West Harwich 1,342$ 6.48$ 0.0086 14% 207 West Hatfield 358$ 7.16$ 0.0133 16% 50 West Hyannisprt 453$ 3.65$ 0.0047 17% 124 West Newbury 8,922$ 31.86$ 0.0285 17% 280 West Newton 6,460$ 9.97$ 0.0115 15% 648 West Roxbury 11,717$ 5.29$ 0.0084 20% 2,214 West Somerville 7,967$ 8.50$ 0.0185 9% 937 West Springfield 28,996$ 13.29$ 0.0193 20% 2,182 West Stockbridge 4,157$ 26.82$ 0.0373 18% 155 West Tisbury 5,190$ 15.54$ 0.0145 15% 334 West Townsend NA NA NA 0% ‐ West Wareham 1,332$ 3.62$ 0.0044 24% 368 West Yarmouth 7,057$ 5.47$ 0.0080 21% 1,290 Westboro 25,520$ 25.91$ 0.0327 14% 985 Westford 33,646$ 30.15$ 0.0336 13% 1,116
Prepared for the Massachusetts Attorney General’s Office 11/12

Are Residential Consumers Benefiting from Electric Supply Competition?2021 Update
Appendix 2BSeptember 2018
Municipality Total
Consumer Loss in Month
Average Per Household Loss
in Month
Premium (per kWh)
% of Households
Participating in Competitive Supply Market
# Competitive Supply Accounts
Westhampton 1,136$ 9.46$ 0.0143 15% 120 Westminster 11,651$ 20.95$ 0.0300 17% 556 Weston 5,514$ 9.36$ 0.0057 15% 589 Westport 19,715$ 14.55$ 0.0213 18% 1,355 Westport Pt 359$ 10.57$ 0.0183 14% 34 Westwood 4,367$ 6.13$ 0.0058 13% 713 Weymouth 123,339$ 26.42$ 0.0336 20% 4,668 Whately 1,245$ 18.04$ 0.0210 10% 69 Whitinsville 41,745$ 28.15$ 0.0331 23% 1,483 Whitman 35,471$ 28.89$ 0.0317 22% 1,228 Wht Horse Bch 92$ 6.13$ 0.0118 7% 15 Wilbraham 30,994$ 26.54$ 0.0287 21% 1,168 Williamsburg 3,754$ 19.76$ 0.0340 15% 190 Williamstown 10,829$ 22.80$ 0.0370 16% 475 Winchendon 16,690$ 21.32$ 0.0333 20% 783 Winchester 11,992$ 13.09$ 0.0130 12% 916 Windsor 608$ 7.80$ 0.0155 15% 78 Winthrop 35,180$ 28.46$ 0.0411 16% 1,236 Woburn 16,224$ 5.63$ 0.0088 18% 2,881 Woods Hole 606$ 5.77$ 0.0094 12% 105 Worcester 353,290$ 20.27$ 0.0329 25% 17,428 Woronoco 85$ 3.88$ 0.0065 19% 22 Worthington 926$ 8.42$ 0.0178 16% 110 Wrentham 27,363$ 34.55$ 0.0316 19% 792 Yarmouth Port 3,346$ 4.17$ 0.0049 21% 802
Prepared for the Massachusetts Attorney General’s Office 12/12

Are Residential Consumers Benefiting from Electric Supply Competition? 2021 Update
Prepared for the Massachusetts Attorney General’s Office
Appendix 2C
Consumer Loss, Premium, and Participation by Municipality – Low-Income Households
September 2018 and September 2019

Are Residential Consumers Benefiting from Electric Supply Competition?2021 Update
Appendix 2CSeptember 2019
Municipality Total
Consumer Loss in Month
Average Per Household
Loss in Month
Premium (per kWh)
% of Households Participating in Competitive Supply Market
# Competitive Supply Accounts
Abington 4,206$ 30.48$ 0.0501$ 29% 138 Acton 744$ 8.66$ 0.0232$ 23% 86 Acushnet 1,791$ 13.88$ 0.0230$ 25% 129 Adams 4,522$ 18.53$ 0.0530$ 27% 244 Agawam 2,785$ 12.83$ 0.0214$ 24% 217 Alford 81$ 26.89$ 0.0370$ 30% 3 Allston 1,452$ 10.67$ 0.0278$ 27% 136 Amesbury 3,519$ 29.57$ 0.0566$ 20% 119 Amherst 2,008$ 11.22$ 0.0300$ 23% 179 Andover 1,765$ 27.58$ 0.0523$ 15% 64 Aquinnah 118$ 39.26$ 0.0521$ 18% 3 Arlington 2,185$ 11.56$ 0.0306$ 22% 189 Ashby 616$ 4.19$ 0.0178$ 49% 147 Ashfield 162$ 8.54$ 0.0233$ 22% 19 Ashland 1,440$ 15.16$ 0.0266$ 23% 95 Assonet 272$ 9.40$ 0.0165$ 25% 29 Athol 11,388$ 32.08$ 0.0533$ 30% 355 Attleboro 15,920$ 27.64$ 0.0550$ 29% 576 Auburn 3,040$ 20.97$ 0.0424$ 22% 145 Auburndale 159$ 9.37$ 0.0197$ 20% 17 Avon 1,619$ 29.44$ 0.0516$ 31% 55 Ayer 2,226$ 24.19$ 0.0483$ 33% 92 Barnstable 94$ 15.73$ 0.0224$ 25% 6 Barre 2,274$ 29.92$ 0.0503$ 28% 76 Bass River 351$ 17.54$ 0.0331$ 23% 20 Becket 278$ 11.58$ 0.0244$ 15% 24 Bedford 718$ 21.74$ 0.0317$ 15% 33 Belchertown 3,550$ 21.26$ 0.0464$ 26% 167 Bellingham 262$ 9.37$ 0.0194$ 25% 28 Berlin 338$ 48.31$ 0.0614$ 12% 7 Bernardston 567$ 17.71$ 0.0431$ 22% 32 Beverly 7,825$ 25.08$ 0.0542$ 26% 312 Billerica 7,355$ 43.52$ 0.0566$ 25% 169 Blackstone 3,571$ 35.36$ 0.0470$ 30% 101 Blandford 286$ 35.75$ 0.0473$ 16% 8 Bolton 406$ 33.83$ 0.0528$ 31% 12 Boston 10,580$ 8.53$ 0.0292$ 28% 1,241 Bourne 496$ 9.35$ 0.0171$ 20% 53 Boxford 79$ 19.72$ 0.0399$ 10% 4 Brant Rock 72$ 18.11$ 0.0323$ 33% 4
Appendix 2CConsumer Loss, Premium, and Participation by Municipality ‐ Low‐Income Households
(Sorted Alphabetically)
Prepared for the Massachusetts Attorney General's Office 1 / 11

Are Residential Consumers Benefiting from Electric Supply Competition?2021 Update
Appendix 2CSeptember 2019
Municipality Total
Consumer Loss in Month
Average Per Household
Loss in Month
Premium (per kWh)
% of Households Participating in Competitive Supply Market
# Competitive Supply Accounts
Appendix 2CConsumer Loss, Premium, and Participation by Municipality ‐ Low‐Income Households
(Sorted Alphabetically)
Brewster 877$ 11.85$ 0.0184$ 20% 74 Bridgewater 4,602$ 29.13$ 0.0530$ 26% 158 Brighton 2,622$ 11.70$ 0.0257$ 23% 224 Brimfield 1,143$ 27.88$ 0.0534$ 24% 41 Brockton 70,381$ 22.11$ 0.0462$ 46% 3,183 Brookfield 1,979$ 23.29$ 0.0387$ 35% 85 Brookline 400$ 4.94$ 0.0153$ 15% 81 Buckland 367$ 17.47$ 0.0270$ 17% 21 Burlington 845$ 8.20$ 0.0189$ 20% 103 Buzzards Bay 692$ 16.48$ 0.0266$ 25% 42 Cambridge 5,361$ 11.53$ 0.0327$ 27% 465 Canton 1,841$ 13.74$ 0.0281$ 20% 134 Carlisle 24$ 11.96$ 0.0188$ 8% 2 Carver 1,485$ 13.50$ 0.0192$ 22% 110 Cataumet (15)$ (7.28)$ (0.0156)$ 8% 2 Centerville 1,140$ 16.06$ 0.0216$ 22% 71 Charlemont 942$ 42.84$ 0.0584$ 20% 22 Charlestown 306$ 11.33$ 0.0267$ 20% 27 Charlton 3,236$ 35.56$ 0.0419$ 27% 91 Chatham 493$ 18.95$ 0.0374$ 27% 26 Chelmsford 5,265$ 29.91$ 0.0527$ 27% 176 Chelsea 10,293$ 11.75$ 0.0311$ 36% 876 Cheshire 1,810$ 24.46$ 0.0478$ 29% 74 Chester 18$ 8.75$ 0.0287$ 40% 2 Chesterfield 99$ 11.01$ 0.0320$ 14% 9 Chestnut Hill 425$ 15.17$ 0.0298$ 15% 28 Chicopee NA NA NA 0% ‐ Chilmark (3)$ (1.50)$ (0.0078)$ 13% 2 Clarksburg 652$ 19.77$ 0.0418$ 25% 33 Clinton 6,858$ 28.82$ 0.0479$ 34% 238 Cohasset 208$ 18.90$ 0.0403$ 16% 11 Colrain 729$ 24.29$ 0.0396$ 23% 30 Concord NA NA NA NA ‐ Conway 170$ 13.11$ 0.0251$ 21% 13 Cotuit 375$ 14.99$ 0.0239$ 24% 25 Cummaquid 63$ 12.66$ 0.0291$ 28% 5 Cummington 1$ 0.12$ 0.0002$ 13% 5 Dalton 1,011$ 12.97$ 0.0333$ 18% 78 Dartmouth NA NA NA NA ‐ Dedham 2,605$ 16.38$ 0.0293$ 22% 159
Prepared for the Massachusetts Attorney General's Office 2 / 11

Are Residential Consumers Benefiting from Electric Supply Competition?2021 Update
Appendix 2CSeptember 2019
Municipality Total
Consumer Loss in Month
Average Per Household
Loss in Month
Premium (per kWh)
% of Households Participating in Competitive Supply Market
# Competitive Supply Accounts
Appendix 2CConsumer Loss, Premium, and Participation by Municipality ‐ Low‐Income Households
(Sorted Alphabetically)
Deerfield 3$ 0.47$ 0.0007$ 17% 7 Dennis 69$ 3.45$ 0.0066$ 20% 20 Dennis Port 498$ 11.32$ 0.0215$ 20% 44 Dighton 958$ 23.96$ 0.0427$ 20% 40 Dorchester 75,223$ 14.39$ 0.0323$ 42% 5,226 Douglas 2,068$ 27.57$ 0.0475$ 29% 75 Dover (3)$ (2.52)$ (0.0022)$ 6% 1 Dracut 6,144$ 25.71$ 0.0494$ 24% 239 Dudley 3,165$ 21.98$ 0.0412$ 27% 144 Dunstable 498$ 99.70$ 0.0741$ 21% 5 Duxbury 156$ 4.46$ 0.0083$ 15% 35 East Boston 8,400$ 10.88$ 0.0297$ 36% 772 East Bridgewat 3,592$ 31.51$ 0.0457$ 29% 114 East Brookfield 1,280$ 31.99$ 0.0463$ 41% 40 East Cambridge 1,293$ 12.55$ 0.0344$ 27% 103 East Dennis 89$ 14.91$ 0.0311$ 18% 6 East Falmouth 1,954$ 13.03$ 0.0198$ 27% 150 East Freetown 570$ 14.62$ 0.0273$ 23% 39 East Harwich 266$ 15.66$ 0.0267$ 18% 17 East Longmead 3,148$ 28.36$ 0.0473$ 22% 111 East Orleans (7)$ (2.41)$ (0.0028)$ 11% 3 East Otis 65$ 7.17$ 0.0126$ 29% 9 East Sandwich 223$ 7.97$ 0.0166$ 24% 28 East Walpole 187$ 17.04$ 0.0437$ 10% 11 East Wareham 2,711$ 18.83$ 0.0311$ 32% 144 Eastham 137$ 8.09$ 0.0103$ 16% 17 Easthampton 2,732$ 11.58$ 0.0275$ 22% 236 Easton 4,694$ 28.80$ 0.0481$ 32% 163 Edgartown 397$ 13.69$ 0.0158$ 20% 29 Egremont 129$ 11.72$ 0.0391$ 20% 11 Erving 79$ 6.62$ 0.0152$ 16% 12 Essex 360$ 27.67$ 0.0660$ 19% 13 Everett 18,191$ 22.40$ 0.0563$ 36% 812 Fairhaven 2,761$ 15.87$ 0.0268$ 18% 174 Fall River 97,147$ 25.99$ 0.0536$ 38% 3,738 Falmouth 394$ 7.88$ 0.0209$ 24% 50 Feeding Hills 2,296$ 14.35$ 0.0232$ 23% 160 Fitchburg 23,399$ 14.43$ 0.0611$ 40% 1,622 Florida‐Drury 472$ 29.52$ 0.0600$ 18% 16 Forestdale 338$ 14.08$ 0.0178$ 20% 24
Prepared for the Massachusetts Attorney General's Office 3 / 11

Are Residential Consumers Benefiting from Electric Supply Competition?2021 Update
Appendix 2CSeptember 2019
Municipality Total
Consumer Loss in Month
Average Per Household
Loss in Month
Premium (per kWh)
% of Households Participating in Competitive Supply Market
# Competitive Supply Accounts
Appendix 2CConsumer Loss, Premium, and Participation by Municipality ‐ Low‐Income Households
(Sorted Alphabetically)
Foxboro 2,347$ 24.44$ 0.0500$ 24% 96 Framingham 10,547$ 11.89$ 0.0276$ 34% 887 Franklin 4,227$ 28.18$ 0.0472$ 27% 150 Gardner 9,929$ 21.17$ 0.0500$ 30% 469 Gill 244$ 17.42$ 0.0295$ 18% 14 Gloucester 11,603$ 28.72$ 0.0564$ 25% 404 Goshen 120$ 17.19$ 0.0492$ 19% 7 Grafton 1,735$ 21.16$ 0.0441$ 26% 82 Granby 1,131$ 21.75$ 0.0396$ 25% 52 Granville 41$ 3.72$ 0.0057$ 25% 11 Green Harbor NA NA NA 0% ‐ Greenfield 5,677$ 14.12$ 0.0351$ 21% 402 Gt Barrington 1,780$ 18.74$ 0.0433$ 28% 95 Hadley 185$ 4.62$ 0.0123$ 20% 40 Halifax 1,728$ 24.69$ 0.0447$ 26% 70 Hamilton 559$ 31.06$ 0.0560$ 23% 18 Hampden 698$ 25.86$ 0.0440$ 20% 27 Hancock 120$ 19.98$ 0.0359$ 16% 6 Hanover 1,364$ 30.31$ 0.0451$ 22% 45 Hanson 1,694$ 35.30$ 0.0463$ 21% 48 Hardwick 1,975$ 43.89$ 0.0584$ 24% 45 Harvard 62$ 20.54$ 0.0386$ 14% 3 Harwich 892$ 15.38$ 0.0218$ 24% 58 Harwich Port 10$ 1.07$ 0.0019$ 18% 9 Hatfield 118$ 16.87$ 0.0420$ 9% 7 Haverhill 25,752$ 22.30$ 0.0504$ 34% 1,155 Hawley 43$ 10.72$ 0.0315$ 18% 4 Heath 454$ 32.42$ 0.0611$ 24% 14 Hingham NA NA NA 0% ‐ Hinsdale 309$ 9.66$ 0.0195$ 19% 32 Holbrook 6,166$ 34.25$ 0.0529$ 35% 180 Holland 1,774$ 41.26$ 0.0469$ 31% 43 Holliston 784$ 19.61$ 0.0366$ 16% 40 Hopedale 1,233$ 35.22$ 0.0449$ 28% 35 Hopkinton 505$ 10.74$ 0.0202$ 20% 47 Hubbardston 852$ 21.85$ 0.0469$ 28% 39 Humarock 11$ 10.69$ 0.0587$ 14% 1 Huntington 256$ 12.80$ 0.0269$ 14% 20 Hyannis 6,844$ 16.30$ 0.0279$ 36% 420 Hyannis Port NA NA NA NA ‐
Prepared for the Massachusetts Attorney General's Office 4 / 11

Are Residential Consumers Benefiting from Electric Supply Competition?2021 Update
Appendix 2CSeptember 2019
Municipality Total
Consumer Loss in Month
Average Per Household
Loss in Month
Premium (per kWh)
% of Households Participating in Competitive Supply Market
# Competitive Supply Accounts
Appendix 2CConsumer Loss, Premium, and Participation by Municipality ‐ Low‐Income Households
(Sorted Alphabetically)
Hyde Park 13,548$ 15.24$ 0.0308$ 35% 889 Indian Orchard 6,718$ 14.73$ 0.0279$ 34% 456 Jamaica Plain 4,248$ 12.61$ 0.0328$ 32% 337 Kingston 516$ 7.27$ 0.0103$ 19% 71 Lake Pleasant (14)$ (14.17)$ (0.0110)$ 6% 1 Lakeville 29$ 4.77$ 0.0072$ 30% 6 Lancaster 753$ 25.11$ 0.0376$ 23% 30 Lanesborough 208$ 6.93$ 0.0153$ 16% 30 Lawrence 74,892$ 28.68$ 0.0582$ 34% 2,611 Lee 492$ 8.21$ 0.0229$ 18% 60 Leicester 3,031$ 24.64$ 0.0473$ 27% 123 Lenox 434$ 18.08$ 0.0497$ 22% 24 Lenoxdale NA NA NA 0% ‐ Leominster 20,949$ 28.12$ 0.0488$ 35% 745 Leverett 90$ 12.86$ 0.0184$ 10% 7 Lexington 392$ 8.35$ 0.0225$ 13% 47 Leyden 47$ 11.75$ 0.0324$ 13% 4 Lincoln 65$ 8.11$ 0.0139$ 10% 8 Longmeadow 319$ 7.09$ 0.0206$ 17% 45 Lowell 79,534$ 27.29$ 0.0553$ 43% 2,914 Ludlow 2,860$ 13.95$ 0.0269$ 18% 205 Lunenburg 2,839$ 4.59$ 0.0195$ 50% 618 Lynn 55,401$ 25.32$ 0.0581$ 38% 2,188 Malden 19,012$ 20.87$ 0.0513$ 34% 911 Manchester 139$ 17.36$ 0.0379$ 15% 8 Manomet 50$ 16.50$ 0.0347$ 25% 3 Marion 228$ 9.51$ 0.0196$ 13% 24 Marlboro 10,415$ 24.80$ 0.0566$ 32% 420 Marshfield 1,533$ 12.99$ 0.0261$ 19% 118 Marshfld Hls NA NA NA 0% ‐ Marstons Mls 457$ 9.33$ 0.0126$ 21% 49 Mashpee 2,083$ 12.25$ 0.0226$ 24% 170 Mattapan 12,477$ 13.42$ 0.0275$ 43% 930 Mattapoisett 173$ 6.40$ 0.0123$ 19% 27 Maynard 743$ 8.74$ 0.0180$ 30% 85 Medfield 225$ 9.77$ 0.0205$ 15% 23 Medford 7,157$ 24.02$ 0.0490$ 26% 298 Medway 667$ 15.88$ 0.0282$ 20% 42 Melrose 2,055$ 20.97$ 0.0446$ 21% 98 Mendon 1,027$ 28.52$ 0.0439$ 41% 36
Prepared for the Massachusetts Attorney General's Office 5 / 11
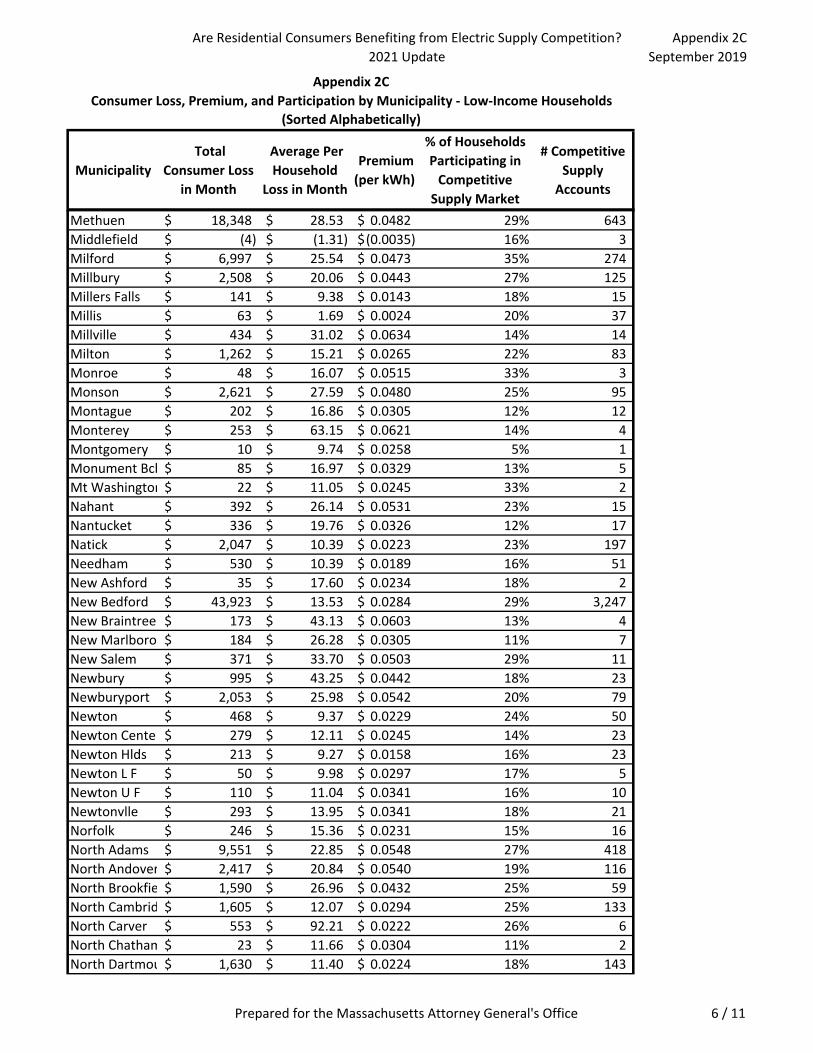
Are Residential Consumers Benefiting from Electric Supply Competition?2021 Update
Appendix 2CSeptember 2019
Municipality Total
Consumer Loss in Month
Average Per Household
Loss in Month
Premium (per kWh)
% of Households Participating in Competitive Supply Market
# Competitive Supply Accounts
Appendix 2CConsumer Loss, Premium, and Participation by Municipality ‐ Low‐Income Households
(Sorted Alphabetically)
Methuen 18,348$ 28.53$ 0.0482$ 29% 643 Middlefield (4)$ (1.31)$ (0.0035)$ 16% 3 Milford 6,997$ 25.54$ 0.0473$ 35% 274 Millbury 2,508$ 20.06$ 0.0443$ 27% 125 Millers Falls 141$ 9.38$ 0.0143$ 18% 15 Millis 63$ 1.69$ 0.0024$ 20% 37 Millville 434$ 31.02$ 0.0634$ 14% 14 Milton 1,262$ 15.21$ 0.0265$ 22% 83 Monroe 48$ 16.07$ 0.0515$ 33% 3 Monson 2,621$ 27.59$ 0.0480$ 25% 95 Montague 202$ 16.86$ 0.0305$ 12% 12 Monterey 253$ 63.15$ 0.0621$ 14% 4 Montgomery 10$ 9.74$ 0.0258$ 5% 1 Monument Bch 85$ 16.97$ 0.0329$ 13% 5 Mt Washington 22$ 11.05$ 0.0245$ 33% 2 Nahant 392$ 26.14$ 0.0531$ 23% 15 Nantucket 336$ 19.76$ 0.0326$ 12% 17 Natick 2,047$ 10.39$ 0.0223$ 23% 197 Needham 530$ 10.39$ 0.0189$ 16% 51 New Ashford 35$ 17.60$ 0.0234$ 18% 2 New Bedford 43,923$ 13.53$ 0.0284$ 29% 3,247 New Braintree 173$ 43.13$ 0.0603$ 13% 4 New Marlboro 184$ 26.28$ 0.0305$ 11% 7 New Salem 371$ 33.70$ 0.0503$ 29% 11 Newbury 995$ 43.25$ 0.0442$ 18% 23 Newburyport 2,053$ 25.98$ 0.0542$ 20% 79 Newton 468$ 9.37$ 0.0229$ 24% 50 Newton Cente 279$ 12.11$ 0.0245$ 14% 23 Newton Hlds 213$ 9.27$ 0.0158$ 16% 23 Newton L F 50$ 9.98$ 0.0297$ 17% 5 Newton U F 110$ 11.04$ 0.0341$ 16% 10 Newtonvlle 293$ 13.95$ 0.0341$ 18% 21 Norfolk 246$ 15.36$ 0.0231$ 15% 16 North Adams 9,551$ 22.85$ 0.0548$ 27% 418 North Andover 2,417$ 20.84$ 0.0540$ 19% 116 North Brookfie 1,590$ 26.96$ 0.0432$ 25% 59 North Cambrid 1,605$ 12.07$ 0.0294$ 25% 133 North Carver 553$ 92.21$ 0.0222$ 26% 6 North Chatham 23$ 11.66$ 0.0304$ 11% 2 North Dartmou 1,630$ 11.40$ 0.0224$ 18% 143
Prepared for the Massachusetts Attorney General's Office 6 / 11

Are Residential Consumers Benefiting from Electric Supply Competition?2021 Update
Appendix 2CSeptember 2019
Municipality Total
Consumer Loss in Month
Average Per Household
Loss in Month
Premium (per kWh)
% of Households Participating in Competitive Supply Market
# Competitive Supply Accounts
Appendix 2CConsumer Loss, Premium, and Participation by Municipality ‐ Low‐Income Households
(Sorted Alphabetically)
North Eastham 222$ 17.07$ 0.0273$ 16% 13 North Falmout 111$ 7.41$ 0.0129$ 22% 15 North Hatfield NA NA NA 0% ‐ North Truro (17)$ (2.77)$ (0.0036)$ 10% 6 Northampton 6,345$ 22.11$ 0.0549$ 25% 287 Northboro 1,495$ 30.51$ 0.0473$ 22% 49 Northfield 391$ 10.28$ 0.0190$ 22% 38 Norton 3,565$ 26.21$ 0.0516$ 23% 136 Norwell 403$ 31.02$ 0.0591$ 17% 13 Oak Bluffs 647$ 20.86$ 0.0254$ 24% 31 Oakham 490$ 28.81$ 0.0507$ 24% 17 Ocean Bluff 36$ 35.63$ 0.0505$ 33% 1 Onset 821$ 13.24$ 0.0199$ 29% 62 Orange 8,188$ 23.39$ 0.0367$ 39% 350 Orleans 356$ 10.78$ 0.0233$ 18% 33 Osterville 149$ 9.93$ 0.0180$ 18% 15 Otis 90$ 17.93$ 0.0231$ 9% 5 Oxford 4,602$ 26.30$ 0.0463$ 30% 175 Palmer 7,220$ 27.66$ 0.0501$ 25% 261 Pelham (83)$ (13.78)$ (0.0117)$ 15% 6 Pembroke 3,306$ 37.57$ 0.0436$ 23% 88 Pepperell 1,802$ 24.03$ 0.0485$ 24% 75 Peru 147$ 9.82$ 0.0199$ 27% 15 Petersham 254$ 28.22$ 0.0412$ 23% 9 Phillipston 707$ 27.19$ 0.0401$ 31% 26 Pittsfield 16,082$ 15.36$ 0.0320$ 24% 1,047 Plainfield 62$ 5.65$ 0.0100$ 23% 11 Plainville 1,677$ 22.07$ 0.0453$ 23% 76 Plymouth 4,167$ 10.24$ 0.0194$ 21% 407 Plympton 10$ 2.05$ 0.0055$ 11% 5 Pocasset 646$ 22.26$ 0.0414$ 24% 29 Provincetown 376$ 7.68$ 0.0162$ 23% 49 Quincy 19,940$ 23.16$ 0.0530$ 33% 861 Randolph 23,104$ 33.20$ 0.0490$ 38% 696 Rehoboth 1,617$ 24.13$ 0.0442$ 29% 67 Revere 16,378$ 24.37$ 0.0530$ 29% 672 Richmond 5$ 0.87$ 0.0012$ 13% 6 Rochester 355$ 11.84$ 0.0145$ 24% 30 Rockland 5,859$ 36.17$ 0.0539$ 28% 162 Rockport 1,091$ 28.71$ 0.0556$ 18% 38
Prepared for the Massachusetts Attorney General's Office 7 / 11
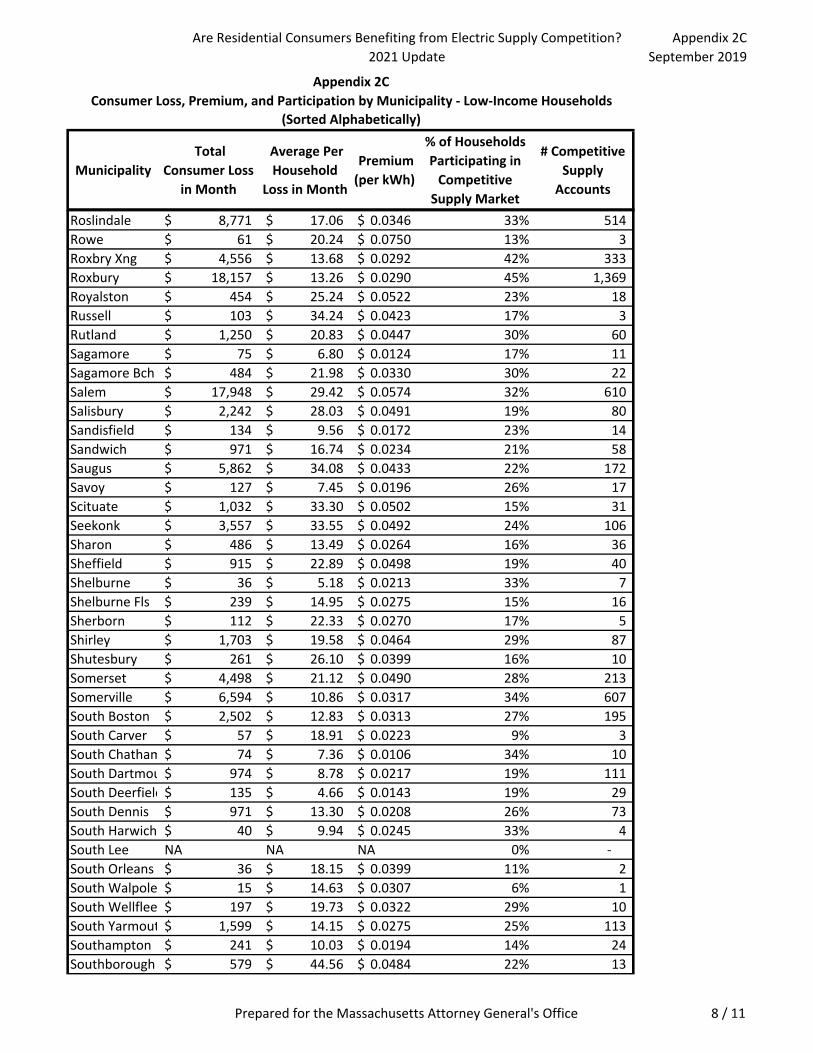
Are Residential Consumers Benefiting from Electric Supply Competition?2021 Update
Appendix 2CSeptember 2019
Municipality Total
Consumer Loss in Month
Average Per Household
Loss in Month
Premium (per kWh)
% of Households Participating in Competitive Supply Market
# Competitive Supply Accounts
Appendix 2CConsumer Loss, Premium, and Participation by Municipality ‐ Low‐Income Households
(Sorted Alphabetically)
Roslindale 8,771$ 17.06$ 0.0346$ 33% 514 Rowe 61$ 20.24$ 0.0750$ 13% 3 Roxbry Xng 4,556$ 13.68$ 0.0292$ 42% 333 Roxbury 18,157$ 13.26$ 0.0290$ 45% 1,369 Royalston 454$ 25.24$ 0.0522$ 23% 18 Russell 103$ 34.24$ 0.0423$ 17% 3 Rutland 1,250$ 20.83$ 0.0447$ 30% 60 Sagamore 75$ 6.80$ 0.0124$ 17% 11 Sagamore Bch 484$ 21.98$ 0.0330$ 30% 22 Salem 17,948$ 29.42$ 0.0574$ 32% 610 Salisbury 2,242$ 28.03$ 0.0491$ 19% 80 Sandisfield 134$ 9.56$ 0.0172$ 23% 14 Sandwich 971$ 16.74$ 0.0234$ 21% 58 Saugus 5,862$ 34.08$ 0.0433$ 22% 172 Savoy 127$ 7.45$ 0.0196$ 26% 17 Scituate 1,032$ 33.30$ 0.0502$ 15% 31 Seekonk 3,557$ 33.55$ 0.0492$ 24% 106 Sharon 486$ 13.49$ 0.0264$ 16% 36 Sheffield 915$ 22.89$ 0.0498$ 19% 40 Shelburne 36$ 5.18$ 0.0213$ 33% 7 Shelburne Fls 239$ 14.95$ 0.0275$ 15% 16 Sherborn 112$ 22.33$ 0.0270$ 17% 5 Shirley 1,703$ 19.58$ 0.0464$ 29% 87 Shutesbury 261$ 26.10$ 0.0399$ 16% 10 Somerset 4,498$ 21.12$ 0.0490$ 28% 213 Somerville 6,594$ 10.86$ 0.0317$ 34% 607 South Boston 2,502$ 12.83$ 0.0313$ 27% 195 South Carver 57$ 18.91$ 0.0223$ 9% 3 South Chatham 74$ 7.36$ 0.0106$ 34% 10 South Dartmou 974$ 8.78$ 0.0217$ 19% 111 South Deerfield 135$ 4.66$ 0.0143$ 19% 29 South Dennis 971$ 13.30$ 0.0208$ 26% 73 South Harwich 40$ 9.94$ 0.0245$ 33% 4 South Lee NA NA NA 0% ‐ South Orleans 36$ 18.15$ 0.0399$ 11% 2 South Walpole 15$ 14.63$ 0.0307$ 6% 1 South Wellflee 197$ 19.73$ 0.0322$ 29% 10 South Yarmout 1,599$ 14.15$ 0.0275$ 25% 113 Southampton 241$ 10.03$ 0.0194$ 14% 24 Southborough 579$ 44.56$ 0.0484$ 22% 13
Prepared for the Massachusetts Attorney General's Office 8 / 11

Are Residential Consumers Benefiting from Electric Supply Competition?2021 Update
Appendix 2CSeptember 2019
Municipality Total
Consumer Loss in Month
Average Per Household
Loss in Month
Premium (per kWh)
% of Households Participating in Competitive Supply Market
# Competitive Supply Accounts
Appendix 2CConsumer Loss, Premium, and Participation by Municipality ‐ Low‐Income Households
(Sorted Alphabetically)
Southbridge 14,758$ 21.61$ 0.0469$ 43% 683 Southwick 1,627$ 20.34$ 0.0241$ 20% 80 Spencer 5,337$ 24.48$ 0.0455$ 32% 218 Springfield 111,080$ 15.18$ 0.0291$ 38% 7,316 Stockbridge 255$ 15.03$ 0.0547$ 22% 17 Stoneham 1,346$ 11.31$ 0.0295$ 18% 119 Stoughton 10,025$ 32.34$ 0.0487$ 33% 310 Sturbridge 1,725$ 17.25$ 0.0425$ 27% 100 Sudbury 357$ 10.19$ 0.0306$ 17% 35 Sunderland 427$ 17.08$ 0.0254$ 21% 25 Sutton 926$ 25.72$ 0.0335$ 24% 36 Swampscott 1,252$ 27.23$ 0.0574$ 21% 46 Swansea 7,252$ 31.81$ 0.0539$ 31% 228 Teaticket 591$ 13.75$ 0.0213$ 29% 43 Tewksbury 6,286$ 43.05$ 0.0538$ 25% 146 Tolland (14)$ (4.72)$ (0.0056)$ 18% 3 Topsfield 422$ 52.71$ 0.0598$ 21% 8 Townsend 694$ 16.92$ 0.0717$ 13% 41 Truro 179$ 14.93$ 0.0257$ 33% 12 Turners Falls 2,081$ 13.17$ 0.0272$ 24% 158 Tyngsboro 2,160$ 27.34$ 0.0452$ 27% 79 Tyringham 13$ 12.56$ 0.0523$ 13% 1 Upton 554$ 16.78$ 0.0504$ 24% 33 Uxbridge 2,125$ 18.64$ 0.0402$ 29% 114 Vineyard Hvn 496$ 14.16$ 0.0206$ 23% 35 Vlg Nag Wd 1$ 0.28$ 0.0007$ 29% 2 Waban 123$ 13.67$ 0.0252$ 16% 9 Wakefield NA NA NA NA ‐ Wales 786$ 17.87$ 0.0360$ 33% 44 Walpole 329$ 8.21$ 0.0145$ 12% 40 Waltham 5,910$ 12.85$ 0.0273$ 29% 460 Waquoit 543$ 16.98$ 0.0288$ 29% 32 Ware 8,784$ 32.06$ 0.0505$ 30% 274 Wareham 3,986$ 17.11$ 0.0269$ 29% 233 Warren 3,090$ 28.35$ 0.0414$ 29% 109 Warwick 342$ 19.00$ 0.0613$ 29% 18 Washington 115$ 14.34$ 0.0341$ 25% 8 Watertown 2,323$ 10.42$ 0.0271$ 24% 223 Wayland 192$ 6.21$ 0.0125$ 22% 31 Webster 9,533$ 24.38$ 0.0490$ 29% 391
Prepared for the Massachusetts Attorney General's Office 9 / 11

Are Residential Consumers Benefiting from Electric Supply Competition?2021 Update
Appendix 2CSeptember 2019
Municipality Total
Consumer Loss in Month
Average Per Household
Loss in Month
Premium (per kWh)
% of Households Participating in Competitive Supply Market
# Competitive Supply Accounts
Appendix 2CConsumer Loss, Premium, and Participation by Municipality ‐ Low‐Income Households
(Sorted Alphabetically)
Wellfleet 135$ 7.12$ 0.0106$ 17% 19 Wendall 0$ 0.43$ 0.0066$ 33% 1 Wenham 41$ 10.26$ 0.0319$ 15% 4 West Barnstab 239$ 15.93$ 0.0355$ 23% 15 West Bridgewa 1,222$ 18.80$ 0.0383$ 29% 65 West Brookfiel 1,362$ 20.03$ 0.0332$ 35% 68 West Chatham 5$ 4.63$ 0.0138$ 4% 1 West Dennis 182$ 13.02$ 0.0318$ 21% 14 West Falmouth 25$ 12.28$ 0.0469$ 25% 2 West Harwich 101$ 7.80$ 0.0112$ 25% 13 West Hatfield 156$ 14.14$ 0.0320$ 26% 11 West Hyannisp 120$ 13.29$ 0.0218$ 36% 9 West Newbury 361$ 45.13$ 0.0444$ 21% 8 West Newton 389$ 14.95$ 0.0273$ 16% 26 West Roxbury 1,931$ 9.61$ 0.0230$ 28% 201 West Somervil 752$ 12.33$ 0.0348$ 22% 61 West Springfie 9,178$ 13.86$ 0.0262$ 32% 662 West Stockbrid 421$ 23.38$ 0.0603$ 25% 18 West Tisbury 51$ 5.13$ 0.0067$ 14% 10 West Wareham 1,081$ 15.66$ 0.0238$ 28% 69 West Yarmouth 2,429$ 16.99$ 0.0260$ 28% 143 Westboro 1,015$ 29.87$ 0.0466$ 18% 34 Westford 1,683$ 31.17$ 0.0595$ 20% 54 Westhampton 16$ 2.65$ 0.0045$ 13% 6 Westminster 880$ 22.56$ 0.0405$ 20% 39 Weston 83$ 5.93$ 0.0134$ 20% 14 Westport 2,936$ 15.78$ 0.0324$ 27% 186 Westport Pt NA NA NA 0% ‐ Westwood 317$ 12.68$ 0.0281$ 11% 25 Weymouth 16,459$ 31.23$ 0.0532$ 30% 527 Whately 103$ 14.73$ 0.0277$ 15% 7 Whitinsville 6,361$ 34.76$ 0.0535$ 26% 183 Whitman 4,033$ 27.25$ 0.0471$ 29% 148 Wht Horse Bch NA NA NA 0% ‐ Wilbraham 2,392$ 21.17$ 0.0432$ 28% 113 Williamsburg 300$ 27.26$ 0.0576$ 13% 11 Williamstown 1,260$ 26.25$ 0.0584$ 24% 48 Winchendon 3,233$ 15.77$ 0.0292$ 35% 205 Winchester 536$ 17.86$ 0.0289$ 18% 30 Windsor 124$ 13.80$ 0.0227$ 23% 9
Prepared for the Massachusetts Attorney General's Office 10 / 11

Are Residential Consumers Benefiting from Electric Supply Competition?2021 Update
Appendix 2CSeptember 2019
Municipality Total
Consumer Loss in Month
Average Per Household
Loss in Month
Premium (per kWh)
% of Households Participating in Competitive Supply Market
# Competitive Supply Accounts
Appendix 2CConsumer Loss, Premium, and Participation by Municipality ‐ Low‐Income Households
(Sorted Alphabetically)
Winthrop 2,772$ 25.43$ 0.0520$ 21% 109 Woburn 3,519$ 10.86$ 0.0220$ 26% 324 Woods Hole (0)$ (0.17)$ (0.0012)$ 20% 1 Worcester 104,517$ 24.71$ 0.0506$ 36% 4,230 Woronoco 91$ 22.71$ 0.0327$ 21% 4 Worthington 79$ 7.91$ 0.0286$ 17% 10 Wrentham 1,097$ 28.12$ 0.0463$ 21% 39 Yarmouth Port 604$ 12.85$ 0.0174$ 28% 47
Prepared for the Massachusetts Attorney General's Office 11 / 11

Are Residential Consumers Benefiting from Electric Supply Competition?2021 Update
Appendix 2CSeptember 2018
Municipality Total
Consumer Loss in Month
Average Per Household Loss in Month
Premium (per kWh)
% of Households
Participating in Competitive Supply Market
# Competitive Supply Accounts
Abington 3,707$ 26.67$ 0.0313 27% 139 Acton 131$ 1.55$ 0.0036 23% 85 Acushnet 270$ 1.96$ 0.0030 27% 138 Adams 4,473$ 16.44$ 0.0364 30% 272 Agawam 3,202$ 13.68$ 0.0175 27% 234 Alford 84$ 21.09$ 0.0431 36% 4 Allston 528$ 3.38$ 0.0080 29% 156 Amesbury 3,813$ 28.67$ 0.0448 22% 133 Amherst 1,368$ 10.37$ 0.0257 18% 132 Andover 1,365$ 20.08$ 0.0347 16% 68 Aquinnah 11$ 10.97$ 0.0281 6% 1 Arlington 1,437$ 7.77$ 0.0172 22% 185 Ashby 589$ 3.78$ 0.0099 49% 156 Ashfield 231$ 8.57$ 0.0227 32% 27 Ashland 413$ 5.29$ 0.0081 20% 78 Assonet 75$ 2.60$ 0.0036 25% 29 Athol 11,797$ 30.64$ 0.0397 32% 385 Attleboro 15,212$ 23.84$ 0.0384 31% 638 Auburn 3,455$ 22.73$ 0.0328 23% 152 Auburndale 53$ 4.46$ 0.0082 16% 12 Avon 1,107$ 22.13$ 0.0334 29% 50 Ayer 2,192$ 21.28$ 0.0349 34% 103 Barnstable 46$ 5.75$ 0.0082 32% 8 Barre 1,535$ 18.06$ 0.0320 32% 85 Bass River 90$ 3.34$ 0.0068 28% 27 Becket 299$ 9.34$ 0.0155 19% 32 Bedford 286$ 9.53$ 0.0131 14% 30 Belchertown 4,460$ 20.65$ 0.0350 32% 216 Bellingham 2,392$ 20.10$ 0.0261 26% 119 Berlin 324$ 20.25$ 0.0229 27% 16 Bernardston 401$ 19.08$ 0.0296 16% 21 Beverly 7,417$ 21.13$ 0.0392 28% 351 Billerica 6,441$ 30.67$ 0.0370 27% 210 Blackstone 3,063$ 30.33$ 0.0368 31% 101
Appendix 2CConsumer Loss, Premium, and Participation by Municipality ‐ Low‐Income Households
(Sorted Alphabetically)
Prepared for the Massachusetts Attorney General’s Office 1/12

Are Residential Consumers Benefiting from Electric Supply Competition?2021 Update
Appendix 2CSeptember 2018
Municipality Total
Consumer Loss in Month
Average Per Household Loss in Month
Premium (per kWh)
% of Households
Participating in Competitive Supply Market
# Competitive Supply Accounts
Appendix 2CConsumer Loss, Premium, and Participation by Municipality ‐ Low‐Income Households
(Sorted Alphabetically)
Blandford 47$ 4.69$ 0.0078 18% 10 Bolton 389$ 32.45$ 0.0391 33% 12 Boston 4,483$ 3.55$ 0.0108 28% 1,264 Bourne (14)$ (0.27)$ ‐0.0004 21% 51 Boxford 79$ 15.77$ 0.0272 10% 5 Brant Rock (26)$ (8.64)$ ‐0.0092 21% 3 Brewster 62$ 0.86$ 0.0013 21% 72 Bridgewater 4,631$ 27.40$ 0.0345 29% 169 Brighton 1,202$ 5.09$ 0.0115 24% 236 Brimfield 1,235$ 28.71$ 0.0436 25% 43 Brockton 75,665$ 22.47$ 0.0363 45% 3,368 Brookfield 1,902$ 20.02$ 0.0291 38% 95 Brookline 61$ 0.67$ 0.0016 15% 91 Buckland 368$ 14.15$ 0.0254 20% 26 Burlington 409$ 3.43$ 0.0061 23% 119 Buzzards Bay 102$ 3.09$ 0.0048 19% 33 Cambridge 2,618$ 5.75$ 0.0144 27% 455 Canton 197$ 1.50$ 0.0024 20% 131 Carlisle (8)$ (1.59)$ ‐0.0023 19% 5 Carver 221$ 1.99$ 0.0025 23% 111 Cataumet (43)$ (21.62)$ ‐0.0441 7% 2 Centerville (132)$ (1.85)$ ‐0.0025 21% 71 Charlemont 763$ 28.26$ 0.0375 24% 27 Charlestown 148$ 4.76$ 0.0130 22% 31 Charlton 2,498$ 27.15$ 0.0279 26% 92 Chatham 76$ 2.46$ 0.0044 32% 31 Chelmsford 4,306$ 21.75$ 0.0339 29% 198 Chelsea 4,488$ 4.52$ 0.0099 40% 993 Cheshire 1,410$ 17.41$ 0.0325 33% 81 Chester 24$ 11.99$ 0.0332 50% 2 Chesterfield 69$ 6.89$ 0.0160 15% 10 Chestnut Hill 214$ 8.93$ 0.0127 14% 24 Chicopee NA NA NA NA ‐ Chilmark NA NA NA 0% ‐
Prepared for the Massachusetts Attorney General’s Office 2/12
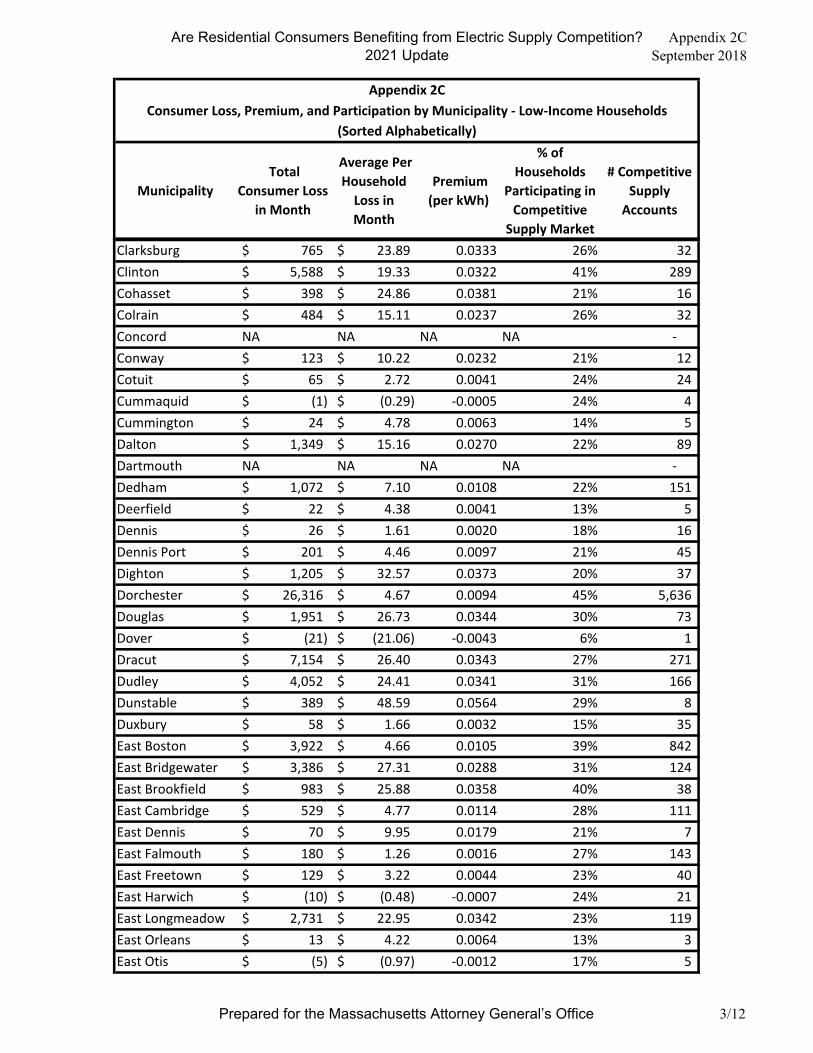
Are Residential Consumers Benefiting from Electric Supply Competition?2021 Update
Appendix 2CSeptember 2018
Municipality Total
Consumer Loss in Month
Average Per Household Loss in Month
Premium (per kWh)
% of Households
Participating in Competitive Supply Market
# Competitive Supply Accounts
Appendix 2CConsumer Loss, Premium, and Participation by Municipality ‐ Low‐Income Households
(Sorted Alphabetically)
Clarksburg 765$ 23.89$ 0.0333 26% 32 Clinton 5,588$ 19.33$ 0.0322 41% 289 Cohasset 398$ 24.86$ 0.0381 21% 16 Colrain 484$ 15.11$ 0.0237 26% 32 Concord NA NA NA NA ‐ Conway 123$ 10.22$ 0.0232 21% 12 Cotuit 65$ 2.72$ 0.0041 24% 24 Cummaquid (1)$ (0.29)$ ‐0.0005 24% 4 Cummington 24$ 4.78$ 0.0063 14% 5 Dalton 1,349$ 15.16$ 0.0270 22% 89 Dartmouth NA NA NA NA ‐ Dedham 1,072$ 7.10$ 0.0108 22% 151 Deerfield 22$ 4.38$ 0.0041 13% 5 Dennis 26$ 1.61$ 0.0020 18% 16 Dennis Port 201$ 4.46$ 0.0097 21% 45 Dighton 1,205$ 32.57$ 0.0373 20% 37 Dorchester 26,316$ 4.67$ 0.0094 45% 5,636 Douglas 1,951$ 26.73$ 0.0344 30% 73 Dover (21)$ (21.06)$ ‐0.0043 6% 1 Dracut 7,154$ 26.40$ 0.0343 27% 271 Dudley 4,052$ 24.41$ 0.0341 31% 166 Dunstable 389$ 48.59$ 0.0564 29% 8 Duxbury 58$ 1.66$ 0.0032 15% 35 East Boston 3,922$ 4.66$ 0.0105 39% 842 East Bridgewater 3,386$ 27.31$ 0.0288 31% 124 East Brookfield 983$ 25.88$ 0.0358 40% 38 East Cambridge 529$ 4.77$ 0.0114 28% 111 East Dennis 70$ 9.95$ 0.0179 21% 7 East Falmouth 180$ 1.26$ 0.0016 27% 143 East Freetown 129$ 3.22$ 0.0044 23% 40 East Harwich (10)$ (0.48)$ ‐0.0007 24% 21 East Longmeadow 2,731$ 22.95$ 0.0342 23% 119 East Orleans 13$ 4.22$ 0.0064 13% 3 East Otis (5)$ (0.97)$ ‐0.0012 17% 5
Prepared for the Massachusetts Attorney General’s Office 3/12

Are Residential Consumers Benefiting from Electric Supply Competition?2021 Update
Appendix 2CSeptember 2018
Municipality Total
Consumer Loss in Month
Average Per Household Loss in Month
Premium (per kWh)
% of Households
Participating in Competitive Supply Market
# Competitive Supply Accounts
Appendix 2CConsumer Loss, Premium, and Participation by Municipality ‐ Low‐Income Households
(Sorted Alphabetically)
East Sandwich 80$ 2.49$ 0.0055 25% 32 East Walpole (18)$ (1.48)$ ‐0.0021 14% 12 East Wareham 479$ 2.87$ 0.0042 37% 167 Eastham 156$ 9.19$ 0.0113 15% 17 Easthampton 2,979$ 12.41$ 0.0232 24% 240 Easton 4,268$ 27.36$ 0.0364 32% 156 Edgartown (248)$ (7.75)$ ‐0.0092 21% 32 Egremont 120$ 10.03$ 0.0247 24% 12 Erving 109$ 8.35$ 0.0164 18% 13 Essex 378$ 19.88$ 0.0421 24% 19 Everett 21,836$ 23.18$ 0.0395 38% 942 Fairhaven 571$ 3.44$ 0.0049 18% 166 Fall River 71,184$ 21.38$ 0.0385 39% 3,329 Falmouth 117$ 2.30$ 0.0049 25% 51 Feeding Hills 2,439$ 14.78$ 0.0189 25% 165 Fitchburg 20,902$ 9.76$ 0.0363 46% 2,142 Florida‐Drury 464$ 23.18$ 0.0503 22% 20 Forestdale (15)$ (0.58)$ ‐0.0006 23% 26 Foxboro 2,799$ 25.45$ 0.0383 27% 110 Framingham 3,067$ 3.51$ 0.0067 34% 873 Franklin 4,260$ 27.31$ 0.0371 28% 156 Gardner 9,234$ 17.83$ 0.0381 31% 518 Gill 129$ 9.89$ 0.0145 18% 13 Gloucester 12,649$ 25.10$ 0.0461 29% 504 Goshen 169$ 21.08$ 0.0398 23% 8 Grafton 2,789$ 29.99$ 0.0385 29% 93 Granby 2,256$ 31.33$ 0.0271 30% 72 Granville NA NA NA 0% ‐ Green Harbor (6)$ (5.66)$ ‐0.0160 14% 1 Greenfield 5,254$ 12.97$ 0.0246 22% 405 Gt Barrington 2,212$ 20.67$ 0.0351 30% 107 Hadley 4$ 1.28$ 0.0092 2% 3 Halifax 1,781$ 20.24$ 0.0279 32% 88 Hamilton 677$ 30.77$ 0.0439 25% 22
Prepared for the Massachusetts Attorney General’s Office 4/12

Are Residential Consumers Benefiting from Electric Supply Competition?2021 Update
Appendix 2CSeptember 2018
Municipality Total
Consumer Loss in Month
Average Per Household Loss in Month
Premium (per kWh)
% of Households
Participating in Competitive Supply Market
# Competitive Supply Accounts
Appendix 2CConsumer Loss, Premium, and Participation by Municipality ‐ Low‐Income Households
(Sorted Alphabetically)
Hampden 1,188$ 33.01$ 0.0309 28% 36 Hancock 54$ 10.83$ 0.0174 14% 5 Hanover 1,140$ 24.25$ 0.0325 23% 47 Hanson 1,133$ 19.88$ 0.0211 24% 57 Hardwick 971$ 19.05$ 0.0301 27% 51 Harvard 12$ 3.88$ 0.0104 13% 3 Harwich 108$ 1.97$ 0.0030 23% 55 Harwich Port (50)$ (4.57)$ ‐0.0083 21% 11 Hatfield 116$ 11.62$ 0.0222 14% 10 Haverhill 32,185$ 26.02$ 0.0420 31% 1,237 Hawley 178$ 22.23$ 0.0433 32% 8 Heath 709$ 32.24$ 0.0548 35% 22 Hingham NA NA NA 0% ‐ Hinsdale 267$ 8.35$ 0.0163 20% 32 Holbrook 4,126$ 23.18$ 0.0340 33% 178 Holland 1,090$ 27.26$ 0.0288 31% 40 Holliston 72$ 1.56$ 0.0029 19% 46 Hopedale 1,219$ 31.25$ 0.0395 29% 39 Hopkinton (114)$ (3.92)$ ‐0.0048 13% 29 Hubbardston 771$ 18.35$ 0.0307 32% 42 Humarock 10$ 9.94$ 0.0230 11% 1 Huntington 265$ 12.03$ 0.0212 16% 22 Hyannis 689$ 1.54$ 0.0026 38% 448 Hyannis Port NA NA NA 0% ‐ Hyde Park 4,270$ 4.64$ 0.0084 37% 921 Indian Orchard 8,312$ 16.30$ 0.0273 37% 510 Jamaica Plain 1,680$ 4.63$ 0.0103 35% 363 Kingston (74)$ (1.00)$ ‐0.0012 20% 74 Lake Pleasant (13)$ (6.26)$ ‐0.0035 11% 2 Lakeville 7$ 1.87$ 0.0025 20% 4 Lancaster 768$ 20.22$ 0.0262 29% 38 Lanesborough 179$ 5.77$ 0.0094 18% 31 Lawrence 86,930$ 26.82$ 0.0415 38% 3,241 Lee 423$ 6.32$ 0.0151 21% 67
Prepared for the Massachusetts Attorney General’s Office 5/12

Are Residential Consumers Benefiting from Electric Supply Competition?2021 Update
Appendix 2CSeptember 2018
Municipality Total
Consumer Loss in Month
Average Per Household Loss in Month
Premium (per kWh)
% of Households
Participating in Competitive Supply Market
# Competitive Supply Accounts
Appendix 2CConsumer Loss, Premium, and Participation by Municipality ‐ Low‐Income Households
(Sorted Alphabetically)
Leicester 6,216$ 35.73$ 0.0300 35% 174 Lenox 548$ 17.13$ 0.0418 23% 32 Lenoxdale (5)$ (4.51)$ ‐0.0282 5% 1 Leominster 18,219$ 21.38$ 0.0345 37% 852 Leverett 103$ 7.91$ 0.0159 18% 13 Lexington 345$ 6.76$ 0.0170 14% 51 Leyden 105$ 21.05$ 0.0371 17% 5 Lincoln (89)$ (14.90)$ ‐0.0154 8% 6 Longmeadow 699$ 13.99$ 0.0281 19% 50 Lowell 75,743$ 23.51$ 0.0363 44% 3,222 Ludlow 3,254$ 13.62$ 0.0204 22% 239 Lunenburg 1,236$ 1.86$ 0.0059 50% 665 Lynn 71,200$ 26.45$ 0.0411 42% 2,692 Malden 20,827$ 21.08$ 0.0373 34% 988 Manchester 143$ 20.37$ 0.0340 13% 7 Manomet 39$ 19.55$ 0.0282 18% 2 Marion 83$ 3.08$ 0.0058 14% 27 Marlboro 9,807$ 20.87$ 0.0362 35% 470 Marshfield 645$ 5.46$ 0.0094 20% 118 Marshfld Hls (10)$ (9.63)$ ‐0.0139 33% 1 Marstons Mls (278)$ (9.57)$ ‐0.0123 14% 29 Mashpee 247$ 1.30$ 0.0021 27% 190 Mattapan 3,937$ 3.91$ 0.0079 46% 1,008 Mattapoisett 87$ 3.21$ 0.0046 19% 27 Maynard 115$ 1.72$ 0.0026 25% 67 Medfield 118$ 5.62$ 0.0098 16% 21 Medford 8,088$ 23.65$ 0.0349 27% 342 Medway 432$ 10.80$ 0.0152 20% 40 Melrose 2,993$ 25.15$ 0.0412 21% 119 Mendon 569$ 18.96$ 0.0264 33% 30 Methuen 19,831$ 27.47$ 0.0381 31% 722 Middlefield 13$ 1.80$ 0.0035 37% 7 Milford 8,085$ 23.99$ 0.0352 38% 337 Millbury 3,488$ 24.39$ 0.0344 30% 143
Prepared for the Massachusetts Attorney General’s Office 6/12

Are Residential Consumers Benefiting from Electric Supply Competition?2021 Update
Appendix 2CSeptember 2018
Municipality Total
Consumer Loss in Month
Average Per Household Loss in Month
Premium (per kWh)
% of Households
Participating in Competitive Supply Market
# Competitive Supply Accounts
Appendix 2CConsumer Loss, Premium, and Participation by Municipality ‐ Low‐Income Households
(Sorted Alphabetically)
Millers Falls 128$ 6.40$ 0.0083 21% 20 Millis (266)$ (9.84)$ ‐0.0105 15% 27 Millville 494$ 21.47$ 0.0361 22% 23 Milton 432$ 6.17$ 0.0097 18% 70 Monroe 11$ 5.75$ 0.0190 25% 2 Monson 2,828$ 27.20$ 0.0366 28% 104 Montague 202$ 11.91$ 0.0222 19% 17 Monterey 200$ 66.80$ 0.0574 11% 3 Montgomery 5$ 5.43$ 0.0129 5% 1 Monument Bch 83$ 7.50$ 0.0125 28% 11 Mt Washington 50$ 12.39$ 0.0187 44% 4 Nahant NA NA NA 0% ‐ Nantucket 344$ 21.50$ 0.0218 11% 16 Natick 250$ 1.39$ 0.0026 21% 180 Needham 272$ 6.32$ 0.0085 16% 43 New Ashford 44$ 14.58$ 0.0201 27% 3 New Bedford 9,858$ 2.75$ 0.0050 31% 3,579 New Braintree 265$ 33.18$ 0.0416 23% 8 New Marlboro 112$ 15.95$ 0.0180 10% 7 Newbury 881$ 35.25$ 0.0356 19% 25 Newburyport 2,135$ 22.01$ 0.0419 24% 97 Newton 203$ 4.40$ 0.0093 23% 46 Newton Center 258$ 9.20$ 0.0136 17% 28 Newton Hlds (7)$ (0.26)$ ‐0.0004 19% 27 Newton L F 8$ 2.74$ 0.0080 11% 3 Newton U F 73$ 5.60$ 0.0132 22% 13 Newtonvlle 122$ 5.83$ 0.0126 18% 21 Norfolk 74$ 8.17$ 0.0080 9% 9 North Adams 10,679$ 21.27$ 0.0379 32% 502 North Andover 2,571$ 21.79$ 0.0406 20% 118 North Brookfield 1,565$ 23.02$ 0.0313 27% 68 North Cambridge 749$ 6.30$ 0.0145 24% 119 North Carver 23$ 4.57$ 0.0034 24% 5 North Chatham 4$ 1.99$ 0.0031 12% 2
Prepared for the Massachusetts Attorney General’s Office 7/12

Are Residential Consumers Benefiting from Electric Supply Competition?2021 Update
Appendix 2CSeptember 2018
Municipality Total
Consumer Loss in Month
Average Per Household Loss in Month
Premium (per kWh)
% of Households
Participating in Competitive Supply Market
# Competitive Supply Accounts
Appendix 2CConsumer Loss, Premium, and Participation by Municipality ‐ Low‐Income Households
(Sorted Alphabetically)
North Dartmouth 763$ 4.68$ 0.0084 20% 163 North Eastham 68$ 3.77$ 0.0057 21% 18 North Falmouth (103)$ (9.34)$ ‐0.0181 19% 11 North Hatfield NA NA NA 0% ‐ North Truro (2)$ (0.45)$ ‐0.0007 7% 4 Northampton 7,202$ 20.75$ 0.0417 28% 347 Northboro 1,423$ 25.41$ 0.0315 24% 56 Northfield 226$ 7.07$ 0.0126 22% 32 Norton 7,913$ 42.31$ 0.0356 17% 187 Norwell 369$ 36.86$ 0.0520 13% 10 Oak Bluffs 303$ 10.11$ 0.0112 25% 30 Oakham 706$ 33.62$ 0.0428 28% 21 Ocean Bluff 33$ 32.55$ 0.0319 33% 1 Onset 20$ 0.28$ 0.0004 33% 71 Orange 6,012$ 17.89$ 0.0290 35% 336 Orleans 93$ 2.72$ 0.0046 20% 34 Osterville 84$ 5.25$ 0.0089 19% 16 Otis 106$ 15.09$ 0.0253 13% 7 Oxford 4,354$ 21.99$ 0.0315 33% 198 Palmer 6,434$ 23.40$ 0.0331 27% 275 Pelham 11$ 2.19$ 0.0022 14% 5 Pembroke 2,721$ 29.58$ 0.0318 23% 92 Pepperell 1,925$ 21.88$ 0.0374 27% 88 Peru 176$ 13.52$ 0.0232 23% 13 Petersham 136$ 13.63$ 0.0295 22% 10 Phillipston 678$ 28.24$ 0.0339 30% 24 Pittsfield 16,204$ 13.69$ 0.0252 28% 1,184 Plainfield 125$ 8.94$ 0.0142 31% 14 Plainville 2,782$ 30.24$ 0.0440 28% 92 Plymouth 109$ 0.26$ 0.0004 22% 428 Plympton 9$ 3.01$ 0.0038 7% 3 Pocasset 307$ 9.30$ 0.0184 26% 33 Provincetown 182$ 3.87$ 0.0079 22% 47 Quincy 24,793$ 19.90$ 0.0390 34% 1,246
Prepared for the Massachusetts Attorney General’s Office 8/12

Are Residential Consumers Benefiting from Electric Supply Competition?2021 Update
Appendix 2CSeptember 2018
Municipality Total
Consumer Loss in Month
Average Per Household Loss in Month
Premium (per kWh)
% of Households
Participating in Competitive Supply Market
# Competitive Supply Accounts
Appendix 2CConsumer Loss, Premium, and Participation by Municipality ‐ Low‐Income Households
(Sorted Alphabetically)
Randolph 14,866$ 21.12$ 0.0314 36% 704 Rehoboth 2,097$ 29.95$ 0.0358 30% 70 Revere 19,611$ 24.36$ 0.0403 32% 805 Richmond 60$ 8.53$ 0.0153 19% 7 Rochester 76$ 2.72$ 0.0030 24% 28 Rockland 6,014$ 32.16$ 0.0382 30% 187 Rockport 619$ 14.41$ 0.0358 16% 43 Roslindale 2,756$ 5.47$ 0.0095 34% 504 Rowe 132$ 26.39$ 0.0529 23% 5 Roxbry Xng 2,294$ 6.57$ 0.0127 45% 349 Roxbury 6,659$ 4.54$ 0.0091 49% 1,468 Royalston 408$ 22.65$ 0.0359 23% 18 Russell (13)$ (6.27)$ ‐0.0080 14% 2 Rutland 1,623$ 24.97$ 0.0366 35% 65 Sagamore 122$ 11.08$ 0.0196 16% 11 Sagamore Bch 158$ 7.54$ 0.0115 28% 21 Salem 16,602$ 25.15$ 0.0446 32% 660 Salisbury 2,570$ 28.56$ 0.0418 22% 90 Sandisfield NA NA NA 0% ‐ Sandwich (11)$ (0.16)$ ‐0.0002 25% 69 Saugus 5,796$ 32.20$ 0.0353 23% 180 Savoy 45$ 1.94$ 0.0040 35% 23 Scituate 1,163$ 23.73$ 0.0317 20% 49 Seekonk 3,839$ 32.54$ 0.0345 25% 118 Sharon 48$ 1.46$ 0.0023 15% 33 Sheffield 1,502$ 29.45$ 0.0380 25% 51 Shelburne 53$ 13.19$ 0.0254 25% 4 Shelburne Fls 173$ 10.20$ 0.0209 17% 17 Sherborn (65)$ (16.14)$ ‐0.0142 16% 4 Shirley 1,604$ 16.53$ 0.0258 32% 97 Shutesbury 7$ 3.51$ 0.0068 40% 2 Somerset 5,831$ 25.80$ 0.0409 29% 226 Somerville 3,645$ 5.46$ 0.0120 37% 668 South Boston 1,291$ 6.79$ 0.0145 27% 190
Prepared for the Massachusetts Attorney General’s Office 9/12

Are Residential Consumers Benefiting from Electric Supply Competition?2021 Update
Appendix 2CSeptember 2018
Municipality Total
Consumer Loss in Month
Average Per Household Loss in Month
Premium (per kWh)
% of Households
Participating in Competitive Supply Market
# Competitive Supply Accounts
Appendix 2CConsumer Loss, Premium, and Participation by Municipality ‐ Low‐Income Households
(Sorted Alphabetically)
South Carver 1$ 0.25$ 0.0003 17% 6 South Chatham 1$ 0.10$ 0.0002 31% 9 South Dartmouth 257$ 2.12$ 0.0040 20% 121 South Deerfield 106$ 2.86$ 0.0066 24% 37 South Dennis 75$ 1.18$ 0.0016 25% 64 South Harwich 8$ 2.12$ 0.0049 33% 4 South Lee (21)$ (21.13)$ ‐0.0176 17% 1 South Orleans 9$ 4.43$ 0.0066 11% 2 South Walpole 10$ 4.93$ 0.0059 11% 2 South Wellfleet (2)$ (0.30)$ ‐0.0007 24% 8 South Yarmouth 309$ 2.29$ 0.0041 29% 135 Southampton 254$ 9.06$ 0.0117 17% 28 Southborough 540$ 31.76$ 0.0346 30% 17 Southbridge 15,435$ 20.63$ 0.0322 45% 748 Southwick 1,975$ 24.68$ 0.0229 22% 80 Spencer 5,163$ 19.41$ 0.0297 38% 266 Springfield 131,436$ 16.46$ 0.0263 42% 7,986 Stockbridge 269$ 12.79$ 0.0393 29% 21 Stoneham 466$ 3.95$ 0.0084 19% 118 Stoughton 12,703$ 33.17$ 0.0335 33% 383 Stow NA NA NA NA ‐ Sturbridge 1,839$ 16.42$ 0.0277 31% 112 Sudbury 202$ 6.74$ 0.0122 15% 30 Sunderland 404$ 14.43$ 0.0211 22% 28 Sutton 1,060$ 25.23$ 0.0285 27% 42 Swampscott 510$ 51.01$ 0.0565 20% 10 Swansea 6,245$ 26.57$ 0.0368 31% 235 Teaticket 19$ 0.36$ 0.0005 34% 53 Tewksbury 4,792$ 30.14$ 0.0356 26% 159 Tolland (47)$ (15.71)$ ‐0.0155 20% 3 Townsend 462$ 8.88$ 0.0344 15% 52 Truro 44$ 4.00$ 0.0058 31% 11 Turners Falls 1,824$ 11.47$ 0.0205 26% 159 Tyngsboro 2,186$ 23.76$ 0.0310 29% 92
Prepared for the Massachusetts Attorney General’s Office 10/12

Are Residential Consumers Benefiting from Electric Supply Competition?2021 Update
Appendix 2CSeptember 2018
Municipality Total
Consumer Loss in Month
Average Per Household Loss in Month
Premium (per kWh)
% of Households
Participating in Competitive Supply Market
# Competitive Supply Accounts
Appendix 2CConsumer Loss, Premium, and Participation by Municipality ‐ Low‐Income Households
(Sorted Alphabetically)
Tyringham 15$ 14.62$ 0.0522 14% 1 Upton 706$ 19.08$ 0.0377 27% 37 Uxbridge 2,113$ 17.32$ 0.0275 31% 122 Vineyard Hvn 195$ 5.27$ 0.0074 25% 37 Vlg Nag Wd (31)$ (15.74)$ ‐0.0329 50% 2 Waban 62$ 5.66$ 0.0127 20% 11 Wakefield NA NA NA NA ‐ Wales 482$ 11.21$ 0.0189 34% 43 Walpole 81$ 2.18$ 0.0034 13% 37 Waltham 2,156$ 4.70$ 0.0082 28% 459 Waquoit 24$ 0.72$ 0.0011 28% 33 Ware 5,944$ 19.05$ 0.0282 33% 312 Wareham 375$ 1.39$ 0.0018 34% 270 Warren 2,363$ 19.69$ 0.0257 32% 120 Warwick 409$ 19.48$ 0.0444 31% 21 Washington 98$ 14.06$ 0.0257 27% 7 Watertown 1,021$ 4.93$ 0.0103 22% 207 Wayland (23)$ (1.02)$ ‐0.0016 17% 23 Webster 11,803$ 23.99$ 0.0377 34% 492 Wellfleet (89)$ (4.69)$ ‐0.0070 17% 19 Wenham 9$ 3.13$ 0.0017 11% 3 West Barnstable 83$ 5.56$ 0.0113 25% 15 West Bridgewater 1,572$ 24.57$ 0.0376 28% 64 West Brookfield 1,298$ 19.09$ 0.0285 35% 68 West Chatham 4$ 4.37$ 0.0140 5% 1 West Dennis 144$ 12.04$ 0.0229 18% 12 West Falmouth (16)$ (16.44)$ ‐0.0500 17% 1 West Harwich (30)$ (2.29)$ ‐0.0030 21% 13 West Hatfield 100$ 8.36$ 0.0183 30% 12 West Hyannisprt (109)$ (12.07)$ ‐0.0191 35% 9 West Newbury 216$ 24.05$ 0.0225 20% 9 West Newton 98$ 4.90$ 0.0096 12% 20 West Roxbury 262$ 1.25$ 0.0026 30% 210 West Somerville 407$ 6.36$ 0.0124 23% 64
Prepared for the Massachusetts Attorney General’s Office 11/12

Are Residential Consumers Benefiting from Electric Supply Competition?2021 Update
Appendix 2CSeptember 2018
Municipality Total
Consumer Loss in Month
Average Per Household Loss in Month
Premium (per kWh)
% of Households
Participating in Competitive Supply Market
# Competitive Supply Accounts
Appendix 2CConsumer Loss, Premium, and Participation by Municipality ‐ Low‐Income Households
(Sorted Alphabetically)
West Springfield 8,596$ 12.66$ 0.0194 34% 679 West Stockbridge 253$ 18.05$ 0.0362 21% 14 West Tisbury 76$ 8.40$ 0.0090 14% 9 West Townsend NA NA NA NA ‐ West Wareham 25$ 0.36$ 0.0004 30% 69 West Yarmouth 323$ 2.63$ 0.0038 25% 123 Westboro 1,247$ 25.99$ 0.0410 24% 48 Westford 1,697$ 30.85$ 0.0414 18% 55 Westhampton 112$ 16.00$ 0.0266 16% 7 Westminster 1,196$ 29.91$ 0.0420 22% 40 Weston (30)$ (2.31)$ ‐0.0035 19% 13 Westport 2,912$ 14.13$ 0.0233 31% 206 Westport Pt NA NA NA 0% ‐ Westwood 52$ 2.90$ 0.0049 10% 18 Weymouth 13,570$ 25.95$ 0.0359 29% 523 Whately 98$ 13.93$ 0.0207 14% 7 Whitinsville 5,722$ 28.05$ 0.0394 28% 204 Whitman 3,984$ 26.56$ 0.0323 27% 150 Wht Horse Bch NA NA NA 0% ‐ Wilbraham 3,502$ 26.13$ 0.0340 32% 134 Williamsburg 252$ 17.98$ 0.0272 15% 14 Williamstown 1,095$ 19.20$ 0.0341 29% 57 Winchendon 4,485$ 24.24$ 0.0366 31% 185 Winchester (12)$ (0.54)$ ‐0.0007 13% 22 Windsor 90$ 6.95$ 0.0127 30% 13 Winthrop 3,503$ 26.95$ 0.0448 22% 130 Woburn 1,307$ 3.91$ 0.0069 27% 334 Woods Hole 14$ 13.52$ 0.0561 20% 1 Worcester 99,546$ 21.19$ 0.0361 39% 4,697 Woronoco 61$ 20.47$ 0.0268 19% 3 Worthington 245$ 22.30$ 0.0272 20% 11 Wrentham 1,250$ 30.50$ 0.0341 24% 41 Yarmouth Port 97$ 2.11$ 0.0027 27% 46
Prepared for the Massachusetts Attorney General’s Office 12/12

Are Residential Consumers Benefiting from Electric Supply Competition? 2021 Update
Prepared for the Massachusetts Attorney General’s Office
Appendix 2D
Supplier-Specific Information – All Households
July 2018 – June 2019 and
July 2019 – June 2020

Are Residential Consumers Benefiting from Electric Supply Competition?2021 Update
Appendix 2DJuly 2019 ‐ June 2020
Supplier IDAverage Rate # of Bills
Average Premium
Share of Accounts
Net Consumer Loss Loss Gain
Share of Loss
Share of Gain
18 $0.1892 43 0.0846$ 0.00% 2,367$ 2,424$ (57)$ 0.00% 0.00%70 $0.0000 10 0.0641$ 0.00% 237$ 237$ ‐$ 0.00% 0.00%24 $0.1782 42,312 0.0631$ 0.78% 1,364,623$ 1,420,571$ (55,948)$ 1.46% 0.50%15 $0.1754 72,026 0.0575$ 1.33% 1,886,942$ 1,943,757$ (56,815)$ 2.00% 0.50%6 $0.1741 160,629 0.0568$ 2.96% 4,800,608$ 4,906,883$ (106,275)$ 5.06% 0.94%1 $0.1730 27,319 0.0553$ 0.50% 889,396$ 912,899$ (23,503)$ 0.94% 0.21%25 $0.1726 330,142 0.0528$ 6.09% 7,865,586$ 8,097,116$ (231,530)$ 8.34% 2.05%51 $0.1545 2 0.0465$ 0.00% 9$ 9$ ‐$ 0.00% 0.00%48 $0.1616 30,738 0.0465$ 0.57% 836,800$ 842,164$ (5,363)$ 0.87% 0.05%39 $0.1640 31,672 0.0454$ 0.58% 701,637$ 712,087$ (10,450)$ 0.73% 0.09%66 $0.1621 120,316 0.0443$ 2.22% 2,447,269$ 2,477,159$ (29,890)$ 2.55% 0.26%60 $0.1634 290,972 0.0440$ 5.37% 6,243,047$ 6,683,700$ (440,653)$ 6.89% 3.90%35 $0.1641 72,770 0.0439$ 1.34% 1,804,224$ 1,822,240$ (18,016)$ 1.88% 0.16%12 $0.1597 244,713 0.0412$ 4.52% 4,538,670$ 4,688,555$ (149,885)$ 4.83% 1.33%57 $0.1610 36,773 0.0406$ 0.68% 708,200$ 725,165$ (16,965)$ 0.75% 0.15%37 $0.1590 526,480 0.0397$ 9.72% 12,294,159$ 12,643,496$ (349,338)$ 13.03% 3.10%41 $0.1475 263,443 0.0394$ 4.86% 5,782,738$ 6,079,749$ (297,011)$ 6.27% 2.63%23 $0.1584 141,213 0.0385$ 2.61% 2,794,581$ 2,843,607$ (49,027)$ 2.93% 0.43%4 $0.1570 137,084 0.0383$ 2.53% 2,447,105$ 2,573,716$ (126,611)$ 2.65% 1.12%36 $0.1584 114,025 0.0380$ 2.10% 2,358,303$ 2,582,022$ (223,718)$ 2.66% 1.98%46 $0.1487 16,780 0.0326$ 0.31% 261,821$ 274,122$ (12,301)$ 0.28% 0.11%22 $0.1453 275,503 0.0325$ 5.09% 5,031,249$ 5,164,957$ (133,707)$ 5.32% 1.18%43 $0.1431 225,583 0.0311$ 4.16% 3,681,648$ 3,872,939$ (191,290)$ 3.99% 1.69%55 $0.1484 91,547 0.0311$ 1.69% 1,444,621$ 1,491,321$ (46,700)$ 1.54% 0.41%
Appendix 2DSupplier‐Specific Information ‐‐ All Households (Ranked by Weighted Average Premium)
Prepared for the Massachusetts Attorney General’s Office 1 / 3

Are Residential Consumers Benefiting from Electric Supply Competition?2021 Update
Appendix 2DJuly 2019 ‐ June 2020
Supplier IDAverage Rate # of Bills
Average Premium
Share of Accounts
Net Consumer Loss Loss Gain
Share of Loss
Share of Gain
Appendix 2DSupplier‐Specific Information ‐‐ All Households (Ranked by Weighted Average Premium)
42 $0.1446 434,772 0.0244$ 8.02% 6,111,217$ 7,049,113$ (937,895)$ 7.26% 8.31%32 $0.1429 221,178 0.0242$ 4.08% 3,300,031$ 3,463,834$ (163,803)$ 3.57% 1.45%20 $0.1437 44,285 0.0239$ 0.82% 573,753$ 625,460$ (51,707)$ 0.64% 0.46%13 $0.1400 62,780 0.0236$ 1.16% 852,575$ 904,841$ (52,267)$ 0.93% 0.46%26 $0.1390 149,051 0.0220$ 2.75% 1,892,333$ 2,185,067$ (292,734)$ 2.25% 2.59%29 $0.1358 141,877 0.0177$ 2.62% 1,531,175$ 2,128,380$ (597,206)$ 2.19% 5.29%9 $0.1360 204,698 0.0164$ 3.78% 2,133,074$ 2,934,090$ (801,016)$ 3.02% 7.10%3 $0.1288 18,049 0.0106$ 0.33% 132,828$ 210,024$ (77,196)$ 0.22% 0.68%27 $0.1424 1,061 0.0087$ 0.02% 3,327$ 3,875$ (548)$ 0.00% 0.00%61 $0.1097 6,752 0.0076$ 0.12% 25,041$ 25,041$ ‐$ 0.03% 0.00%7 $0.1248 114,639 0.0064$ 2.12% 485,679$ 884,149$ (398,471)$ 0.91% 3.53%50 $0.1257 2,786 0.0059$ 0.05% 7,254$ 12,240$ (4,986)$ 0.01% 0.04%10 $0.1219 23,731 0.0044$ 0.44% 90,268$ 220,301$ (130,033)$ 0.23% 1.15%49 $0.1265 24,964 0.0043$ 0.46% 63,253$ 157,969$ (94,716)$ 0.16% 0.84%68 $0.1236 13,769 0.0037$ 0.25% 33,641$ 106,931$ (73,290)$ 0.11% 0.65%28 $0.1103 2 0.0024$ 0.00% 4$ 4$ (0)$ 0.00% 0.00%17 $0.1211 190,790 0.0022$ 3.52% 250,177$ 1,296,973$ (1,046,796)$ 1.34% 9.27%44 $0.1101 96 0.0022$ 0.00% 214$ 746$ (532)$ 0.00% 0.00%14 $0.1225 19,963 0.0013$ 0.37% 15,412$ 111,757$ (96,345)$ 0.12% 0.85%67 $0.1044 9 0.0009$ 0.00% 7$ 41$ (34)$ 0.00% 0.00%8 $0.1157 8,369 (0.0041)$ 0.15% (27,185)$ 54,067$ (81,252)$ 0.06% 0.72%38 $0.1100 2,981 (0.0045)$ 0.06% (11,981)$ 8,562$ (20,542)$ 0.01% 0.18%34 $0.1145 442,846 (0.0047)$ 8.17% (1,460,969)$ 1,753,193$ (3,214,162)$ 1.81% 28.48%53 $0.0949 2 (0.0049)$ 0.00% (1)$ ‐$ (1)$ 0.00% 0.00%
Prepared for the Massachusetts Attorney General’s Office 2 / 3

Are Residential Consumers Benefiting from Electric Supply Competition?2021 Update
Appendix 2DJuly 2019 ‐ June 2020
Supplier IDAverage Rate # of Bills
Average Premium
Share of Accounts
Net Consumer Loss Loss Gain
Share of Loss
Share of Gain
Appendix 2DSupplier‐Specific Information ‐‐ All Households (Ranked by Weighted Average Premium)
59 $0.1090 231 (0.0054)$ 0.00% (1,310)$ 1,189$ (2,499)$ 0.00% 0.02%63 $0.1123 5,174 (0.0071)$ 0.10% (17,743)$ 12,435$ (30,178)$ 0.01% 0.27%31 $0.1154 8 (0.0075)$ 0.00% (56)$ 76$ (132)$ 0.00% 0.00%11 $0.1093 8,212 (0.0091)$ 0.15% (60,499)$ 27,773$ (88,271)$ 0.03% 0.78%16 $0.1029 6,259 (0.0094)$ 0.12% (65,981)$ 48,507$ (114,488)$ 0.05% 1.01%21 $0.1110 1,984 (0.0120)$ 0.04% (26,114)$ 13,000$ (39,114)$ 0.01% 0.35%33 $0.1067 6,196 (0.0154)$ 0.11% (69,652)$ 12,490$ (82,142)$ 0.01% 0.73%52 $0.1009 3,009 (0.0159)$ 0.06% (59,975)$ 11,220$ (71,195)$ 0.01% 0.63%69 $0.0990 4,966 (0.0177)$ 0.09% (46,487)$ 13$ (46,500)$ 0.00% 0.41%56 $0.0827 124 (0.0338)$ 0.00% (4,695)$ 0$ (4,695)$ 0.00% 0.04%64 $0.0843 29 (0.0462)$ 0.00% (1,290)$ ‐$ (1,290)$ 0.00% 0.01%
The analysis in Appendix 2D relies on data as reported by the utilities on behalf of the suppliers. In a few instances, the rate reported (e.g. $0.00001 per kWh for Supplier #70) does not match the rate that one would derive by dividing "total amount billed" by "kwh billed." As a secondary calculation, in order to test the robustness of my results, I computed “derived rates” and based on the use of those rates, determined that the overall amount billed by utilities on behalf of suppliers in Massachusetts over the study period increases by only $3587, or 0.00034% if one uses "derived rates." In other words, although there are some unexplained data anomalies, they do not affect my overall analyses and conclusions.
Prepared for the Massachusetts Attorney General’s Office 3 / 3

Are Residential Consumers Benefiting from Electric Supply Competition?2021 Update
Appendix 2DJuly 2018 - June 2019
Prepared for the Massachusetts Attorney General’s Office 1/3
Supplier IDAverage
Rate # of Bills
Average Premium
Share of Accounts
Net Consumer
LossLoss Gain
Share of Loss
Share of Gain
Supplier #25 $0.1892 234,583 $0.0650 4.21% $6,852,237 $6,927,124 -$74,887 6.92% 0.57%Supplier #46 $0.1697 9,773 $0.0551 0.18% $261,170 $263,903 -$2,734 0.26% 0.02%Supplier #18 $0.1587 20,450 $0.0522 0.37% $726,514 $791,991 -$65,477 0.79% 0.50%Supplier #1 $0.1734 33,831 $0.0517 0.61% $1,063,802 $1,099,758 -$35,956 1.10% 0.28%Supplier #39 $0.1711 28,896 $0.0494 0.52% $722,163 $733,672 -$11,509 0.73% 0.09%Supplier #35 $0.1708 83,780 $0.0487 1.50% $2,512,769 $2,537,391 -$24,622 2.54% 0.19%Supplier #36 $0.1678 113,402 $0.0473 2.04% $3,184,004 $3,303,790 -$119,787 3.30% 0.92%Supplier #48 $0.1711 37,430 $0.0470 0.67% $1,097,111 $1,114,164 -$17,053 1.11% 0.13%Supplier #4 $0.1675 105,773 $0.0459 1.90% $2,471,218 $2,506,962 -$35,744 2.51% 0.27%Supplier #15 $0.1659 111,673 $0.0445 2.01% $2,372,550 $2,495,160 -$122,610 2.49% 0.94%Supplier #24 $0.1644 47,783 $0.0442 0.86% $1,153,231 $1,185,305 -$32,074 1.18% 0.25%Supplier #12 $0.1631 262,158 $0.0419 4.71% $5,007,908 $5,094,152 -$86,244 5.09% 0.66%Supplier #6 $0.1630 207,408 $0.0415 3.72% $4,880,519 $5,348,591 -$468,072 5.35% 3.59%Supplier #51 $0.1578 32,578 $0.0389 0.59% $630,676 $633,642 -$2,966 0.63% 0.02%Supplier #66 $0.1593 138,707 $0.0378 2.49% $2,483,828 $2,632,756 -$148,928 2.63% 1.14%Supplier #57 $0.1666 18,325 $0.0377 0.33% $329,825 $339,522 -$9,697 0.34% 0.07%Supplier #41 $0.1476 352,657 $0.0375 6.33% $7,670,079 $7,924,533 -$254,454 7.92% 1.95%Supplier #22 $0.1552 200,993 $0.0352 3.61% $4,300,133 $4,504,780 -$204,647 4.50% 1.57%Supplier #60 $0.1583 238,979 $0.0350 4.29% $3,979,761 $4,355,068 -$375,307 4.35% 2.88%Supplier #37 $0.1533 525,855 $0.0310 9.44% $9,968,255 $10,639,865 -$671,611 10.64% 5.15%Supplier #43 $0.1430 256,618 $0.0268 4.61% $3,792,451 $4,099,315 -$306,864 4.10% 2.35%
Appendix 2D
Supplier-Specific Information -- All Households (Ranked by Weighted Average Premium)

Are Residential Consumers Benefiting from Electric Supply Competition?2021 Update
Appendix 2DJuly 2018 - June 2019
Prepared for the Massachusetts Attorney General’s Office 2/3
Supplier IDAverage
Rate # of Bills
Average Premium
Share of Accounts
Net Consumer
LossLoss Gain
Share of Loss
Share of Gain
Appendix 2D
Supplier-Specific Information -- All Households (Ranked by Weighted Average Premium)
Supplier #32 $0.1474 294,195 $0.0259 5.28% $4,967,158 $5,139,843 -$172,685 5.14% 1.32%Supplier #42 $0.1480 446,150 $0.0241 8.01% $6,578,084 $7,874,507 -$1,296,423 7.87% 9.94%Supplier #23 $0.1465 177,683 $0.0233 3.19% $2,265,640 $2,467,804 -$202,164 2.47% 1.55%Supplier #55 $0.1484 100,718 $0.0229 1.81% $1,190,240 $1,202,979 -$12,739 1.20% 0.10%Supplier #31 $0.1304 21,745 $0.0202 0.39% $317,169 $399,531 -$82,362 0.40% 0.63%Supplier #20 $0.1441 30,776 $0.0194 0.55% $317,641 $345,039 -$27,398 0.34% 0.21%Supplier #13 $0.1374 70,721 $0.0183 1.27% $783,461 $862,419 -$78,958 0.86% 0.61%Supplier #27 $0.1391 191,090 $0.0176 3.43% $1,845,935 $2,449,879 -$603,945 2.45% 4.63%Supplier #7 $0.1374 101,736 $0.0149 1.83% $1,038,413 $1,307,169 -$268,756 1.31% 2.06%Supplier #5 $0.1204 3 $0.0142 0.00% -$114 $0 -$114 0.00% 0.00%Supplier #29 $0.1343 151,566 $0.0125 2.72% $1,117,184 $1,825,767 -$708,584 1.83% 5.43%Supplier #19 $0.1204 4,595 $0.0096 0.08% $32,958 $42,320 -$9,362 0.04% 0.07%Supplier #26 $0.1292 168,301 $0.0059 3.02% $597,537 $1,363,383 -$765,846 1.36% 5.87%Supplier #10 $0.1296 11,529 $0.0053 0.21% $66,234 $204,383 -$138,148 0.20% 1.06%Supplier #68 $0.1325 12,104 $0.0047 0.22% $36,319 $124,548 -$88,229 0.12% 0.68%Supplier #9 $0.1276 247,501 $0.0047 4.44% $793,786 $2,986,119 -$2,192,334 2.98% 16.81%Supplier #3 $0.1237 30,007 $0.0047 0.54% $99,568 $266,109 -$166,541 0.27% 1.28%Supplier #34 $0.1225 334,217 $0.0002 6.00% $51,100 $2,157,238 -$2,106,137 2.16% 16.15%Supplier #14 $0.1221 18,582 -$0.0010 0.33% -$12,075 $68,647 -$80,722 0.07% 0.62%Supplier #50 $0.1273 755 -$0.0012 0.01% -$366 $1,517 -$1,883 0.00% 0.01%Supplier #38 $0.1204 4,418 -$0.0033 0.08% -$15,359 $42,066 -$57,424 0.04% 0.44%

Are Residential Consumers Benefiting from Electric Supply Competition?2021 Update
Appendix 2DJuly 2018 - June 2019
Prepared for the Massachusetts Attorney General’s Office 3/3
Supplier IDAverage
Rate # of Bills
Average Premium
Share of Accounts
Net Consumer
LossLoss Gain
Share of Loss
Share of Gain
Appendix 2D
Supplier-Specific Information -- All Households (Ranked by Weighted Average Premium)
Supplier #28 $0.1155 21,008 -$0.0036 0.38% -$81,056 $128,925 -$209,981 0.13% 1.61%Supplier #64 $0.1045 12,729 -$0.0041 0.23% -$33,217 $72,077 -$105,294 0.07% 0.81%Supplier #49 $0.1238 19,165 -$0.0055 0.34% -$60,273 $54,353 -$114,627 0.05% 0.88%Supplier #44 $0.1046 1,866 -$0.0063 0.03% -$10,970 $3,542 -$14,512 0.00% 0.11%Supplier #21 $0.1159 1,943 -$0.0063 0.03% -$10,104 $14,828 -$24,932 0.01% 0.19%Supplier #11 $0.1146 7,362 -$0.0082 0.13% -$48,424 $40,975 -$89,399 0.04% 0.69%Supplier #59 $0.1093 927 -$0.0089 0.02% -$7,583 $3,510 -$11,094 0.00% 0.09%Supplier #52 $0.1129 2,975 -$0.0098 0.05% -$12,583 $2,565 -$15,148 0.00% 0.12%Supplier #67 $0.1057 2 -$0.0112 0.00% -$21 $0 -$21 0.00% 0.00%Supplier #8 $0.1109 13,208 -$0.0113 0.24% -$122,139 $42,717 -$164,856 0.04% 1.26%Supplier #58 $0.0984 250 -$0.0137 0.00% -$3,141 $245 -$3,387 0.00% 0.03%Supplier #33 $0.1053 3,263 -$0.0175 0.06% -$46,236 $3,749 -$49,985 0.00% 0.38%Supplier #63 $0.1056 1,450 -$0.0182 0.03% -$22,372 $1,624 -$23,996 0.00% 0.18%Supplier #65 $0.0868 3 -$0.0187 0.00% -$16 $0 -$16 0.00% 0.00%Supplier #16 $0.1044 1,874 -$0.0233 0.03% -$61,084 $6,293 -$67,376 0.01% 0.52%Supplier #17 $0.0722 24 -$0.0362 0.00% -$251 $0 -$251 0.00% 0.00%Supplier #56 $0.0825 94 -$0.0433 0.00% -$17,121 $0 -$17,121 0.00% 0.13%

Are Residential Consumers Benefiting from Electric Supply Competition? 2021 Update
Prepared for the Massachusetts Attorney General’s Office
Appendix 3A
Supplier-Specific Information – Low-Income Households
July 2018 – June 2019; and July 2019 – June 2020

Are Residential Consumers Benefiting from Electric Supply Competition?2021 Update
Appendix 3AJuly 2019 - June 2020
Prepared for the Massachusetts Attorney General's Office 1 / 3
Supplier IDAverage
Rate # of BillsAverage Premium
Share of Accounts
Net Consumer Loss Loss Gain
Share of Loss
Share of Gain
18 $0.1822 17 0.0805$ 0.00% 880$ 930$ (50)$ 0.01% 0.00%15 $0.1857 23,323 0.0687$ 2.31% 702,335$ 706,542$ (4,207)$ 3.81% 0.32%24 $0.1741 9,870 0.0621$ 0.98% 304,129$ 312,553$ (8,424)$ 1.68% 0.64%
6 $0.1753 36,348 0.0577$ 3.60% 1,064,745$ 1,082,204$ (17,458)$ 5.83% 1.33%39 $0.1742 3,447 0.0569$ 0.34% 97,882$ 98,457$ (575)$ 0.53% 0.04%
1 $0.1692 1,136 0.0532$ 0.11% 32,281$ 32,955$ (674)$ 0.18% 0.05%60 $0.1692 117,072 0.0498$ 11.59% 2,851,380$ 2,963,755$ (112,376)$ 15.97% 8.56%57 $0.1650 11,894 0.0455$ 1.18% 267,704$ 270,832$ (3,128)$ 1.46% 0.24%48 $0.1601 4,473 0.0444$ 0.44% 98,210$ 98,317$ (107)$ 0.53% 0.01%35 $0.1636 15,532 0.0442$ 1.54% 368,913$ 371,201$ (2,288)$ 2.00% 0.17%12 $0.1612 66,885 0.0439$ 6.62% 1,332,632$ 1,348,136$ (15,504)$ 7.27% 1.18%66 $0.1599 36,911 0.0437$ 3.65% 789,058$ 799,093$ (10,036)$ 4.31% 0.76%41 $0.1475 48,160 0.0405$ 4.77% 1,009,937$ 1,051,651$ (41,714)$ 5.67% 3.18%
4 $0.1552 42,083 0.0380$ 4.16% 723,818$ 758,925$ (35,106)$ 4.09% 2.67%23 $0.1575 7,592 0.0374$ 0.75% 128,002$ 130,657$ (2,655)$ 0.70% 0.20%43 $0.1474 57,227 0.0365$ 5.66% 1,080,483$ 1,098,398$ (17,915)$ 5.92% 1.36%46 $0.1487 8,236 0.0351$ 0.82% 140,010$ 143,341$ (3,331)$ 0.77% 0.25%36 $0.1546 15,269 0.0345$ 1.51% 266,470$ 297,577$ (31,107)$ 1.60% 2.37%29 $0.1529 26,863 0.0337$ 2.66% 426,882$ 471,174$ (44,292)$ 2.54% 3.37%37 $0.1536 63,553 0.0331$ 6.29% 1,214,200$ 1,280,877$ (66,676)$ 6.90% 5.08%55 $0.1485 21,332 0.0320$ 2.11% 325,169$ 334,131$ (8,962)$ 1.80% 0.68%42 $0.1505 62,766 0.0304$ 6.21% 1,048,480$ 1,156,659$ (108,178)$ 6.23% 8.24%26 $0.1439 33,328 0.0277$ 3.30% 454,263$ 484,600$ (30,337)$ 2.61% 2.31%22 $0.1394 56,077 0.0261$ 5.55% 816,573$ 865,669$ (49,096)$ 4.67% 3.74%
Appendix 3ASupplier-Specific Information -- Low-IncomeHouseholds (Ranked by Weighted Average Premium)

Are Residential Consumers Benefiting from Electric Supply Competition?2021 Update
Appendix 3AJuly 2019 - June 2020
Prepared for the Massachusetts Attorney General's Office 2 / 3
Supplier IDAverage
Rate # of BillsAverage Premium
Share of Accounts
Net Consumer Loss Loss Gain
Share of Loss
Share of Gain
Appendix 3ASupplier-Specific Information -- Low-IncomeHouseholds (Ranked by Weighted Average Premium)
32 $0.1440 23,461 0.0261$ 2.32% 353,654$ 364,709$ (11,055)$ 1.97% 0.84%20 $0.1462 8,875 0.0257$ 0.88% 107,079$ 110,217$ (3,138)$ 0.59% 0.24%
3 $0.1399 2,373 0.0246$ 0.23% 32,854$ 38,686$ (5,832)$ 0.21% 0.44%25 $0.1425 44,120 0.0219$ 4.37% 411,719$ 464,584$ (52,865)$ 2.50% 4.03%13 $0.1331 12,864 0.0190$ 1.27% 140,441$ 149,674$ (9,233)$ 0.81% 0.70%
9 $0.1384 36,943 0.0184$ 3.66% 380,036$ 513,363$ (133,327)$ 2.77% 10.15%10 $0.1310 107 0.0144$ 0.01% 1,592$ 2,607$ (1,015)$ 0.01% 0.08%17 $0.1322 47,573 0.0143$ 4.71% 348,771$ 463,216$ (114,446)$ 2.50% 8.72%16 $0.1337 7 0.0110$ 0.00% 65$ 65$ -$ 0.00% 0.00%
7 $0.1247 13,091 0.0067$ 1.30% 49,847$ 87,753$ (37,907)$ 0.47% 2.89%68 $0.1274 2,452 0.0063$ 0.24% 9,016$ 20,331$ (11,315)$ 0.11% 0.86%49 $0.1278 3,221 0.0056$ 0.32% 10,569$ 21,438$ (10,869)$ 0.12% 0.83%38 $0.1237 31 0.0053$ 0.00% 96$ 178$ (82)$ 0.00% 0.01%59 $0.1108 31 0.0031$ 0.00% 110$ 282$ (173)$ 0.00% 0.01%50 $0.1231 157 0.0031$ 0.02% 201$ 503$ (302)$ 0.00% 0.02%14 $0.1250 2,473 0.0023$ 0.24% 3,440$ 13,900$ (10,460)$ 0.07% 0.80%44 $0.1094 2 0.0015$ 0.00% 2$ 2$ -$ 0.00% 0.00%
8 $0.1211 879 (0.0001)$ 0.09% (82)$ 6,505$ (6,587)$ 0.04% 0.50%33 $0.1111 10 (0.0002)$ 0.00% (1)$ 19$ (19)$ 0.00% 0.00%63 $0.1166 817 (0.0030)$ 0.08% (1,113)$ 3,002$ (4,115)$ 0.02% 0.31%34 $0.1161 39,069 (0.0049)$ 3.87% (109,597)$ 134,617$ (244,214)$ 0.73% 18.60%11 $0.1003 25 (0.0105)$ 0.00% (81)$ 3$ (84)$ 0.00% 0.01%27 $0.1425 587 (0.0107)$ 0.06% (1,881)$ 468$ (2,349)$ 0.00% 0.18%61 $0.1097 722 (0.0174)$ 0.07% (4,617)$ -$ (4,617)$ 0.00% 0.35%

Are Residential Consumers Benefiting from Electric Supply Competition?2021 Update
Appendix 3AJuly 2019 - June 2020
Prepared for the Massachusetts Attorney General's Office 3 / 3
Supplier IDAverage
Rate # of BillsAverage Premium
Share of Accounts
Net Consumer Loss Loss Gain
Share of Loss
Share of Gain
Appendix 3ASupplier-Specific Information -- Low-IncomeHouseholds (Ranked by Weighted Average Premium)
69 $0.0990 375 (0.0177)$ 0.04% (4,470)$ -$ (4,470)$ 0.00% 0.34%52 $0.1037 780 (0.0337)$ 0.08% (11,996)$ 47$ (12,043)$ 0.00% 0.92%

Are Residential Consumers Benefiting from Electric Supply Competition?2021 Update
Appendix 3AJuly 2018 - June 2019
Prepared for the Massachusetts Attorney General’s Office 1/3
Supplier IDAverage
Rate # of Bills
Average Premium
Share of Accounts
Net Consumer Loss
Loss GainShare of
LossShare of
Gain
Supplier #25 $0.1848 34,124 $0.0616 3.09% $863,563 $872,620 -$9,058 4.45% 0.55%Supplier #46 $0.1690 4,978 $0.0560 0.45% $143,137 $144,289 -$1,151 0.74% 0.07%Supplier #39 $0.1766 4,313 $0.0559 0.39% $129,496 $131,094 -$1,597 0.67% 0.10%Supplier #15 $0.1720 37,235 $0.0510 3.38% $874,200 $883,458 -$9,258 4.50% 0.56%Supplier #1 $0.1694 1,476 $0.0502 0.13% $39,330 $40,388 -$1,058 0.21% 0.06%Supplier #35 $0.1724 17,862 $0.0498 1.62% $518,406 $521,759 -$3,353 2.66% 0.20%Supplier #36 $0.1677 14,926 $0.0473 1.35% $391,688 $409,561 -$17,873 2.09% 1.08%Supplier #48 $0.1719 5,496 $0.0466 0.50% $134,499 $135,380 -$881 0.69% 0.05%Supplier #4 $0.1660 31,620 $0.0451 2.87% $694,579 $704,950 -$10,371 3.59% 0.63%Supplier #12 $0.1655 75,386 $0.0450 6.83% $1,578,188 $1,586,371 -$8,183 8.08% 0.49%Supplier #6 $0.1647 45,875 $0.0435 4.16% $1,069,271 $1,142,904 -$73,633 5.82% 4.44%Supplier #24 $0.1598 11,702 $0.0421 1.06% $252,939 $258,571 -$5,632 1.32% 0.34%Supplier #57 $0.1689 6,499 $0.0398 0.59% $125,735 $127,739 -$2,004 0.65% 0.12%Supplier #60 $0.1619 98,681 $0.0392 8.95% $1,891,819 $1,983,083 -$91,264 10.10% 5.51%Supplier #10 $0.1635 95 $0.0387 0.01% $4,243 $4,259 -$17 0.02% 0.00%Supplier #51 $0.1576 11,158 $0.0385 1.01% $225,609 $226,473 -$864 1.15% 0.05%Supplier #41 $0.1459 73,068 $0.0369 6.62% $1,462,055 $1,512,247 -$50,192 7.70% 3.03%Supplier #66 $0.1557 43,479 $0.0357 3.94% $800,840 $854,747 -$53,906 4.35% 3.25%Supplier #18 $0.1403 1,325 $0.0342 0.12% $21,413 $24,656 -$3,242 0.13% 0.20%Supplier #43 $0.1466 68,716 $0.0307 6.23% $1,169,360 $1,197,185 -$27,825 6.10% 1.68%Supplier #22 $0.1520 27,837 $0.0304 2.52% $509,607 $541,231 -$31,624 2.76% 1.91%Supplier #42 $0.1523 74,114 $0.0279 6.72% $1,155,218 $1,309,677 -$154,459 6.67% 9.32%Supplier #27 $0.1477 67,249 $0.0277 6.10% $941,353 $1,034,180 -$92,828 5.27% 5.60%Supplier #31 $0.1360 4,610 $0.0274 0.42% $77,334 $85,992 -$8,658 0.44% 0.52%Supplier #32 $0.1478 32,531 $0.0269 2.95% $530,231 $541,686 -$11,456 2.76% 0.69%
Appendix 3A
Supplier-Specific Information -- Low-Income Households (Ranked by Weighted Average Premium)

Are Residential Consumers Benefiting from Electric Supply Competition?2021 Update
Appendix 3AJuly 2018 - June 2019
Prepared for the Massachusetts Attorney General’s Office 2/3
Supplier IDAverage
Rate # of Bills
Average Premium
Share of Accounts
Net Consumer Loss
Loss GainShare of
LossShare of
Gain
Appendix 3A
Supplier-Specific Information -- Low-Income Households (Ranked by Weighted Average Premium)
Supplier #29 $0.1499 34,388 $0.0267 3.12% $425,844 $480,912 -$55,068 2.45% 3.32%Supplier #55 $0.1487 26,352 $0.0247 2.39% $322,074 $324,581 -$2,507 1.65% 0.15%Supplier #23 $0.1472 9,841 $0.0235 0.89% $115,221 $122,290 -$7,069 0.62% 0.43%Supplier #20 $0.1460 6,270 $0.0214 0.57% $62,305 $65,599 -$3,294 0.33% 0.20%Supplier #37 $0.1432 56,520 $0.0205 5.12% $677,213 $805,788 -$128,574 4.10% 7.76%Supplier #3 $0.1331 4,176 $0.0157 0.38% $38,522 $58,628 -$20,105 0.30% 1.21%Supplier #7 $0.1377 15,505 $0.0153 1.41% $127,541 $155,124 -$27,583 0.79% 1.66%Supplier #13 $0.1316 14,924 $0.0152 1.35% $134,677 $148,845 -$14,168 0.76% 0.85%Supplier #38 $0.1374 45 $0.0135 0.00% $310 $445 -$136 0.00% 0.01%Supplier #19 $0.1237 1,029 $0.0133 0.09% $9,289 $10,418 -$1,129 0.05% 0.07%Supplier #26 $0.1362 39,327 $0.0126 3.57% $250,151 $340,294 -$90,143 1.73% 5.44%Supplier #68 $0.1403 2,354 $0.0111 0.21% $15,140 $29,222 -$14,081 0.15% 0.85%Supplier #9 $0.1311 44,331 $0.0080 4.02% $211,444 $537,275 -$325,831 2.74% 19.66%Supplier #33 $0.1167 11 $0.0057 0.00% $31 $41 -$11 0.00% 0.00%Supplier #34 $0.1253 40,260 $0.0017 3.65% $40,028 $234,232 -$194,204 1.19% 11.72%Supplier #28 $0.1218 203 $0.0009 0.02% $171 $1,642 -$1,472 0.01% 0.09%Supplier #44 $0.1042 58 -$0.0009 0.01% -$36 $105 -$141 0.00% 0.01%Supplier #14 $0.1222 3,358 -$0.0016 0.30% -$3,516 $12,484 -$16,001 0.06% 0.97%Supplier #64 $0.1061 2,254 -$0.0016 0.20% -$1,921 $12,822 -$14,743 0.07% 0.89%Supplier #50 $0.1246 22 -$0.0030 0.00% -$16 $27 -$43 0.00% 0.00%Supplier #49 $0.1241 3,094 -$0.0058 0.28% -$10,161 $8,325 -$18,486 0.04% 1.12%Supplier #8 $0.1172 1,340 -$0.0060 0.12% -$6,104 $6,882 -$12,986 0.04% 0.78%Supplier #11 $0.1028 39 -$0.0079 0.00% -$322 $7 -$329 0.00% 0.02%Supplier #59 $0.1067 134 -$0.0096 0.01% -$1,330 $361 -$1,691 0.00% 0.10%Supplier #58 $0.0918 24 -$0.0193 0.00% -$345 $0 -$345 0.00% 0.02%

Are Residential Consumers Benefiting from Electric Supply Competition?2021 Update
Appendix 3AJuly 2018 - June 2019
Prepared for the Massachusetts Attorney General’s Office 3/3
Supplier IDAverage
Rate # of Bills
Average Premium
Share of Accounts
Net Consumer Loss
Loss GainShare of
LossShare of
Gain
Appendix 3A
Supplier-Specific Information -- Low-Income Households (Ranked by Weighted Average Premium)
Supplier #63 $0.1062 119 -$0.0198 0.01% -$1,578 $250 -$1,827 0.00% 0.11%Supplier #52 $0.1136 798 -$0.0327 0.07% -$8,022 $15 -$8,037 0.00% 0.48%Supplier #61 $0.1097 1,856 -$0.0347 0.17% -$27,185 $0 -$27,185 0.00% 1.64%

Are Residential Consumers Benefiting from Electric Supply Competition? 2021 Update
Prepared for the Massachusetts Attorney General’s Office
Appendix 3B
Zip Code and Municipality Participation in the Individual Residential Electric Supply Market, September 2018 and September 2019:
Majority-Minority vs. Rest of State

Are Residential Consumers Benefiting from Electric Supply Competition?2021 Update
Appendix 3BSeptember 2019 Data
Prepared for the Massachusetts Attorney General’s Office 1/2
Zip Municipality
Percent nonwhite
and/or Hispanic Total Accounts
Percent low
income accounts
Average markup over
basic All Low income Non-low income68% 357,226 22% 0.0375$ 27% 39% 23%18% 2,097,319 9% 0.0338$ 17% 28% 16%
02121 Dorchester 97% 9,923 36% 0.0283$ 38% 44% 34%02126 Mattapan 96% 8,026 27% 0.0264$ 37% 43% 35%01840 Lawrence 91% 2,682 33% 0.0585$ 22% 33% 17%02119 Roxbury 90% 10,454 29% 0.0243$ 33% 45% 28%01107 Springfield 88% 4,143 51% 0.0291$ 36% 48% 23%01841 Lawrence 86% 14,366 33% 0.0576$ 28% 34% 24%01841 Methuen 86% 56 36% 0.0620$ 29% 30% 28%01105 Springfield 85% 4,995 51% 0.0292$ 34% 47% 21%02124 Dorchester 83% 17,555 25% 0.0273$ 30% 40% 27%01561 Lancaster 82% 348 8% 0.0386$ 14% 19% 14%01103 Springfield 80% 1,288 20% 0.0337$ 14% 32% 9%01109 Springfield 78% 10,391 40% 0.0282$ 27% 40% 19%02150 Chelsea 76% 13,083 18% 0.0268$ 30% 36% 28%01608 Worcester 75% 1,614 10% 0.0457$ 15% 42% 12%01843 Lawrence 75% 8,849 24% 0.0534$ 25% 34% 22%02136 Hyde Park 74% 12,273 21% 0.0274$ 29% 35% 27%02125 Dorchester 69% 14,160 19% 0.0273$ 25% 40% 21%02122 Dorchester 68% 9,014 20% 0.0275$ 27% 43% 23%01902 Lynn 68% 16,137 20% 0.0565$ 28% 40% 25%01104 Springfield 68% 8,428 37% 0.0273$ 25% 35% 19%02128 East Boston 68% 16,348 13% 0.0293$ 21% 36% 19%01901 Lynn 67% 1,310 34% 0.0623$ 24% 31% 21%01108 Springfield 66% 10,627 35% 0.0274$ 23% 34% 17%01905 Lynn 65% 8,647 17% 0.0549$ 27% 38% 25%02366 South Carver 64% 498 7% 0.0181$ 9% 9% 9%
Percent of accounts in competitive supply:
Zip Code and Municipality Participation in the Competitive Supply Market, September 2019: Majority-Minority vs. Rest of State
Majority MinorityRest of State

Are Residential Consumers Benefiting from Electric Supply Competition?2021 Update
Appendix 3BSeptember 2019 Data
Prepared for the Massachusetts Attorney General’s Office 2/2
Zip Municipality
Percent nonwhite
and/or Hispanic Total Accounts
Percent low
income accounts
Average markup over
basic All Low income Non-low income
Percent of accounts in competitive supply:
Zip Code and Municipality Participation in the Competitive Supply Market, September 2019: Majority-Minority vs. Rest of State
02368 Randolph 63% 12,226 15% 0.0475$ 30% 38% 29%02301 Brockton 63% 21,991 21% 0.0443$ 35% 47% 32%01610 Worcester 61% 7,808 26% 0.0499$ 31% 42% 27%01151 Indian Orchard 60% 3,742 35% 0.0248$ 22% 34% 16%01151 Springfield 60% 41 29% 0.0133$ 20% 17% 21%01851 Lowell 60% 10,362 18% 0.0504$ 31% 46% 28%02120 Roxbry Xng 60% 5,423 15% 0.0239$ 20% 42% 16%02111 Boston 60% 4,210 18% 0.0120$ 13% 29% 9%01605 Worcester 54% 8,433 18% 0.0442$ 24% 37% 21%02118 Boston 53% 12,660 10% 0.0164$ 15% 32% 13%02148 Malden 53% 25,348 11% 0.0508$ 21% 34% 19%01119 Springfield 53% 5,282 30% 0.0238$ 20% 31% 15%01854 Lowell 53% 8,473 17% 0.0495$ 26% 44% 22%02302 Brockton 52% 11,390 20% 0.0440$ 34% 45% 32%02131 Roslindale 51% 11,881 13% 0.0269$ 24% 33% 22%02142 Cambridge 50% 2,741 3% 0.0377$ 5% 19% 4%

Are Residential Consumers Benefiting from Electric Supply Competition?2021 Update
Appendix 3BSeptember 2018
Prepared for the Massachusetts Attorney General’s Office 1/2
All Low incomeNon-
Low Income
68% 353,570 23% 0.0258$ 29% 43% 25%
18% 2,087,834 8% 0.0234$ 18% 33% 17%
02121 Dorchester 97% 9,740 37% 0.0165$ 41% 48% 37%02126 Mattapan 96% 7,991 27% 0.0131$ 40% 46% 37%01840 Lawrence 91% 2,603 35% 0.0437$ 27% 39% 20%02119 Roxbury 90% 10,232 30% 0.0125$ 36% 49% 30%01107 Springfield 88% 4,770 50% 0.0321$ 47% 58% 37%01841 Lawrence 86% 14,246 37% 0.0402$ 31% 39% 26%01841 Methuen 86% 59 32% 0.0291$ 27% 26% 28%01105 Springfield 85% 3,832 49% 0.0159$ 21% 38% 5%02124 Dorchester 83% 17,197 25% 0.0129$ 33% 43% 29%01561 Lancaster 82% 348 4% 0.0301$ 14% 38% 13%01103 Springfield 80% 1,095 15% 0.0026$ 4% 6% 4%01109 Springfield 78% 10,914 39% 0.0314$ 33% 47% 24%02150 Chelsea 76% 12,829 19% 0.0119$ 33% 40% 32%01608 Worcester 75% 1,518 12% 0.0370$ 14% 37% 11%01843 Lawrence 75% 8,870 26% 0.0409$ 27% 37% 23%02136 Hyde Park 74% 12,068 21% 0.0136$ 31% 37% 29%02125 Dorchester 69% 13,497 21% 0.0157$ 27% 42% 23%02122 Dorchester 68% 8,951 21% 0.0139$ 29% 47% 25%01902 Lynn 68% 16,144 22% 0.0406$ 30% 41% 27%01104 Springfield 68% 10,668 41% 0.0277$ 43% 56% 33%
Majority Minority
Rest of State
Zip Code and Municipality Participation in the Competitive Supply Market, September 2018: Majority-Minority vs. Rest of State
Zip MunicipalityPercent
nonwhite and/or Hispanic
Total accounts
Percent low income
accounts
Average markup over
basic
Percent of accounts in competitive supply:

Are Residential Consumers Benefiting from Electric Supply Competition?2021 Update
Appendix 3BSeptember 2018
Prepared for the Massachusetts Attorney General’s Office 2/2
All Low incomeNon-
Low Income
68% 353,570 23% 0.0258$ 29% 43% 25%
18% 2,087,834 8% 0.0234$ 18% 33% 17%
Majority Minority
Rest of State
Zip Code and Municipality Participation in the Competitive Supply Market, September 2018: Majority-Minority vs. Rest of State
Zip MunicipalityPercent
nonwhite and/or Hispanic
Total accounts
Percent low income
accounts
Average markup over
basic
Percent of accounts in competitive supply:
02128 East Boston 68% 15,586 14% 0.0164$ 25% 39% 22%01901 Lynn 67% 1,339 35% 0.0446$ 24% 32% 19%01108 Springfield 66% 8,909 32% 0.0065$ 13% 21% 9%01905 Lynn 65% 9,280 19% 0.0395$ 35% 48% 32%02366 South Carver 64% 498 7% 0.0066$ 11% 17% 11%02368 Randolph 63% 12,246 16% 0.0312$ 29% 36% 28%02301 Brockton 63% 22,071 23% 0.0347$ 35% 47% 31%01610 Worcester 61% 7,812 27% 0.0355$ 32% 46% 27%01151 Indian Orchard 60% 3,737 37% 0.0243$ 25% 37% 18%01151 Springfield 60% 26 23% NA 0% 17% 0%01851 Lowell 60% 10,345 13% 0.0331$ 33% 75% 27%02120 Roxbry Xng 60% 5,093 15% 0.0139$ 23% 45% 19%02111 Boston 60% 4,186 18% 0.0057$ 12% 32% 8%01605 Worcester 54% 8,382 19% 0.0308$ 25% 40% 22%02118 Boston 53% 12,400 10% 0.0059$ 13% 32% 11%02148 Malden 53% 25,155 12% 0.0371$ 21% 34% 20%01119 Springfield 53% 4,863 33% 0.0186$ 15% 32% 6%01854 Lowell 53% 8,450 11% 0.0356$ 26% 68% 21%02302 Brockton 52% 11,354 21% 0.0343$ 32% 43% 29%02131 Roslindale 51% 11,684 13% 0.0149$ 25% 34% 24%02142 Cambridge 50% 2,582 3% 0.0251$ 5% 19% 4%

Are Residential Consumers Benefiting from Electric Supply Competition? 2021 Update
Prepared for the Massachusetts Attorney General’s Office
Appendix 3C
Zip Code and Municipality Participation in the Individual Residential Electric Supply Market, September 2018 and September 2019:
Bottom 20 Median Income vs. Rest of State
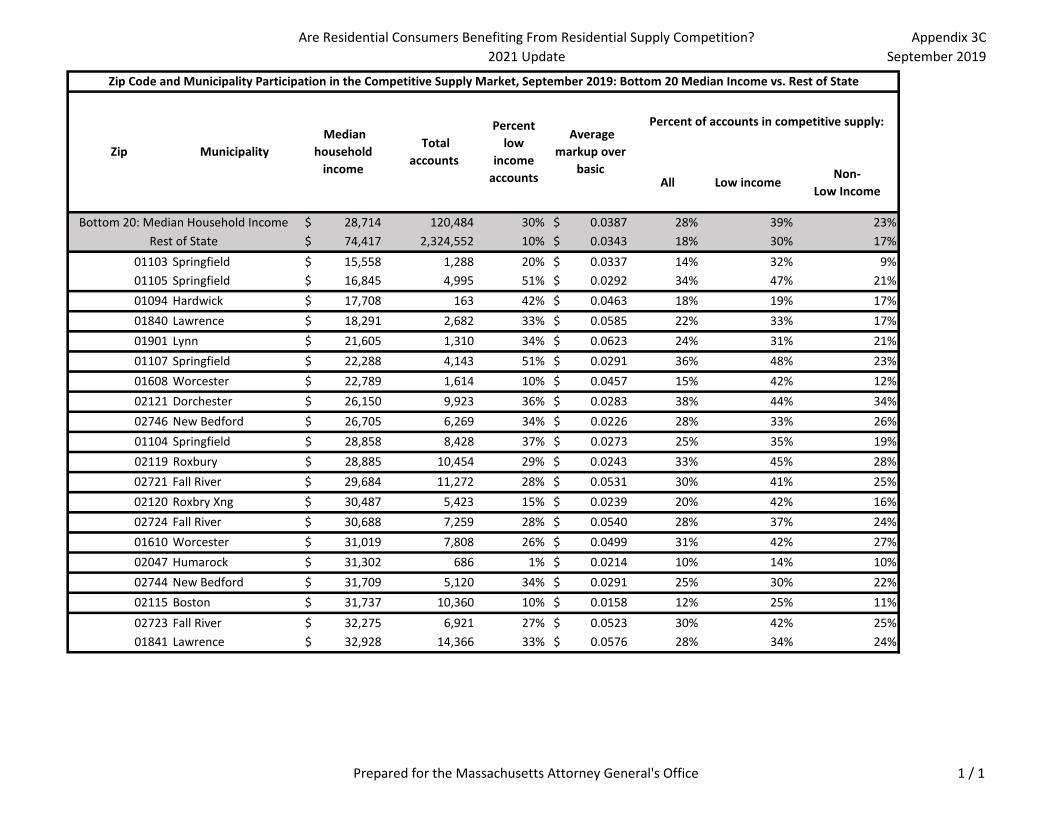
Are Residential Consumers Benefiting From Residential Supply Competition?2021 Update
Appendix 3CSeptember 2019
Prepared for the Massachusetts Attorney General's Office 1 / 1
All Low incomeNon-
Low Income
28,714$ 120,484 30% 0.0387$ 28% 39% 23%74,417$ 2,324,552 10% 0.0343$ 18% 30% 17%
01103 Springfield 15,558$ 1,288 20% 0.0337$ 14% 32% 9%01105 Springfield 16,845$ 4,995 51% 0.0292$ 34% 47% 21%01094 Hardwick 17,708$ 163 42% 0.0463$ 18% 19% 17%01840 Lawrence 18,291$ 2,682 33% 0.0585$ 22% 33% 17%01901 Lynn 21,605$ 1,310 34% 0.0623$ 24% 31% 21%01107 Springfield 22,288$ 4,143 51% 0.0291$ 36% 48% 23%01608 Worcester 22,789$ 1,614 10% 0.0457$ 15% 42% 12%02121 Dorchester 26,150$ 9,923 36% 0.0283$ 38% 44% 34%02746 New Bedford 26,705$ 6,269 34% 0.0226$ 28% 33% 26%01104 Springfield 28,858$ 8,428 37% 0.0273$ 25% 35% 19%02119 Roxbury 28,885$ 10,454 29% 0.0243$ 33% 45% 28%02721 Fall River 29,684$ 11,272 28% 0.0531$ 30% 41% 25%02120 Roxbry Xng 30,487$ 5,423 15% 0.0239$ 20% 42% 16%02724 Fall River 30,688$ 7,259 28% 0.0540$ 28% 37% 24%01610 Worcester 31,019$ 7,808 26% 0.0499$ 31% 42% 27%02047 Humarock 31,302$ 686 1% 0.0214$ 10% 14% 10%02744 New Bedford 31,709$ 5,120 34% 0.0291$ 25% 30% 22%02115 Boston 31,737$ 10,360 10% 0.0158$ 12% 25% 11%02723 Fall River 32,275$ 6,921 27% 0.0523$ 30% 42% 25%01841 Lawrence 32,928$ 14,366 33% 0.0576$ 28% 34% 24%
Bottom 20: Median Household IncomeRest of State
Zip Code and Municipality Participation in the Competitive Supply Market, September 2019: Bottom 20 Median Income vs. Rest of State
Zip Municipality Median
household income
Total accounts
Percent low
income accounts
Average markup over
basic
Percent of accounts in competitive supply:

Are Residential Consumers Benefiting from Electric Supply Competition?2021 Update
Appendix 3CSeptember 2018
Prepared for the Massachusetts Attorney General’s Office 1/1
All Low incomeNon-
Low Income28,745$ 115,201 29% 0.0261$ 31% 47% 24%
74,389$ 2,316,695 9% 0.0238$ 19% 35% 17%
01103 Springfield 15,558$ 1,095 15% 0.0026$ 4% 6% 4%01105 Springfield 16,845$ 3,832 49% 0.0159$ 21% 38% 5%01094 Hardwick 17,708$ 164 36% 0.0301$ 20% 27% 15%01840 Lawrence 18,291$ 2,603 35% 0.0437$ 27% 39% 20%01901 Lynn 21,605$ 1,339 35% 0.0446$ 24% 32% 19%01107 Springfield 22,288$ 4,770 50% 0.0321$ 47% 58% 37%01608 Worcester 22,789$ 1,518 12% 0.0370$ 14% 37% 11%02121 Dorchester 26,150$ 9,740 37% 0.0165$ 41% 48% 37%02746 New Bedford 26,705$ 6,176 35% 0.0052$ 30% 35% 27%01104 Springfield 28,858$ 10,668 41% 0.0277$ 43% 56% 33%02119 Roxbury 28,885$ 10,232 30% 0.0125$ 36% 49% 30%02721 Fall River 29,684$ 9,259 17% 0.0372$ 30% 69% 22%02120 Roxbry Xng 30,487$ 5,093 15% 0.0139$ 23% 45% 19%02724 Fall River 30,688$ 3,988 18% 0.0386$ 30% 72% 21%01610 Worcester 31,019$ 7,812 27% 0.0355$ 32% 46% 27%02047 Humarock 31,302$ 687 1% 0.0097$ 10% 11% 10%02744 New Bedford 31,709$ 5,046 34% 0.0113$ 27% 34% 23%02115 Boston 31,737$ 10,134 10% 0.0072$ 13% 25% 12%02723 Fall River 32,275$ 6,799 17% 0.0371$ 31% 71% 22%01841 Lawrence 32,928$ 14,246 37% 0.0402$ 31% 39% 26%
Bottom 20: Median HH Income
Rest of State
Zip Code and Municipality Participation in the Competitive Supply Market, September 2018: Bottom 20 Median Income vs. Rest of State
Zip Municipality Median
household income
Total accounts
Percent low income
accounts
Average markup over
basic
Percent of accounts in competitive supply:

Are Residential Consumers Benefiting from Electric Supply Competition? 2021 Update
Prepared for the Massachusetts Attorney General’s Office
Appendix 3D
Zip Code and Municipality Participation in the Individual Residential Electric Supply Market, September 2018 and September 2019:
Top 20 Median Income vs. Rest of State

Are Residential Consumers Benefiting From Residential Supply Competition?2021 Update
Appendix 3DSeptember 2019
Prepared for the Massachusetts Attorney General's Office 1 / 1
All Low incomeNon-
Low Income152,557$ 73,421 3% 0.0212$ 13% 17% 13%
69,676$ 2,371,615 11% 0.0349$ 19% 32% 17%02493 Weston 199,519$ 3,933 2% 0.0172$ 14% 20% 14%02468 Waban 196,250$ 2,292 2% 0.0238$ 12% 16% 12%02030 Dover 185,542$ 2,091 1% 0.0107$ 13% 6% 13%01467 Harvard 183,750$ 73 3% 0.0376$ 19% 50% 18%01741 Carlisle 166,111$ 1,918 1% 0.0177$ 14% 8% 14%01776 Sudbury 165,745$ 6,507 3% 0.0192$ 12% 17% 12%01770 Sherborn 155,956$ 1,585 2% 0.0157$ 13% 17% 13%01773 Lincoln 153,438$ 2,252 4% 0.0259$ 15% 10% 15%02420 Lexington 151,607$ 5,466 3% 0.0238$ 12% 13% 12%01740 Bolton 147,446$ 1,899 2% 0.0353$ 16% 31% 16%02421 Lexington 147,335$ 6,364 3% 0.0195$ 12% 13% 12%01772 Southborough 145,179$ 3,534 2% 0.0339$ 16% 21% 16%01778 Wayland 143,616$ 5,084 3% 0.0147$ 15% 22% 15%01890 Winchester 143,017$ 7,736 2% 0.0242$ 11% 18% 11%02056 Norfolk 141,278$ 3,607 3% 0.0133$ 14% 15% 14%02492 Needham 140,734$ 6,863 2% 0.0179$ 14% 16% 14%02461 Newton Hlds 140,733$ 2,847 5% 0.0250$ 14% 16% 14%01885 Boxford 140,268$ 92 3% 0.0401$ 14% 0% 15%01921 Boxford 140,268$ 2,787 1% 0.0445$ 14% 11% 14%01748 Hopkinton 138,551$ 6,491 4% 0.0129$ 13% 20% 12%
Top 20: Median HH IncomeRest of State
Zip Code and Municipality Participation in the Competitive Supply Market, September 2019: Top 20 Median Income vs. Rest of State
Zip Municipality Median
household income
Total accounts
Percent low income
accounts
Average markup over
basic
Percent of accounts in competitive supply:

Are Residential Consumers Benefiting from Electric Supply Competition?2021 Update
Appendix 3DSeptember 2018
Prepared for the Massachusetts Attorney General’s Office 1/1
All Low incomeNon-
Low Income
152,554$ 72,901 2% 0.0116$ 14% 16% 14%
69,745$ 2,358,995 10% 0.0243$ 20% 36% 18%
02493 Weston 199,519$ 3,913 2% 0.0057$ 15% 19% 15%02468 Waban 196,250$ 2,289 2% 0.0108$ 13% 20% 13%02030 Dover 185,542$ 2,087 1% 0.0029$ 14% 6% 14%01467 Harvard 183,750$ 73 3% 0.0128$ 18% 50% 17%01741 Carlisle 166,111$ 1,891 1% (0.0005)$ 14% 19% 14%01776 Sudbury 165,745$ 6,358 3% 0.0074$ 13% 15% 13%01770 Sherborn 155,956$ 1,567 2% 0.0089$ 13% 16% 13%01773 Lincoln 153,438$ 2,253 3% 0.0129$ 16% 8% 16%02420 Lexington 151,607$ 5,452 3% 0.0106$ 13% 15% 13%01740 Bolton 147,446$ 1,878 2% 0.0295$ 17% 33% 17%02421 Lexington 147,335$ 6,339 3% 0.0092$ 13% 13% 13%01772 Southborough 145,179$ 3,535 1% 0.0240$ 19% 73% 18%01778 Wayland 143,616$ 5,085 3% 0.0075$ 15% 17% 15%01890 Winchester 143,017$ 7,706 2% 0.0130$ 12% 13% 12%02056 Norfolk 141,278$ 3,573 3% 0.0054$ 14% 9% 14%02492 Needham 140,734$ 6,827 2% 0.0109$ 15% 16% 15%02461 Newton Hlds 140,733$ 2,845 5% 0.0170$ 15% 19% 15%01885 Boxford 140,268$ 92 2% 0.0318$ 13% 0% 13%01921 Boxford 140,268$ 2,795 2% 0.0352$ 15% 11% 15%01748 Hopkinton 138,551$ 6,343 3% 0.0044$ 12% 13% 12%
Top 20: Median HH Income
Rest of State
Zip Code and Municipality Participation in the Competitive Supply Market, September 2018: Top 20 Median Income vs. Rest of State
Zip Municipality Median
household income
Total accounts
Percent low income
accounts
Average markup over
basic
Percent of accounts in competitive supply: