Embed Size (px)
Citation preview
1
Are BMI and other anthropometric measures appropriate as indices for obesity? -
A study in an Asian population
Victor H H Goh,
C F Tain,
Terry Y Y Tong
Helen P P Mok,
M T Wong
Department of Obstetrics and Gynaecology
National University of Singapore
National University Hospital
Kent Ridge
Singapore 119074
Running Title: BMI and other anthropometric indices for obesity
Direct all correspondence to Professor Victor H H Goh at the above address or the
following contacts numbers:
Tel: 65-67724398
Fax: 65-68723056
E-mail: [email protected]
by guest, on July 13, 2018w
ww
.jlr.orgD
ownloaded from
2
ABSTRACT
We have examined the relationships between percent body fat (PBF) and various risk
factors for cardiovascular disease and insulin resistance as well as how good BMI and
other anthropometric measures are as indices of obesity. We have shown that high PBF
as measured by the 2C DEXA method was associated with increased risk of CVD and
insulin resistance. As an index for obesity, the WHO recommended BMI of 30 kg/m2 has
very low sensitivity, 6.7% and 13.4% for men and women respectively. In addition, for
every obese man and woman identified, 6.7 and 1.76 times of non-obese men and
women, respectively will be misclassified as obese, implying that the WHO BMI cut off
point for obesity is inappropriate for our population. On the other hand, with the locally
established BMIs cut off point for obesity of 27 kg/m2 for men and 25 kg/m2 for women,
the sensitivity was improved, to 46.7% and 60.8%, respectively. However, the problem of
high rates of false positive classification persisted. For every obese man and woman
identified 3.76 and 1.64 times of non-obese men and women respectively, will be
misclassified as obese. We have shown that none of the other anthropometric indices was
as good as the locally established BMIs. We concluded that the BMI cut off points of
obesity for men and women are different. These BMI cut-off points were most precise
among all the other anthropometric indices studied. However, they are still disadvantaged
by the high false positive misclassification, especially for men. For more effective
management of the increasing incidence of obesity, the challenge is to establish more
precise, simple and cost effective methods for the measurements of PBF.
Key Words: BMI, obesity, percent body fat, Waist/Hip (W/H) ratio, Waist
Circumference (WC), Hip Circumference (HC), Waist/Height (W/Ht) ratio, Asian
by guest, on July 13, 2018w
ww
.jlr.orgD
ownloaded from

3
INTRODUCTION
With increasing affluence, and a rapidly aging population, lifestyle diseases such as
cancers and coronary heart disease have become the major causes of death in Singapore
(1). Coronary heart disease (CHD) is the second leading cause of death accounting for
24.5% of all deaths in 2000 (2). This mortality rate is comparable to those observed in the
West and higher than those in other parts of Asia, such as Japan and Hong Kong (3). A
key issue in the management of coronary heart disease is prevention. Many of the
predisposing risk factors including obesity can be prevented or modified through
appropriate lifestyle changes and medical treatment.
The body-mass index (BMI) has been used routinely to classify subjects as obese or non-
obese. The World Health Organization (WHO) and the International Obesity Task Force
(IOTF) recommend the BMI cut-off point of 30 kg/m2 for obesity. This cut-off point was
derived largely from mortality statistics from European and American populations.
Several studies carried out mainly among Asian populations have challenged the notion
that one BMI cut-off point fits all population. They have, separately established that the
BMI cut-off point for obesity for Asian populations is pegged between 23kg/m2 to
27kg/m2 (4-9). Furthermore, studies have shown that Asian populations have high risks
of type-2 diabetes, cardiovascular disease and mortality from other causes at relatively
lower BMI, which they postulated to be largely due to the higher proportion of body fat
in Asian populations (10-16). Therefore, it has been suggested that lower BMI cut-off
points for obesity appropriate for Asian populations should be adopted. In its Lancet
publication in 2004, the WHO Expert Consultation after a meta-analysis of population
data from more than 10 countries noted that the proportion of Asian people with a high
risk of type-2 diabetes and cardiovascular disease is substantial at BMIs lower than the
existing WHO cut-off point for overweight (>25 kg/m2). The consultation also agreed
by guest, on July 13, 2018w
ww
.jlr.orgD
ownloaded from

4
that the WHO BMI cut-off points should be retained as international classifications and
suggested lower BMI action points of 23 kg/m2 and 27.5 kg/m2, by which individual
countries could use to define the cut-off points for increased risk for their population
(17).
In this study, we analyzed a subset of data from our on-going study on the determinants
of the aging process in an Asian population. Specifically we examined the data and
sought answer to the question of whether the use of BMI and other anthropometric
measures are appropriate indices for obesity.
by guest, on July 13, 2018w
ww
.jlr.orgD
ownloaded from

5
METHODS
Subjects
A total of 1069 healthy subjects, 298 men and 771 women aged between 30 and 70 years
old, were included in this analysis. Subjects were recruited from the general public. Only
subjects with no known existing or history of major medical illnesses such as cancer,
hypertension, thyroid dysfunction, diabetes, osteoporotic fracture and cardiovascular
events were included in the study. This study was sanctioned by the National University
of Singapore. Informed consent was obtained from each volunteer. As 96.7% of all
subjects in this study were Chinese, the results and inferences are applicable to this ethnic
group which make up the majority (76%) of the Singapore population.
Each subject answered a detailed questionnaire which included questions on medical,
dietary, social, sex history, family history of dyslipidemia and other relevant information
concerning consumption of hormones and food supplements.
Anthropometric measurements
The body weight was measured without shoes using an electronic measuring scale, and
height to the nearest cm was taken. The body mass index (BMI) was calculated as weight
in kg divided by the height (in m2). Waist circumference (WC) in cm was measured
midway between the lower costal margin and iliac crest during the end-expiratory phase
(18). Hip circumference (HC) in cm was measured at the level of the greater trochanters
(18). The waist-to-hip (W/H) ratio was defined as the waist circumference divided by the
hip circumference, while the waist/height (W/Ht) ratio was defined as the waist
circumference divided by the height in cm.
by guest, on July 13, 2018w
ww
.jlr.orgD
ownloaded from

6
Body fat
Dual-energy X-ray absorptiometry (DEXA) has been used for estimation of the percent
body fat (PBF) and found to correlate well with other methods including
hydrodensitometry and Jackson and Pollock (7-site) skinfold prediction (19-23). Each
subject had a whole body scan by DEXA (DPX-L, Lunar Radiation, Madison, WI, USA;
software version 1.3z). Percent body fat (PBF) was computed automatically by the
DEXA scanner and the Siri formula-corrected percent was used to reflect the total
percent body fat.
Serum lipid and triglyceride levels
An overnight 12-h fasting blood sample was collected and serum levels of total
cholesterol (TC) and triglycerides (TG) were measured using an automated procedure.
High density lipoprotein-cholesterol (HDL) was determined after precipitation of
apolipoprotein B-containing lipoproteins with sodium phosphotungstate and MgCl2 (24).
Low density lipoprotein-cholesterol (LDL) was computed according to the following
formula (LDL = TC – (HDL + [TG x 0.45]). The ratio of total cholesterol to HDL
cholesterol (TC/HDL) was used as the atherogenic index (25).
Measurement of serum glucose and insulin levels
Fasting levels of glucose was measured using the routine clinical chemistry laboratory
method at the National University Hospital. While fasting levels of insulin was measured
by an EIA method with kits bought from Abbott Laboratory (USA) and the method of
analysis was based on the Axsym auto-analyser. Internal quality control samples showed
inter-assay coefficient of variation of less than 10%.
by guest, on July 13, 2018w
ww
.jlr.orgD
ownloaded from

7
Statistical analysis
Statistical analyses were performed using SPSS for windows version 11. We looked at
basic descriptive statistics and also linear regression analysis, student t test and Spearmen
and Pearson correlation analyses where appropriate. The sensitivity and 1-specificity
(false positive rate) for detection of obesity, which is defined as having a PBF of >25%
for men and >35% for women, using BMI, WC, HC, W/H and W/Ht were computed
based the ROC plots.
by guest, on July 13, 2018w
ww
.jlr.orgD
ownloaded from

8
RESULTS
Overall, there was no significant difference in age between men and women. On the other
hand, most lipids except HDL, and other anthropometric measures in men were
significantly higher (Student t test, p<0.001) than corresponding levels in women (Table
1).
Data from the DEXA whole body scan showed that men have significantly lower PBF
(ranging from 5%-28%) than corresponding levels in women (ranging from 12% to
44%). On an average, men between ages 30 and 70 years have 17.5% of body fat and this
was more than 10 percent points less than that for women (28.4%, Table 1).
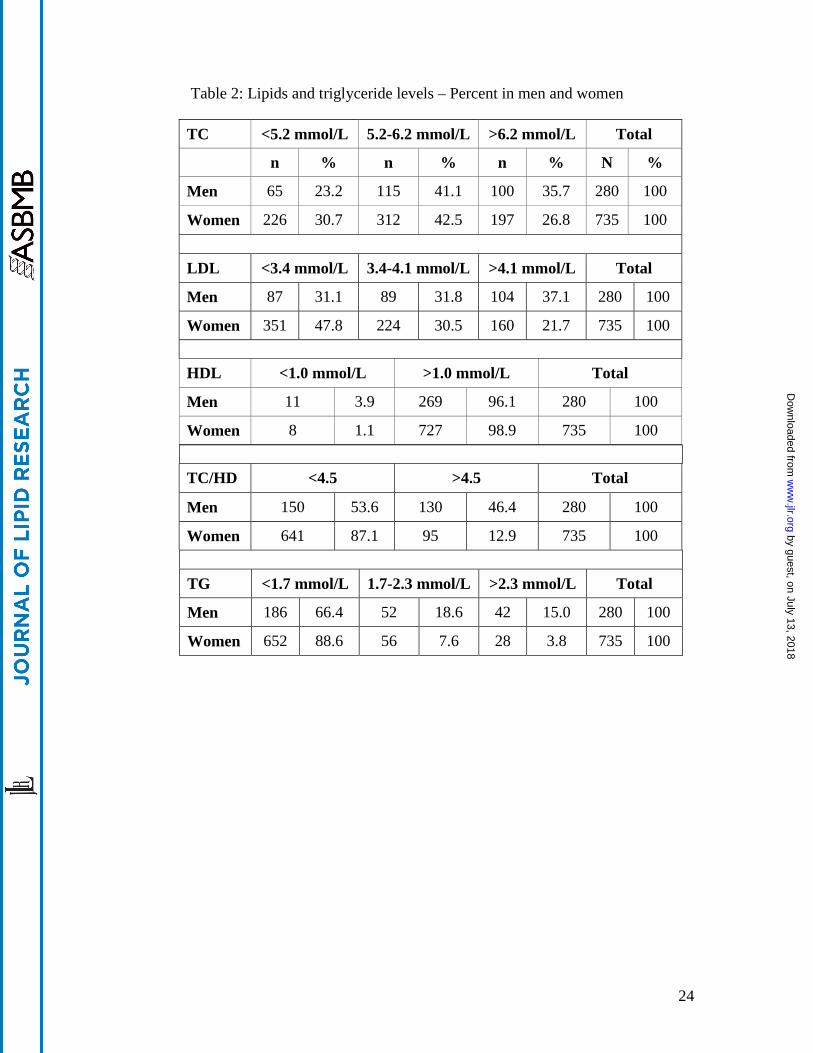
More men than women, 76.8% and 69.3%, respectively, have high total cholesterol levels
(>5.2 mmol/L) (Table 2). Almost all men and women have HDL levels higher than 1
mmol/L). As with TC, more men (37.1%) have high levels of LDL (>4.1 mmol/L) than
women (21.7%). The atherogenic risk factor (TC/HDL) in men and women reflected
those of TC and LDL. More men (46.4%) have high atherogenic risk (TC/HDL > 4.5)
than women (12.9%). Triglyceride level was higher in men than women; more men
(15.0%) than women (3.8%) have high levels of TG (>2.3mmol/L) (Table 2).
The distributions of men and women in the various PBF groups are shown in Table 3.
Using the WHO-recommended PBF of >25% for men and >35% for women cut-off
points for obesity, 5.7% of our local men, while 13.1% of women were classified as
obese. The percent of men considered as overweight (PBF 20-24%) and women (PBF 30-
34%), was respectively, 26.8% and 29.7% (Table 3).
by guest, on July 13, 2018w
ww
.jlr.orgD
ownloaded from

9
Increasing PBF was associated with increased risks of cardiovascular disease and
diabetes. Table 4 shows the risk factors - TC, HDL, LDL, TC/HDL, TG, GLU and INS
levels in men and women in the various PBF groups. For men, increased risk was noted
for LDL, HDL, TC/HDL, TG, GLU and INS when PBF increased from <10% to the
group with 11-19% (Table 4). When PBF increased to above 20%, risk increased further
for LDL and INS, while for the obese group (PBF >25%), further increase in risk was
noted only for INS (Table 4). In women on the other hand, the impact of increasing PBF
on the various risk factors was more severe than in men. Increase risk was noted for TC,
LDL, TC/HDL, TG, GLU and INS but not for HDL when PBF increased from <20% to
21-29%. The risk increased further when PBF increased to 30-34% and all risk factors
were significantly worse than those in the 21-29% PBF group; furthermore HDL was
significantly lower than those in the <20% PBF group. Further increase in risk was noted
for LDL, TC/HDL and INS in the obese group of >35% (Table 4).
Figures 1 and 2 show the plots of the percent of men and women within each PBF group
who have high risk levels, TC >6.2 mmol/L, LDL >4.1 mmol/L, HDL <1.0 mmol/L,
TC/HDL >4.5, TG >2.3 mmol/L and INS >25 mIU/L. More men in the overweight group
(PBF 19-24%) have high TC, LDL, TC/HDL, and TG levels when compared to the low
PBF group (PBF <10%). In the obese group (PBF >25%) even more men have high
TC/HDL and INS, and low HDL levels when compared to the overweight group. Similar
trend was noted for women, except that in the obese group (>35% body group), more
women have high TC, LDL, TC/HDL and INS when compared to those in the overweight
group (30-34% body fat).
In both men and women, BMI was not significantly correlated with age; hence regression
plots between BMI and PBF were established. Figure 3 depicts the linear regressions
by guest, on July 13, 2018w
ww
.jlr.orgD
ownloaded from

10
between percent body fat (DEXA) against calculated BMIs for men and women. In both
men and women, the BMIs were highly significantly correlated with the PBF (r = 0.5 –
0.6, p = 0.000 Pearson correlation).
From the regression equations derived from the plots shown in Figure 3, the BMIs
corresponding to a body fat of 25% for men and 35% for women were, respectively,
27kg/m2 and 25kg/m2, while the corresponding BMIs for PBF of >20%<25% for men
and >30%<35% for women, were respectively, 25 kg/m2 and 23 kg/m2.
Table 5 showed the comparative differences in sensitivity and 1-specificity (false positive
rate) derived from the ROC plots for the different parameters including those for the
WHO-recommended and locally established BMI cut-off points for obesity. Although the
WHO-recommended BMI cut-off point for obesity (30 kg/m2) for men and women has
high specificity (97.3% and 95%), respectively, the sensitivity was poor, 6.7% and
13.4%, respectively (Table 5). The rate of obesity in men and women was, respectively,
5.7% and 13.1%. What this means is that if the BMI of 30 kg/m2 was used, than between
86.6% to 93.3% of obese women and men will be misclassified as non-obese. On the
other hand, 2.7% and 5.0% of non-obese men and women, respectively, will be screen
positive (Table 5). In contrast, when the BMI cut-off points of 27 kg/m2 for men and 25
kg/m2 for women were used, the sensitivity for both genders was greatly increased to
46.7% and 60.8%, respectively. However, the false positive rates (1-specificity) were
increased to about 10.5%. These rates of false positive classification based on the locally
appropriate BMI cut off points must be viewed in the context of the rates of obesity for
men (5.7%) and women (13.1%) based on PBF. What this means is that more non-obese
men than obese men will be classified as obese. While almost the same proportion of
non-obese women as obese women will be misclassified as obese.
by guest, on July 13, 2018w
ww
.jlr.orgD
ownloaded from

11
For men, the other anthropometric measures (WC>92.5 cm, HC>101.5cm, W/H >0.94
and W/Ht >0.55) showed almost identical sensitivity and 1-specificity rates as compared
to the BMI cut off point of 27 kg/m2 (Table 5). Using the cut off points of WC>80.5 cm,
HC>99.5cm and W/Ht>0.513 for women, on the other hand, the sensitivity rates ranged
from 47.9% to 59.4%, while the 1-spepcificity rates were almost similar to the BMI cut
off point of 25 kg/m2 (Table 5). For W/H ratio (>0.826) in women, the sensitivity was the
lowest (34.4%) and the 1-specificity was the highest (17.7%, Table 5).
by guest, on July 13, 2018w
ww
.jlr.orgD
ownloaded from

12
DISCUSSION
The World Health Organization (WHO) defines obesity as a condition of excessive fat
accumulation to the extent that health and well-being are affected. The cut-off points for
obesity for men and women correspond to PBF of 25% and 35%, respectively (26-28).
We have used the DEXA scans, a two-compartment model for assessing the PBF.
Although the 4C model is more accurate in assessing the PBF, it nevertheless is not
practicable for use in large sample size as with the present study. It was noted in the study
by Deurenberg-Yap et al (29) that when compared to the 4C model, the 2C DEXA-
derived PBF consistently underestimated PBF in both men and women. However,
interpretations of those data must also take into account the large variations and skewed
distributions of the differences for all three 2C models (29).
Applying the WHO-recommend PBF cut-off points for obesity, the incidence of obesity
among our healthy 30-70 y old local men was 5.7% and for women, 13.1%. Furthermore,
we have shown that increasing PBF in men and women, especially to levels beyond the
overweight and obese cut-off points, was associated with higher levels of TC, LDL,
TC/HDL, INS, GLU and lower levels of HDL. Clearly the classifications based on
DEXA-derived PBF in the present study showed that obesity was associated with
increase risks of CHD and type-2 diabetes as was shown earlier (13,15, 26, 30).
Obesity is a subset of being overweight. Not everyone who is overweight is obese. This is
clearly shown in body builders who have high BMI but low PBF. Therefore, it is worth
reminding that BMI is a measure of body weight and not of obesity. Many studies have
shown that the BMI cut off points for the prescribed classifications as overweight and
obese differed from those recommended by WHO. For some Asian populations including
those from Taiwan, Hong Kong, Singapore and also a Spanish population, the
by guest, on July 13, 2018w
ww
.jlr.orgD
ownloaded from
13
corresponding BMI cut-off points for overweight and obese were, respectively, 23 kg/m2
and 25-27 kg/m2 (6,8,10,11,31-34). Hence, there was a need to review the WHO
recommended cut-off limits for obesity in Asian populations.
Using regression analyses and the ROC plots the relationships between BMI and DEXA-
derived PBF, we have shown that the BMI cut-off point for obesity for our local healthy
men and women, aged between 30 and 70 y old, was 27kg/m2 and 25kg/m2, respectively,
concurring with earlier suggestions by many Asian investigators (6,8,10,11,31,33,34).
What we differ from these earlier studies is that there is a clear gender difference in BMI
cut-off for obesity for Asian men (27kg/m2) and for Asian women (25kg/m2), and
therefore, the gender difference must be taken into consideration when BMI is used as an
index of obesity for Asian populations.
The usefulness of a proxy measure for obesity depends not only on having high
sensitivity but also high specificity or conversely low 1-specificity (false positive
classification). Having shown that the BMI cut-off points for obesity are different
between Asian men and women and from that recommended by WHO, the question is
how good are these new BMI cut-off points as indices for screening for obesity in the
local population? Using the ROC plots, we have derived at the comparative sensitivity
and 1-specificity rates for BMIs and other anthropometrics indices in identifying obese
individuals in our population. Clearly, by using the WHO recommended BMI cut-off
point of 30kg/m2 for obesity, which showed a sensitivity of 6.7% and 13.4% men and
women, respectively, the majority of the 5.7% of obese men and 13.1% of the obese
women in our population would have been misclassified. In addition, about 2.7% of non-
obese men and 5% of non-obese women would be misclassified as obese. In numerical
term, the picture was more stark; for men, if the BMI of 30kg/m2 was used as cut-off for
by guest, on July 13, 2018w
ww
.jlr.orgD
ownloaded from

14
obesity, then for every obese man positively identified, 14 others will be missed, and 6.7
non-obese men will be misclassified as obese. For women, the outcome was slightly
better, but nonetheless, not promising. For every obese woman positively identified, 6.5
others will be missed and 1.79 non-obese women will be misclassified as obese.
Certainly, these results do not augur well for a BMI of 30kg/m2 as the cut-off point for
obesity in Asian men and women.
Using the locally established BMI of 27kg/m2 for men and 25kg/m2 for women, the
sensitivity was much improved. On an average, about 46.7% of obese men and 60.8% of
obese women will be positively identified. However, for every obese man and obese
women identified, there will be 3.76 and 1.64 times of non-obese men and women,
respectively that will be misclassified as obese.
For men, the other anthropometric measures for obesity, W/H (>0.94), WC (>92.5cm),
HC (>101.5 cm) and W/Ht (>0.55), the sensitivity and 1-specificity rates were similar to
those of the BMI of 27kg/m2. In women, the sensitivity and 1-specificity rates for WC
(>80.5 cm), HC (>99.5 cm) and W/Ht (>0.513) were closed to but lower than
corresponding levels for BMI of 25kg/m2. As for W/H (>0.826), the sensitivity and 1-
specificity were much lower and higher, respectively than those for BMI of 25kg/m2.
This result is probably due to the fact that the distribution of body fat in women is
different from that in men, with fat in men more centrally localised, while for women,
more subcutaneously. The W/H ratio is a measure that reflects central obesity, hence
when fat is distributed subcutaneously; W/H is not a good index. Overall, none of the
other anthropometric measures in both men and women is better as an index for
screening obesity than the locally established BMIs for men (27kg/m2) and women
(25kg/m2).
by guest, on July 13, 2018w
ww
.jlr.orgD
ownloaded from
15
However, if these BMI cut-off points were to be used as screening indices for obesity for
local men and women, then a strategy must be in place to address the high levels false
positive classifications of non-obese men and women. One possibility is to conduct
confirmation tests, such as the use of more accurate PBF methods of estimation on all
positive cases before any intervention is applied. Although cumbersome, this strategy
would prevent the consequences of mismanagement of non-obese individuals as obese.
On the other hand, the problem of high false negative classification (40%-53%) is much
more difficult to address. There is no way, with the use of the BMI indices, to identify
obese individuals who would be misclassified as non-obese. High false negative or
positive classification rates would lead to labeling obese individuals as normal and
normal individuals as obese, and consequentially, denying obese individuals the
appropriate treatment while wrongly subjecting others to the stigma of being obese or
worse to seek treatment which is not warranted.
The incidence of obesity with its attendant high risks of serious health consequences in
many countries including Singapore is increasing. Many countries are working in concert
with the WHO and IOTF to proactively address this problem. As shown in this study,
BMIs adjusted for the local population have much improved sensitivity, but are still
disadvantaged by high false positive rates especially for men. Overall, locally established
BMI cut off points are better indices for screening of obesity that any of the
anthropometric indices studied. However, to better assist in efforts to combat the scourge
of rising incidence of obesity more precise indices for obesity need to be established.
There is an urgent need to improve on existing methods as well as to develop new,
simple, sensitive, accurate and cost effective methods for estimation of PBF so that
obesity could be more efficiently managed. As suggested by Deurenberg-Yap et al, if
by guest, on July 13, 2018w
ww
.jlr.orgD
ownloaded from

16
hydration and density of FFM for specific population could be established and used, then
densitometry including DEXA could be an alternative method which could be used on
large sample size. However, if simplicity and cost are major considerations, then
hygrometry could be a method of choice (29).
by guest, on July 13, 2018w
ww
.jlr.orgD
ownloaded from

17
ACKNOWLEDGMENTS
We would like to acknowledge the expert technical input by the team of laboratory
officers, Mr. Baharudin Bin Said, Ms Eng Sok Kheng, Ms Poon Peng Cheng, Ms Ng
Hwee Lee and Ms Zhao Huiqin in this study. We thank the medical officers from the
Department of Obstetrics and Gynaecology, National University Hospital, who had
done the physical examination of all volunteers. This study was funded by the National
University of Singapore through the Academic Research Fund.
by guest, on July 13, 2018w
ww
.jlr.orgD
ownloaded from

18
REFERENCES
1. Ministry of Home Affairs. 2000. Report of the Registry of Births and Deaths.
Ministry of Home Affairs: Singapore.
2. Lipids Ministry of Health Clinical Practice Guidelines 7/2001.
3. World Health Organization. WHO Statistics Annals 1996. WHO: Geneva, 1998.
4. Deurenberg, P., M. Yap, and W. A. van Staveren. 1998. Body mass index and
percent body fat: A meta analysis among different ethnic groups. Int. J. Obes. Relat.
Metab. Disord. 22(12):1164-1171.
5. Stevens, J., and E. M. Nowicki. 2003. Body mass index and mortality in Asian
populations: implications for obesity cut-points. Nutr. Rev. 61(3):104-107.
6. Ko, G. T., J. Tang, J. C. Chan, R. Sung, M. M. Wu, H. P. Wai, and R. Chen. 2001.
Lower BMI cut-off value to define obesity in Hong Kong Chinese: an analysis
based on body fat assessment by bioelectrical impedance. Br. J. Nutr. 85(2):239-
242.
7. Wang, J., J. C. Thornton, M. Russell, and S. Burastero. 1994. Asians have lower
body mass index (BMI) but higher percent body fat than do whites: comparisons of
anthropometric measurements. Am. J. Clin. Nutr. 60(1):23-28.
8. He, M., K. C. Tan, E. T. Li, and A. W. Kung. 2001. Body fat determination by dual
energy X-ray absorptiometry and its relation to body mass index and waist
circumference in Hong Kong Chinese. Int. J. Obes. Relat. Metab. Disord.
25(5):748-52.
9. Chang, C. J., C. H. Wu, C. S. Chang, W. J. Yao, Y. C. Yang, J. S. Wu, and F. H.
Lu. 2003. Low body mass index but high percent body fat in Taiwanese subjects:
implications of obesity cutoffs. Int. J. Obes. Relat. Metab. Disord. 27(2):253-259.
by guest, on July 13, 2018w
ww
.jlr.orgD
ownloaded from
19
10. Norgan, N. G. 1994. Population differences in body composition in relation to the
body mass index. Eur. J. Clin. Nutr. 48 Suppl 3: S10-25; discussion S26-27.
11. Deurenberg-Yap, M., G. Schmidt, W. A. van Staveren, and P. Deurenberg. 2000.
The paradox of low body mass index and high body fat percentage among Chinese,
Malays and Indians in Singapore. Int. J. Obes. Relat. Metab. Disord. 24(8):1011-
1017.
12. Dudeja, V., A. Misra, R. M. Pandey, G. Devina, G. Kumar and N. K. Vikram. 2001.
BMI does not accurately predict overweight in Asian Indians in northern India. Brit.
J. Nutr. 86 (1):105-112.
13. Deurenberg-Yap, M., S. K. Chew and P. Deurenberg. 2002. Elevated body fat
percentage and cardiovascular risks at low body mass index levels among
Singaporean Chinese, Malays and Indians. Obesity Rev. 3 (3): 209 -215.
14. Deurenberg, P., M. Deurenberg-Yap, L. F. Foo, G. Schmidt, and J. Wang. 2003.
Differences in body composition between Singapore Chinese, Beijing Chinese and
Dutch children. Eur. J. Clin. Nutr. 57(3):405-409.
15. Deurenberg-Yap, M., S. K. Chew, V. F. Lin, B. Y. Tan, W. A. van Staveren, and P.
Deurenberg. 2001. Relationships between indices of obesity and its co-morbidities
in multi-ethnic Singapore. Int. J. Obes. Relat. Metab. Disord. 25(10):1554-1562.
16. Tai, E. S., S. C. Ho, A. C. Fok, and C. E. Tan. 1999. Measurement of obesity by
anthropometry and bioelectric impedance analysis: correlation with fasting lipids
and insulin resistance in an Asian population. Ann. Acad. Med. Singapore.
28(3):445-450
17. WHO Expert Consultation. 2004. Appropriate body-mass index for Asian
populations and its implications for policy and intervention strategies. Lancet.
363(9403):157-163.
by guest, on July 13, 2018w
ww
.jlr.orgD
ownloaded from

20
18. World Health Organisation Expert Committee. 1995. Physical Status: the use and
interpretation of anthropometry. Technical Report Series No. 854. Geneva: WHO,
427-438.
19. Dalsky, G. P., W. Kraemer, A. E. Zetterlund, B. Conroy, A. Fry, J. O. Judge, and J.
Smith. 1990. A comparison of methods to assess body composition. Med. Sci. Sport
Exerc. 22:S112.
20. Jackson, A.S., and M. L. Pollock. 1978. Generalised equations for predicting body
density of men. Br. J. Nutr. 40: 497-504.
21. Kohrt, W. M. 1998. Preliminary evidence that DEXA provides an accurate
assessment of body composition. J. Appl. Physiol. 84(1):372-377.
22. Prior, B. M., K. J. Cureton, C. M. Modlesky, E. M. Evans, M. A. Sloniger, M.
Saunders, and R. D. Lewis. 1997. In vivo validation of whole body composition
estimates from dual-energy X-ray absorptiometry. J. Appl. Physiol. 83(2):623-630.
23. Morabia, A., A. Ross, F. Curtin, C. Pichard, and D. O. Slosman. 1999. Relation of
BMI to a dual-energy X-ray absorptiometry measure of fatness. Br. J Nutr.
82(1):49-55.
24. Chang, C. J., C. H. Wu, F. H. Lu, J. S. Wu, N. T. Chiu, and W. J. Yao. 1999.
Discriminating glucose tolerance status by regions of interest of dual-energy X-ray
absorptiometry. Clinical implications of body fat distribution. Diabetes Care. 22:
1938-1943.
25. Ettinger, W. H., P. W. Wahl, L. H. Kuller, T. L. Bush, R. P. Tracy, T. A. Manolio,
N. O. Borhani, N. D. Wong, and D. H. O’Leary. 1992. Lipoprotein lipids in old
people. Results from the Cardiovascular Health Study. The CHS Collaborative
Research Group. Circulation. 86: 858-869
26. World Health Organization. 1997. Obesity: Preventing and Managing the Global
Epidemic. Report on a WHO Consultation on Obesity. WHO: Geneva.
by guest, on July 13, 2018w
ww
.jlr.orgD
ownloaded from

21
27. World Health Organization. 1995. Physical Status: the Use and Interoperation of
Anthropometry. Report of a WHO Expert Committee. Technical Report Series 854.
WHO: Geneva.
28. Deurenberg, P, J. A. Weststrate, and J. C. Seidell. 1991. Body mass index as a
measure of body fatness: age- and sex-specific prediction formulas. Br. J. Nutr. 65:
105–114.
29. Deurenberg-Yap M, Schmidt G, van Staveren WA, Hautvast JG, Deurenberg P.
2001. Body fat measurement among Singaporean Chinese, Malays and Indians: a
comparative study using a four-compartment model and different two-compartment
models. Br J Nutr. 85(4):491-498.
30. Hughes, K., K. C. Lun, and P. P. Yeo. 1990. Cardiovascular diseases in Chinese,
Malays, and Indians in Singapore. I. Differences in mortality. J. Epidemiol.
Community Health. 44(1):24-28.
31. Chiu, H. C., H. Y. Chang, L. W. Mau, T. K. Lee, and H. W. Liu. 2000. Height,
weight, and body mass index of elderly persons in Taiwan. J. Gerontol. A. Biol. Sci.
Med. Sci. 55(11):M684-690.
32. Fernandez-Real, J. M., M. Vayreda, R. Casamitjana, M. Saez, and W. Ricart. 2001.
Body mass index (BMI) and percent fat mass. A BMI > 27.5 kg/m2 could be
indicative of obesity in the Spanish population. Med. Clin. (Barc). 1; 117(18):681-
684.
33. Deurenberg-Yap, M, and P. Deurenberg. 2003. Is a re-evaluation of WHO body
mass index cut-off values needed? The case of Asians in Singapore. Nutr. Rev. 61(5
Pt 2):S80-87.
34. He, M., K. C. Tan, E. T. Li, and A. W. Kung. 2001. Body fat determination by dual
energy X-ray absorptiometry and its relation to body mass index and waist
by guest, on July 13, 2018w
ww
.jlr.orgD
ownloaded from

22
circumference in Hong Kong Chinese. Int. J. Obes. Relat. Metab. Disord.
25(5):748-752.
by guest, on July 13, 2018w
ww
.jlr.orgD
ownloaded from

23
Table 1: Means levels of lipids, triglyceride, anthropometric parameters and DEXA- measured PBF in men and women aged between 30-70 y old
Parameters Men Women
n Mean+SE n Mean+SE
Age 298 49.4+0.50 771 48.4+0.29
TC (mmol/L) 298 5.92+0.060* 771 5.71+0.035
LDL (mmol/L) 298 3.87+0.055* 771 3.51+0.031
HDL (mmol/L) 298 1.38+0.017 771 1.71+0.013#
TC/HDL 298 4.44+0.061* 771 3.48+0.031
TG (mmol/L) 298 1.49+0.042* 771 1.11+0.020
BMI (kg/m2) 295 23.9+0.17* 765 22.3+0.11
W/H ratio 296 0.88+0.003* 767 0.79+0.002
WC (cm) 296 84.6+0.40* 767 73.3+0.26
HC (cm) 296 95.7+0.31* 767 93.3+0.24
W/Ht ratio 296 0.50+0.002* 767 0.47+0.002
PBF 279 17.5+0.27 735 28.4+0.19#
* = levels in men were significantly higher than corresponding levels in women (<0.001)
# = levels in women were significantly higher than corresponding levels in men (<0.001)
by guest, on July 13, 2018w
ww
.jlr.orgD
ownloaded from
24
Table 2: Lipids and triglyceride levels – Percent in men and women
TC <5.2 mmol/L 5.2-6.2 mmol/L >6.2 mmol/L Total
n % n % n % N %
Men 65 23.2 115 41.1 100 35.7 280 100
Women 226 30.7 312 42.5 197 26.8 735 100
LDL <3.4 mmol/L 3.4-4.1 mmol/L >4.1 mmol/L Total
Men 87 31.1 89 31.8 104 37.1 280 100
Women 351 47.8 224 30.5 160 21.7 735 100
HDL <1.0 mmol/L >1.0 mmol/L Total
Men 11 3.9 269 96.1 280 100
Women 8 1.1 727 98.9 735 100
TC/HD <4.5 >4.5 Total
Men 150 53.6 130 46.4 280 100
Women 641 87.1 95 12.9 735 100
TG <1.7 mmol/L 1.7-2.3 mmol/L >2.3 mmol/L Total
Men 186 66.4 52 18.6 42 15.0 280 100
Women 652 88.6 56 7.6 28 3.8 735 100
by guest, on July 13, 2018w
ww
.jlr.orgD
ownloaded from

25
Table 3: Percent of men and women in the different PBF groups
PBF <10% 11-19% 20-24% >25% Total
n % n % n % n % n %
Men 19 6.8 170 60.7 75 26.8 16 5.7 280 100
PBF <20% 21-29% 30-34% >35% Total
Women 51 6.9 370 50.3 218 29.7 96 13.1 735 100
by guest, on July 13, 2018w
ww
.jlr.orgD
ownloaded from

26
Table 4: Risk factors in different percent body fat groups in men and women
a= Gp4>Gp3>Gp2>Gp1 (p<0.05)
b = Gp4 & Gp3> Gp1 (p<0.05)
c = Gp3, Gp4>Gp2>Gp1 (p<0.05)
d = Gp1> Gp2, 3 & 4 (p<0.05)
e = Gp1> Gp3 & 4 (p<0.05)
f = Gp2> Gp4 (p<0.05)
g = Gp4>Gp3>Gp2,Gp1 (p<0.05)
h = Gp4>Gp3>Gp1 (p<0.05)
i= Gp4>Gp3,Gp2,Gp1 (p<0.05)
PBF TC LDL HDL TC/HDL TG INS Glu
Men
Gp1 (<10) 5.4+0.20 3.4+0.18 1.6+0.04 d 3.3+0.13 0.9+0.09 c 3.8+0.41 4.8+0.37
Gp2 (11-19) 5.9+0.08 3.9+0.08 1.4+0.02 f 4.4+0.08 1.5+0.06 6.1+0.36 4.8+0.55
Gp3 (20-24) 6.1+0.11 4.1+0.09 b 1.3+0.02 4.7+0.10 c 1.6+0.08 9.6+0.69 5.0+0.71
Gp4 (>25) 5.8+0.28 3.8+0.23 b 1.2+0.05 4.9+0.27 c 1.9+0.20 13.1+3.4 g 5.3+0.79i
Women
Gp1 (<20) 5.3+0.10 3.1+0.08 1.8+0.04 e 3.0+0.07 0.8+0.04 4.7+0.37 4.6+0.06
Gp2 (21-29) 5.6+0.05 3.4+0.04 1.7+0.02 3.4+0.04 1.0+0.03 5.3+0.18 4.7+0.03
Gp3 (30-34) 5.9+0.07 b 3.6+0.06 1.6+0.03 3.6+0.06 1.2+0.04 b 6.7+0.30 4.8+0.03
Gp4 (>35) 6.1+0.09 b 3.9+0.09 a 1.6+0.04 3.9+0.10 a 1.3+0.05 b 8.5+0.63g 5.0+0.08h
by guest, on July 13, 2018w
ww
.jlr.orgD
ownloaded from

27
Table 5: Sensitivity, 1-specificity, (false positive) based on ROC plots of various anthropometric parameters and obesity
MenBMI
>30kg/m2
BMI
>27kg/m2
W/H
>0.94
WC
>92.5cm
HC
>101.5cm
W/Ht
>0.55
Sensitivity 6.7% 46.7% 46.7% 46.7% 46.7% 46.7%
1-Specificity (False positive)
2.7% 10.6% 9.1% 10.6% 10.6% 10.6%
WomenBMI
>30kg/m2
BMI
>25kg/m2
W/H
>0.826
WC
>80.5cm
HC
>99.5cm
W/Ht
>0.513
Sensitivity 13.4% 60.8% 34.4% 47.9% 59.4% 51.0%
1-Specificity (false positive)
5.0% 10.5% 17.7% 9.7% 11.1% 9.9%
by guest, on July 13, 2018w
ww
.jlr.orgD
ownloaded from