Embed Size (px)
Citation preview

1PhD Student, Department of Civil, Mining and Environmental Engineering, Division of Structural Engineering, Luleå University of Technology SE-971 87 Luleå, Sweden, Email: [email protected] 2Professor Department of Civil, Mining and Environmental Engineering, Division of Structural Engineering, Luleå University of Technology SE-971 87 Luleå, Sweden, Email: björn.tä[email protected]. Department of Civil Engineering, 3Technical University of Denmark, Brovej Building 118, 2800 Kgs. Lyngby, Denmark, Email: [email protected] Associate Professor, ISISE, Dep. Civil Eng., School Eng., University of Minho, Campus de Azurém, 4800-058 Guimarães, Portugal, Email: [email protected] 4MSc Student, ISISE, Dep. Civil Eng., School Eng., University of Minho, Campus de Azurém, 4800-058 Guimarães, Portugal, Email: [email protected] 5Lecturer, Department of Civil, Mining and Environmental Engineering, Division of Structural Engineering, Luleå University of Technology, SE-971 87 Luleå, Sweden, Email: [email protected]
Are available models reliable for predicting the FRP contribution to the shear resistance
of RC beams?
Gabriel Sas1
, Björn Täljsten2
, Joaquim Barros3
, João Lima4
, and Anders Carolin5
Abstract: In this paper the trustworthiness of the existing theory for predicting the FRP contribution to the shear
resistance of reinforced concrete beams is discussed. The most well-known shear models for EBR (External
Bonded Reinforcement) are presented, commented on and compared with an extensive experimental database.
The database contains the results from more than 200 tests performed in different research institutions across the
world. The results of the comparison are not very promising and the use of the additional principle in the actual
shear design equations should be questioned. The large scatter between the predicted values of different models
and experimental results is of real concern bearing in mind that some of the models are used in present design
codes.
Subject headings: Bearing capacity; Concrete beams; Fiber reinforced polymers; Shear strength; State-of-the-
art reviews.
Introduction
Shear strengthening of reinforced concrete (RC) beams using fiber reinforced polymers (FRP) has been studied
intensively in the last decade, even if shear for simple reinforced concrete beams is not actually fully understood.
The design equations for reinforced concrete beams used in the main current design guidelines are based on semi
empirical approaches, e.g. ACI 318-05 (2005) and Eurocode 2 (2004). The shear capacity of the beams is
computed by adding the contribution of the concrete (Vc) and the steel stirrups (Vs). In most of the cases, using
the same procedure, the shear strength of the RC beams strengthened with composite materials is computed by
adding the contribution of the FRP (Vfrp). While the empirical design equations for reinforced concrete beams

2
were validated with extensive experimental results, the equations for predicting the shear resistance of FRP
strengthened RC beams are often compared with a small number of experiments, and, in some cases, using test
series of questionable rigor. Three main configurations of FRP strengthening may be used for externally bonded
reinforcement (EBR): side bonding, U-wrapping and complete wrapping (ACI Committee 440 2002; fib Task
Group 9.3 2001), see Figure 1. The near surface mounted reinforcement (NSMR) has been also used for shear
strengthening (Dias and Barros 2008) but the application is limited to side bonding technique.
The development of theoretical models began using the assumption that FRP materials behave like internal
stirrups. Later, studies were focused on developing new theories based on the real strain field distribution. Even
if a large effort has been focused on theoretical studies, the shear strength models are almost as many as the
research studies performed.
Chaallal et al. (1998) proposed the equation for calculating the shear contribution of FRP based on the
assumption that the composite and the stirrups behave similarly.
Malek and Saadatmanesh (1998a, b) introduced in their formulation the anisotropic behavior of the FRP. Studies
have revealed that the inclination angle of the critical shear crack is influenced by the plate thickness, FRP
percentage and orientation angle, percentage of existing steel hoops, concrete quality and percentage and
diameter of the tensile longitudinal steel bars.
A model, obtained by experimental fitting, was derived by Triantafillou (1998), and Triantafillou and
Antonopoulos (2000). The contribution of the FRP is limited by the effective strain in the composite. Further on,
Khalifa et al. (1998, 1999) modified Triantafillou’s (1998) model introducing strain limitations due to shear
crack opening and loss of aggregate interlock. The proposed model was appraised by considering more tests.
By combining the strip method and shear friction approach Deniaud and Cheng (2001, 2003) stated that the FRP
strains are uniformly distributed among the fibers crossing the critical shear crack. A design model was
developed based on the failure mechanism observed on the tested specimens. The evaluation showed a good
agreement between model predictions and test results. A refined model was proposed later by Deniaud and
Cheng (2004).

3
Continuing the Khalifa model, Pellegrino and Modena (2002) suggested a modified reduction factor for the ratio
of the effective strain to ultimate strain in FRP. According to the experimental studies performed, the stiffness
ratio between transversal shear reinforcement and FRP shear reinforcement has a significant effect on the
effectiveness of shear strengthening. Available information is restricted to side-bonded beams strengthening
configurations. Aspects regarding lateral concrete peeling failure under shear loading of FRP were studied later
by Pelegrino and Modena (2006). The model of these authors follows the truss model approach and describes the
concrete, steel and FRP contribution to the shear capacity of RC beams based on the experimental observations.
Carolin (2003) and Carolin and Täljsten (2005) proposed an equation to predict the contribution of EBR
composites for the shear strengthening, limiting the tensile failure of the fiber. The non-uniform distribution of
the strains in FRP over the cross section was stated. A 55% to 65% of the maximum measured strain value was
recommended for engineering design. The equations are used today in the Swedish Design Guideline for FRP
strengthening (Täljsten, 2006).
Chen and Teng (2003a, b, 2004) analyzed the shear failure of the reinforced concrete beams strengthened with
FRP and concluded that the stress distribution in the FRP along the crack plane is non-uniform. They proposed a
model for reinforced concrete beams strengthened with FRP that takes into account the fiber rupture and
debonding failure modes. The model also assumes a non-uniform stress distribution in the FRP along the shear
crack. Stress limitation is introduced by bond length coefficient and strip width coefficient.
Using an adapted compression field theory, Ianniruberto and Imbimbo (2004) developed a theoretical model to
predict the contribution of FRP sheets for the shear capacity of RC beams. Although the authors have made a
coherent derivation, the model has some limitations, since it can be used only for wrapping strengthening
schemes; hence it is not prepared to predict debonding failure mechanism for side bonding and U configurations.
Furthermore, the model does not simulate the strain concentration at the composite-crack intersection, so the
potential rupture in the composite at cracking regions cannot be captured. Theoretical predictions were compared
with experimental results and, unfortunately found to be incompatible.
Adhikary et al. (2004) proposed two equations to determine the shear strength of CFRP and ARFP strengthened
RC beams, calibrating the model proposed by Triantafillou (1998). These authors suggested that the two
4
proposed equations should be checked with other test results available in the literature, since the effective strain
in FRP was not yet clearly defined, and depends on many factors.
Introducing some adjustments to the model of Chen and Teng (2003b), Cao et al. (2005) proposed an empirical
model to predict the FRP contribution to the shear strengthening of RC beams strengthened with complete
wrapping of FRP strips failing by FRP debonding. The strain distribution modification factor gave uncertain
results due to the large scatter of the test data. The comparison of the theoretical prediction with the experimental
results has shown “a general agreement between the two” with “a significant scatter”.
The shear bond model proposed by Zhang and Hsu (2005) followed two approaches: model calibration by curve
fitting and bond mechanism. The smallest reduction factor for the effective strain obtained from the two methods
was suggested to be used.
The model for the shear debonding strength developed by Ye et al. (2005) has its theoretical starting point in
Chen and Teng’s model, and it is being used in the Chinese Design Code.
Monti and Liotta (2006) proposed a debonding model for the FRP-based shear strengthening of RC beams. The
features of the model are divided in three steps: a) generalized constitutive law of FRP layer bonded to concrete,
b) boundary limits – function of the strengthening scheme and shear crack opening provisions, c) stress field in
the FRP crossing a shear crack, analytically determined. A generalized failure criterion of FRP strips/sheets is
introduced. Two cases are considered: straight strip/sheet and strip/sheet wrapped around a corner. This model is
currently used in the Italian design code CRN (2005).
Database description
A full database containing 211 experiments (Table 1), collected by Lima and Barros (2007), was used to
compare the theoretical predictions of the FRP contribution to shear. Nevertheless more experiments have been
performed in the period covered by this research program, they were not included in this database since critical
parameters are missing in their description. The database contains values from experiments performed on 34
beams with T cross sections and 177 beams with rectangular cross sections. The most used strengthening
configuration was the U-wrapped with 101 elements, from which 6 include mechanical anchorages. From the

5
remaining 110 beams, 72 were side-bonded without any mechanical anchorages. The other 38 identified beams
were fully wrapped. The beams containing different anchorage systems are considered in the present study only
for the models that are addressing specifically a theoretical approach for strengthening system with anchorages.
Most of the available theoretical models do not simulate the effect of the anchorage systems and, consequently,
failure predictions are unrealistic. In this case the beams considering anchorage systems are removed from the
comparison. The specimens having dimensions smaller than 100×200mm were also removed from the
comparison, since due to the scale effect, the obtained results might be not representative of the real behavior of
FRP-based shear strengthened beams. The effective anchorage length of the FRP has been determined to be
approximately 200-250mm (Täljsten 1994, Brosens and van Gemert, 1997), hence sufficient anchorage length
cannot be assured in shallow beams, resulting in an inefficient strengthening. Furthermore, beams with
inappropriate material characteristics reported, i.e. of too low strength concrete, were also removed. The
minimum value of the concrete compressive strength considered was 12 MPa.
Bases of comparison
After removing the beams from the database that did not correspond to the above criteria, the theoretical
predictions of the models will be plotted for each model. The capacity of the RC beams has not been considered
in the comparison because the models presented in the studied literature refer only to the composite contribution
to the total capacity. The experimental values of the FRP contribution have been obtained by subtracting the
values obtained from the tests on reference beams from the values obtained from the FRP strengthened beams.
For calculating the predictions of each individual model the materials properties obtained from tests and reported
in the original papers have been considered. However, for two models (Monti and Liotta, 2007 and Ye et al.,
2005) the characteristic compressive strength and the design tensile strength of concrete are required. These
values have been determined based on the EC2 (2004) recommendations. No partial safety factors have been
adopted in the calculations of the predictions.
Shear models predictions

6
Even if the strengthening method has been used for more than a decade, the main part of the theoretical research
has been focused on the flexural behavior of strengthened elements. Research on shear behavior has not been
studied to the same extent. The shear models presented below are the models most commonly used in practical
design. An exception from this rule was made for models introduced in national design guidelines, since they
have a greater use in practical design.
For the theoretical predictions the models, in general, assume that shear failure crack has a 45° inclination angle,
but experimental works have shown that this inclination can vary between 30 to 60 degrees, depending on the
parameters already mentioned (Carolin, 2003).
The researchers define the contribution of the FRP to the shear strength as the product between the effective
stress in FRP, the area of the FRP, partial reduction factors that intend to take into account the quality of material
and/or workmanship quality, and a geometrical factor depending on the type of strengthening system used, as
well as fiber inclination with respect to the beams longitudinal axis. In general, the scientists are in agreement
about the type and relevance that these parameters have in the prediction performance of a model, but the way
that these parameters are defined is not the same, and relatively important differences can be found. The main
differences appear on the evaluation of the stresses/strains in fibers. Based on the method of analysis, two
different types of constitutive models have been proposed: empirical and semi empirical.
In a previous work, Lima and Barros (2007), based on the results of the same database, had already verified that
none of the fib (2001), ACI (2002), CNR (2005) and CIDAR (2006) analytical formulations predicts with
enough accuracy the contribution of the EBR CFRP systems for the shear strengthening of RC beams. In the
present work this type of appraisal is extended to a larger set of models, published in reputed journals and
conference proceedings.
The models presented in this section are used to calculate the contribution of the FRP only for the strengthening
configurations for which they were devised. A plot representing the shear contribution of the fibers for
rectangular beams and T beams is presented for each model for a better visualization and a realistic evaluation of
the results by the reader. For the sake of simplicity all the equations are presented using the same notation. A
detailed notation list is appended at the end of the paper.

7
Chaallal (1998)
The proposed equation for calculating the shear contribution of FRP assumes that composites stirrups have
similar functioning principle, Eq. (1). The model assumes that the FRP tensile strength is reached when the
composite is intersected by the shear crack, as long as sufficient bond length is guaranteed. When the model was
derived the non-uniform distribution of the stresses over the cross section of the beam was not stated by any
researcher, making this assumption unrealistic.
sin cos2
2
frp frpfrp avg
frp
b h dV
s
(1)
The debonding problem is treated in a simplified form using the average shear stress (Eq. (2) between the FRP
and concrete, even if the authors were aware of the non uniform distribution of the stresses.
debondingmax
1
2 avg
(2)
where debondingmax is the maximum shear stress given by:
debondingmax
1
5 4
1 tan33
.
k and
1 4
1 4
/
nfrp
frp frp
kk t
E Iwith kn= Eaba/ta (3)
The use of the average shear stress may be interpreted as: if sufficient bond length is assured then the tensile
strength of FRP can be fully mobilized. Actually, the stress level will not increase by increasing the bond length
if the effective bond length was already provided. The accuracy of this model cannot be checked since the values
of the thickness and strength of the adhesive in parameter k1 are not reported in most of the experimental studies
presented in the database (Table 1).
Triantafillou (1998) and Triantafillou and Antonopoulos (2000)
According to Triantafillou (1998), and Triantafillou and Antonopoulos (2000), an accurate estimation of the FRP
contribution to the shear capacity is quite difficult to obtain, due to the influence that too many factors has on the
failure mode. The formulation is based on the Eqs. (4, (5 and (6):
,
0.91 cot sin
frp frp frp frp e wfrp
V E b d (4)

8
2, 0.0119 0.0205 0.0104( ) frp e frp frp frp frpE E 0≤frpEfrp≤1 (5)
, 0.00065 0.00245 frp e frp frpE frpEfrp>1 (6)
The model was derived using the truss analogy based on a semi – quantitative approach. The key parameter of
the analytical expression, frp,e, was obtained from regression of experimental data of beam tests, which may
suggest a narrow coverage solution for the shear problem. This effective strain has been found dependent both
on the axial rigidity of the composite and effective bond length, and is used as the minimum of: maximum strain
to control crack opening, strain limiting due to debonding, and strain corresponding to shear failure combined or
followed by FRP rupture.
At that moment no clear distinction was made between the different types of strengthening on the application of
the formula. The research was then extended, using a larger data base of available test reports (Triantafillou and
Antonopoulos 2000). The model evolved still based on the regression analysis, but with a specifically defined
effective strain for detailed failure types, different strengthening schemes and materials, Eqs. (7, (8 and (9).
Wrapped with CFRP
0.302/3
, ,0.17
cfrp e frp u
frp frp
f
E (7)
U – shaped CFRP jackets
0.56 0.302/3 2/3
3, ,min 0.65 10 ;0.17
c cfrp e frp u
frp frp frp frp
f f
E E (8)
Wrapped with AFRP
0.4723
, ,0.048
cfrp e frp u
frp frp
f
E
(9)
However, this model cannot simulate the FRP effective strain of the side bonding shear strengthening
configuration, which is a limitation of its use. Due to the limited data available at the moment of the model’s
derivation, its prediction accuracy is unsatisfactory, but the similar distribution around the bisector can point out
regression as being an acceptable method for deriving a viable model (Fig. 2).

9
Khalifa et al. (1998) and Khalifa and Nanni (2000)
Based on the Triantafillou model (1998), Khalifa et al. (1998) recommended a modified effective strain both for
fiber rupture and debonding failure. A similar equation of the FRP contribution to the shear strength to the one of
Triantafillou (1998) was derived (Eq. (10).
, sin cos frp frp e frp
frpfrp
A f dV
swhere , ,frp e frp uf Rf (10)
The effective stress in fibers was established as a function of FRP stiffness, and ultimate strain is obtained by
regression of experimental data Eq. (11). The equation is valid only for CFRP continuous sheets or strips and is
suitable if the failure mechanism is controlled by FRP sheet rupture. The effective ratio is limited at R≤0.5.
20.5622( ) 1.2188 0.778 frp frp frp frpR E E (11)
Since Eq. (11) is not valid for debonding mechanism, the effective stress/strain R factor was derived considering
a bond mechanism model (Eq. (12).
2/3
, 6
,
738.93 4.06( ) 10 c frp e
frp frpfrp u frp
f wR E t x
d (12)
The real width of the FRP, w, was replaced by an effective width wfrp,e (Eqs. (13 and 14) to account for the
several effects, such as: shear crack angle (assumed to be 45°); effective bond and configuration of the
strengthening, i.e. wrapped, U-jacketing or side bonded. The effective length proposed by Maeda (1997) was
adopted in this case (Eq. 15). Due to its empirical deduction and the lack of test data at that moment, the
effective bond length is limited to the value of 75 mm proposed by Miller (1999), and Khalifa and Nanni (2000).
, frp e ew d L for U-jacketing (13)
, 2 frp e ew d L for side bonding (14)
6.134 0.58ln( ) frp frpt E
eL e (15)
Finally, a reduction factor of 0.7 for the FRP contribution to the shear capacity is prescribed. This model can be
considered as the first complete formulation of the CFRP shear design strengthening, since it considers all three

10
main types of strengthening configurations. Like in Triantafillou (1998), and Triantafillou and Antonopoulos
(2000) models, this one presents the same weaknesses due to its empirical nature (Fig. 3).
Chen and Teng model (2001 and 2003a, b)
An extensive work performed by Chen and Teng (2001 and 2003a, b) resulted in one of the most widely-used
shear models. The general equation (16) is based on the truss model theory, with the remark that discrete FRP
strips were modeled as equivalent continuous FRP sheets/plates and a reduction factor for the stress is used
instead of strain, as in the previous models. Since the authors of the model considered continuous sheets as a
special case of strips, the equations of Chen and Teng’s models are established in terms of strips.
,
cot cot sin2
frp
frp frp e frp frpfrp
dV f t w
s, where , ,max frp e frp frpf D (16)
The average stress of the FRP intersected by the shear crack, ffrp,e , is determined based on the assumption that
stress distribution in the FRP along the shear crack is not uniform at the ultimate limit state for both rupture and
debonding failure modes. The key factors of the model are considered to be the stress distribution factor, Dfrp,
and the maximum stress that can be reached in the FRP intersected by the shear crack, frp,max. The stress
distribution factor is determined for both failure modes by integrating the stresses or strains over the cross
section (Eq. (17).
,
,max max
b b
t t
z z
frp z z
z z
frpfrp frp frp
dz dz
D ord d
(17)
FRP Rupture
Different shapes of non linear distribution of the strains over the crack are considered in the model similar to the
approach found in Carolin (2003). For a general strengthening scheme, the stress distribution has been expressed
as a dimensionless factor (Eq. (18) depending on geometrical boundary conditions (Eqs. (19 and (20).
1
2
frpD , where t
b
z
z (18)

11
, ,(0.1 ) 0.1 t frp t frp tz d d d d is the coordinate of the top end of the effective FRP (19)
( ) 0.1 b frpz d h d d is the coordinate of the bottom end of the effective FRP (20)
When fiber rupture occurs, the maximum stress in the FRP is considered to be the ultimate tensile strength. The
Authors advised that, due to the loss of aggregate interlocking, the ultimate tensile failure of the fiber may be
reached before the shear failure of the beam has being attained.
FRP Debonding
The debonding model developed by Chen and Teng (2003b) considers “an effective bond length beyond which
an extension of the bond length cannot increase the bond strength” of utmost importance. The maximum stress in
the FRP at debonding is considered to be:
,
,max min0.427
frp u
frp frp cw L
frp
f
E f
t
(21)
By analyzing the model one can notice the unit inconsistency of the maximum stress expressed in this
mathematical form. The reason might be considered the fracture mechanic approach and regression analysis on
the ultimate bond strength and the FRP width ratio (Chen and Teng, 2001). The two coefficients L, w (Eqs.
(22a and (22b) reflect the effective bond length and the effect of FRP to concrete width ratio, respectively,
(a)
1 1
sin 12
L
if
if; (b)
2 / ( sin )
1 / ( sin )
frp frp
wfrp frp
w s
w s (22a, b)
The normalized maximum bond length parameter, , the maximum bond length, Lmax, and the effective bond
length, Le, are given as:
max e
L
L; Lmax=hfrp,e/sin β for U jacketing, Lmax=hfrp,e/(2 sin β) for side bonding and frp frp
e
c
E tL
f (23)
In this model it was assumed that all the FRP crossing the shear crack can develop full bond strength. Under
this assumption, the stress distribution factor for debonding failure was derived (Eq. (24a). It must be noted as

12
equally important that the bond strength of a strip depends on the distance from the shear crack relative to the
ends of the strip. For design purposes a simplified formula was suggested (Eq. (24b) in which 95% characteristic
bond strength given by the analytical model is used. The plot of the theoretical predictions versus the
experimental values from the database is presented in Fig. 4. The prediction of the FRP shear contribution shows
a large scatter, in several cases drastically underestimating or overestimating the capacity for rectangular beams.
The T beams show a fairly safe prediction, but a conclusion cannot be drawn due to lack of sufficient
experimental data.
(a)
1 cos2 2 1sin
22
1 1
frp
ifD
if
; (b) ,max
0.8 /
min 0.3
frp frp
frp frpw L c
b frp
f
Ef
t
(24a, b)
Deniaud and Cheng model (2001 and 2004)
The model proposed by Deniaud and Cheng (2001, and 2004) has its origins in the modified friction method as a
combination of Loov’s (1998) shear friction method for RC beams and a strip method for computing the
contribution of FRP strips. It must be noted the different approach used for concrete and steel contributions in
Eq. (25). A different crack pattern is used for flange and web of the T beam, which might lead to a more accurate
prediction of the total shear capacity. The FRP contribution, determined according to Eq. (26), is directly
included in the expression that evaluates the total shear capacity of a beam (Eq. (25). Therefore, the comparison
is carried out in terms of total shear capacity. The last term of represents the contribution of FRP sheets in the
case of U-jacketing configuration. When discrete strips are used the FRP contribution can be computed from
(Deniaud and Cheng 2001).
sc c v frp v
dV k f A T T T
s (251)
2
,
ssin cos sin
frpfrp frp frp frp frp e L
frp s
wT d t E R
s d (26)
13
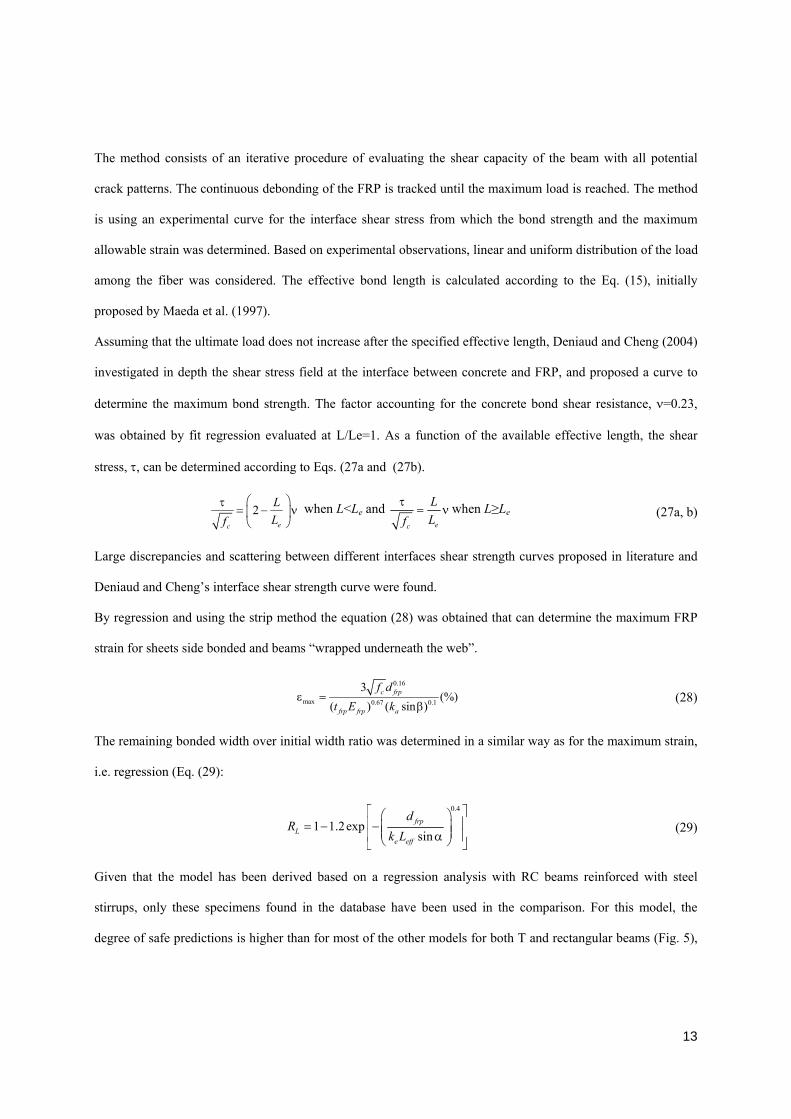
The method consists of an iterative procedure of evaluating the shear capacity of the beam with all potential
crack patterns. The continuous debonding of the FRP is tracked until the maximum load is reached. The method
is using an experimental curve for the interface shear stress from which the bond strength and the maximum
allowable strain was determined. Based on experimental observations, linear and uniform distribution of the load
among the fiber was considered. The effective bond length is calculated according to the Eq. (15), initially
proposed by Maeda et al. (1997).
Assuming that the ultimate load does not increase after the specified effective length, Deniaud and Cheng (2004)
investigated in depth the shear stress field at the interface between concrete and FRP, and proposed a curve to
determine the maximum bond strength. The factor accounting for the concrete bond shear resistance, =0.23,
was obtained by fit regression evaluated at L/Le=1. As a function of the available effective length, the shear
stress, , can be determined according to Eqs. (27a and (27b).
2
ec
L
Lf when L<Le and
ec
L
Lfwhen L≥Le (27a, b)
Large discrepancies and scattering between different interfaces shear strength curves proposed in literature and
Deniaud and Cheng’s interface shear strength curve were found.
By regression and using the strip method the equation (28) was obtained that can determine the maximum FRP
strain for sheets side bonded and beams “wrapped underneath the web”.
The remaining bonded width over initial width ratio was determined in a similar way as for the maximum strain,
i.e. regression (Eq. (29):
Given that the model has been derived based on a regression analysis with RC beams reinforced with steel
stirrups, only these specimens found in the database have been used in the comparison. For this model, the
degree of safe predictions is higher than for most of the other models for both T and rectangular beams (Fig. 5),
0.16
max 0.67 0.1
3(%)
( ) ( sin )
c frp
frp frp a
f d
t E k (28)
0.4
1 1.2expsin
frpL
e eff
dR
k L (29)

14
but with a high degree of scattering. One of the reasons may be the incompatibility of the effective length
adopted from Maeda (1997) with the modified friction method.
Adhikary et al. model (2004)
After a series of tests with RC beams strengthened with U – wrapped and U – wrapped with different anchorage
lengths on top of the beam, Adhikary et al. proposed two equations to predict the contribution of CFRP and
AFRP systems for the shear resistance of RC beams. The effective strain when debonding occurs is evaluated by
Eqs. (30a and (30b) that were defined by calibrating Triantafillou and Antonopoulos model (2000) with data
available in the literature.
The second equation of the model takes into account “the bonded anchorage provided to the top of the surface of
the beam”. It can be assumed that this quote refers to a provided mechanical anchorage, since no other
specifications are given in the paper. The effective strain in the FRP is assumed to increase due to this
anchorage, so, in this case the effective strain at failure is the sum of the effective strain in the FRP in the
debonding mode fe1 and the increase in effective strain in FRP due to bond anchorage frp,e2.
Eqs. (31a and (31b) can be interpreted as: the effective strain at debonding when mechanical anchorages are used
is the sum of the effective strain at debonding from Eqs. (30a and (30b), and an empirically determined value of
the concrete strength.
Adhikary et al. (2004) considered their proposed equations as valid only for the case when the axial rigidity is in
the interval 0<frpEfrp≤1.0, since for larger values of the axial rigidity the scatter of the collected data used for the
calibration gave unsafe predictions.
To compute the shear contribution provided by FRP bonded sheets, Adhikary proposed the Eq. (32).
(a)
1
3, 1
,
0.038
frp e c
frp u frp frp
f
E for CFRP; (b)
1
3, 1
,
0.034
frp e c
frp u frp frp
f
E for AFRP (30a, b)
(a)
123
, 3
,
0.0380.0043
frp e c
cfrp u frp frp
ff
E for CFRP; (b)
123
, 3
,
0.0340.0046
frp e c
cfrp u frp frp
ff
E for AFRP (31a, b)

15
(sin cos ) frp frp frp frp frp wV E d b (32)
Since Adhikary et al. (2004) derived the model based on experiments performed on rectangular cross section
beams, the results on T cross section strengthened beams have not been included in the comparison. Apart the
beams with U wrapping and U wrapping with anchorage strengthening configurations, the remaining beams
were not considered in this study. The comparison for the model proposed by Adhikary et al. (2004) is presented
in Fig. 6. It is hard to formulate a clear conclusion because the model refers to a limited amount of comparable
values.
Ye et al. model (2005)
The model for the shear debonding strength developed by Ye et al. (2005) has its theoretical starting point in
Chen and Teng’s model (2003 a, b), and it has been proposed in the Chinese Design Code. The FRP contribution
to the shear capacity is obtained from Eq. (16), replacing ffrp,e by frp,eEf. Here the simplified proposal of Lu
(2004, by Ye et. al) for the average FRP strain frp,e when debonding is a dominant failure mode (Eq. (33) has
been adopted.
frp,e=kvfrp,inf with /0.79
/0.62
0.77(1 )
0.96(1 )
v
ek
e
for side plates (33)
for U jacketing
A new formulation of the bond length ratio (Eq. (34) is expressed in this model, as the ratio of the FRP
effective bond height, hfrp,e, to the FRP effective bond length Le:
,
2 sin
frp e
e
h
L and 1.33 frp frp
et
E tL
f (34)
A new term is introduce in this model, the FRP strain for an infinite bond length, f,inf, which is determined from
Eq. (35). Compared to Chen and Teng’s equation (Eq. (21) this term does not account for the bond length
coefficient, but it is obtained in the same way, by regression analysis.
,inf
0.616 t
f wfrp frp
f
E twith
2.25 /
1.25 /
frp frp
wfrp frp
w s
w s (35)

16
In the equation that evaluates the contribution of the FRP for the shear resistance of RC beams (Eq. (36), an
inclination angle of 45° was assumed for the critical crack, and the average bond strength between the FRP and
concrete is directly taken into account.
2, (sin cos )
frp efrp v f frp
frp
hV K w
swhere
,
sin
sin 0.3
frp frp
f frp
frp frp frp e t
E tK
E t h f and 1.2 w tdf (36)
Ye et al. (2005) compared the model with the experimental results. Predictions were considered to be in good
agreement with test data and conservative. When compared with the larger database the predictions (Fig. 7)
follow a safe trend, but still with a wide scatter.
Cao et al. model (2005)
Cao et al. (2005) proposed a simple model to predict the contribution of FRP to the shear capacity of beams
where “complete debonding of the critical strips occurs”. This model is also based on the previous work
performed by Chen and Teng (2003a, b), and is intended to improve the strain distribution factor Dfrp for discrete
strips. The general definition proposed by Chen and Teng (2003 b) in Eq. (17) was adopted and expressed as the
average strain in all FRP strips divided by the maximum strain (Eq. (37).
,
1 0
,max ,max
ln
frpfrp ii
frpfrp frp
x dx
Dn l
(37)
The model requires strain measurements (for the maximum strain and to determine the average strain, “which are
mostly dependent on the test errors”) in the strips intersected by the shear crack. The average and maximum
strains along the critical shear crack were also determined by regression analysis, taking the discrete strain
observations.
Eq. (24a), proposed by Chen and Teng (2003b), was refined considering the effect of the shear span-to-effective
depth ratio on the strain distribution factor Dfrp,. Cao et al. (2005) admitted that the modified Eq. (38) does not
really improve the theoretical predictions compared with the test data.
21 1.2 0.1
frp
frp
D for 1.4<<3 (38)

17
In order to estimate the contribution of FRP to the shear resistance at debonding, the interaction between the
shear span-to-effective depth ratio and the critical shear crack angle was analyzed, resulting in the following
equation:
2
1 1.4
2 11 1.4 3
1 0.2( 1.4)
2.05 3
ffrp
for
D for
for
(39)
Furthermore, the maximum strain in the FRP at debonding was analyzed, and an equation similar to the one
proposed by Ye et al. (2004) was determined (Eq. (40).
4
,max 0.427 0.427 c e cfrp w w
frp frp frp frp
f L f
E t E t (40)
From the comparison of the theoretical predictions of the Cao et al. (2005) model with the experimental results
of the collected data base, depicted in Fig. 8, a significant scatter and unsafe predictions were obtained.
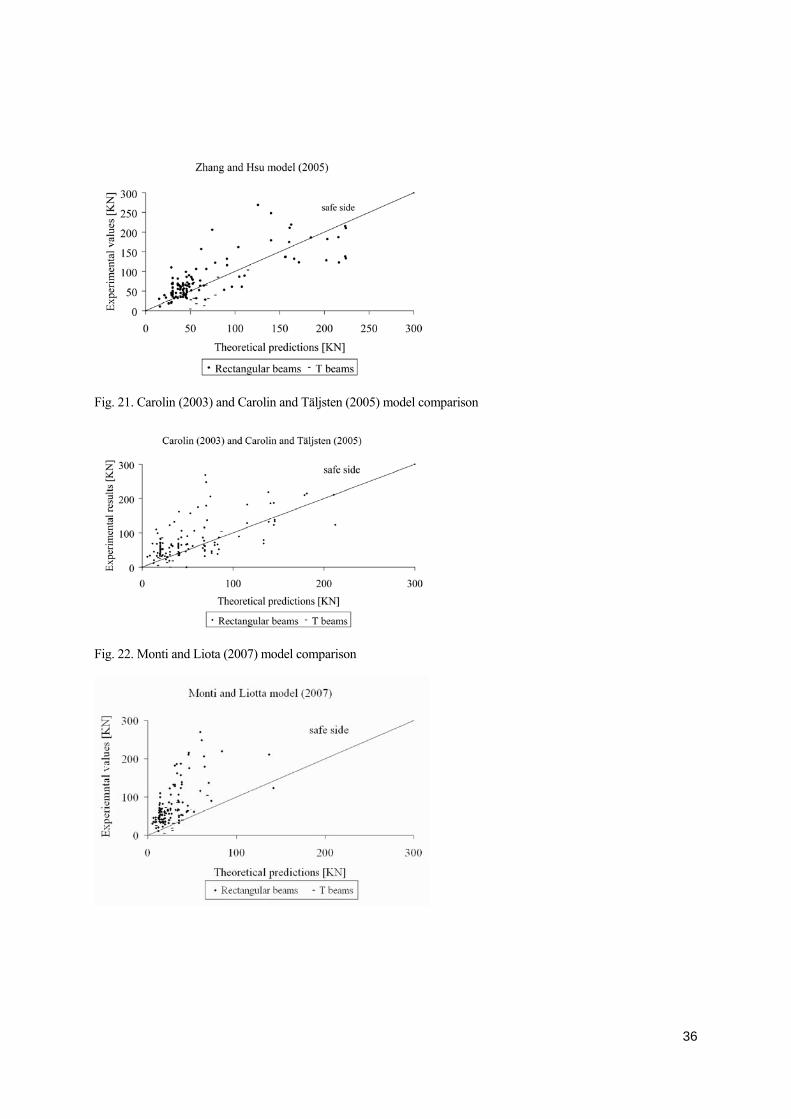
Zhang and Hsu model (2005)
The shear bond model proposed by Zhang and Hsu (2005) was derived in two steps: model calibration by curve
fitting and bond mechanism. The smallest reduction factor, obtained using the two methods, was suggested to be
used for the evaluation of the effective strain.
Curve fitting model
To determine the reduction factor for the evaluation of the effective strain when debonding failure occurs, the
initial model proposed by Khalifa et al. (1998) was used (see Eq. (12).
Having collected more data from test results, the authors used a power regression line to determine the reduction
factor, R. The power regression gave higher R-square values than the polynomial, which led to the conclusion
that the power regression line gives a more realistic prediction of the FRP contribution (Eq. (41a)
(a) 0.81930.1466
frp frpR E ; (b) 0.7488
1.8589 /
frp frp cR E f (41a, b)

18
Separate analysis was performed for the debonding and fiber rupture failure modes. A large scatter between the
two failure modes was observed. Fiber rupture occurred at 0 < frpEfrp < 0.55 GPa, while debonding occurred at
0<frpEfrp<1.2 GPa. Zhang and Hsu (2005) concluded that debonding dominates over the tensile rupture of the
CFRP laminates as they become thicker and stiffer, thus the effective strain needs to be consequently reduced.
According to Zhang and Hsu (2005) the effective strain in fibers is influenced by the concrete strength, i.e. when
concrete strength increases the effective strain increases too. Based on the influence of the concrete strength
another model was derived, also adopting a power regression line to evaluate the reduction factor (Eq. (41b). The
new reduction factor was obtained by dividing the axial rigidity to the concrete compressive strength. The new
model was considered to have better results in terms of R-square, when compared to the results obtained using
the other reduction factors.
Bond mechanism model
Proposed for design purposes, the model uses a triangular shape distribution of the shear stresses. Using a simple
equilibrium equation for the pure shear stress transfer (not including normal stresses) the total force that can be
transferred on two sides is computed according to Eq. (42a). The force when the beam fails in shear failure is
given in Eq. (42b). Applying the equilibrium condition for the two equations the strain (stress) reduction factor is
determined (Eq. (42c).
(a) max ,
12
2 e frp eT L w ; (b) , ,2 frp frp e frp eT t w f ; (c) , max
, ,
12
frp e e
frp u frp frp u
f LR
f t f (42, b, c)
The effective bond length, Le, of the FRP sheets was proposed to be 75 mm.
The maximum shear stress was computed as a best-fit polynomial function of the concrete compressive strength
(Eq. (43).
4 2 2max 7.64 10 2.73 10 6.38 c cf f (43)
Aware of the empirical nature of the model, Zhang and Hsu (2005) suggested adjustments to the model when
more experimental data are available. The comparisons plot (Fig. 9) shows a large scatter of the predicted values,
but slightly safer than the previous models.

19
Carolin (2003) and Carolin and Täljsten (2005)
The design model is based on the superposition principle of the shear contributions of the strengthening and the
strut and tie model. A calibration factor to consider the non uniform strain distribution over the cross section,
derived by Popov (1998) was proposed. This factor, , expresses the average strain in the fibers over the height
of the beam in relation to the strain in the most stressed fiber (Eq. (44).
/ 2
/2
,max
h
frp
h
frp
y dy
h
(44)
The factor includes the relative stiffness between concrete in compression, cracked reinforced concrete in tension
and lightly reinforced concrete in tension. The proposed design model by Carolin and Täljsten (2005) is given in
Eq. (45).
sin
sin
FRP cr frp frp frpV E t r z (45)
The critical strain, cr (Eq. (46a), is limited by a minimum value of the ultimate allowable fiber capacity, frp,ult,
the maximum allowable strain without achieving anchorage failure bond (Eq. (46b), and maximum allowable
strain to achieve concrete contribution, c,max, e.g. concrete contribution due to aggregate interlocking.
(a)
,
2
2,max
min sin
sin
frp u
cr bond
c
, (b) sin
12
1
2
2
cr
cr
cr
bond frp frpfrp frp
L
E t GfE t
for L
for L
(46a, b)
In Eq. (46b) Gf is the concrete fracture energy and is defined as in Täljsten (1994):
2max
2
frp frp fE t G (47)
The reduction of sin2(+) to the anchorage and concrete contribution comes from the anisotropic behavior of
the composite. If the concrete contribution is not included in the shear bearing capacity the limiting parameter
c,max can be ignored. The critical strain times the reduction factor gives the effective strain, frp,e, described

20
earlier. The rfrp factor in Eq. (45) depends on the layout of the strengthening system and is given in Eqs. (48a and
(48b):
(a) rrfp=sin for continuous wrapping; (b) frpfrp
frp
wr
s for discrete strips (48a, b)
When the theoretical predictions are compared to the experimental results (Fig. 10) a safer estimation of the FRP
contribution to shear capacity is found but still with a large scatter. The cause of this might be the definition of
fracture energy of concrete, which is still a challenge for the research, since it is not clear which fracture mode is
dominant, i.e. fracture mode I, fracture mode II, fracture mode III or a combination of both.
Monti and Liotta (2007)
A complete design method was developed by Monti and Liotta (2008) considering all the strengthening schemes
and failure modes known at that time. The model was derived by considering the three following main aspects:
a) a generalized FRP-concrete bond constitutive law is defined; b) boundary limitations are considered; and c)
the stress field in the FRP crossing a shear crack is analytically determined. Also the following assumptions are
considered: the cracks are evenly spaced along the beam axis with an inclination of , the crack depth is equal to
the internal lever arm z = 0.9d for the ultimate limit state, the resisting shear mechanism is based on the truss
analogy for wrapping and U-jacketing. For side bonding, the development of a “crack-bridging” resistance
mechanism was considered, due to the missing tensile diagonal tie in the truss analogy. The last two assumptions
yield that, for wrapping and U-jacketing the truss resisting mechanism can be activated, while for side bonding
the role of the FRP is that of “bridging the crack”. The effective bond length (Eq. (49) and the debonding
strength are defined for side bonding (Eq. (50).
2 frp frp
ectm
E tL
f (49)
,
20.80
frp Fkfrp dd
frp frp
Ef
twhere 0.03 Fk b c ctmk f f and
2 /1
1 / 400
frp
b
frp
frp
w pk
w (50)

21
When sufficient bond length (lb) can not be provided due to the strengthening scheme and the apparent shear
crack alignment, the bond strength is reduced according to Eq. (51).
, ,( ) 2
b bfrp dd b frp dd
e e
l lf l f
L L (51)
According to the authors knowledge, Monti and Liota (2007) were the first researchers to introduce a reduction
coefficient considering the radius of the corner of the beam when U-jacketing and wrapping is used (Eq. (52).
0.2 1.6 cR
w
r
b for 0 0.5 c
w
r
b (52)
The ultimate strength of the FRP for all types of strengthening is defined using the following function:
, , , ,, , frp ult b e c frp dd b R frp ult frp dd b ef l r f l f f l (53)
If the term in ‹·› of this function becomes negative it should be considered null. Also, a generalized stress-slip
constitutive function, frp(u,lb,e), was proposed. The stress-slip law is denoted as a function of the applied slip,
u, at the loaded end of the available bond length, lb, and the end restraint, e. To define the crack width a
coordinate system was proposed with the origin placed at the tip of the shear crack and with the abscissa axis
along the shear crack. In this way, the crack width, w, can be considered perpendicular to the crack axis. The
crack opening is considered to be governed by a linear relationship depending on the crack opening angle and
distance of the strip/sheet to the crack tip:
w x x (54)
Symmetry, with respect to the coordinate system defined above, is considered at both sides of the crack to
impose a slip to the FRP. The slip function is given as:
( ) 1( , ) sin( ) sin( )
2 2
w xu x x (55)
Boundary conditions are imposed as a function of the strengthened scheme adopted, i.e. side bonding, U
jacketing or wrapping. With the compatibility (crack width) and boundary conditions, the stress profile in the
FRP along the crack frp,e(x) is determined. In order to determine the FRP contribution to the shear capacity an
effective stress along the shear crack length z/sin is defined by:

22
/sin
, ,
0
1( ) , , ( )
/ sin
z
frp e frp cr bu x l x dxz
(56)
The effective debonding strength, ffrp,ed, is given by Eqs. (57a, (57b and (58) for side bonding, for U-jacketing,
and for wrapping, respectively. The geometrical reduction factor is introduced according to equation (59).
(a)
2
,, ,
,
1 0.6min 0.9 ,
rid eq eqfrp ed frp dd
w rid eq
z lf f
d h z; (b)
, ,
sin11
3 min 0.9 ,
efrp ed frp dd
w
Lf f
d h (57a, b)
, , , ,
sin sin1 11 1
6 min 0.9 , 2 min 0.9 ,
e efrp ed frp dd R frp u frp dd
w w
L Lf f f f
d h d h (58)
,,
min 0.9 , sin/
frid eq w e
frp dd frp
sz d h l
f E (59)
The FRP contribution to the shear capacity is computed considering two approaches: the Mörsch resisting
mechanism for U jacketing and wrapped strengthening schemes computed according to Eq. (60a), while for side
bonding, the “bridging” of the shear crack principle is used (Eq. (60b).
(a) ,
10.9 2 cot cot
frp frp ed frpfrp frp
wV d f t
p; (b) ,
1 sinmin 0.9 , 2
sin
frp w frp ed frp
frp frp
wV d h f t
p (60a, b)
The predictive performance of the model was originally appraised using results from an experimental program
composed of beams manufactured with a concrete of too low compressive strength. When applied to the
collected data base, Fig. 11 shows that the model generally allows safety estimations, but the safety factor is too
high and it seems to increase with the increase of the contribution of the FRP shear strengthening configurations.
Conclusions
The prediction of the shear resistance of RC beams is still a big challenge in structural engineering domain. This
complexity is even augmented when FRP materials are used to increase the shear capacity of RC beams.
Therefore, it is not strange that differences are observed between the available models for the prediction of the
FRP contribution to the shear resistance of RC beams, as well as the use of several and distinct parameters,
which, in general, were calibrated from a reduced amount of experimental results. This can partially justify the

23
distinct predictive performance of these models, as well as the large dispersion observed when the analytical
results determined from these models were compared to results of the biggest data base collected up to the
moment in this topic.
Scientists focused their attention on the properties of the composites when deriving the equations, but it is quite
clear that existing shear models for FRP strengthening, at least in their present form, do not predict the shear
failure very well. From the literature it can also be found that many researchers have calibrated their models
from unrealistic geometric conditions on their laboratory specimens. If calibration of experimental results should
be done, it is suggested that a Round Robin test procedure should be followed.
Another important concern is the fact that a major part of the experimental programs is composed of rectangular
cross section beams, in spite of the fact that T cross section beams represent the real situation.
The theoretical approach for the T beams is treated as a special case of the rectangular beams with bonded fibers
over a fraction of the cross section. It is also of concern that in some cases theoretical work on T beams has been
validated with experimental data obtained from rectangular cross sections. This direction can be misleading since
the two types of cross section have different behavior. One model, as the authors are aware of, considers the
interaction between the existing steel stirrups and the FRP wrap (Pellegrino and Modena, 2006), however, since
critical parameters to determine the shear contribution of the FRP are missing it was not included in the
comparison.
Consequently, before a more thorough understanding of FRP shear strengthened beams has been obtained, a
conservative approach is suggested. The question is now how to proceed from here. A well planned International
Round Robin test with T cross section beams, where the main factors that influence this structural problem are
carefully considered, seems to be the right path to define a well accepted formulation to predict the contribution
of FRP configurations for the shear resistance of RC beams. The quality of monitoring systems (in particular, the
ones for measuring the strains in the FRP) and correct evaluation of the properties of the intervening materials
need to have a strict control.
Acknowledgments

24
The first, the second and the fifth authors wishes to acknowledge the financial assistance of the European
Union for the Marie Curie Research Training Network En-Core.
The third and fourth authors wish to acknowledge the support provided by the research program
“SmartReinforcement - Carbon fiber laminates for the strengthening and monitoring of reinforced concrete
structures” supported by ADI-IDEIA, Project nº 13-05-04-FDR-00031.
Notation List
Acf = effective flange concrete area
Ac,p = area of peeled concrete
Acw = concrete web area
Afrp = area of FRP shear reinforcement
Dfrp = the stress distribution factor in FRP
Dfrp, = modified distribution factor in FRP accounting the shear crack angle �
Ea = Young’s modulus of the adhesive
Efrp = Young’s modulus of the FRP
Ifrp = moment of inertia of the FRP plate
Lcr = critical bond length
Le = effective bond length
Lf = active length of FRP
Gf = fracture energy of concrete
R = ratio of effective stress or strain in FRP to its ultimate strength or elongation
Rck = concrete characteristic cube strength
RL = remaining bonded length over initial length ratio
T = force transferred by FRP
Tv = tension force in the stirrups
Wfrp = width of FRP

25
Wfrp,e = effective width of FRP
ba = the width of the adhesive
bc,v = vertical arm measured from center of peeled area
bf = is the sum of concrete cover and half stirrup
bw = minimum width of CS over the effective depth
d = effective depth of the cross section
dfrp = effective depth of the FRP shear reinforcement (usually equal to d for rectangular sections and d-
thickness of the slab for T sections
dfrp,t = distance from the compression face to the top edge of the FRP
ds = height of the stirrups
fc = compressive strength of concrete
fctm = mean tensile strength of concrete 2
30.27 ckR
ffrp = tensile strength of FRP
ffrp,dd = bond strength of FRP
ffrp,u = ultimate strength of FRP
ffrp,ed = effective debonding strength of FRP
ffrp,d = design ultimate strength of FRP
ffrp,e = effective tensile stress in FRP
ffrp,u = ultimate tensile strength of FRP in direction of principle stresses
ft = average tensile strength of concrete
ftd = design tensile strength of concrete
h = height of the beam
hfrp,e = effective height of FRP
hw = height of the web
k = experimentally determined factor equal to 0.5 for normal concrete strength

26
ka= ke = coefficient for anchorage end condition equals 2, 1, 0.79 for Side bonded, U shape bonded and fully
wrapped
kb = covering/scale coefficient
kn = normal stiffness of the adhesive
kv = the FRP bond length effect factor
la = anchorage length provided on the top of the beam
lb = sufficient bond length
leq = equivalent length
nf = number of fully contributing stirrups
ns = total number of stirrups crossing concrete shear crack
pfrp = FRP spacing measured orthogonally to �
rc = corner radius
s = stirrups spacing
sfrp = spacing of FRP strips measured along longitudinal axis
ta = the thickness of the adhesive
tfrp = thickness of FRP shear reinforcement
z = length of the vertical tension tie in the truss, normally expressed as 0.9d. When composites are
bonded over the entire height, can be equated to the beam height, h.
Fk = specific fracture energy of the FRP to concrete bond interface
frp = FRP material reduction factor
= crack opening angle
= fiber angle direction with respect to the longitudinal axis of the beam
L =bond length coefficient
w = strip width coefficient
frp = partial safety factor for FRP

27
b = partial safety factor for bond strength, equals 1.25
frp = FRP shear reinforcement ratio
frp,e = effective FRP strain in principal fiber direction
frp,u = ultimate tensile strain in FRP
frp,e1 = effective strain in FRP at debonding
frp,e2 = effective strain in FRP with bonded anchorage
frp,inf = the FRP strain when the bond length is infinite
frp,max = maximum strain in FRP at debonding
cr = critical strain in FRP
bond = maximum allowable strain without achieving anchorage failure
c,max = maximum allowable strain to achieve concrete contribution
= normalized maximum bond length
= crack angle direction with respect to the longitudinal axis of the beam
f = shear plane angle in flange
w = shear plane angle in web
frp,max = maximum stress in FRP
= average concrete bond strength
max = maximum shear stress in concrete
= concrete bond shear resistance factor
= average strain in fibers, the value varies between 0.6 and 0.7
= angle of conventional roughness of interface
v =factor considering the effect of initial shear force
References
28
ACI Committee 318 (2005). “Building code requirements for structural concrete (ACI 318-05) and commentary
(318R-05).” American Concrete Institute, Farmington Hills, Mich., pp 430.
ACI Committee 440 (2002). “Guide for the design and construction of externally bonded FRP systems for
strengthening concrete structures (ACI 440.2R-02).” American Concrete Institute, Farmington Hills, Mich., pp
45.
Adhikary, B. B., Mutsuyoshi, H., and Ashraf, M. (2004). “Shear strengthening of reinforced concrete beams
using fiber-reinforced polymer sheets with bonded anchorage.” ACI Struct. J., 101(5), 660-668.
Brosens, K., and van Gemert, D. (1997). ‘‘Anchoring stresses between concrete and carbon fibre reinforced
laminates.’’ Non-Metallic (FRP) Reinforcement for Concrete Struct., Proc., 3rd Int. Symp., Japan Concrete
Institute, Sapporo, 1, 271–278.
Cao, S. Y., Chen, J. F., Teng, J. G., Hao, Z., and Chen, J. (2005). “Debonding in RC beams shear strengthened
with complete FRP wraps.” J. Compos. Constr., 9(5), 417-428.
Carolin, A. (2003) “Carbon fiber reinforced polymers for strengthening of structural elements”, Doctoral thesis
2003:18, Luleå University of Technology.
Carolin, A., and Täljsten, B. (2005). “Theoretical study of strengthening for increased shear bearing capacity." J.
Compos. Constr., 9(6), 497-506.
Chaalla,l O., Nollet, M-J., and Perraton, D. (1998). “Strengthening of reinforced concrete beams with externally
bonded fibre-reinforced-plastic plates: design guidelines for shear and flexure.” Can. J. Civ. Eng., 25, 692-708.
Chen, J. F., and Teng, J. G. (2001). “Anchorage strength models for FRP and steel plates bonded to concrete.” J.
Struct. Engrg., 127(7),784-791.
Chen, J. F. and Teng, J. G. (2003a). “Shear capacity of fibre-reinforced polymer-strengthened reinforced
concrete beams: fibre reinforced polymer rupture.” J. Struct. Engrg., 129(5), 615-625.
Chen, J. F., and Teng, J. G. (2003b) “Shear capacity of FRP-strengthened RC beams: FRP debonding.” Constr.
Build. Mater., 17, 27-41.
CIDAR (2006). “Design guideline for RC structures retrofitted with FRP and metal plates: beams and slabs”
Draft 3 - submitted to Standards Australia, The University of Adelaide.

29
CNR (2005). “Instructions for design, execution and control of strengthening interventions through fiber-
reinforced composites.” CNR-DT 200/04, Consiglio Nazionale delle Ricerche, Rome, Italy (English version).
Deniaud, C., and Roger Cheng, J. J. “(2001). “Shear behaviour of reinforced concrete T-beams with externally
bonded fibre-reinforced polymer sheets.” ACI Struct. J., 98(3), 396-394.
Deniaud, C., and Roger Cheng, J. J. (2004). “Simplified shear design method for concrete beams strengthened
with fibre reinforced polymer sheets.” J. Compos. Constr., 8( 5), 425-433.
Dias, S.J.E.; Barros, J.A.O., “Shear strengthening of T cross section reinforced concrete beams by near surface
mounted technique”, Journal Composites for Construction, 12(3), 300-311, Maio/Junho, 2008.
European Standard EN 1992 (2004), “Eurocode 2: Design of concrete structures”, European Committee for
Standardization, B-1050 Brussels.
fib Task Group 9.3, 2001, “Externally bonded FRP reinforcement for RC Structures.” fib Bulletin 14, Lausanne,
Switzerland.
Ianniruberto, U., and Imbimbo, M. (2004). “Role of fibre reinforced plastic sheets in shear response of
reinforced concrete beams: Experimental and analytical results.” J. Compos. Constr., 8(5), 415-424.
Khalifa, A., Gold, W., Nanni, A., and Abdel Aziz, M. J. (1998). “Contribution of externally bonded FRP to shear
capacity of RC flexural members.” J. Compos. Constr., 2(4), 195–202.
Khalifa, A., and Nanni, A. (1999). “Improving shear capacity of existing RC T-section beams using CFRP
composites.” Cement and Concrete Composites, 22( 3), 165–174.
Lima, J. L. T., and Barros, J. A. O. (2007)”Design models for shear strengthening of reinforced concrete
beams with externally bonded FRP composites: a statistical vs reliability approach”, Proceedings FRPRCS-8,
Patras, Greece, July 16-18 (CD ROM).
Loov, R. E. (1998). “Review of A23.3-94 simplified method of shear design and comparison with results using
shear friction”. Canadian Journal of Civil Engineering, 25, pp. 437-450.
Malek, A. M., and Saadatmanesh, H. (1998a). “Analytical study of reinforced concrete beams strengthened with
web bonded fibre reinforced plastic plates or fabrics.” ACI Struct. J., 95(3), 343-352.

30
Malek, A. M. and Saadatmanesh, H. (1998b). “Ultimate shear capacity of reinforced concrete beams
strengthened with web-bonded fibre reinforced plastic plates.” ACI Struct. J., 95( 4), 391-399.
Miller, B.D. (1999). “Bond between carbon fiber reinforced polymer sheets and concrete.” MSc Thesis,
Department of Civil Engineering, The University of Missouri, Rolla, MO.
Monti, G., and Liotta, M’A. (2007). “Tests and design equations for FRP-strengthening in shear.” Constr. Build.
Mater., 21, 799-809.
Pellegrino, C., and Modena, C. (2002). “Fiber reinforced polymer shear strengthening of reinforced concrete
beams with transverse steel reinforcement.” J. Compos. Constr., 6(2), 104-111.
Pellegrino, C., and Modena, C. (2006). “Fibre-reinforced polymer shear strengthening of reinforced concrete
beams: Experimental study and analytical modeling.” ACI Struct. J., 103(5), 720-728.
Popov, E. G. (1998). Engineering mechanics of solids, second edition, Prentice Hall, ISBN 0-13-726159-4.
Täljsten, B. (1994). “Plate bonding: Strengthening of existing concrete structures with epoxy bonded plates of
steel or fibre reinforced plastics.” Doctoral thesis, Luleå University of Technology, Sweden.
Täljsten, B. (1997). “Defining anchor lengths of steel and CFRP plates bonded to concrete”, Int. J. Adhes.
Adhes., 17, No. 4, 319–327.
Täljsten, B. (2006) “FRP strengthening of existing concrete structures.” Design guideline fourth edition, ISBN
91-89580-03-6.
Täljsten, B. (2003). “Strengthening concrete beams for shear with CFRP sheets.” Constr. Build. Mater., 17, 15-
26.
Triantafillou, T. C. (1998). “Shear strengthening of reinforced concrete beams using epoxy-bonded FRP
composites.” ACI Struct. J., 95(2), 107-115.
Triantafillou, T. C., and Antonopoulos, C. P. (2000). “Design of concrete flexural members strengthened in shear
with FRP.” J. Compos. Constr., 4(4), 198–205.
Teng, J. G., Chen, J. F., Smith, S. T., and Lam, L. (2002). “FRP strengthened RC structures.”, John Wiley &
Sons, LTD, ISBN 0-471-48706-6.

31
Ye, L. P., Lu X. Z., and Chen, J. F. (2005). “Design proposals for debonding strengths of FRP strengthened RC
beams in the Chinese Design Code”, Proceedings of International Symposium on Bond Behaviour of FRP in
Structures , Hong Kong, China.
Zhang, Z., and Hsu, C-T. T. (2005). “Shear strengthening of reinforced concrete beams using carbon-fibre-
reinforced polymer laminates.” J. Compos. Constr. 9(2), 158-169.
32
List of figures Fig. 1. Strengthening schemes for reinforced concrete beams
Fig. 2. Triantafillou (1998) and Triantafillou and Antonopoulos (2000) model comparison
Fig. 3. Khalifa et al. (1998) Khalifa and Nanni (2000) model comparison
Fig. 4. Chen and Teng (2003a, b) model comparison
Fig. 5. Deniaud and Cheng (2001 and 2004) model
Fig. 6. Adhikary et al. (2004) model comparison
Fig. 7. Ye et al. (2005) model comparison
Fig. 8. Cao et al. (2005) model comparison
Fig. 9. Zhang and Hsu model (2005) model comparison
Fig. 10. Carolin (2003) and Carolin and Täljsten (2005) model comparison
Fig. 11. Monti and Liota (2007) model comparison
List of tables Table 1. Experimental database

33
Fig. 12. Strengthening schemes for reinforced concrete beams
Fig. 13. Triantafillou (1998) and Triantafillou and Antonopoulos (2000) model comparison
Fig. 14. Khalifa et al. (1998) Khalifa and Nanni (2000) model comparison
Fig. 15. Chen and Teng (2003a, b) model comparison

34
Fig. 16. Deniaud and Cheng (2001 and 2004) model
Fig. 17. Adhikary et al. (2004) model comparison

35
Fig. 18. Ye et al. (2005) model comparison
Fig. 19. Cao et al. (2005) model comparison
Fig. 20. Zhang and Hsu model (2005) model comparison
36
Fig. 21. Carolin (2003) and Carolin and Täljsten (2005) model comparison
Fig. 22. Monti and Liota (2007) model comparison

37

Tabel 1. Experimental database
Beam Cross Section Concrete properties FRP properties
Citation Reference Original
no. Type Bslab T bweb h hslab T fcm fck fctm Ec Efrp frp,u ffrp,u Config.
Disc
vs
Cont
tfrp wfrp sfrp Vfrp
- R-T (mm) (mm) (mm) (mm) (MPa) (MPa) (MPa) (MPa) (MPa) % (Mpa) S-U-W D-C (mm)
(mm
) (mm)°
(KN)
Uji (1992) 3 R 0 100 200 0 32,60 24,60 2,54 3,136E+04 230000 0,0115 2645 W C 0,097 1 1 90 34,5
5 R 0 100 200 0 32,60 24,60 2,54 3,136E+04 230000 0,0115 2645 S C 0,097 1 1 90 20,5
6 R 0 100 200 0 35,40 27,40 2,73 3,215E+04 230000 0,0115 2645 S C 0,137 1 1,41 45 33
7 R 0 100 200 0 35,40 27,40 2,73 3,215E+04 230000 0,0115 2645 S C 0,195 1 1 90 20,5
Satto et al. (1996) S2 R 0 200 300 0 53,20 45,20 3,81 3,632E+04 230000 0,0151 3473 S D 0,24 20 80 90 68,4
S3 R 0 200 300 0 49,30 41,30 3,58 3,550E+04 230000 0,0151 3473 U D 0,24 20 80 90 110
S4 R 0 200 300 0 45,50 37,50 3,36 3,466E+04 230000 0,0151 3473 S C 0,12 1 1 90 64,2
S5 R 0 200 300 0 47,70 39,70 3,49 3,515E+04 230000 0,0151 3473 U C 0,12 1 1 90 106,1
Araki et al. (1997) CF045 R 0 200 400 0 32,80 24,80 2,55 3,142E+04 230000 0,0151 3473 W D 0,11 20 84,62 90 35
CF064 R 0 200 400 0 32,90 24,90 2,56 3,145E+04 230000 0,0151 3473 W D 0,11 20 48,89 90 61
CF097 R 0 200 400 0 33,20 25,20 2,58 3,153E+04 230000 0,0151 3473 W D 0,11 20 28,57 90 106
CF131 R 0 200 400 0 33,40 25,40 2,59 3,159E+04 230000 0,0151 3473 W C 0,11 1 1 90 157
CF243 R 0 200 400 0 33,60 25,60 2,61 3,165E+04 230000 0,0151 3473 W C 0,22 1 1 90 206

39
Funakawa et al. (1997) S2 R 0 600 600 0 38,00 30,00 2,90 3,284E+04 240000 0,015833 3800 W C 0,167 1 1 90 242
S3 R 0 600 600 0 38,00 30,00 2,90 3,284E+04 240000 0,015833 3800 W C 0,334 1 1 90 346
S4 R 0 600 600 0 38,00 30,00 2,90 3,284E+04 240000 0,015833 3800 W C 0,501 1 1 90 493
Miyauchi et al. (1997) 1/5 Z-3 R 0 125 200 0 43,10 35,10 3,22 3,410E+04 230000 0,0151 3473 W D 0,111 50 250 90 18,75
1/2 Z-3 R 0 125 200 0 40,40 32,40 3,05 3,345E+04 230000 0,0151 3473 W D 0,111 50 100 90 29,5
1/L Z-2 R 0 125 200 0 47,10 39,10 3,46 3,502E+04 230000 0,0151 3473 W D 0,111 50 100 90 34,55
Kamiharako et al. (1997) 2 R 0 250 500 0 32,60 24,60 2,54 3,136E+04 244000 0,016352 3990 W D 0,11 40 100 90 28,1
7 R 0 400 700 0 34,60 26,60 2,67 3,193E+04 244000 0,016352 3990 W D 0,11 64 100 90 174,7
Taerwe et al. (1997) BS2 R 0 200 450 0 43,10 35,10 3,22 3,410E+04 280000 0,0125 3500 U D 0,11 100 400 90 41,2
BS4 R 0 200 450 0 46,40 38,40 3,41 3,486E+04 280000 0,0125 3500 U C 0,11 1 1 90 115,4
BS5 R 0 200 450 0 44,80 36,80 3,32 3,450E+04 280000 0,0125 3500 U D 0,11 50 400 90 33,4
BS6 R 0 200 450 0 43,80 35,80 3,26 3,427E+04 280000 0,0125 3500 U D 0,11 50 600 90 30
BS7 R 0 200 450 0 42,70 34,70 3,19 3,401E+04 280000 0,0125 3500 W D 0,11 50 200 90 98,9
Umezu et al. (1997) CS1 R 0 300 300 0 48,50 40,50 3,54 3,533E+04 244000 0,017213 4200 W C 0,111 1 1 90 86,6
CS2 R 0 300 300 0 48,50 40,50 3,54 3,533E+04 244000 0,017213 4200 W D 0,111 100 200 90 31,6
CS3 R 0 150 300 0 52,80 44,80 3,78 3,624E+04 244000 0,017213 4200 W D 0,111 100 200 90 52,3
Chaallal et al. (1998) RS90a R 0 150 250 0 35,00 27,00 2,70 3,204E+04 150000 0,016 2400 S D 1 50 100 90 34,25
RS90b R 0 150 250 0 35,00 27,00 2,70 3,204E+04 150000 0,016 2400 S D 1 50 100 90 41,75
RS135a R 0 150 250 0 35,00 27,00 2,70 3,204E+04 150000 0,016 2400 S D 1 50 150 45 40,75
RS135b R 0 150 250 0 35,00 27,00 2,70 3,204E+04 150000 0,016 2400 S D 1 50 150 45 46,25
Mitsui et al. (1998) A R 0 150 250 0 36,50 28,50 2,80 3,244E+04 230000 0,015 3450 W+ C 0,2775 1 1 90 40,2

40
B R 0 150 250 0 36,50 28,50 2,80 3,244E+04 230000 0,015 3450 W+ C 0,2775 1 1 90 43,2
C R 0 150 250 0 36,50 28,50 2,80 3,244E+04 230000 0,015 3450 W+ C 0,2775 1 1 90 34,5
D R 0 150 250 0 36,50 28,50 2,80 3,244E+04 230000 0,015 3450 W+ C 0,2775 1 1 90 55,4
E R 0 150 250 0 36,50 28,50 2,80 3,244E+04 230000 0,015 3450 W+ C 0,2775 1 1 90 38
F R 0 150 250 0 36,50 28,50 2,80 3,244E+04 230000 0,015 3450 W+ C 0,2775 1 1 90 18
Triantafillou (1998) S1A R 0 70 110 0 30,00 22,00 2,36 3,059E+04 235000 0,014043 3300 S D 0,155 30 60 90 13,55
S1B R 0 70 110 0 30,00 22,00 2,36 3,059E+04 235000 0,014043 3300 S D 0,155 30 60 90 11,25
S145 R 0 70 110 0 30,00 22,00 2,36 3,059E+04 235000 0,014043 3300 S D 0,155 30 60 45 14,05
S2A R 0 70 110 0 30,00 22,00 2,36 3,059E+04 235000 0,014043 3300 S D 0,155 45 60 90 15,85
S2B R 0 70 110 0 30,00 22,00 2,36 3,059E+04 235000 0,014043 3300 S D 0,155 45 60 90 12,9
S245 R 0 70 110 0 30,00 22,00 2,36 3,059E+04 235000 0,014043 3300 S D 0,155 30 60 45 15,45
S3A R 0 70 110 0 30,00 22,00 2,36 3,059E+04 235000 0,014043 3300 S C 0,155 1 1 90 13,2
S3B R 0 70 110 0 30,00 22,00 2,36 3,059E+04 235000 0,014043 3300 S C 0,155 1 1 90 10,55
S345 R 0 70 110 0 30,00 22,00 2,36 3,059E+04 235000 0,014043 3300 S C 0,155 1 1,4 45 12,15
Khalifa et al. (1999) CW2 R 0 150 305 0 35,50 27,50 2,73 3,217E+04 228000 0,015351 3500 U+ C 0,165 1 1 90 39
CO2 R 0 150 305 0 28,50 20,50 2,25 3,012E+04 228000 0,015351 3500 U D 0,165 50 125 90 40
CO3 R 0 150 305 0 28,50 20,50 2,25 3,012E+04 228000 0,015351 3500 U C 0,165 1 1 90 65
Khalifa and Nanni (2000) BT2 T 380 150 405 100 35,00 27,00 2,70 3,204E+04 228000 0,016623 3790 U C 0,165 1 1 90 65,0
BT3 T 380 150 405 100 35,00 27,00 2,70 3,204E+04 228000 0,016623 3790 U+ C 0,165 1 1 90 67,5
BT4 T 380 150 405 100 35,00 27,00 2,70 3,204E+04 228000 0,016623 3790 U D 0,165 50 125 90 72,0
BT5 T 380 150 405 100 35,00 27,00 2,70 3,204E+04 228000 0,016623 3790 S D 0,165 50 125 90 31,5

41
BT6 T 380 150 405 100 35,00 27,00 2,70 3,204E+04 228000 0,016623 3790 U+ C 0,165 1 1 90 131,0
Täljsten and Elfgren (2000) S4 R 0 180 500 0 56,50 48,50 3,99 3,699E+04 70800 0,012147 860 U C 0,8 1 1,41 45 211
SR1 R 0 180 500 0 61,80 53,80 4,28 3,799E+04 70800 0,012147 860 U D 0,8 50 141,42 45 89
SR2 R 0 180 500 0 60,70 52,70 4,22 3,779E+04 70800 0,012147 860 U C 0,8 1 1,41 45 123
Deniaud and Cheng (2001) T6NS-C45 T 400 140 600 150 44,10 36,10 3,28 3,434E+04 230000 0,014783 3400 U D 0,11 50 100 45 103,5
T6S4-C90 T 400 140 600 150 44,10 36,10 3,28 3,434E+04 230000 0,014783 3400 U D 0,11 50 100 90 85,25
T6S2-C90 T 400 140 600 150 44,10 36,10 3,28 3,434E+04 230000 0,014783 3400 U D 0,11 50 100 90 0
Park et al. (2001) 2 R 0 100 250 0 33,40 25,40 2,59 31589,78 240000 0,014167 3400 U C 0,16 1 1 90 39,3
3 R 0 100 250 0 33,4 25,40 2,59 31589,78 155000 0,015484 2400 S D 1,2 25 75 90 18,1
5 T 300 100 300 50 33,4 25,40 2,59 31589,78 240000 0,014167 3400 U C 0,16 1 1 90 38,1
6 T 300 100 300 50 33,4 25,40 2,59 31589,78 155000 0,015484 2400 S D 1,2 25 75 90 25,1
Li et al. (2002) B80_1 R 0 130 300 0 38,00 30,00 2,90 3,284E+04 42400 0,011085 470 S+ C 1,5 1 1,41 45 12
B80_2 R 0 130 300 0 38,00 30,00 2,90 3,284E+04 42400 0,011085 470 S+ C 1,5 1 1,41 45 23,5
B80_3 R 0 130 300 0 38,00 30,00 2,90 3,284E+04 42400 0,011085 470 S+ C 1,5 1 1,41 45 22
B40_1 R 0 130 300 0 38,00 30,00 2,90 3,284E+04 42400 0,011085 470 S+ C 1,5 1 1,41 45 10,5
B20_1 R 0 130 300 0 38,00 30,00 2,90 3,284E+04 42400 0,011085 470 S+ C 1,5 1 1,41 45 7,5
B20_2 R 0 130 300 0 38,00 30,00 2,90 3,284E+04 42400 0,011085 470 S+ C 1,5 1 1,41 45 13,5
B20_3 R 0 130 300 0 38,00 30,00 2,90 3,284E+04 42400 0,011085 470 S+ C 1,5 1 1,41 45 13
B10_1 R 0 130 300 0 38,00 30,00 2,90 3,284E+04 42400 0,011085 470 S+ C 1,5 1 1,41 45 0
B'80_2 R 0 130 300 0 38,00 30,00 2,90 3,284E+04 42400 0,011085 470 S+ C 1,5 1 1,41 45 20,5
B'20_2 R 0 130 300 0 38,00 30,00 2,90 3,284E+04 42400 0,011085 470 S+ C 1,5 1 1,41 45 30,5

42
Chaallal et al. (2002) G5.5_1L T 584,2 122,17 444,5 88,9 37,90 29,90 2,89 3,281E+04 231000 0,015801 3650 U+ C 0,145 1 1 90 31,1374
G5.5_2L T 584,2 122,17 444,5 88,9 37,90 29,90 2,89 3,281E+04 231000 0,015801 3650 U+ C 0,29 1 1 90 53,3784
G8.0_1L T 584,2 122,17 444,5 88,9 37,90 29,90 2,89 3,281E+04 231000 0,015801 3650 U+ C 0,145 1 1 90 31,1374
G8.0_2L T 584,2 122,17 444,5 88,9 37,90 29,90 2,89 3,281E+04 231000 0,015801 3650 U+ C 0,29 1 1 90 62,2748
G8.0_3L T 584,2 122,17 444,5 88,9 37,90 29,90 2,89 3,281E+04 231000 0,015801 3650 U+ C 0,435 1 1 90 84,5158
G16_1L T 584,2 122,17 444,5 88,9 37,90 29,90 2,89 3,281E+04 231000 0,015801 3650 U+ C 0,145 1 1 90 40,0338
G16_2L T 584,2 122,17 444,5 88,9 37,90 29,90 2,89 3,281E+04 231000 0,015801 3650 U+ C 0,29 1 1 90 84,5158
G24_1L T 584,2 122,17 444,5 88,9 37,90 29,90 2,89 3,281E+04 231000 0,015801 3650 U+ C 0,145 1 1 90 53,3784
G24_2L T 584,2 122,17 444,5 88,9 37,90 29,90 2,89 3,281E+04 231000 0,015801 3650 U+ C 0,29 1 1 90 48,9302
G24_3L T 584,2 122,17 444,5 88,9 37,90 29,90 2,89 3,281E+04 231000 0,015801 3650 U+ C 0,435 1 1 90 53,3784
Khalifa and Nanni (2002) SW3-2 R 0 150 305 0 27,30 19,30 2,16 2,974E+04 228000 0,016623 3790 U+ C 0,165 1 1 90 50,5
SW4-2 R 0 150 305 0 27,30 19,30 2,16 2,974E+04 228000 0,016623 3790 U+ C 0,165 1 1 90 80,5
SO3-2 R 0 150 305 0 35,50 27,50 2,73 3,217E+04 228000 0,016623 3790 U D 0,165 50 125 90 54
SO3-3 R 0 150 305 0 35,50 27,50 2,73 3,217E+04 228000 0,016623 3790 U D 0,165 75 125 90 56,5
SO3-4 R 0 150 305 0 35,50 27,50 2,73 3,217E+04 228000 0,016623 3790 U C 0,165 1 1 90 67,5
SO3-5 R 0 150 305 0 35,50 27,50 2,73 3,217E+04 228000 0,016623 3790 U+ C 0,165 1 1 90 92,5
SO4-2 R 0 150 305 0 35,50 27,50 2,73 3,217E+04 228000 0,016623 3790 U D 0,165 50 125 90 62,5
SO4-3 R 0 150 305 0 35,50 27,50 2,73 3,217E+04 228000 0,016623 3790 U C 0,165 1 1 90 90
Pellegrino and Modena (2002) TR30C2 R 0 150 300 0 27,50 19,50 2,17 2,980E+04 234000 0,015171 3550 S C 0,165 1 1 90 45,3
TR30C3 R 0 150 300 0 27,50 19,50 2,17 2,980E+04 234000 0,015171 3550 S C 0,495 1 1 90 38,1
TR30C4 R 0 150 300 0 27,50 19,50 2,17 2,980E+04 234000 0,015171 3550 S C 0,495 1 1 90 65,5

43
TR30D10 R 0 150 300 0 31,40 23,40 2,45 3,101E+04 234000 0,015171 3550 S C 0,33 1 1 90 31,5
TR30D2 R 0 150 300 0 31,40 23,40 2,45 3,101E+04 234000 0,015171 3550 S C 0,495 1 1 90 51,8
TR30D20 R 0 150 300 0 31,40 23,40 2,45 3,101E+04 234000 0,015171 3550 S C 0,495 1 1 90 86
TR30D3 R 0 150 300 0 31,40 23,40 2,45 3,101E+04 234000 0,015171 3550 S C 0,165 1 1 90 0
TR30D4 R 0 150 300 0 31,40 23,40 2,45 3,101E+04 234000 0,015171 3550 S C 0,33 1 1 90 47,3
TR30D40 R 0 150 300 0 31,40 23,40 2,45 3,101E+04 234000 0,015171 3550 S C 0,33 1 1 90 50,5
Beber (2003) V9_A R 0 150 300 0 32,80 24,80 2,55 3,142E+04 230000 0,014783 3400 S D 0,111 50 100 90 41,2
V9_B R 0 150 300 0 32,80 24,80 2,55 3,142E+04 230000 0,014783 3400 S D 0,111 50 100 90 47,37
V21_A R 0 150 300 0 32,80 24,80 2,55 3,142E+04 230000 0,014783 3400 S D 0,111 50 100 90 58,27
V10_A R 0 150 300 0 32,80 24,80 2,55 3,142E+04 230000 0,014783 3400 U D 0,111 50 100 90 50,57
V10_B R 0 150 300 0 32,80 24,80 2,55 3,142E+04 230000 0,014783 3400 U D 0,111 50 100 90 49,07
V17_A R 0 150 300 0 32,80 24,80 2,55 3,142E+04 230000 0,014783 3400 U D 0,111 50 100 90 45,87
V11_A R 0 150 300 0 32,80 24,80 2,55 3,142E+04 230000 0,014783 3400 U D 0,111 50 100 90 41,51
V11_B R 0 150 300 0 32,80 24,80 2,55 3,142E+04 230000 0,014783 3400 U D 0,111 50 100 90 67,88
V17_B R 0 150 300 0 32,80 24,80 2,55 3,142E+04 230000 0,014783 3400 U D 0,111 50 100 90 36,01
V12_A R 0 150 300 0 32,80 24,80 2,55 3,142E+04 230000 0,014783 3400 W D 0,111 50 100 90 59,44
V18_A R 0 150 300 0 32,80 24,80 2,55 3,142E+04 230000 0,014783 3400 W D 0,111 50 100 90 70,37
V20_A R 0 150 300 0 32,80 24,80 2,55 3,142E+04 230000 0,014783 3400 W D 0,111 50 100 90 83,2
V12_B R 0 150 300 0 32,80 24,80 2,55 3,142E+04 230000 0,014783 3400 S D 0,111 50 141,4 45 44,73
V14_B R 0 150 300 0 32,80 24,80 2,55 3,142E+04 230000 0,014783 3400 S D 0,111 50 141,4 45 34,73
V19_A R 0 150 300 0 32,80 24,80 2,55 3,142E+04 230000 0,014783 3400 U D 0,111 50 141,4 45 61,5

44
V19_B R 0 150 300 0 32,80 24,80 2,55 3,142E+04 230000 0,014783 3400 U D 0,111 50 141,4 45 58,21
V13_A R 0 150 300 0 32,80 24,80 2,55 3,142E+04 230000 0,014783 3400 S C 0,111 1 1 90 65,09
V13_B R 0 150 300 0 32,80 24,80 2,55 3,142E+04 230000 0,014783 3400 S C 0,111 1 1 90 68,83
V15_B R 0 150 300 0 32,80 24,80 2,55 3,142E+04 230000 0,014783 3400 U C 0,111 1 1 90 81,45
V16_B R 0 150 300 0 32,80 24,80 2,55 3,142E+04 230000 0,014783 3400 U C 0,111 1 1 90 55,51
V14_A R 0 150 300 0 32,80 24,80 2,55 3,142E+04 230000 0,014783 3400 S C 0,111 1 1,41 45 71,47
V15_A R 0 150 300 0 32,80 24,80 2,55 3,142E+04 230000 0,014783 3400 S C 0,111 1 1,41 45 63,64
V20_B R 0 150 300 0 32,80 24,80 2,55 3,142E+04 205000 0,012195 2500 S D 1,4 50 100 90 85,99
V22_B R 0 150 300 0 32,80 24,80 2,55 3,142E+04 205000 0,012195 2500 S D 1,4 50 100 90 55,59
V21_B R 0 150 300 0 32,80 24,80 2,55 3,142E+04 205000 0,012195 2500 S D 1,4 50 141,4 45 78,78
V22_A R 0 150 300 0 32,80 24,80 2,55 3,142E+04 205000 0,012195 2500 S D 1,4 50 141,4 45 68,68
Deniaud and Cheng (2003) T4S2-C45 T 400 140 400 150 37,40 29,40 2,86 3,268E+04 230000 0,014783 3400 U D 0,11 50 141 45 17,8
Diagana et al. (2003) PU1 R 0 130 450 0 38,00 30,00 2,90 3,284E+04 105000 0,013333 1400 U D 0,43 40 200 90 32,5
PU2 R 0 130 450 0 38,00 30,00 2,90 3,284E+04 105000 0,013333 1400 U D 0,43 40 250 90 20
PU3 R 0 130 450 0 38,00 30,00 2,90 3,284E+04 105000 0,013333 1400 U D 0,43 40 300 45 44,5
PU4 R 0 130 450 0 38,00 30,00 2,90 3,284E+04 105000 0,013333 1400 U D 0,43 40 350 45 40
PC1 R 0 130 450 0 38,00 30,00 2,90 3,284E+04 105000 0,013333 1400 W D 0,43 40 200 90 67,5
PC2 R 0 130 450 0 38,00 30,00 2,90 3,284E+04 105000 0,013333 1400 W D 0,43 40 250 90 45
PC3 R 0 130 450 0 38,00 30,00 2,90 3,284E+04 105000 0,013333 1400 W D 0,43 40 300 45 35,5
PC4 R 0 130 450 0 38,00 30,00 2,90 3,284E+04 105000 0,013333 1400 W D 0,43 40 350 45 22
Täljsten (2003) RC1 R 0 180 500 0 67,40 59,40 4,57 3,900E+04 234000 0,019231 4500 S C 0,07 1 1,41 45 182
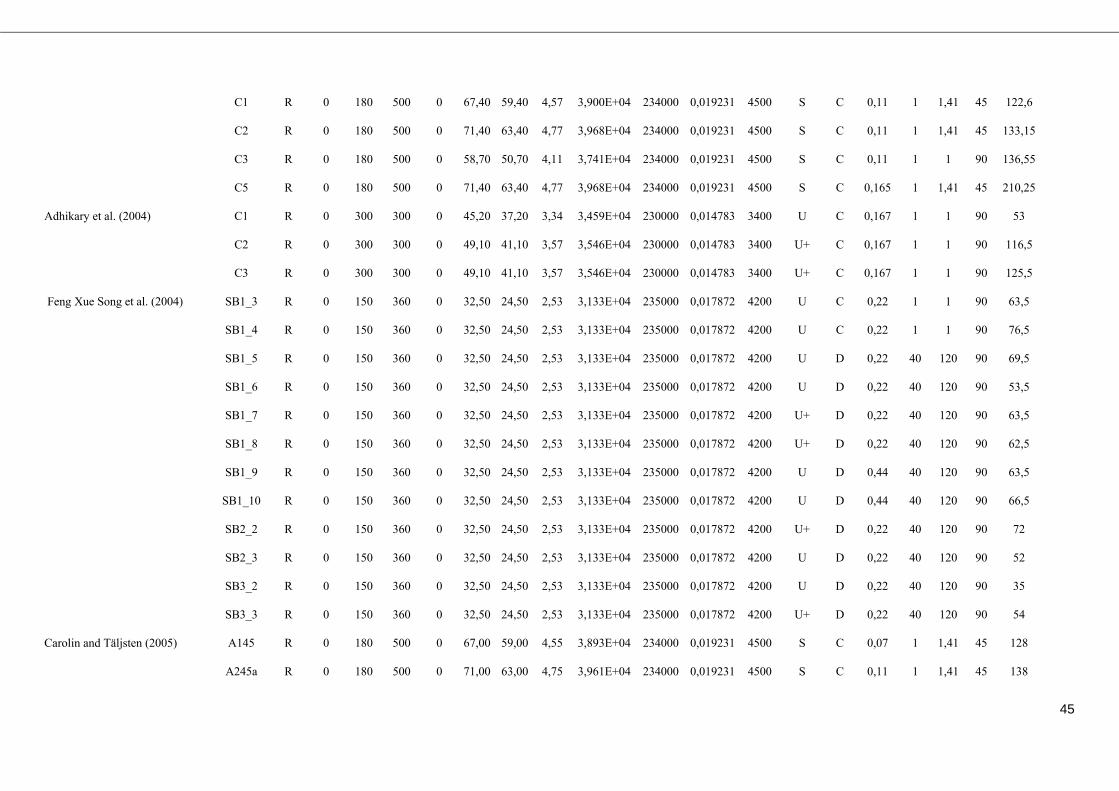
45
C1 R 0 180 500 0 67,40 59,40 4,57 3,900E+04 234000 0,019231 4500 S C 0,11 1 1,41 45 122,6
C2 R 0 180 500 0 71,40 63,40 4,77 3,968E+04 234000 0,019231 4500 S C 0,11 1 1,41 45 133,15
C3 R 0 180 500 0 58,70 50,70 4,11 3,741E+04 234000 0,019231 4500 S C 0,11 1 1 90 136,55
C5 R 0 180 500 0 71,40 63,40 4,77 3,968E+04 234000 0,019231 4500 S C 0,165 1 1,41 45 210,25
Adhikary et al. (2004) C1 R 0 300 300 0 45,20 37,20 3,34 3,459E+04 230000 0,014783 3400 U C 0,167 1 1 90 53
C2 R 0 300 300 0 49,10 41,10 3,57 3,546E+04 230000 0,014783 3400 U+ C 0,167 1 1 90 116,5
C3 R 0 300 300 0 49,10 41,10 3,57 3,546E+04 230000 0,014783 3400 U+ C 0,167 1 1 90 125,5
Feng Xue Song et al. (2004) SB1_3 R 0 150 360 0 32,50 24,50 2,53 3,133E+04 235000 0,017872 4200 U C 0,22 1 1 90 63,5
SB1_4 R 0 150 360 0 32,50 24,50 2,53 3,133E+04 235000 0,017872 4200 U C 0,22 1 1 90 76,5
SB1_5 R 0 150 360 0 32,50 24,50 2,53 3,133E+04 235000 0,017872 4200 U D 0,22 40 120 90 69,5
SB1_6 R 0 150 360 0 32,50 24,50 2,53 3,133E+04 235000 0,017872 4200 U D 0,22 40 120 90 53,5
SB1_7 R 0 150 360 0 32,50 24,50 2,53 3,133E+04 235000 0,017872 4200 U+ D 0,22 40 120 90 63,5
SB1_8 R 0 150 360 0 32,50 24,50 2,53 3,133E+04 235000 0,017872 4200 U+ D 0,22 40 120 90 62,5
SB1_9 R 0 150 360 0 32,50 24,50 2,53 3,133E+04 235000 0,017872 4200 U D 0,44 40 120 90 63,5
SB1_10 R 0 150 360 0 32,50 24,50 2,53 3,133E+04 235000 0,017872 4200 U D 0,44 40 120 90 66,5
SB2_2 R 0 150 360 0 32,50 24,50 2,53 3,133E+04 235000 0,017872 4200 U+ D 0,22 40 120 90 72
SB2_3 R 0 150 360 0 32,50 24,50 2,53 3,133E+04 235000 0,017872 4200 U D 0,22 40 120 90 52
SB3_2 R 0 150 360 0 32,50 24,50 2,53 3,133E+04 235000 0,017872 4200 U D 0,22 40 120 90 35
SB3_3 R 0 150 360 0 32,50 24,50 2,53 3,133E+04 235000 0,017872 4200 U+ D 0,22 40 120 90 54
Carolin and Täljsten (2005) A145 R 0 180 500 0 67,00 59,00 4,55 3,893E+04 234000 0,019231 4500 S C 0,07 1 1,41 45 128
A245a R 0 180 500 0 71,00 63,00 4,75 3,961E+04 234000 0,019231 4500 S C 0,11 1 1,41 45 138

46
A245b R 0 180 500 0 53,00 45,00 3,80 3,628E+04 234000 0,019231 4500 S C 0,11 1 1,41 45 186
A245W R 0 180 500 0 46,00 38,00 3,39 3,477E+04 234000 0,019231 4500 W C 0,11 1 1,41 45 219
A245Ra R 0 180 500 0 67,00 59,00 4,55 3,893E+04 234000 0,019231 4500 S C 0,11 1 1,41 45 187
A245Rb R 0 180 500 0 47,00 39,00 3,45 3,500E+04 234000 0,019231 4500 S C 0,11 1 1,41 45 132
A290a R 0 180 500 0 59,00 51,00 4,13 3,747E+04 234000 0,019231 4500 S C 0,11 1 1 90 137
A290b R 0 180 500 0 52,00 44,00 3,74 3,608E+04 234000 0,019231 4500 S C 0,11 1 1 90 179
A290W R 0 180 500 0 52,00 44,00 3,74 3,608E+04 234000 0,019231 4500 W C 0,11 1 1 90 248
A290WR R 0 180 500 0 46,00 38,00 3,39 3,477E+04 234000 0,019231 4500 W C 0,11 1 1 90 269
A345 R 0 180 500 0 71,00 63,00 4,75 3,961E+04 234000 0,019231 4500 S C 0,17 1 1,41 45 215
B290 R 0 180 400 0 46,00 38,00 3,39 3,477E+04 234000 0,019231 4500 S C 0,11 1 1 90 61
B390 R 0 180 400 0 46,00 38,00 3,39 3,477E+04 234000 0,019231 4500 S C 0,17 1 1 90 61
Miyajima et al. (2005) case2 R 0 340 440 0 29,90 21,90 2,35 3,056E+04 253000 0,01913 4840 W D 0,111 50 150 90 81,3
case3 R 0 340 440 0 29,90 21,90 2,35 3,056E+04 253000 0,01913 4840 W D 0,111 75 150 90 122
case4 R 0 340 440 0 29,90 21,90 2,35 3,056E+04 253000 0,01913 4840 W D 0,111 87,5 150 90 132
case5 R 0 340 440 0 29,90 21,90 2,35 3,056E+04 253000 0,01913 4840 W D 0,111 100 150 90 162
Monti and Liota (2005) SS90* R 0 250 450 0 10,65 2,65 0,57 2,242E+04 390000 0,007692 3000 S D 0,22 150 300 90 5
SS45 R 0 250 450 0 10,65 2,65 0,57 2,242E+04 390000 0,007692 3000 S D 0,22 150 300 45 6
SSVA R 0 250 450 0 10,65 2,65 0,57 2,242E+04 390000 0,007692 3000 S D 0,22 150 300 45 10
SF90 R 0 250 450 0 10,65 2,65 0,57 2,242E+04 390000 0,007692 3000 S C 0,22 1 1 90 17,5
US90* R 0 250 450 0 10,65 2,65 0,57 2,242E+04 390000 0,007692 3000 U D 0,22 150 300 90 0
US60 R 0 250 450 0 10,65 2,65 0,57 2,242E+04 390000 0,007692 3000 U D 0,22 150 300 60 16

47
USVA R 0 250 450 0 10,65 2,65 0,57 2,242E+04 390000 0,007692 3000 U D 0,22 150 300 45 25
USVA+ R 0 250 450 0 10,65 2,65 0,57 2,242E+04 390000 0,007692 3000 U+ D 0,22 150 300 60 40
US45+ R 0 250 450 0 10,65 2,65 0,57 2,242E+04 390000 0,007692 3000 U+ D 0,22 150 300 45 31
US90(2)* R 0 250 450 0 10,65 2,65 0,57 2,242E+04 390000 0,007692 3000 U D 0,22 150 300 90 0
UF90 R 0 250 450 0 10,65 2,65 0,57 2,242E+04 390000 0,007692 3000 U C 0,22 1 1 90 30
US45++ R 0 250 450 0 10,65 2,65 0,57 2,242E+04 390000 0,007692 3000 U+ D 0,22 50 100 45 38,5
US45+A R 0 250 450 0 10,65 2,65 0,57 2,242E+04 390000 0,007692 3000 U+ C 0,22 1 1,41 45 63,5
UF45++B R 0 250 450 0 10,65 2,65 0,57 2,242E+04 390000 0,007692 3000 U+ C 0,22 1 1,41 45 72
UF45++C R 0 250 450 0 10,65 2,65 0,57 2,242E+04 390000 0,007692 3000 U+ C 0,22 1 1,41 45 77
US45++F R 0 250 450 0 10,65 2,65 0,57 2,242E+04 390000 0,007692 3000 U+ D 0,22 150 225 45 87,85
US45++E R 0 250 450 0 10,65 2,65 0,57 2,242E+04 390000 0,007692 3000 U+ D 0,22 150 225 45 55,15
US45+D R 0 250 450 0 10,65 2,65 0,57 2,242E+04 390000 0,007692 3000 U D 0,22 150 225 45 68,45
WS45++ R 0 250 450 0 10,65 2,65 0,57 2,242E+04 390000 0,007692 3000 W+ D 0,22 50 100 45 19,5
Bousselham and Chaallal (2006) DBS01L T 270 95 220 55 25,50 17,50 2,02 2,913E+04 231000 0,015801 3650 U+ C 0,066 1 1 90 15,4
DBS02L T 270 95 220 55 25,50 17,50 2,02 2,913E+04 231000 0,015801 3650 U+ C 0,132 1 1 90 13,8
DBS11L T 270 95 220 55 25,50 17,50 2,02 2,913E+04 231000 0,015801 3650 U+ C 0,066 1 1 90 12,7
DBS12L T 270 95 220 55 25,50 17,50 2,02 2,913E+04 231000 0,015801 3650 U+ C 0,132 1 1 90 17
SBS01L T 270 95 220 55 25,50 17,50 2,02 2,913E+04 231000 0,015801 3650 U+ C 0,066 1 1 90 23,2
SBS02L T 270 95 220 55 25,50 17,50 2,02 2,913E+04 231000 0,015801 3650 U+ C 0,132 1 1 90 32,4
SBS11L T 270 95 220 55 25,50 17,50 2,02 2,913E+04 231000 0,015801 3650 U+ C 0,066 1 1 90 2,8
SBS12L T 270 95 220 55 25,50 17,50 2,02 2,913E+04 231000 0,015801 3650 U+ C 0,132 1 1 90 12,2

48
Dias and Barros (2006) 2S_4M(1) T 450 180 400 100 38,10 30,10 2,90 3,286E+04 240000 0,015 3600 U D 0,176 60 180 90 4,38
2S_7M(1) T 450 180 400 100 38,10 30,10 2,90 3,286E+04 240000 0,015 3600 U D 0,176 60 114 90 12,78
2S_7M(2) T 450 180 400 100 38,10 30,10 2,90 3,286E+04 240000 0,015 3600 U D 0,352 60 114 90 39,78
4S_4M(1) T 450 180 400 100 41,00 33,00 3,09 3,359E+04 240000 0,015 3600 U D 0,176 60 180 90 27,6
4S_7M(1) T 450 180 400 100 41,00 33,00 3,09 3,359E+04 240000 0,015 3600 U D 0,176 60 114 90 30,96
De Lorenzis and Rizzo (2006) UW90 R 0 200 210 0 29,30 21,30 2,31 3,037E+04 230000 0,014913 3430 U C 0,165 1 1 90 19,3
Dias and Barros (2008 ) A10_M R 0 150 300 0 49,20 41,20 3,58 3,548E+04 390000 0,007692 3000 U D 0,334 25 190 90 10,83
A12_M R 0 150 300 0 49,20 41,20 3,58 3,548E+04 390000 0,007692 3000 U D 0,334 25 95 90 31,52
B10_M R 0 150 150 0 56,20 48,20 3,97 3,693E+04 390000 0,007692 3000 U D 0,334 25 80 90 18,56
B12_M R 0 150 150 0 56,20 48,20 3,97 3,693E+04 390000 0,007692 3000 U D 0,334 25 40 90 33,65
Note: Bslab T=width of flange for T section beams; bweb=beam’s cross section width; h=height of the beam; hslab T=thickness of the flange for T section beams; fcm=mean value of concrete
compressive cylinder strength; fck=characteristic compressive cylinder strength of concrete at 28 days; fctm= mean value of concrete cylinder tensile strength; Ec= elastic modulus of concrete;
Efrp= elastic modulus of fibres; frp,u= ultimate design strain of the FRP; ffrp,u= ultimate design stress of the FRP; tfrp= thickness of the FRP; wfrp=width of the FRP; sfrp= spacing of the FRP;
=inclination angle of the FRP with respect to the longitudinal axis of the beam; C=continuous; D= discontinuous; S=side bonded; S+=side bonded with anchorage; U= U wrapped; U= U
wrapped with anchorage; W= fully wrapped; W= fully wrapped with anchorage; Vfrp=contribution of the FRP to the shear capacity of the beam.


![JPDUDVOLV#LVPHQJHQKDULD FRP EU LJRUSXII#JPDLO FRP€¦ · hjdyd#lvphqjhqkduld frp eu hysurmhwrv hqj#jpdlo frp hgx ]lool#krwpdlo frp ilolsh#edvhdpelhqwdo frp eu jerued#fdvdq frp eu](https://img.dokumen.tips/doc/110x75/5fa5bbc4c11b4c37f05fd0f4/jpdudvolvlvphqjhqkduld-frp-eu-ljrusxiijpdlo-hjdydlvphqjhqkduld-frp-eu-hysurmhwrv.jpg)