Embed Size (px)
Citation preview

ARD-Ri45 466 LABORATORY EVALUATION OF ELECTROMAGNETIC PULSE (EMP) i/'iHARDNESS TESTINGCCON. .(U) CONSTRUCTION ENGINEERINGRESEARCH LAB (ARMY) CHAMPAIGN IL P H NIELSEN AUG 84
UNCLASSIFIED CERL-TR-M-358 F/S 20/i4 N
EnEEEEEEEiE

1- 21
11,25 I-~
i -ggl~
~ MERLUS ArrmCorps@ofiews TECHNICAL REPORT M-350
Cormtrution Eninfi August 1984Rserch Laboraory
AD-A 145 466
LABORATORY EVALUATION OF ELECTROMAGNETICPULSE (EMP) HARDNESS TESTING CONCEPTSFOR ELECTRICAL CONDUIT SYSTEMS
byPaul H. Nielse
L-J ..j IDTIC
Approved for public release; distribution unlimited.
84 09 10 008O !~L

The contents of this report are not to be used for advertising, publication, orpromotional purposes. Citation of trade names does not constitute an
official indorsement or approval of the use of such commercial products.
The findings of this report are not to be construed as an official Departmentof the Army position, unless so designated by other authorized documents.
a
0
DESTROY THIS REPORT WHEN IT IS NO LONGER NEEDED
DO NOT RETURN IT TO THE ORIGIN.4 TOR
p.o
*h
IJNE.AQr7 winSECUITY CLASIFICATION OF THIS PAGE (When Dat Entrer@)
REPORT DOCUMENTATION PAGE E COMPLETING FORMREPORT NUMBER G 2 CATALOG NUMBER
CERL-TR-M-350 GO>VT N5qZ INT
4L TITLE (and Satele) S. TYPE OF REPORT & PERIOD COVERED
LABORATORY EVALUATION OF ELECTROMAGNATIC PULSE(EMP) HARDNESS TESTING CONCEPTS FOR ELECTRICALCONDUIT SYSTE4S s. PERFORMING ORG. REPORT NUMBER
7. AUTHOR(q) 4. CONTRACT OR GRANT NUMBER(s)
Paul H. Nielsen DNA Reimbursable Order 82577
S. PERFORMING ORGANIZATION NAME AND ADDRESS 10. PROGRAM ELEMENT. PROJECT, TASK
U.S. ARMY AREA & WORK UNIT NUMBERS
CONSTRUCTION ENGINEERING RESEARCH LABORATORYP.O. BOX 4005, CHAMPAIGN, IL 61820
It. CONTROLLING OFFICE NAME AND ADDRESS 12. REPORT OATSDefense Nuclear Agency August 1984Hybla Valley Federal Bldg., 6801 Telegraph Rd. 1S. NUMBER OF PAGES
Washington, DC 20305 3214. MONITORING AGENCY NAME & ADDRESS(I differmt fom Contolina Offlce) IS. SECURITY CLASS. (of this report)
Unclassified
ISa. DECL ASSI FICATI ON/DOWNGRADINGSCHEDULE
It. DISTRISUTION STATEMENT (of ths epo )
Approved for public release; distribution unlimited.
I. DISTRIBUTION STATEMENT (of Mie ab tract entered In 81ook 0, It tff.,mt 1em Repoet)
1•. SUPPLEMENTARY NOTES
Copies are available from the National Technical Information ServiceSpringfield, VA 22161
*19. KEY WORDS (Cetibw an rever. *ide 1 necessm, md Idmtlf by block mmbe)
electric conduitselectromagnetic shielding
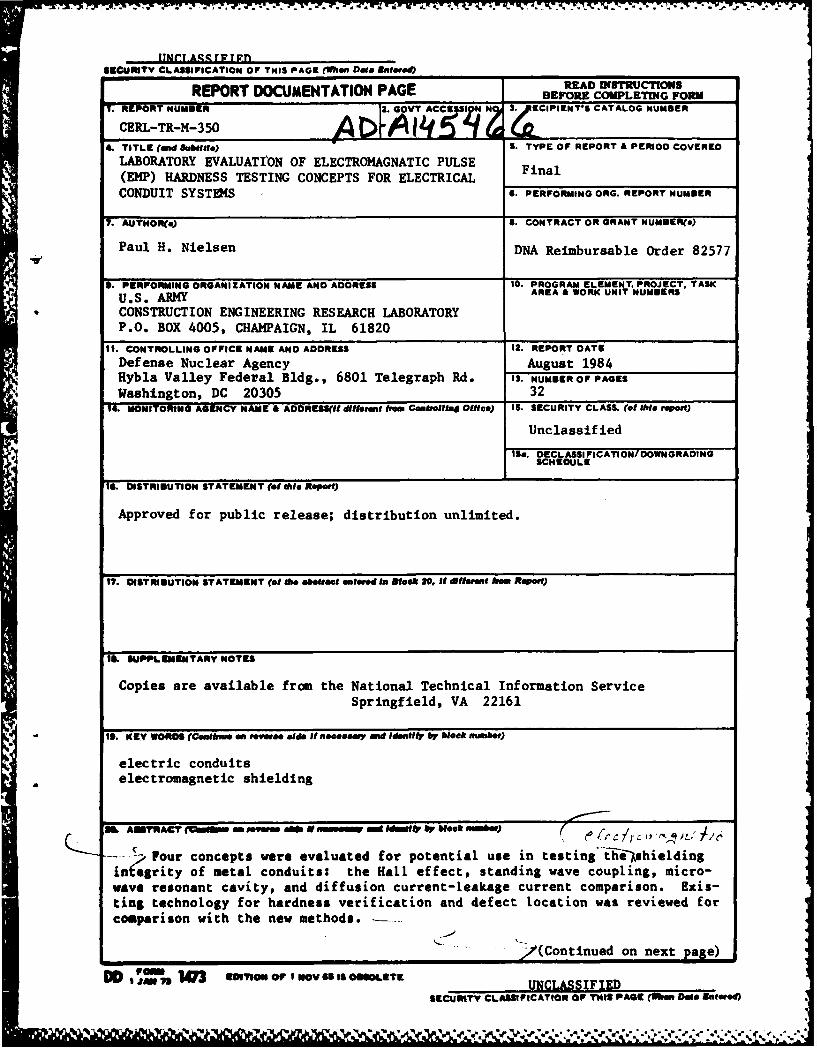
U1 AUSNITAC? ( N en Amn N IM1 01111111- by Wleek nowbe) ~ ~f/
- Four concepts were evaluated for potential use in testing Ehe shieldinginegrity of metal conduits: the Hall effect, standing wave coupling, micro-wave resonant cavity, and diffusion current-leakage current comparison. Exis-ting technology for hardness verification and defect location was reviewed forcomparison with the new methods.
/(Continued on next page)
DD J 79 EDITION OI NOV 61 OBSOLETE UNCLASSIFIED
SECURITY CLASSIFICATION OF THIS PAGE (WR Date 800e')

LUNCL.A .i; 11,' 1,E1i
iCUPATY CLASSIFICATION OF THIS PAO5(Ihm DiO aSamd)
BLOCK 20 (Cont'd)
Gsecause of the phenomena involved, the four concepts are mainly for use
with nonburied conduits. In addition, each method has its prospective appli-cation limited by one or more drawbacks to implementation: -ttrO Hall effectdevices require direct access to the conduit system and are subject to geom-etry-dependent variables; with standing wave coupling tests, it may be diffi-cult to maintain a transmission line configuration for the conduit system; themicrowave resonant cavity method also requires direct access to the conduitand its greatest potential is for testing of specific conduit components; low-frequency phase comparison only verifies hardness, so defects must be locatedby another test. -
C:7None of the new methods can be recommended without further development
and field evaluation,
UNCLASSIFIEDSIECUNITY CLASSIFICATION OF THIS PAGEW b' De Entered)
, '.t c Z cj* ~

FOREWORD
This work was performed by the Engineering and Materials (EM) Division ofthe U.S. Army Construction Engineering Research Laboratory (CERL) for the De-fense Nuclear Agency (DNA) under DNA Reimbursable Order 82577 dated 1982.
Some of the data in this report were published in CERL Technical ReportM-292/AD-A107133, EMP/EMI Hardening of Electrical Conduit Systems, September1981. Additional analytic efforts conducted since then are reported here.
Dr. Robert Quattrone is Chief of CERL-EM. COL Paul J. Theuer is Com-mander and Director of CERL, and Dr. L. R. Shaffer is Technical Director.
Accession For
NTIS GRA&IDTIC TABUnannounced QJustification
BYDistribution/
Availability Codes
Avail and/or
SSpecial
3

CONTENTS
PageDD FORM 1473 1FOREWORD 3
LIST OF TABLES AND FIGURES 5
1 INTRODUCTION ..................... . . .................... .. . .. .
BackgroundObjectiveApproach
2 REVIEW OF EXISTING TESTS ............. .......................... ... 8Test ConceptAir Leak/Pressurization TestPulsed Transmission Line TestPulsed Dipole TestVisual Inspection
3 LABORATORY TESTS OF NEW CONCEPTS .................................. 11
Hall Effect DeviceStanding Wave CouplingMicrovave Resonant CavityDiffusion Current-Leakage Phase ComparisonAnalysis of ResultsField Use of New Methods
4 CONCLUSIONS AND RECOMMENDATIONS ........... .............. ....... . 32
REFERENCES 32
DISTRIBUTION
4
---- * - -

TABLES
Number Page
1 Measurements With Model FH-302-040 Hall Effect Deviceat 15-mA Hall Current, 20-A Conduit Current (in mV) 15
2 Measurements With Model FH-302-040 Hall Effect Device at15-mA Hall Current, 20-A Conduit Current (mV, Normalizedto Lowest Reading) 15
3 Measurements With Model BH-700 Hall Effect Device, 200-mAHall Current, 20-A Conduit Current (in mV) 16
4 Measurements With Model BH-700 Hall Effect Device at200-mA Hall Current, 20-A Conduit Current (in mV,Normalized to Lowest Reading) 16
5 Conductivities (a) of Earth Materials at NormalTemperatures and Pressures 21
6 Skin Depth (6) in Earth Materials of VariousConductivities (in meters) 23
7 Diffusion Current Phase Lag for 1-in. Riiid-WalledSteel Conduit (Wall Thickness=.338 x 10- m) 29
8 Diffusion Current Phase Lag for i-in. Rigid-WalledAluminum Conduit 29
9 Estimated Frequencies at Which Rigid-Walled SteelConduit Is One Wavelength Thick 30
FIGURES
I EMP Coupling Through Electrical Conduit 8
2 Magnetic Field Associated With a Current Flow 12
3 Current Flow Around a Transverse Defect 12
4 Hall Effect Device Used to Measure a Magnetic Field 13
5 Proposed Conduit Test Fixture Using Hall Effect Devices 13
6 Grid for Data Points Measuring Magnetic Field Distortionby a Conduit Defect 14
7 Standing Wave Pattern and Test Configuration 18
8 Magnitude of Coupled Signal Versus Frequency for aDefect 10 Ft From the Signal Source 19
'; , . ' % % : ; 5

I - 7a - - , T
FIGURES (Cont'd)
Number Page
9 Magnitude of Coupled Signal Versus Frequency for aDefect 4 Ft From the Signal Source 19
10 Wavelength of Electromagnetic Waves in Lossy Media 23
11 Microwave Resonant Cavity Test Fixture 24
12 Alternate Resonant Cavity Design 24
13 Phase Delay of a Signal Propagating Through a Metal Slab,and Test Configuration Used 28
6

403MVIC040 N-TICR -~ K7 "- %WT kW W Ar W. 17. W
LABORATORY EVALUATION OF ELECTROMAGNETICPULSE (EMP) HARDNESS TESTING CONCEPTSFOR ELECTRICAL CONDUIT SYSTEMS
1 INTRODUCTION
Background
Metal conduits can provide significant electromagnetic pulse (EMP) pro-tection for electrical conductors (electrical power and signal cables). Theproper choice of components and correct assembly of the conduit systems usu-ally provide adequate shielding from EMP currents; however, defects, improperassembly, incorrect hardware, or serious defects in a welded system can seri-ously degrade such shielding. Thus, verification of the shielding integrityand location of defects in conduit systems are important considerations forfacility acceptance testing and hardness assessment.
The conduit systems of concern are essentially extensions of shieldedzones of fixed facilities. Thus, the conduit systems usually are external toshielded volumes. These conduits may be buried in the earth, routed throughunshielded structures, or installed above ground outside the structure. Ingeneral, access to the conduits is difficult, especially after construction iscompleted.
Long conductor runs are prime candidates for large induced EMP cur-rents. Such currents carried by conduits can be coupled to internal conduc-tors by diffusion through the conduit wall or by direct coupling through aper-tures in the conduit. Shielding from diffusion currents is mainly a functionof the conduit wall thickness, its electrical conductivity, and its magneticpermeability. Shielding from direct coupling is possible by avoiding anydeliberate or unintentional apertures or high-resistance joints in the conduitsystem.
Objective
The objective of this study was to identify and evaluate techniques forassessing the EMP hardness of electrical conduits used for EMP shielding.
Approach
Existing conduit test techniques were reviewed. Other pipe and cabletests were then examined to determine their usefulness as electrical conduittests. These test techniques involve measurements of physical phenomena,
which can be related to a conduit's shielding performance. Additional elec-tromagnetic phenomena were investigated for pssible development of new testtechniques. An earlier CERL technical report provided a database for com-paring these phenomena.
1P. Nielsen, EMP/EMI Hardening of Electrical Conduit Systems, TR M-292/ADA107133 (CERL, 1981).
7

7Ivvs 1 W -TT-. -. 7L. - a-I747-
2 REVIEW OF EXISTING TESTS
Test Concept
A conduit system's response to a conducted EMP can be analyzed with ref-erence to Figure 1. For a uniform defect-free conduit with a pulse excita-tion, most of the current, especially the high-frequency components, will flowon the outer surface of the conduit as a result of skin effect phenonema. Aportion of the current will, however, propagate through the metal and producean electromagnetic field inside the conduit. This is the diffusion currentwhich is attenuated exponentially with distance through the metal, with higherfrequencies subject to greater attenuation. Presence of a defect or resistivesection in the conduit will induce currents on internal conductors by mutualinductance (flux linkage) or by resistive voltage division between the conduitand internal conductor.
CONDUIT CURRENT
LEAKAGE CURRENT= . IL .M -L or Ri(,
DIFFUSION CURRENTId | r (CONDUIT )
DEFECT
DIFFUSIONCURRE T-
RUSTY THREADS PRODUCINGAN INTERNAL VOLTAGE [RitJ]
M-IAGNETIC FLUX LINES
LINKING INTERNAL CONDUCTOR
INTERNAL CONDUCTOR
Figure 1. EMP coupling through electrical conduit.
= :" r "' r 1Y . t: ... .... .,,. , ..8
WL~~~- -.F Or-..- W7WA RT I
Examples of possible conduit defects include: broken or misalignedunions, partial breaks, broken or loose couplings, conduit broken at threads,rusty threads, or a faulty weld on a welded conduit. Ideally, an EMP hardnessverification test should be able to locate any of these defects.
EMP hardness testing involves measuring some physical property of theconduit system and relating that property to the conduit's shielding integ-rity. For example, one possible test is a radiated threat level EMP. How-ever, if a radiated EMP is not part of the overall facility acceptance test,it will not be economically practical to do it to determine conduit systemhardness. Full-scale facility testing also has limited use in conduit defectlocation; the existence of a defect may be determined, but no means for Lo-cating the leak is inherent in the test.
The four existing methods reviewed were (1) air leak/pressurization, (2)pulsed transmission line, (3) pulsed dipole (PLACER, which actually stands forPulsed Loop Antenna Conduit Electromagnetic Radiator), and (4) visual inspec-tion. Of these tests, the PLACER was identified as an optimal technique forinvestigating the shielding integrity of buried conduits.
Air Leak/Pressurization Test
Buried conduits at the Safeguard Ballistic Missile Defense System wereexamined using air leak, pulsed transmission line, and pulsed dipole (PLACER)techniques. The air leak or pressurization test was used under the assumptionthat an EMP leak would coincide with an air leak in the conduit system. Thistest was useful to the extent that a leaking conduit could be identified in abank of conduits. Defect location was then completed by inspecting the insideof the conduit with closed circuit television. Television inspection is prac-tical, however, only if no wires have been pulled in the conduit. Moreover,the correlation between air leakage and EMP leakage is subject to debate: itis possible that not every EMP leak will be found this way and that some airleaks are not significant EMP leaks. However, if helium is used for pressuri-zation, the general area of the leak can be determined with sensitive heliumdetectors.
Pulsed Transmission Line Test2
In the pulsed transmission line test, a buried conduit is directlypulse-excited and a sensing wire inside the conduit is used to determine if aflaw exists. Tests with this system showed limited success because of thelossy nature of the soil in which the transmission line (conduit bank) wasburied. Thus, a drawback of this test is its dependence on electrical excita-tion of the conduit, making it unsuited to any evaluation of buried con-duits. Also, this test has no inherent mechanism to locate flaws. It onlyidentifies a defective conduit system.
2H. Roberts, et al., EMP Testing of Buried Conduits, The Pulsed Dipole and
Pulsed Transmission Line, AD-AO172991 (Department of the Army (DA], September1976).
9
'-K.'.~N ",% V % V.% N%%

. • , . , , . . .. , , • , . , . a%.. , -- . -
Pu ilsed I)pole Test
The pulsed dipole test (PLACER) 3 ,4 was much more ettective in tiaw Loca-tion. A pulse is radiated near the ground from a portable pulse generatorabove the conduit being tested. Again, a wire inside the conduit is used as asensing element to measure leakage. Correlation of the portable unit Locationwith signal magnitude provides a reasonably precise location of a flaw andindicates the defect's severity.
The PLACER was relatively successful for defect location in buried con-duit systems. It is recommended both for acceptance testing and hardnessmaintenance testing during the life of a hardened facility. The small dia-meter wire required for this test can be installed along with any power andsignal cables and then left in place for later testing. In general, thePLACER is not very useful for testing conduits inside structures such asbuildings and metal-lined tunnels.
*Visual Inspection
Although not actually classified as a test, an effective technique forlocating potential EMP leaks is thorough visual inspection of the conduit sys-tem by knowledgeable individuals. The major items to be noted in such an in-spection are that everything is properly assembled and tightened and that nobroken hardware is used. The hardware should be clean and rust-free, and anycondition that appears to interrupt the system's electrical continuity shouldbe corrected. A complete inspection may not be possible for all systemsbecause of conduit installation in banks or through areas of no access.
3D. L. Goodwin, The PLACER: Assembly and Operation, RDL-TM-77-7 (DA, April41977).F. V. Agee and H. A. Roberts, The Development of a Pulsed Loop Antenna Con-duit Electromagnetic Radiator (PLACER), HDL-TR 1850 (DA, September 1978).
10
In r -WWC 7% L K7
3 LABORATORY TESTS OF NEW CONCEPTS
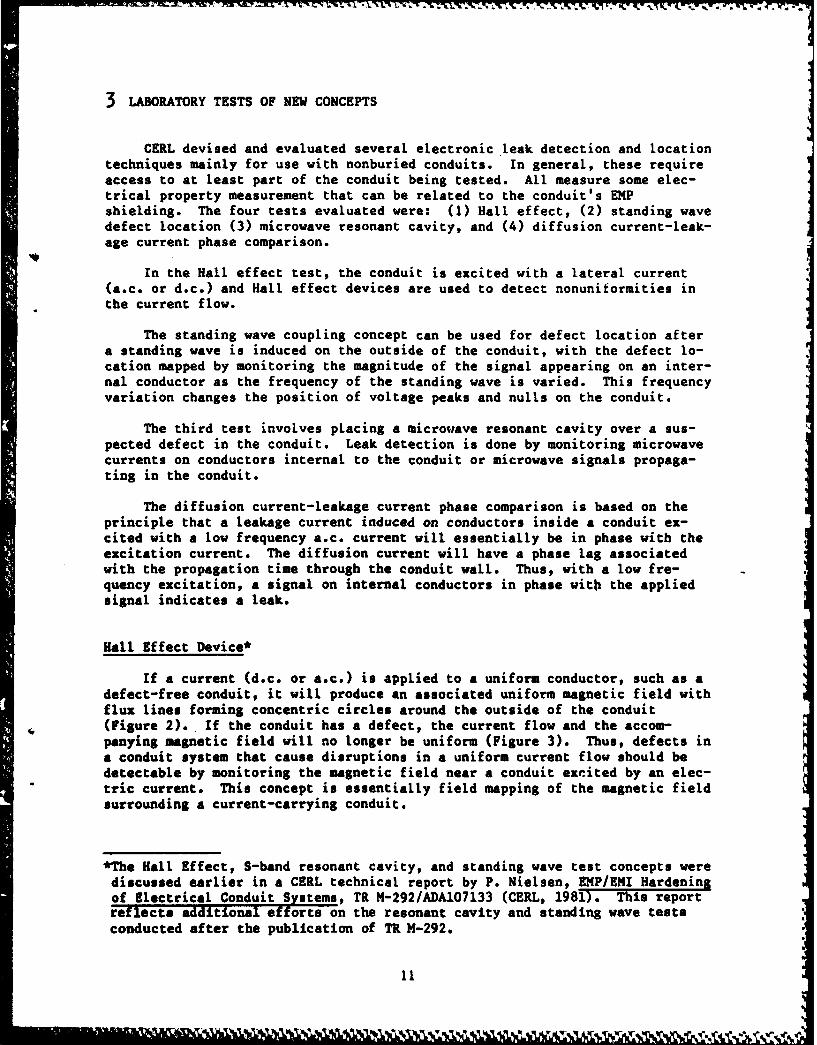
CERL devised and evaluated several electronic leak detection and locationtechniques mainly for use with nonburied conduits. In general, these requireaccess to at least part of the conduit being tested. All measure some elec-trical property measurement that can be related to the conduit's EMPshielding. The four tests evaluated were: (1) Hall effect, (2) standing wavedefect location (3) microwave resonant cavity, and (4) diffusion current-leak-age current phase comparison.
In the Hall effect test, the conduit is excited with a lateral current(a.c. or d.c.) and Hall effect devices are used to detect nonuniformities inthe current flow.
The standing wave coupling concept can be used for defect location aftera standing wave is induced on the outside of the conduit, with the defect lo-cation mapped by monitoring the magnitude of the signal appearing on an inter-nal conductor as the frequency of the standing wave is varied. This frequencyvariation changes the position of voltage peaks and nulls on the conduit.
The third test involves placing a microwave resonant cavity over a sus-pected defect in the conduit. Leak detection is done by monitoring microwavecurrents on conductors internal to the conduit or microwave signals propaga-ting in the conduit.
The diffusion current-leakage current phase comparison is based on theprinciple that a leakage current induced on conductors inside a conduit ex-cited with a low frequency a.c. current will essentially be in phase with theexcitation current. The diffusion current will have a phase lag associatedwith the propagation time through the conduit wall. Thus, with a low fre-quency excitation, a signal on internal conductors in phase with the appliedsignal indicates a leak.
Hall Effect Device*
If a current (d.c. or a.c.) is applied to a uniform conductor, such as adefect-free conduit, it will produce an associated uniform magnetic field withflux lines forming concentric circles around the outside of the conduit(Figure 2). If the conduit has a defect, the current flow and the accom-panying magnetic field will no longer be uniform (Figure 3). Thus, defects ina conduit system that cause disruptions in a uniform current flow should bedetectable by monitoring the magnetic field near a conduit excited by an elec-tric current. This concept is essentially field mapping of the magnetic fieldsurrounding a current-carrying conduit.
*The Hall Effect, S-band resonant cavity, and standing wave test concepts were
discussed earlier in a CERL technical report by P. Nielsen, EMP/EMI Hardeningof Electrical Conduit Systems, TR M-292/ADA107133 (CERL, 1981). This reportreflects additional efforts on the resonant cavity and standing wave testsconducted after the publication of TR M-292.
11

Figure 2. Magnetic field associated with a current flow.
CONDUIT 0F6WT
Figure 3. Current flow around a transverse defect.
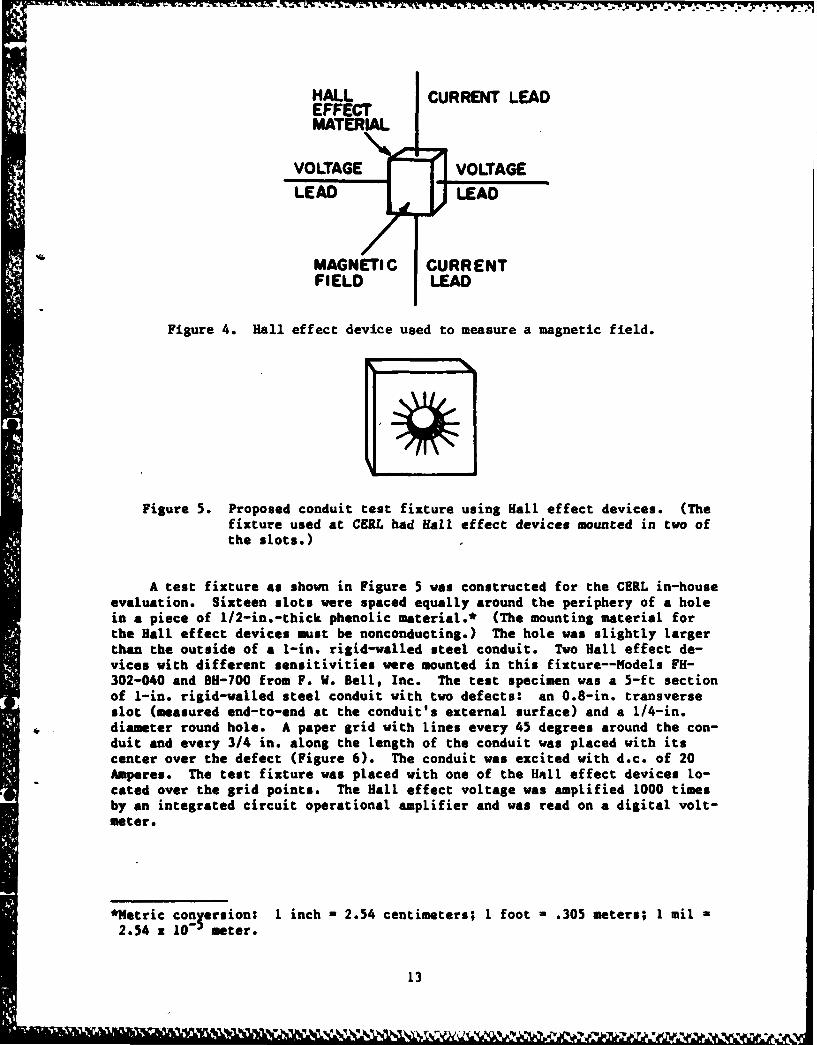
A Hall effect device is a special semiconductor sensitive to magneticfields. If a current flows through the device while the device is imersed ina magnetic field, a voltage proportional to that field will appear on the de-vice perpendicular to both the magnetic field and the direction of currentflow (Figure 4). Most practical Hall effect devices are flat plates with twocurrent leads and two voltage leads. The output voltage is a maximum when themagnetic field is perpendicular to the flat surface of the device. The exci-tation current and the magnetic field can be any combination of d.c. and a.c.
CERL conducted a test to determine the technical feasibility of thisconcept. A proposed fully implemented system would consist of a test fixturecomposed of several Hall effect devices placed around and perpendicular to aconduit carrying a current (Figure 5). Associated amplification and moni-toring electronics would record the measurements. The test fixture is de-signed to move along the long dimension of the conduit. Readout electronicswould consist of a multiplexed system in conjunction with a microprocessor tostore and analyze the data.
12
HALL CURRENT LEADEFFECTMATERIAL
VOLTAGE'% LA VOLTAGE
M AG NLETrI C CURR ENTFIELD 7LEAD
Figure 4. Hall effect device used to measure a magnetic field.
Figure 5. Proposed conduit test fixture using Hall effect devices. (Thefixture used at CERL had Hall effect devices mounted in two ofthe slots.)
A test fixture as shown in Figure 5 was constructed for the CERL in-houseevaluation. Sixteen slots were spaced equally around the periphery of a holein a piece of l/2-in.-thick phenolic material.* (The mounting material forthe Hall effect devices must be nonconducting.) The hole was slightly largerthan the outside of a 1-in. rigid-walled steel conduit. Two Hall effect de-vices with different sensitivities were mounted in this fixture--Models FH-302-040 and BH-700 from F. W. Bell, Inc. The test specimen was a 5-ft sectionof 1-in. rigid-walled steel conduit with two defects: an 0.8-in. transverseslot (measured end-to-end at the conduit's external surface) and a 1/4-in.diameter round hole. A paper grid with lines every 45 degrees around the con-duit and every 3/4 in. along the length of the conduit was placed with itscenter over the defect (Figure 6). The conduit was excited with d.c. of 20Amperes. The test fixture was placed with one of the Haill effect devices lo-cated over the grid points. The Hall effect voltage was amplified 1000 timesby an integrated circuit operational amplifier and was read on a digital volt-meter.
*Metric conIersion: I inch - 2.54 centimeters; 1 foot - .305 meters; 1 mil -
2.54 x 10- meter.
13

DEFECT
-~ 4905+4 Y t/'
0 1 1 CONDUIT-450
-4 -3 -2 -I 0 I 2 3 4
Figure 6. Grid for data points measuring magnetic field distortion by aconduit defect.
The results of these tests are given in Tables 1 through 4. Tables 2 and4 show the same data normalized to the lowest reading for easier determinationof relative magnetic field strength. During preliminary tests, considerablevariation in the device output was noted. It was determined that much of thisvariation was related to the nearness of the conduit to the Hall effect deviceand also to the magnitude of the current applied to the device. This varia-tion in output was concluded to be a function of the degree of heat sinkingprovided for the Hall effect device by the conduit. This phenomenon was aproblem only with the BH-700 for which a Hall effect current of 200 mA wasused versus 15 mA for the FH-302-040. The problem was reduced considerably bytaking a reading of the Hall effect voltage with no current applied to theconduit, immediately followed by a reading with 20 A flowing in the conduit.The Hall effect voltage due to the magnetic field is the difference betweenthe two readings.
The data indicate that the particular defects tested produced measurablemagnetic field variations; however, unless adequate precautions are taken,this variation can be masked by unrelated factors. For example, the Halleffect devices are very temperature-sensitive and for the BH-700, a veryslight change in distance from the conduit can cause a significant change inthe Hall effect voltage not related to any magnetic field variation, but tothe conduit's heat-sinking effects. Field use of this concept would need toinclude techniques to eliminate temperature-related offset or d.c. drift prob-lems.
Standing Wave Coupling
If a transmission line terminates in an impedance different from thecharacteristic impedance of that line, standing waves will occur on theline. The location of the peaks and nodes of these standing waves is a func-tion of the excitation frequency and can be accurately determined theoreti-cally. Such a transmission line could consist of a pair of conduits with oneend short-circuited on a shielded structure. In this study, an a.c. signalwas injected onto such a system.
14
'V - sIM'
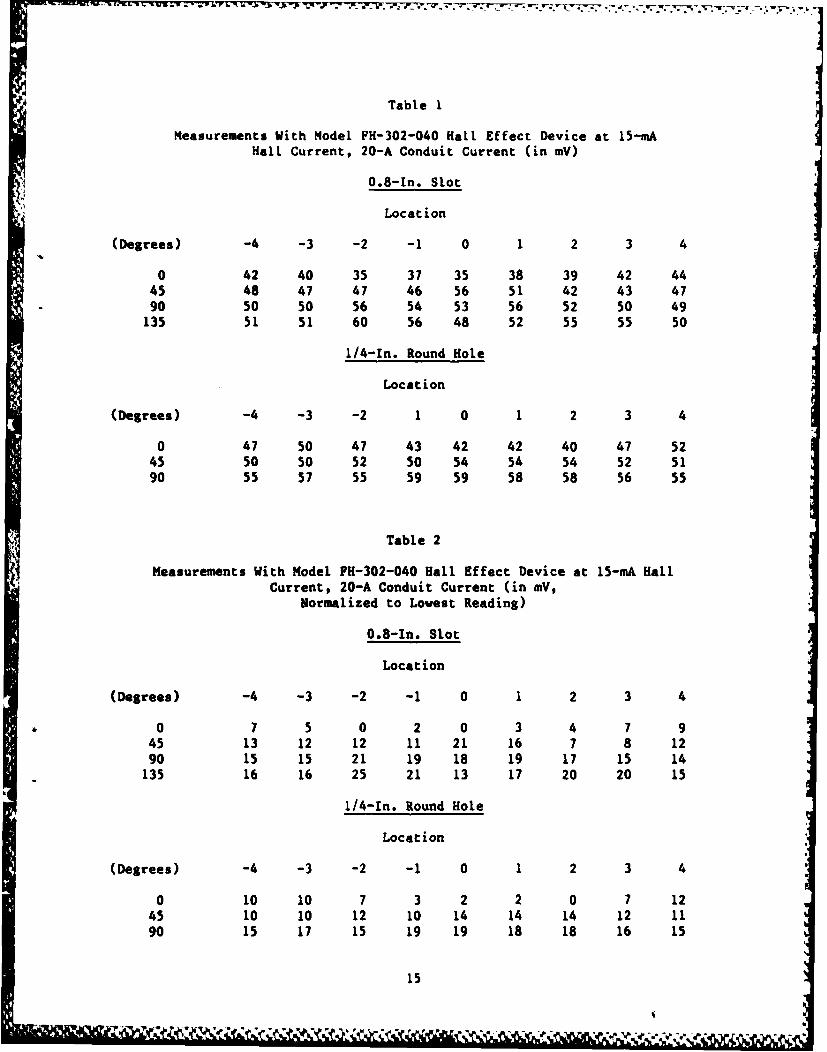
Table I
Measurements With Model FH-302-040 Hall Effect Device at 15-mAHall Current, 20-A Conduit Current (in mY)
0.8-In. Slot
Location
(Degrees) -4 -3 -2 -1 0 1 2 3 4
0 42 40 35 37 35 38 39 42 4445 48 47 47 46 56 51 42 43 4790 50 50 56 54 53 56 52 50 49135 51 51 60 56 48 52 55 55 50
1/4-In. Round Hole
Location
(Degrees) -4 -3 -2 1 0 1 2 3 4
0 47 50 47 43 42 42 40 47 5245 50 50 52 50 54 54 54 52 5190 55 57 55 59 59 58 58 56 55
Table 2
Measurements With Model FH-302-040 Hall Effect Device at 15-mA HallCurrent, 20-A Conduit Current (in mY,
Normalized to Lowest Reading)
0.8-In. Slot
Location
(Degrees) -4 -3 -2 -1 0 1 2 3 4
0 7 5 0 2 0 3 4 7 945 13 12 12 11 21 16 7 8 1290 15 15 21 19 18 19 17 15 14135 16 16 25 21 13 17 20 20 15
1/4-In. Round Hole
Location
(Degrees) -4 -3 -2 -1 0 1 2 3 4
0 10 10 7 3 2 2 0 7 1245 10 10 12 10 14 14 14 12 1190 15 17 15 19 19 18 18 16 15
15
- -S

TabLe 3
Measurements With Model BH-700 Hall Effect Device, 200-mA HallCurrent, 20-A Conduit Current (in mV)
0.8-In. Slot
Location(Degrees) -4 -3 -2 -1 0 1 2 3 4
0 135.5 137.0 131.3 134.0 107.3 139.2 136.9 139.2 136.645 132.4 136.9 131.7 142.0 145.4 143.0 126.0 125.9 135.090 137.9 139.8 142.8 133.8 139.8 153.1 139.5 128.6 140.4
1/4-In. Round Hole
Location(Degrees) -4 -3 -2 -1 0 1 2 3 4
0 138.9 139.0 137.4 132.7 138.8 138.5 135.0 137.6 136.045 139.0 139.0 138.5 136.5 139.0 134.0 139.0 137.9 136.5
No Defect
Location(Degrees) -4 -3 -2 -1 0 1 2 3 4
180 138.5 137.0 135.2 137.3 139.0 136.4 138.5 133.3 149.0225 144.2 134.2 135.6 139.6 132.8 140.5 140.4 130.4 132.4
Table 4
Measurements With Model BH-700 Hall Effect Device at 200-mA Hall Current,20-A Conduit Current (in mV, Normalized to Lowest Reading)
0.8-In. Slot
Location(Degrees) -4 -3 -2 -1 0 1 2 3 4
0 28.2 29.7 00 26.7 0 31.9 29.6 31.9 29.345 25.1 29.6 24.4 35.6 38.1 35.7 18.7 18.6 27.790 30.6 32.5 35.5 26.5 32.5 45.8 32.2 19.3 33.1
1/4-In. Round Hole
Location(Degrees) -4 -3 -2 -1 0 1 2 3 4
0 6.2 6.3 4.7 0 6.1 5.8 2.3 4.9 3.345 6.3 6.3 5.8 3.8 6.3 1.3 6.3 5.2 3.8
No Defect
Location(Degrees) -4 -3 -2 -1 0 1 2 3 4
180 8.1 6.6 4.8 6.9 8.6 6.0 8.1 2.9 18.6225 13.8 3.8 5.2 9.2 2.4 10.1 10 0 2
16
*% *v q V -~ ~I

If a conduit has a defect, energy will couple to conductors internal tothe conduit. If the frequency of a continuous wave (CW) signal applied to a
conduit is varied, with the maximum signal level kept constant, the signallevel on a conductor internal to a defective conduit will vary, depending onthe magnitude of the standing wave at the point of the defect. Defects can belocated by comparing the theoretical location of standing wave peaks and nullsapplied to the conduit's outside surface with the signal level on a conductorinside that conduit.
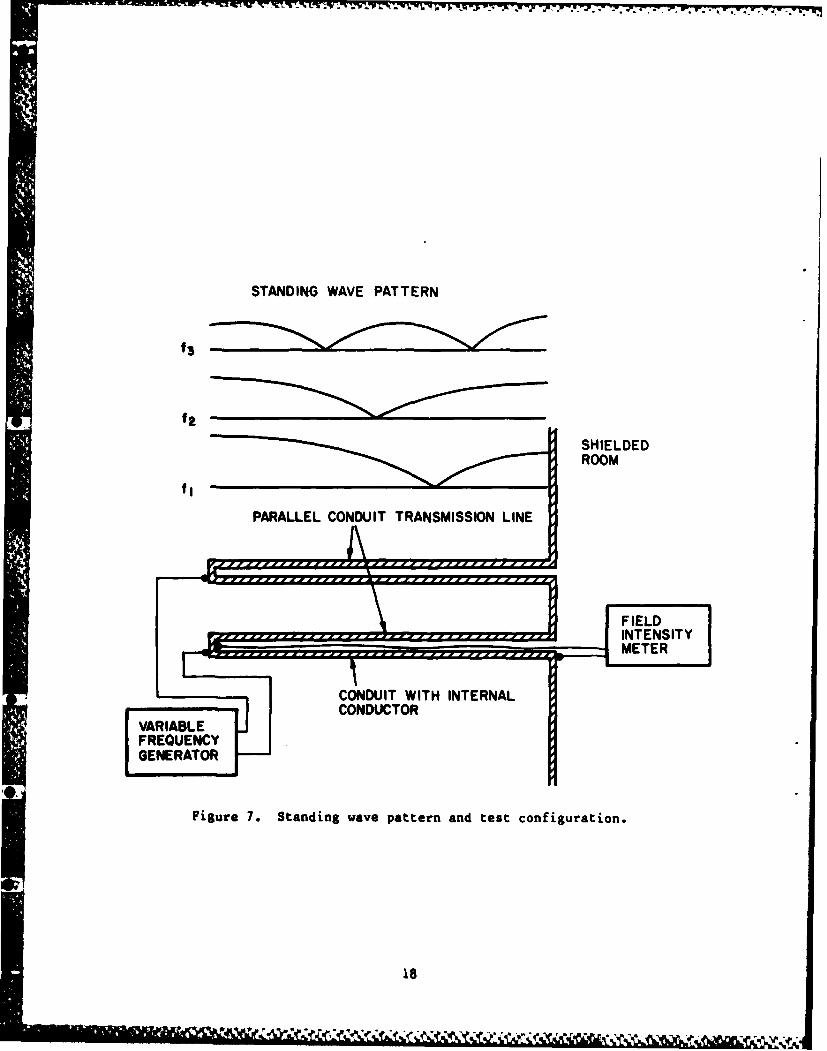
CERL conducted an experiment with a parallel conduit transmission lineconsisting of two 1/2-in. electrometallic-tubing (EMT) conduits (outside dia-meter - 0.706 in.) 20 ft long, spaced 2 in. apart. The charactl5 istic impe-dance of this transmission line using the formula Z = 120 in -, where D isthe center-to-center spacing of the conductors and 2 is the conauctordiameter, is approximately 200 ohms. The 20-ft length was obtained by usingtwo standard 10-ft sections of conduit connected by a standard ENT coupling(Figure 7). The conduits were shorted together at the shielded room end. A12-gage copper wire was connected to the inside of one of the conduit's end-caps, brought into the shielded room, and connected to the room's inner sur-face. Existence of the standing wave pattern on the conduit transmission linewas verified by monitoring the output of a current probe moved along one ofthe conduits. The output of the current probe was plotted as a function oflocation and frequency, as shown in Figure 7.
A defect on the test conduit allows a signal to couple to an internalconductor. The magnitude of this signal will vary with excitation frequency,since excitation frequency determines the magnitude of the standing wave atthe point of the defect. Thus, a plot of the magnitude of the signal ap-pearing on the internal conductor versus frequency can be compared with thepredicted location of the peak and minimums of the standing waves on the con-duit transmission line to determine the location of defects in the conduit.
Two laboratory tests of this concept were conducted: one with a slot cuthalfway through a coupling (placing the defect 10 ft from the signal source)and a second with a slot cut halfway through the conduit 4 ft from the signalsource. The following equipment was used: an HP 8601' signal generator, anENI Model 310L RF power amplifier, a Stoddard 91550 current probe, a Tektronix454 oscilloscope, and an EMC 25 MKIIt field intensity meter serving as volt-meter. The current probe was placed on a conduit at the end, where it wasconnected to the shielded room (the shorted end of the conduit transmissionline). Its output was monitored on the oscilloscope and was kept constant byvarying the output amplitude of the signal generator as the frequency wasvaried. It was necessary to do this since the impedances of the signal sourceand the transmission line cannot in general be matched. Since this end wasshorted, a current maximum would always occur Lhere. The results of thesetests are plotted on Figures 8 and 9. The location of the defects can be de-termined by comparing these plots with the location of the standing wavesshown in Figure 7 or more readily by calculation as described below. The plotin Figure 9 shows the defect at 4 ft from the signal source and a secondsmaller leak 10 ft from the signal source. This is the EMT coupling, which isknown to be somewhat leaky. Thus, this technique appears able to resolve mul-tiple defects.
17
% •
STANDING WAVE PATTERN
f13
SHIELDEDROOM
INENSITYmom---4METEJ
CONDUIT WITH INTERNALCONDUCTOR
VARIABLEFREQUENCYGENERATOR
Figure 7. Standing wave pattern and teat configuration.
18

70.
80o 0
500
40 0
6 0-
0 0.
.600*
70 0
50 0
500
40-
2 30 40 50 60 70 60 90 100Ft~quncy, mM:
Figure 8. Magnitude of coupled signal versus frequency for a defect 4f1tfrom the signal source.
90 19
millm

Calculation of Defect Localtiona
Defect location can be calculated in the following way:
1. Apply a CI signal to the conduit transmission line. The lowest use-ful frequency will be where the length of the transmission line is 1/4 wave-length. The wavelength on a transmission line is essentially the same as awave propagating in the media in which the transmission line is located. Thusfor conduit in air where L = length of conduit under test and f, (MHz) = thelowest useful frequency:
300f, = -0-MHz
1 4L
2. Monitor and record voltage readings versus frequency on a conductorinternal to the conduit being tested. (Keep peak standing wave values on theconduit transmission line constant as frequency is changed.)
3. Significant voltage variations as the applied frequency is varied in-dicate defects.
4. Note the frequency at which voltage minimums occur on the internalconductor as the applied frequency is varied. (These minimums result when thenodes of the standing wave coincide with the location of a defect.)
5. Take the frequency (f ) at lowest frequency minimum noted to deter-mine d, the distance of the defect from the shorted end of the conduit trans-mission line.
d 300d2 4f- 2
where f2 is in MHz.
Ambiguities may exist at multiples of f2 in that the minimums seen therecan result from a defect associated at d2 or at locations d3 , d4, etc. where
d = 300 d 3003 4(2 ' d4 --(32)"
Existence of minimums at frequencies other than integral multiples of findicate additional flaws, the location of which are determined as in step 5;that is:
d= 300x 4f
x
m ranamision Linea in LoI Media
The practicality of applying the standing wave concept to buried conduitsshould be examined. Typical conductivities for earth materials are given i9Table 5. 7Typical conductivities for metals range from approximately 1 x I0to 6 x 1? mho/m, and conductivities of good insulators are typically lessthan 10" mho/m. Thus, earth materials are somewhere between good conductorsand nonconductors, with soils tending toward the conductor spectrum.
20
.. *n .... "- - - *

Table 5
Conductivities (a) of Earth Materials at NormalTemperatures and Pressures*
Material Approximate (a) (mho/m)
Soils (e = 10)Good 10- to 10- 1
Average 10- 3 to 10-2
Poor 10-4 to 10- 3
Water (e = 81)Sear 4 to 5Fresh 10- to 10
Snow (drifted, wet)** 10-6 to 10- 4
Ice (glacial) 10- 6 to 10 4
Permafrost 10- 5 to 10- 4
Marine sands and shales 10-1 to 1Marine sandstones 10-2 to 1Clay 10-2 to 10-1
Sandstone (wet) 10-9 to 10- 2
Granite*** 10 9 to 10- 3
*Kraichman, M. B., Handbook of Electromagnetic Propagation in Conducting
Media, AVMATP-2302 (U.S. Government Printing Office, 1970).**Very dependent on temperature, frequency, and impurities.
***Very dependent on water content.
The skin depth in a media is a measure of the attenuation of a signalpropagating into a conductor and can be useful as a tool to examine propaga-tion characteristics of a transmissign line in a conducting media. The gen-eral expression for skin depth 6 is:
61 1
a21+ __2 _
where w is the radian frequency (2wf), p is the magnetic permeability, c isthe dielectric constant, a is the electrical conductivity, and a is the prop-agation constant (attenuation factor). The phase velocity (0) is:
(1 2
Z. C. Jordan and K. G. Balmain, Electromagnetic Waves and Radiating Systems,
Second Ed. (Prentice Hall, 1968), pp 126 and 130.
21

1. " V V- ' 1.17 T.,'. 'I
and the wavelength X is:
X= 2wr/0
For free space, the wavelength is:
X = c/f
where c = the speed of light = 3 x 1O8 m/s and f is the frequency in Hz.
Figure 10 is a plot of the theoretically determined wavelength of elec-tromagnetic waves in media with conductivities in the range of earth materialsas listed in Table 5. This plot shows that, up to relatively low conductivi-ties, the wavelength is very dependent on conductivity. This adds a variable,since the wavelength in the media determines where the peaks and nulls ofstanding waves on transmission lines in that media will exist. Of moreconcern is the wave's attenuation, since, for a standing wave to exist on atransmission line, the magnitude of a reflected wave must be great enough toadequately reinforce or cancel the incident wave. A practical limit probablyoccurs when the wavelength is on the order of one skin depth. Table 6 liststhe skin depth at several different conductivities and also the wavelength inthe media (Figure 10). from the listed values, it appears that for typicalsoil conductivities (10-1 to 10- mho/m), the skin depth is considerably lessthan a wavelength. Usable standing waves would not exist on transmissionlines buried in materials of these conductivities.
No specific tests were conducted to determine the standing wave concept'smaximum sensitivity. However, use of continuous wave signals with narrow bandtuned equipment should extend the dynamic measurement range beyond that pos-sible from pulse measurement techniques.
Microwave Resonant Cavity
Microwave energy readily penetrates defects in electromagnetic shields.Thus, microwave illumination of electrical conduits used as shields may beuseful for evaluating the conduits' EMP hardness. The standard microwaveshielding test, which consists of using radiated power from a horn antenna,has the disadvantages of high ambient fields necessary for an adequate dynamicmeasurement range and of relatively inefficient power use. A resonant cavity,however, can have large fields contained within a relatively small, controlledvolume (Figure 11). The fixture can be designed to open and "clip" onto aconduit at the location of a suspected defect. Leakage can be detected eitherby using an antenna probe placed within the conduit or by monitoring the sig-nal induced on the coaxial system formed by a conductor inside the conduit.An alternate resonant cavity concept (Figure 12) uses a resonant cavity thatinstead of clipping onto the conduit, is placed next to the conduit, elimina-ting the need for different sized cavities for various conduit sizes andreducing the accessibility problem that exists with a large clip-aroundcavity.
22

1300
ID I j j I Ivww k will| I I j Killww i a all I • illi
FREOUNCY (IH)
Figure 10. Wavelength of electromagnetic waves in lossy media.
Table 6
Skin Depth (6) in Earth Materials of Various Conductivities (in meters)
E r = 10
Frequency
a (mho/m) 10 kHz 100 mi2s 1 mHz 10 mHz
0- 1 2 16 5.2 1.6 .535 z10- 71 323 3 7.7 3.65 o18- 3.6 10 3.4 z 10
10 1.7 x 10⁷
Wavelength (in m)
Frequency
a (ho/m) 10 kifz 100 kilz 1 mHz 10 mHz
10- 1 100 32 10 3.15 x 10 6 447 3140 2 42.3 8.75 "x 1 8.7 z 10 9.5 x 10² 95 9.5109.5 z 13 9.5 1 3 95 9.5
Free space 3 x 10 3 x 10 3 x10² 30
23
: -- ' 'I' 'I' P ' , ... .. I.'.. . --r . : : , , , . . .

CAVITY
ELECTRIC FIELD
MAGNETIC oFIELD
CONDUIT/
TMo, 0 0 MODE
Figure 11. Microwave resonant cavity test fixture.
i KXCITATION
b L
OUARTER ROUND MICROWAVERESONANT CAVITY
Figure 12. Alternate resonant cavity design.
24
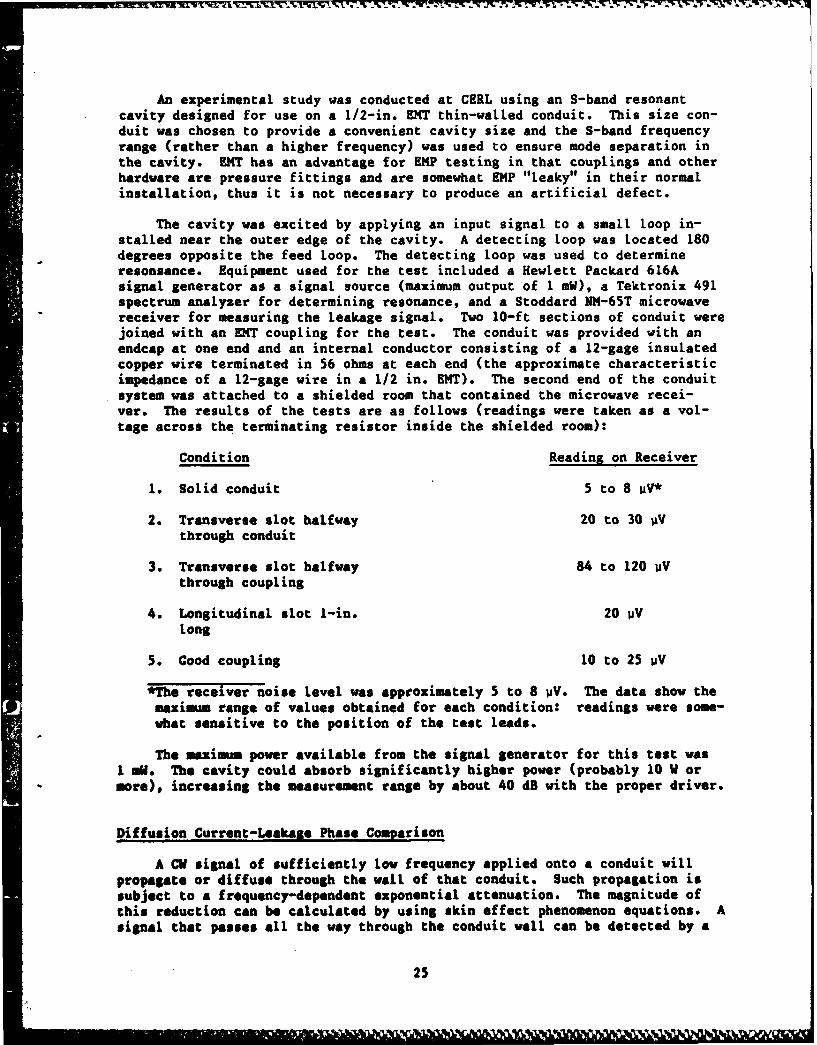
An experimental study was conducted at CERL using an S-band resonantcavity designed for use on a 1/2-in. EMT thin-walled conduit. This size con-duit was chosen to provide a convenient cavity size and the S-band frequencyrange (rather than a higher frequency) was used to ensure mode separation inthe cavity. EMT has an advantage for EMP testing in that couplings and otherhardware are pressure fittings and are somewhat EMP "leaky" in their normalinstallation, thus it is not necessary to produce an artificial defect.
The cavity was excited by applying an input signal to a small loop in-stalled near the outer edge of the cavity. A detecting loop was located 180degrees opposite the feed loop. The detecting loop was used to determineresonsance. Equipment used for the test included a Hewlett Packard 616Asignal generator as a signal source (maximum output of 1 mW), a Tektronix 491spectrum analyzer for determining resonance, and a Stoddard NM-65T microwavereceiver for measuring the leakage signal. Two 10-ft sections of conduit werejoined with an ENT coupling for the test. The conduit was provided with anendcap at one end and an internal conductor consisting of a 12-gage insulatedcopper wire terminated in 56 ohms at each end (the approximate characteristicimpedance of a 12-gage wire in a 1/2 in. EMT). The second end of the conduitsystem was attached to a shielded room that contained the microwave recei-ver. The results of the tests are as follows (readings were taken as a vol-tage across the terminating resistor inside the shielded room):
Condition Reading on Receiver
1. Solid conduit 5 to 8 V*
2. Transverse slot halfway 20 to 30 OVthrough conduit
3. Transverse slot halfway 84 to 120 PVthrough coupling
4. Longitudinal slot I-in. 20 pVlong
5. Cood coupling 10 to 25 PV
*The receiver noise level was approximately 5 to 8 UV. The data show the
maximum range of values obtained for each condition: readings were som-what sensitive to the position of the test leads.
The maximum power available from the signal generator for this test wasI WW. The cavity could absorb significantly higher power (probably 10 W ormore), increasing the measurement range by about 40 dB with the proper driver.
Diffusion Current-Leakage Phase Comparison
A CU signal of sufficiently low frequency applied onto a conduit willpropagate or diffuse through the wall of that conduit. Such propagation issubject to a frequency-dependent exponential attenuation. The magnitude ofthis reduction can be calculated by using skin effect phenomenon equations. Asignal that passes all the way through the conduit wall can be detected by a
25

conductor inside the conduit. The phase relationship between the applied sig-nal and the internal signal is fixed by the applied frequency, the conduit'swall thickness, and the conduit material's electromagnetic properties. Aleakage signal (leakage depends on flux linkage), appearing on a conductor in-side the conduit will be in phase with the applied signal. The signal passingthrough the conduit wall will be different in phase from the applied signalexcept when the propagation distance through the conduit wall is an integralnumber of wavelengths. The frequency of the applied signal can be chosen sothe wavelength in the metal is not an integral wavelength. Then an in phasesignal appearing inside the conduit indicates lekage.
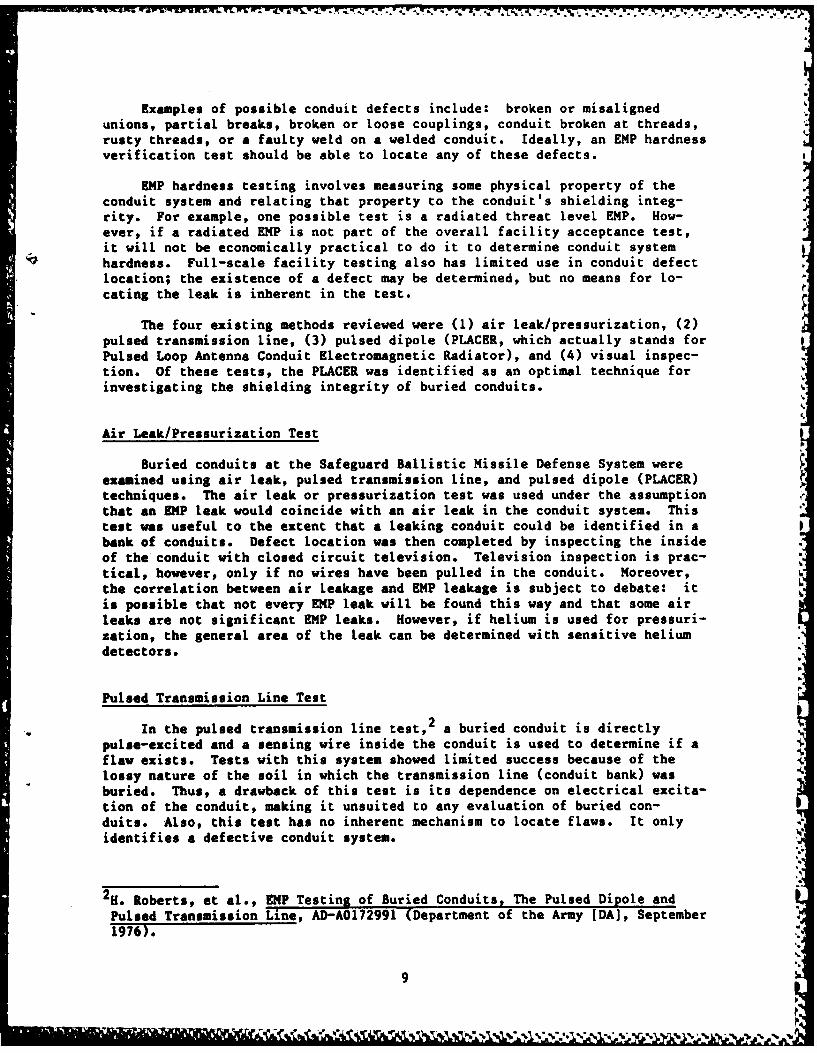
With reference to Figure 13, imagine a metal one wavelength thick (Figure13a). The phase lag of the wave appearing on the bottom of the slab or insidea conduit) in relation to the wave at the upper surface is -360 degrees. InFigure 13b, the phase lag is 4 degrees through a thickness (t) of metal.Thus,
, t360
or= 360t iof)1 /2 in degrees
where A = 2w6 is the wavelength in the metal; 6 is the skin depth, U is themagnetic permeability, a is the electrical conductivity of the conduit metal,and f is the frequency in Hz.
An experiment was conducted to determine the usable frequency range forphase comparison between an externally applied signal and a diffusion currentsignal inside a I-in. rigid-walled steel conduit and a 1-in. rigid-walledaluminum conduit. The test configuration was as shown in Figure 13 in which aconduit is attached to a shielded room. The opposite end was terminated witha steel endcap for the steel conduit and a brass endcap for the aluminum con-duit. A wire internal to the conduit was attached inside the endcap. Theother end of this wire was attached to the inside wall of the shielded room.The conduit was externally excited by a signal generator. The phases of theexcitation signal and the diffusion signal were compared using the phase read-out of a Hewlett Packard Model 3575A gainphase meter using inductively coupledcurrent probes as sensors. Test results are listed in Tables 7 and 8.
From these data, it appeari that one wavelength is about 800 Hz in con-duit steel and above 20,000 Hz for aluminum. The diffusion current magnitudeis considerably reduced at one wavelength in the metal and is quickly reducedto a value too low to measure. Thus if a phase comparison is desired, the ap-plied test frequency should be such that the distance through the metal (t) isless than one wavelength.
Little information is available on the magnetic and electric propertiesof conduit metals, but it is not likely these properties are very uniform.The maximum usable frequency for different sized conduits can be estimatedusing the permeability-conductivity factor (va), which is found by solving theprevious equation for a:
UO= 4 2
360 ft2
26
oi, 'J, Q1 4
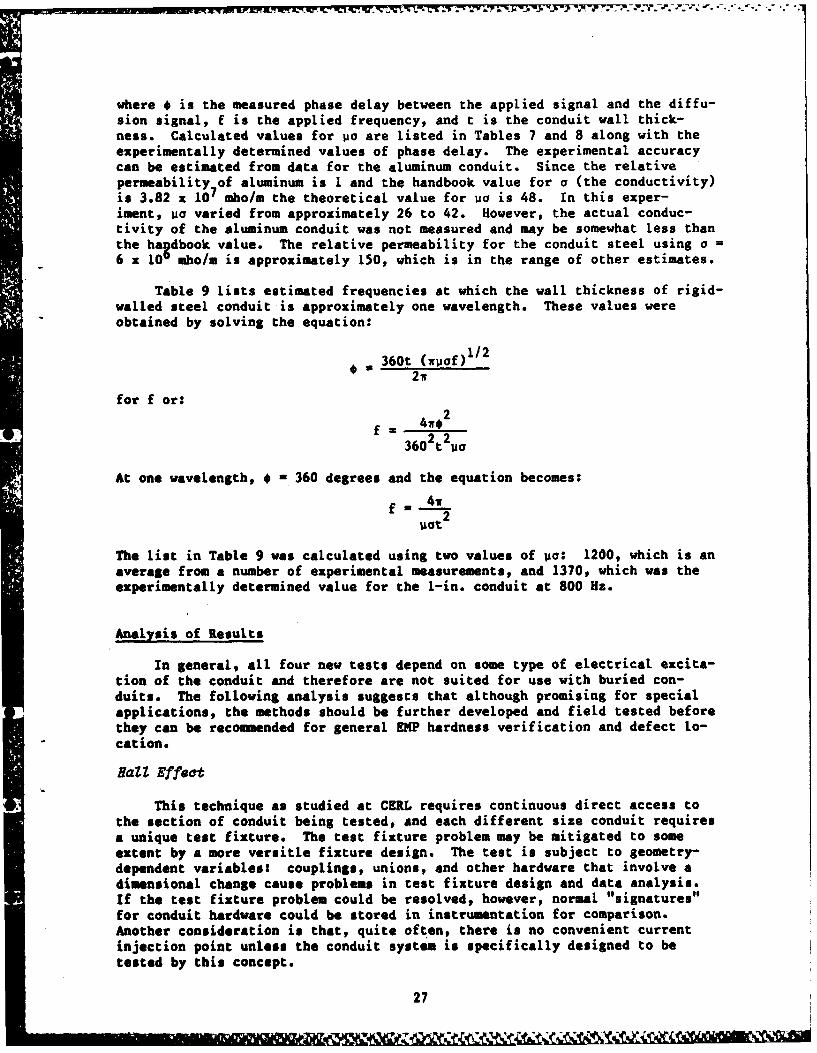
where * is the measured phase delay between the applied signal and the diffu-sion signal, f is the applied frequency, and t is the conduit wall thick-ness. Calculated values for uo are listed in Tables 7 and 8 along with theexperimentally determined values of phase delay. The experimental accuracycan be estimated from data for the aluminum conduit. Since the relativepermeability of aluminum is 1 and the handbook value for a (the conductivity)is 3.82 x 10 mho/m the theoretical value for uo is 48. In this exper-iment, ua varied from approximately 26 to 42. However, the actual conduc-tivity of the aluminum conduit was not measured and may be somewhat less thanthe hagdbook value. The relative permeability for the conduit steel using a =
6 x 10 mho/m is approximately 150, which is in the range of other estimates.
Table 9 lists estimated frequencies at which the wall thickness of rigid-walled steel conduit is approximately one wavelength. These values wereobtained by solving the equation.
360t (wuorf)/ 2
2w
for f or:
f = 4w.2
360 2t2UO
At one wavelength, * 360 degrees and the equation becomes:
f . 4w
The list in Table 9 was calculated using two values of Vo: 1200, which is anaverage from a number of experimental measurements, and 1370, which was theexperimentally determined value for the 1-in. conduit at 800 Hz.
Analysis of Results
In general, all four new tests depend on some type of electrical excita-tion of the conduit and therefore are not suited for use with buried con-duits. The following analysis suggests that although promising for specialapplications, the methods should be further developed and field tested beforethey can be recommended for general EMP hardness verification and defect lo-cation.
HaZ Effect
This technique as studied at CERL requires continuous direct access tothe section of conduit being tested, and each different size conduit requiresa unique test fixture. The test fixture problem may be mitigated to someextent by a more versitle fixture design. The test is subject to geometry-dependent variables: couplings, unions, and other hardware that involve adimensional change cause problems in test fixture design and data analysis.If the test fixture problem could be resolved, however, normal "signatures"for conduit hardware could be stared in instrumentation for comparison.Another consideration is that, quite often, there is no convenient currentinjection point unless the conduit system is specifically designed to betested by this concept.
27

tic
4
00a-
0
-440 C
0
00
CO4.
0
c4
280
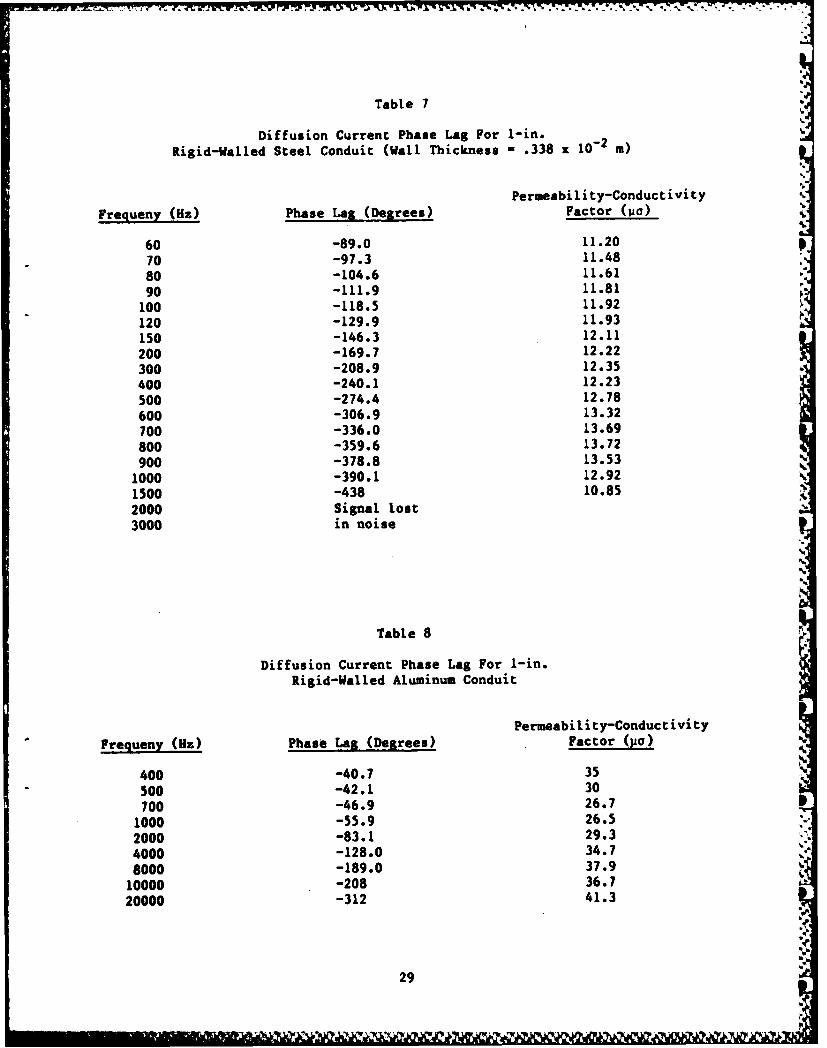
Table 7
Diffusion Current Phase Lag For 1-in.
Rigid-Walled Steel Conduit (Wall Thickness - .338 x 10- 2 M)
Permeability-Conductivity
Frequeny (Hz) Phase Lag (Degrees) Factor (uo)
60 -89.0 11.20
70 -97.3 11.48
80 -104.6 11.61
90 -111.9 11.81
100 -118.5 11.92
120 -129.9 11.93
150 -146.3 12.11
200 -169.7 12.22
300 -208.9 12.35
400 -240.1 12.23
500 -274.4 12.78
600 -306.9 13.32
700 -336.0 13.69
800 -359.6 13.72
900 -378.8 13.53
1000 -390.1 12.92
1500 -438 10.85
2000 Signal lost
3000 in noise
Table 8
Diffusion Current Phase Lag For I-in.Rigid-Walled Aluminum Conduit
Permeability-Conductivity
Frequeny (Hz) Phase Lag (Degrees) Factor (po)
400 -40.7 35
500 -42.1 30
700 -46.9 26.7
1000 -55.9 26.5
2000 -83.1 29.3
4000 -128.0 34.7
8000 -189.0 37.9
10000 -208 36.7
20000 -312 41.3
29
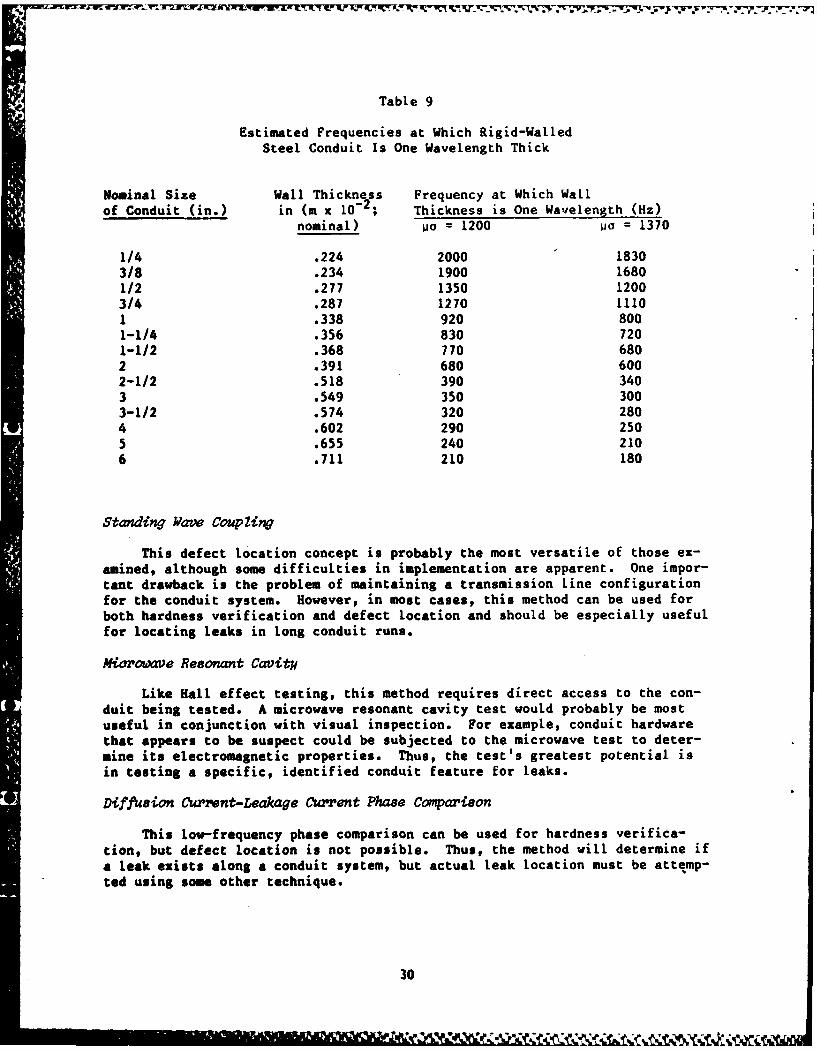
Table 9
Estimated Frequencies at Which Rigid-WalledSteel Conduit Is One Wavelength Thick
Nominal Size Wall Thickness Frequency at Which Wallof Conduit (in.) in (m x 10-2; Thickness is One Wavelength (Hz)
nominal) uo = 1200 a= 1370
1/4 .224 2000 - 18303/8 .234 1900 16801/2 .277 1350 12003/4 .287 1270 11101 .338 920 8001-1/4 .356 830 7201-1/2 .368 770 6802 .391 680 6002-1/2 .518 390 3403 .549 350 3003-1/2 .574 320 2804 .602 290 2505 .655 240 2106 .711 210 180
Standing Wave CouplZing
This defect location concept is probably the most versatile of those ex-amined, although some difficulties in implementation are apparent. One impor-tant drawback is the problem of maintaining a transmission line configurationfor the conduit system. However, in most cases, this method can be used forboth hardness verification and defect location and should be especially usefulfor locating leaks in long conduit runs.
Miovovave Resonant Cavityf
Like Hall effect testing, this method requires direct access to the con-
duit being tested. A microwave resonant cavity test would probably be mostuseful in conjunction with visual inspection. For example, conduit hardwarethat appears to be suspect could be subjected to the microwave test to deter-mine its electromagnetic properties. Thus, the test's greatest potential isin testing a specific, identified conduit feature for leaks.
DiffAsion Current-Leakage Current Phase Comparison
This low-frequency phase comparison can be used for hardness verifica-tion, but defect location is not possible. Thus, the method will determine ifa leak exists along a conduit system, but actual leak location must be attemp-ted using some other technique.
30

Field Use of New Methods
Although not addressed in this study, actual conduit configurations atexisting structures are likely to present problems in using these methods.For example, use of over-the-conduit test fixtures may be impeded by conduitdesign or conduit supports; or, conducting materials may make a transmissionline excitation impossible. If it is known that a particular test will beused, it should be possible to design the conduit system to facilitate use ofthat test.
3
1 31
bS,h
AmV

4yW
4 CONCLUSIONS AND RECOMMENDATIONS
Four concepts have been investigated for usefulness in determining theEMP shielding integrity of electrical conduits. These methods also were com-pared with existing tests. The new methods may have some use in testing aconduit's shielding integrity; however, because of constraints associated with
6their physical implementation, none appear to have universal use. Thus, whenconsidering these methods for use, the limitations of each should be notedcarefully.
Conduit systems for new structures can be designed for EMP hardnesstesting by a specific method. For most current uses, however, the test con-cepts studied here must receive further development and field testing beforethey can be recommended.
REFERENCES
Agee, F. V., and H. A. Roberts, The Development of a Pulsed Loop AntennaConduit Electromagnetic Radiator (PLACER) - HDL-TR 1850 (Department of theArmy (DA], September 1978).
Coodwin, D. L., The PLACER: Assembly and Operation, HDL-TM-77-7 (DA, April1977).
Jordan, B., Electromagnetic Waves and Radiating Systems, Second Ed. (PrenticeHall, 1968).
Kraichman, M. B., Handbook of Electromagnetic Propagation in ConductingMedia, NAVMATP-2302 (U.S. Government Printing Office, 1970).
Nielsen, P., EMP/EMI Hardening of Electrical Conduit Systems, TR M-292/
ADA107133 (U.S. Army Construction Engineering Research Laboratory, September
1981).
Nuclear Electromagnetic/Pulse (NEMP) Protection, TM 5-855-5 (DA, February1974).
Roberts, H., et al., ENP Testing of Buried Conduits, The Pulsed Dipole andPulsed Transmission Line, ADA0172991 (DA, September 1976).
32
DISTRIB UTION
MTC (12)
DMA (6)ATTN: WN Effects Div.

- --. ~-7%
Nielsen. Paul H.Laboratory evaluation of electromagnetic pulse (EP) hardness testing
concepts for electrical conduit systems. - Champaign, Ill. :ConstructionEngineering Research Laboratory ; available from NTIS, 1984.
32 p. (Technical report / Construction Engineering Research LaboratoryM-350O)
1. Electric conduits. 2. Shielding (electricity). 3. Electromagneticpulse. 1. Title. 11. Series; Technical report (Construction EngineeringResearch Laboratory); M-350.

j
- - - - - -- - - - - - - - -
IM T-171
k, ."E D
10"84
DTIC