Embed Size (px)
Citation preview

Important disclosures, including any required research certifications, are provided on the last two pages of this report.
Share Price Chart
Source: Compiled by Daiwa.
Market data
12-month range (Y) 2,030-3,550
Market cap (Y mn; 5 Sep) 47,832
Shares outstanding (000; 9/16) 15,917
Foreign ownership (%; 12/15) 21.2
Investment Indicators
12/15 12/16 E 12/17 E
P/E (X) 26.7 24.4 20.4
EV/EBITDA (X) 12.7 11.0 9.2
P/B (X) 3.80 3.37 2.97
Dividend yield (%) 0.67 0.83 1.00
ROE (%) 15.1 14.6 15.5
Net debt/equity (X) -0.5 -0.4 -0.4
Income Summary
(Y mn) 12/15 12/16 E 12/17 E
Sales 20,942 23,700 26,600
Op profit 2,923 3,390 4,020
Rec profit 2,985 3,430 4,060
Net income 1,792 1,960 2,350
EPS (Y) 112.6 123.1 147.6
DPS (Y) 20.00 25.00 30.00
See end of report for notes concerning indicators.
Arcland Service Holdings (3085)
Target price: Y3,700
Share price (5 Sep): Y3,005 | Up/downside: +23.1%
Restaurant operator undergoing significant changes
Operates Katsuya restaurant chain
Rollout of Karayama to accelerate as second major brand
Coverage initiated with 2 (Outperform) rating
What's new: We initiate coverage on Arcland Service Holdings with a
2 (Outperform) rating.
Company overview: Arcland Service Holdings is mainly engaged in
the operation of the Katsuya chain of tonkatsu (pork cutlet) and
katsudon (pork cutlet rice bowl) restaurants. As of 1H FY16 (year
ending Dec 2016), the firm had a total of 405 locations (139 directly
managed, 266 franchise). Katsuya has an average monthly revenue of
roughly Y8mn and an average ticket price of around Y750. Its strengths
include the high efficiency of store operations and relatively stable
same-store sales.
We think the following points warrant attention: (1) prospects for
accelerating new store openings, with Karayama, a karaage (fried
chicken) restaurant chain firmly positioned as the firm’s second major
brand after Katsuya, (2) potential for sustained same-store sales
growth (unfavorable weather brought same-store sales into negative
territory in August), and (3) the firm’s increasing willingness to expand
operations in order to achieve its revenue target of Y100.0bn in 2025.
We expect the firm to gradually expand the Karayama chain, opening 12
new locations in FY16, 24 in FY17, and 40 in FY18.
Outlook: We estimate operating profit at Y3.39bn (company projection
Y3.25bn) for FY16, Y4.02bn for FY17, and Y4.94bn for FY18. We expect
profit to exceed the company’s projection in FY16, driven by higher-than-
expected same-store sales. We expect earnings growth to continue
thereafter, driven by the expansion of both the Katsuya and Karayama
chains.
What we recommend: We initiate coverage on Arcland Service Holdings with a 2 (Outperform) rating and a six- to 12-month target price of Y3,700.
To derive the target price, we applied a P/E of 30X, or the peak current-FY multiple, to our FY16 EPS estimate of Y123.1. We believe that such a high P/E valuation is justified given (1) prospects for the firm accelerating the rollout of new stores with Karayama solidly positioned as the second major brand after Katsuya, and (2) the firm’s increasing willingness to expand its operations,
following the shift to a holding company structure in July 2016.
Japan
Retail trade 6 September 2016 Japanese report: 6 September 2016
Outperform
(new)
Satoshi Sakae 81-3-5555-7139
- 2 -
Arcland Service Holdings (3085): 6 September 2016
Table of contents
I. Investment summary .............................................................................................. 3
1. Investment opinion ................................................................................................................... 3
2. Fundamentals ........................................................................................................................... 3
3. Valuation ................................................................................................................................... 4
II. Key points .............................................................................................................. 6
1. New store openings to accelerate fuelled by store expansion for second brand Karayama ........ 6
2. Same-store sales growth to continue at relatively steady pace ............................................... 7
3. Extra emphasis put on store expansion to achieve revenue target of Y100.0bn in 2025 ....... 8
III. Company outline .................................................................................................. 9
1. Business activities .................................................................................................................... 9
2. Company history....................................................................................................................... 9
IV. Earnings trends .................................................................................................. 10
V. Financial strategy ................................................................................................ 11
VI. Risk factors ......................................................................................................... 12
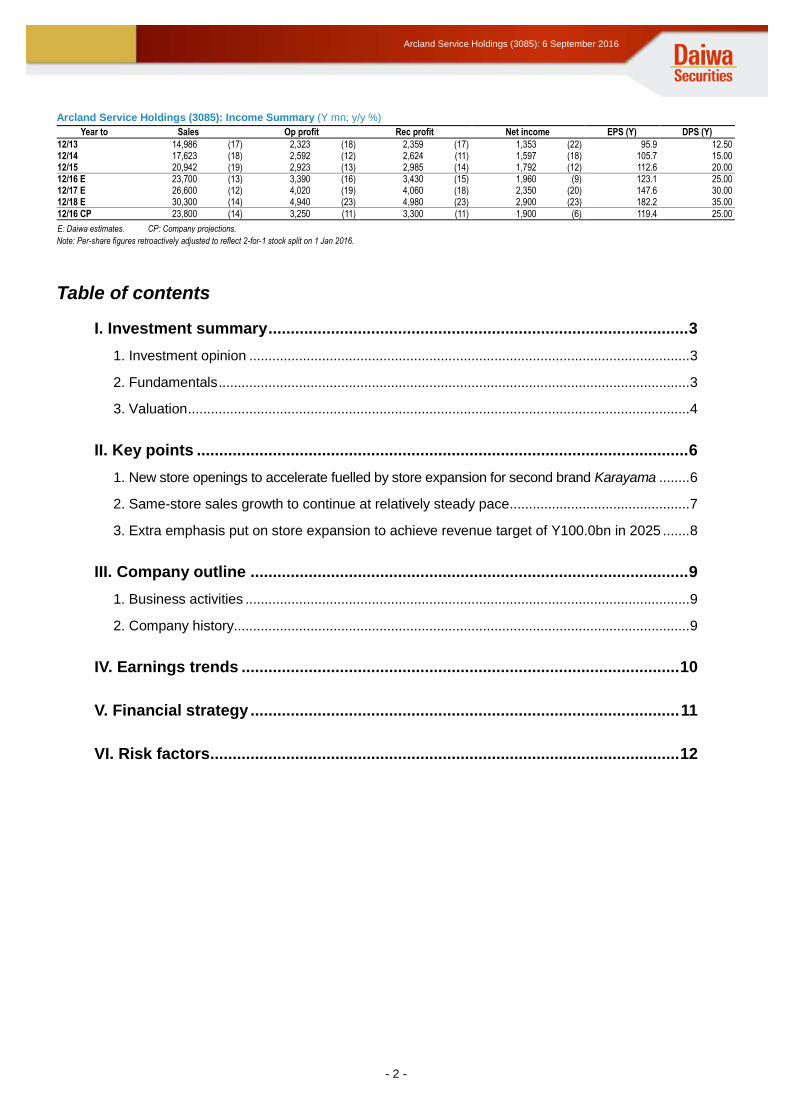
Arcland Service Holdings (3085): Income Summary (Y mn; y/y %)
Year to Sales Op profit Rec profit Net income EPS (Y) DPS (Y)
12/13 14,986 (17) 2,323 (18) 2,359 (17) 1,353 (22) 95.9 12.50 12/14 17,623 (18) 2,592 (12) 2,624 (11) 1,597 (18) 105.7 15.00 12/15 20,942 (19) 2,923 (13) 2,985 (14) 1,792 (12) 112.6 20.00 12/16 E 23,700 (13) 3,390 (16) 3,430 (15) 1,960 (9) 123.1 25.00 12/17 E 26,600 (12) 4,020 (19) 4,060 (18) 2,350 (20) 147.6 30.00 12/18 E 30,300 (14) 4,940 (23) 4,980 (23) 2,900 (23) 182.2 35.00
12/16 CP 23,800 (14) 3,250 (11) 3,300 (11) 1,900 (6) 119.4 25.00
E: Daiwa estimates. CP: Company projections.
Note: Per-share figures retroactively adjusted to reflect 2-for-1 stock split on 1 Jan 2016.

- 3 -
Arcland Service Holdings (3085): 6 September 2016
Coverage initiated with 2 rating
I. Investment summary
1. Investment opinion
We initiate coverage on Arcland Service Holdings with a 2 (Outperform) rating and a six- to
12-month target price of Y3,700. To derive the target price, we applied a P/E of 30X, the
peak current-FY multiple, to our FY16 EPS estimate of Y123.1. We believe that the stock
has not fully priced in the following changes: (1) prospects for the firm accelerating the
rollout of new stores with Karayama solidly positioned as the second major brand after
Katsuya, (2) the firm’s increasing willingness to expand its operations, following the shift to
a holding company structure on 1 July 2016.
2. Fundamentals
Arcland Service Holdings is mainly engaged in the operation of the Katsuya chain of
tonkatsu (pork cutlet) and katsudon (pork cutlet rice bowl) restaurants. As of 1H FY16, it
had a total of 405 locations (139 directly managed, 266 franchise). Katsuya’s average
monthly revenue has risen to roughly Y8mn and its average ticket price is around Y750.
Katsuya has both suburban and station front locations, with the former accounting for more
than half of its store network. Its strengths include the high efficiency of store operations
and relatively stable same-store sales.
Chart 1: Overview of Major Brands
Katsuya Karayama, Karaage Yukari
Subsidiary in charge of ops Katsuya Ever Action
Format Tonkatsu (pork cutlet),
katsudon (pork cutlet rice bowl) restaurant Karaage (fried chicken) restaurant
Store concept High-quality tonkatsu at affordable prices Specialty restaurants offering karaage, ranked as a favorite dish among Japanese consumers,
at affordable prices
Avg. ticket price Around Y750 Around Y750
Avg. monthly sales Y8mn Y12mn
Initial investment Y50-60mn Y60-75mn
Store appearance
Source: Company materials; compiled by Daiwa.
We think the following points warrant attention: (1) prospects for the firm accelerating new
store rollouts with Karayama, a karaage (fried chicken) restaurant chain solidly positioned
as the firm’s second major brand after Katsuya, (2) the high likelihood of sustained
same-store sales growth despite a planned change in store hours, and (3) the firm’s
increasing willingness to expand operations in order to achieve its revenue target of
Y100.0bn in 2025. We expect the firm to gradually expand the Karayama chain, opening 12
new locations (eight directly managed, four franchise) in FY16, 24 (12, 12) in FY17, and 40
(20, 20) in FY18.
We estimate operating profit at Y3.39bn (company projection Y3.25bn) for FY16, Y4.02bn
for FY17, and Y4.94bn for FY18. We expect profit to exceed the company’s projection in
FY16, driven by higher-than-expected same-store sales. We project earnings growth will
continue thereafter, driven by new store rollouts for both the Katsuya and Karayama chains.
Coverage initiated with 2
(Outperform) rating,
Y3,700 target price
Operates Katsuya chain
of tonkatsu & katsudon
restaurants
Focus on rollout of new
Karayama stores
Earnings growth to
continue on store
expansion for both
Katsuya, Karayama

- 4 -
Arcland Service Holdings (3085): 6 September 2016
3. Valuation
We set our six- to 12-month target price at Y3,700. To derive the target price, we applied a
P/E of 30X, or the peak current-FY multiple, to our FY16 EPS estimate of Y123.1.
We believe the stock is undervalued given (1) prospects for the firm accelerating new store
rollouts with Karayama, a karaage (fried chicken) restaurant chain solidly positioned as the
firm’s second major brand after Katsuya, (2) sustained same-store sales growth, and (3) the
firm’s increasing willingness to expand operations in order to achieve its revenue target of
Y100.0bn in 2025. Given the changes under way, we believe that the stock should trade up
to at least 30X, the peak current-FY multiple marked in 2015.
Arcland Service Holdings enjoyed P/E expansion to the restaurant industry average
multiple after the firm’s reassignment to the first section of the Tokyo Stock Exchange in
June 2014. Thereafter, the stock was afforded a higher multiple of around 30X, with
earnings growth from new store openings at Katsuya and solid same-store sales growth
attracting much investor attention. Beginning in 2016, it has experienced multiple
contraction to the mid-25X range, apparently reflecting a slowdown in new store openings
and concerns that shorter store hours could lead to a decline in same-store sales.
Chart 2: Prospective Current-FY P/E (X)
Source: Astra Manager; compiled by Daiwa. Note: Based on Nikkei estimates.
0.0
5.0
10.0
15.0
20.0
25.0
30.0
35.0
Jun
09
Sep
09
Dec
09
Mar
10
Jun
10
Sep
10
Dec
10
Mar
11
Jun
11
Sep
11
Dec
11
Mar
12
Jun
12
Sep
12
Dec
12
Mar
13
Jun
13
Sep
13
Dec
13
Mar
14
Jun
14
Sep
14
Dec
14
Mar
15
Jun
15
Sep
15
Dec
15
Mar
16
Jun
16
Sep
16
Weighted avg. P/E for top 40 restaurant names by market cap
Weighted avg. P/E for Nikkei Stock Average
Weighted avg. P/E for Arcland Service Holdings (3085)
Target price set at Y3,700
- 5 -
Arcland Service Holdings (3085): 6 September 2016
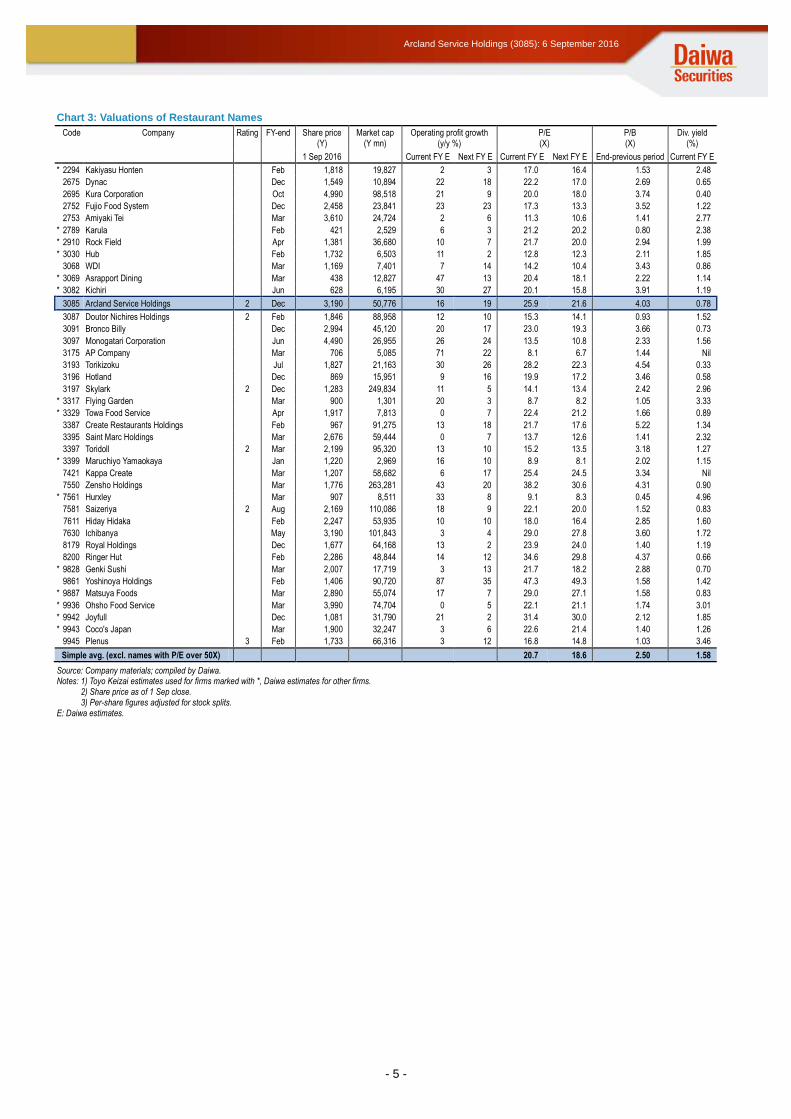
Chart 3: Valuations of Restaurant Names
Code Company Rating FY-end Share price (Y)
Market cap (Y mn)
Operating profit growth (y/y %)
P/E (X)
P/B (X)
Div. yield (%)
1 Sep 2016 Current FY E Next FY E Current FY E Next FY E End-previous period Current FY E
* 2294 Kakiyasu Honten Feb 1,818 19,827 2 3 17.0 16.4 1.53 2.48
2675 Dynac Dec 1,549 10,894 22 18 22.2 17.0 2.69 0.65
2695 Kura Corporation Oct 4,990 98,518 21 9 20.0 18.0 3.74 0.40
2752 Fujio Food System Dec 2,458 23,841 23 23 17.3 13.3 3.52 1.22
2753 Amiyaki Tei Mar 3,610 24,724 2 6 11.3 10.6 1.41 2.77
* 2789 Karula Feb 421 2,529 6 3 21.2 20.2 0.80 2.38
* 2910 Rock Field Apr 1,381 36,680 10 7 21.7 20.0 2.94 1.99
* 3030 Hub Feb 1,732 6,503 11 2 12.8 12.3 2.11 1.85
3068 WDI Mar 1,169 7,401 7 14 14.2 10.4 3.43 0.86
* 3069 Asrapport Dining Mar 438 12,827 47 13 20.4 18.1 2.22 1.14
* 3082 Kichiri Jun 628 6,195 30 27 20.1 15.8 3.91 1.19
3085 Arcland Service Holdings 2 Dec 3,190 50,776 16 19 25.9 21.6 4.03 0.78
3087 Doutor Nichires Holdings 2 Feb 1,846 88,958 12 10 15.3 14.1 0.93 1.52
3091 Bronco Billy Dec 2,994 45,120 20 17 23.0 19.3 3.66 0.73
3097 Monogatari Corporation Jun 4,490 26,955 26 24 13.5 10.8 2.33 1.56
3175 AP Company Mar 706 5,085 71 22 8.1 6.7 1.44 Nil
3193 Torikizoku Jul 1,827 21,163 30 26 28.2 22.3 4.54 0.33
3196 Hotland Dec 869 15,951 9 16 19.9 17.2 3.46 0.58
3197 Skylark 2 Dec 1,283 249,834 11 5 14.1 13.4 2.42 2.96
* 3317 Flying Garden Mar 900 1,301 20 3 8.7 8.2 1.05 3.33
* 3329 Towa Food Service Apr 1,917 7,813 0 7 22.4 21.2 1.66 0.89
3387 Create Restaurants Holdings Feb 967 91,275 13 18 21.7 17.6 5.22 1.34
3395 Saint Marc Holdings Mar 2,676 59,444 0 7 13.7 12.6 1.41 2.32
3397 Toridoll 2 Mar 2,199 95,320 13 10 15.2 13.5 3.18 1.27
* 3399 Maruchiyo Yamaokaya Jan 1,220 2,969 16 10 8.9 8.1 2.02 1.15
7421 Kappa Create Mar 1,207 58,682 6 17 25.4 24.5 3.34 Nil
7550 Zensho Holdings Mar 1,776 263,281 43 20 38.2 30.6 4.31 0.90
* 7561 Hurxley Mar 907 8,511 33 8 9.1 8.3 0.45 4.96
7581 Saizeriya 2 Aug 2,169 110,086 18 9 22.1 20.0 1.52 0.83
7611 Hiday Hidaka Feb 2,247 53,935 10 10 18.0 16.4 2.85 1.60
7630 Ichibanya May 3,190 101,843 3 4 29.0 27.8 3.60 1.72
8179 Royal Holdings Dec 1,677 64,168 13 2 23.9 24.0 1.40 1.19
8200 Ringer Hut Feb 2,286 48,844 14 12 34.6 29.8 4.37 0.66
* 9828 Genki Sushi Mar 2,007 17,719 3 13 21.7 18.2 2.88 0.70
9861 Yoshinoya Holdings Feb 1,406 90,720 87 35 47.3 49.3 1.58 1.42
* 9887 Matsuya Foods Mar 2,890 55,074 17 7 29.0 27.1 1.58 0.83
* 9936 Ohsho Food Service Mar 3,990 74,704 0 5 22.1 21.1 1.74 3.01
* 9942 Joyfull Dec 1,081 31,790 21 2 31.4 30.0 2.12 1.85
* 9943 Coco's Japan Mar 1,900 32,247 3 6 22.6 21.4 1.40 1.26
9945 Plenus 3 Feb 1,733 66,316 3 12 16.8 14.8 1.03 3.46
Simple avg. (excl. names with P/E over 50X) 20.7 18.6 2.50 1.58
Source: Company materials; compiled by Daiwa. Notes: 1) Toyo Keizai estimates used for firms marked with *, Daiwa estimates for other firms.
2) Share price as of 1 Sep close. 3) Per-share figures adjusted for stock splits.
E: Daiwa estimates.
- 6 -
Arcland Service Holdings (3085): 6 September 2016
II. Key points
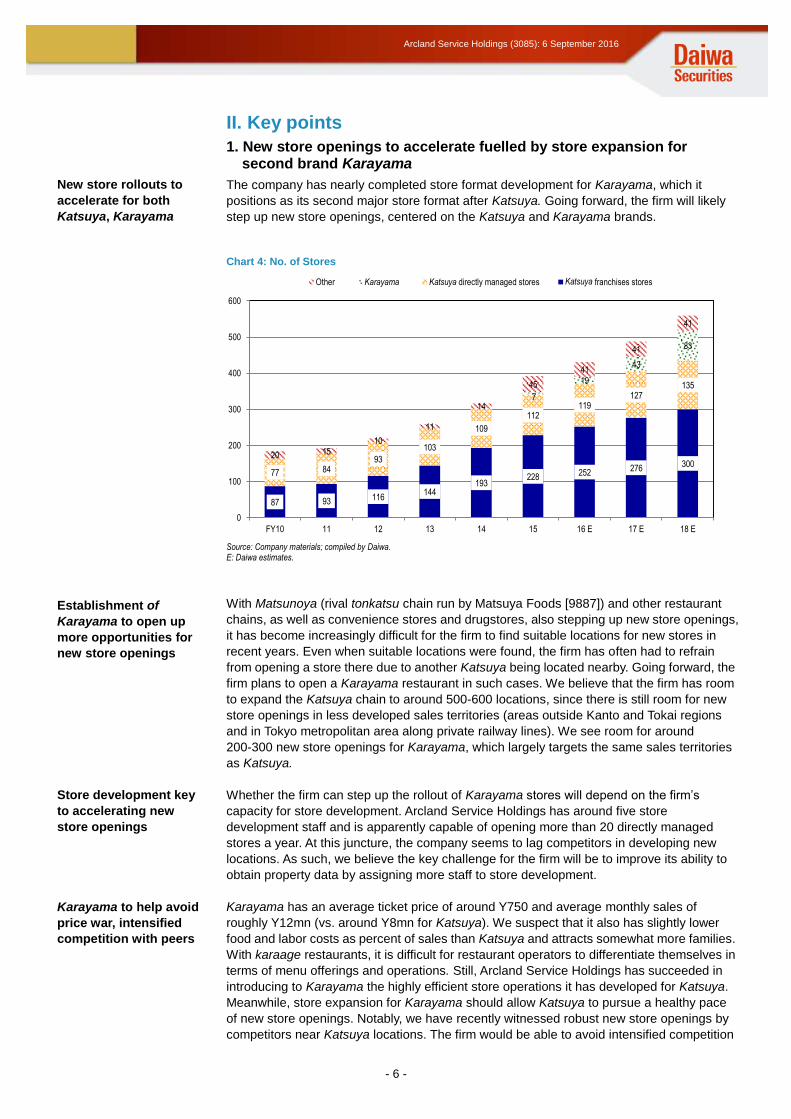
1. New store openings to accelerate fuelled by store expansion for second brand Karayama
The company has nearly completed store format development for Karayama, which it
positions as its second major store format after Katsuya. Going forward, the firm will likely
step up new store openings, centered on the Katsuya and Karayama brands.
Chart 4: No. of Stores
Source: Company materials; compiled by Daiwa. E: Daiwa estimates.
With Matsunoya (rival tonkatsu chain run by Matsuya Foods [9887]) and other restaurant
chains, as well as convenience stores and drugstores, also stepping up new store openings,
it has become increasingly difficult for the firm to find suitable locations for new stores in
recent years. Even when suitable locations were found, the firm has often had to refrain
from opening a store there due to another Katsuya being located nearby. Going forward, the
firm plans to open a Karayama restaurant in such cases. We believe that the firm has room
to expand the Katsuya chain to around 500-600 locations, since there is still room for new
store openings in less developed sales territories (areas outside Kanto and Tokai regions
and in Tokyo metropolitan area along private railway lines). We see room for around
200-300 new store openings for Karayama, which largely targets the same sales territories
as Katsuya.
Whether the firm can step up the rollout of Karayama stores will depend on the firm’s
capacity for store development. Arcland Service Holdings has around five store
development staff and is apparently capable of opening more than 20 directly managed
stores a year. At this juncture, the company seems to lag competitors in developing new
locations. As such, we believe the key challenge for the firm will be to improve its ability to
obtain property data by assigning more staff to store development.
Karayama has an average ticket price of around Y750 and average monthly sales of
roughly Y12mn (vs. around Y8mn for Katsuya). We suspect that it also has slightly lower
food and labor costs as percent of sales than Katsuya and attracts somewhat more families.
With karaage restaurants, it is difficult for restaurant operators to differentiate themselves in
terms of menu offerings and operations. Still, Arcland Service Holdings has succeeded in
introducing to Karayama the highly efficient store operations it has developed for Katsuya.
Meanwhile, store expansion for Karayama should allow Katsuya to pursue a healthy pace
of new store openings. Notably, we have recently witnessed robust new store openings by
competitors near Katsuya locations. The firm would be able to avoid intensified competition
87 93 116144
193228 252 276 300
77 8493
103
109
112119
127135
7
19
43
83
20 1510
11
14
45
41
41
41
0
100
200
300
400
500
600
FY10 11 12 13 14 15 16 E 17 E 18 E
Other Karayama Katsuya directly managed stores Katsuya franchises storesKatsuya Katsuya
New store rollouts to
accelerate for both
Katsuya, Karayama
Establishment of
Karayama to open up
more opportunities for
new store openings
Store development key
to accelerating new
store openings
Karayama to help avoid
price war, intensified
competition with peers
- 7 -
Arcland Service Holdings (3085): 6 September 2016
or a tough price war if Karayama opened new stores, not competitors. By establishing
strategic dominance within a territory with Katsuya and Karayama, Arcland Service
Holdings will be able to improve efficiencies in store development and procurement.
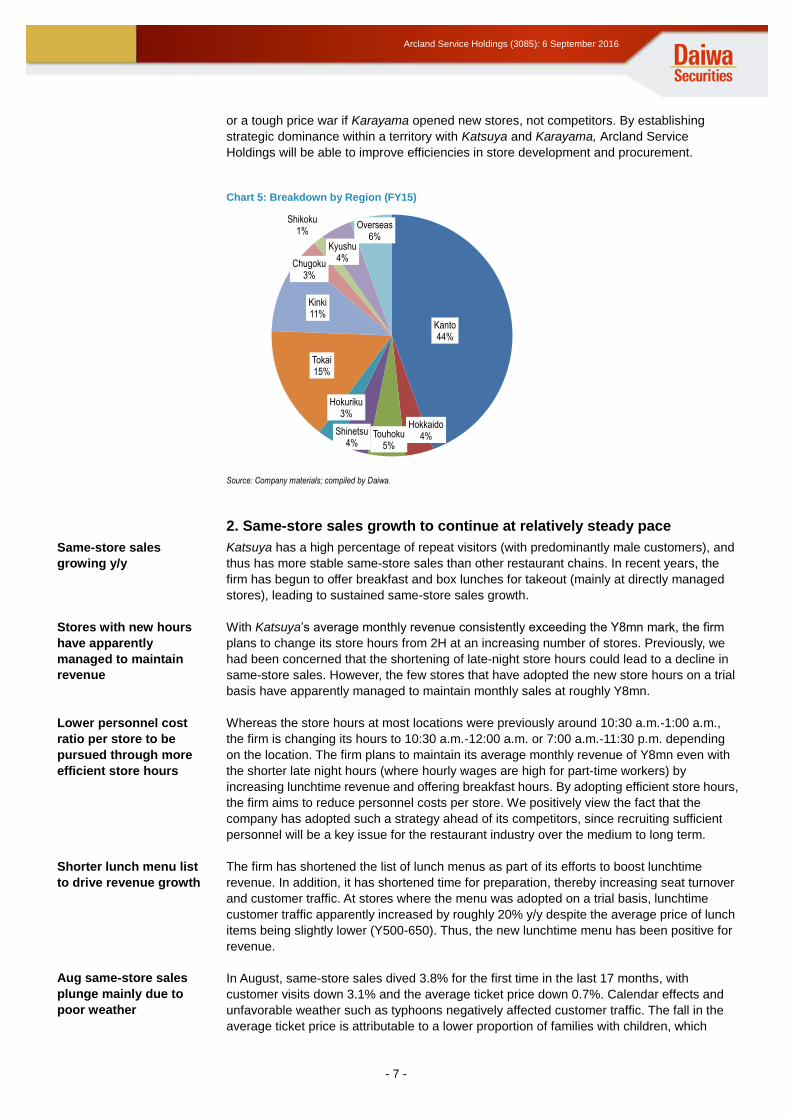
Chart 5: Breakdown by Region (FY15)
Source: Company materials; compiled by Daiwa.
2. Same-store sales growth to continue at relatively steady pace
Katsuya has a high percentage of repeat visitors (with predominantly male customers), and
thus has more stable same-store sales than other restaurant chains. In recent years, the
firm has begun to offer breakfast and box lunches for takeout (mainly at directly managed
stores), leading to sustained same-store sales growth.
With Katsuya’s average monthly revenue consistently exceeding the Y8mn mark, the firm
plans to change its store hours from 2H at an increasing number of stores. Previously, we
had been concerned that the shortening of late-night store hours could lead to a decline in
same-store sales. However, the few stores that have adopted the new store hours on a trial
basis have apparently managed to maintain monthly sales at roughly Y8mn.
Whereas the store hours at most locations were previously around 10:30 a.m.-1:00 a.m.,
the firm is changing its hours to 10:30 a.m.-12:00 a.m. or 7:00 a.m.-11:30 p.m. depending
on the location. The firm plans to maintain its average monthly revenue of Y8mn even with
the shorter late night hours (where hourly wages are high for part-time workers) by
increasing lunchtime revenue and offering breakfast hours. By adopting efficient store hours,
the firm aims to reduce personnel costs per store. We positively view the fact that the
company has adopted such a strategy ahead of its competitors, since recruiting sufficient
personnel will be a key issue for the restaurant industry over the medium to long term.
The firm has shortened the list of lunch menus as part of its efforts to boost lunchtime
revenue. In addition, it has shortened time for preparation, thereby increasing seat turnover
and customer traffic. At stores where the menu was adopted on a trial basis, lunchtime
customer traffic apparently increased by roughly 20% y/y despite the average price of lunch
items being slightly lower (Y500-650). Thus, the new lunchtime menu has been positive for
revenue.
In August, same-store sales dived 3.8% for the first time in the last 17 months, with
customer visits down 3.1% and the average ticket price down 0.7%. Calendar effects and
unfavorable weather such as typhoons negatively affected customer traffic. The fall in the
average ticket price is attributable to a lower proportion of families with children, which
Kanto44%
Hokkaido4%Touhoku
5%
Shinetsu4%
Hokuriku3%
Tokai15%
Kinki11%
Chugoku3%
Shikoku1%
Kyushu4%
Overseas6%
Same-store sales
growing y/y
Stores with new hours
have apparently
managed to maintain
revenue
Lower personnel cost
ratio per store to be
pursued through more
efficient store hours
Shorter lunch menu list
to drive revenue growth
Aug same-store sales
plunge mainly due to
poor weather

- 8 -
Arcland Service Holdings (3085): 6 September 2016
typically have higher ticket prices, mainly in the Obon holiday season. In our view,
September could stage a recovery to around zero growth in same-store sales on an easy
y/y comparison, depending on the weather.
Chart 6: Same-store Sales at Directly Managed Stores (y/y)
Source: Company materials; compiled by Daiwa.
3. Extra emphasis put on store expansion to achieve revenue target of Y100.0bn in 2025
The firm has set a revenue target of Y100.0bn for 2025, which we estimate breaks down
into Y50.0-60.0bn from Katsuya, Y20.0-30.0bn from Karayama, and Y10.0-20.0bn from
corporate acquisitions. At this juncture, these targets look difficult to achieve for both brands,
but it is possible that earnings may surge with the addition of more store development staff
or acceleration in new store openings by franchisees. The firm’s willingness to expand its
operations via M&As appears to have increased, following the shift to a holding company
structure on 1 July 2016.
We give the company some credit for its growth strategy, including external growth, since
M&As will be essential to achieving more rapid growth in the already mature domestic
restaurant market. However, it seems that potential prime targets have grown scarcer in the
industry and deals have become more expensive. As such, any future deals will need to be
considered very carefully.
Another alternative for accelerating growth would be to acquire a meat processing plant. At
present, the processing of pork for use by Katsuya is handled by subsidiary Arcland Maruha
Meat. To expand its Karayama operations, the firm may also need to acquire a poultry
processing plant. Such a plant may be able to accelerate revenue growth by not only
processing meat for the firm’s own use but also engaging in sales to outside the group.
90%
95%
100%
105%
110%
Same-store sales Customer traffic Avg. ticket price
Focus on store expansion
in pursuit of Y100bn in
revenue for 2025

- 9 -
Arcland Service Holdings (3085): 6 September 2016
III. Company outline
1. Business activities
Arcland Service Holdings is mainly engaged in the operation of the Katsuya chain of
tonkatsu (pork cutlet) and katsudon (pork cutlet rice bowl) restaurants. As of 1H FY16, it
had a total of 405 locations (139 directly managed, 266 franchise) including 355 Katsuya
locations (110 domestic directly managed, 219 domestic franchise, five directly managed
overseas, 21 franchise overseas). Katsuya’s monthly average revenue has risen to roughly
Y8mn and its average ticket price is around Y750. Katsuya has both suburban and station
front locations, with the former accounting for more than half its store network.
Katsuya’s strengths include the high efficiency of its store operations and relatively stable
same-store sales. Being a pioneer in the tonkatsu and katsudon restaurant chain market, it
also appears to have improved efficiency in various aspects of store operations such as
food preparation and customer service. The company has also made continuous
improvements to fryers and other cooking equipment through joint development with
manufacturers. Katsuya has a high percentage of repeat visitors (with predominantly male
customers), which has allowed stable same-store sales growth.
Having begun franchise operations in 1999, Arcland Service Holdings has around 70
franchisees (incorporated entities only). It generally seeks five-year contracts that call for an
initial franchise fee of Y5mn and royalties of 5% of monthly sales (lower for multi-store
franchisees). While the initial outlay is relatively large, at Y50-60mn, there has been strong
interest among franchisees in expanding existing stores and opening new stores, given the
chain’s stable same-store sales. Recently, franchisees seem to have shown especially
strong interest in opening new Karayama locations. The first Karayama franchise store
opened in spring 2016.
Outside Japan, Arcland Service Holdings operates directly managed locations in South
Korea and franchise stores in Hong Kong, Thailand, and Taiwan, with plans to advance into
the US market in the future. However, with only 26 stores overseas in 1H FY16, foreign
operations have little impact on overall revenue or operating profit, in our view. Although
revenue is brisk in certain regions, further expansion overseas will require the firm to further
establish its store format and review store locations.
Chart 7: Conditions of Katsuya’s Franchise Agreement
Term of contract Earlier of either five years from new store opening or 5 ½ years from contract date
Initial franchise fee Y5mn on contract date
Deposit Y2mn due 10 days prior to new store opening
Renewal fee Y1mn due 80 days prior to contract expiration date
Royalties 5% of monthly sales (for three stores or fewer)
Source: Company materials; compiled by Daiwa.
2. Company history
Focusing on healthy growth potential of the restaurant industry amid changing consumer
lifestyles, Arcland Sakamoto (9842), the parent of Arcland Service Holdings, established a
restaurant division in April 1986. The restaurant operations were transferred to Arcland
Service, which was established as its wholly owned subsidiary in Sanjo City, Niigata
Prefecture, in March 1993. In August 1998, Arcland Service opened the first Katsuya
restaurant. In July 1999, it began franchise operations. In October 2014, it expanded into
meat processing operations by establishing subsidiary Arcland Maruha Meat, a joint
venture with Maruha Nichiro (1333). Thereafter, it expanded into karaage restaurant
operations by launching the new Karayama brand. In December 2015, subsidiary Ever
Action acquired Karaage Yukari chain operator Ban Family. On 1 July 2016, it shifted to a
holding company structure and renamed itself Arcland Service Holdings. With lasting
prosperity, performance-related pay, being an elite group, and achieving the impossible as
its guiding principles, the firm is steadily working toward achieving its revenue target of
Y100.0bn in 2025.
Operates Katsuya
tonkatsu, katsudon
restaurant chain
Strengths include high
efficiency of store
operations
Strong interest in
opening new stores
among Katsuya and
Karayama franchisees
Expanding overseas, but
earnings impact limited

- 10 -
Arcland Service Holdings (3085): 6 September 2016
IV. Earnings trends
1H FY16 results
In 1H FY16, revenue grew 13% y/y to Y11.2bn and operating profit rose 19% to Y1.57bn.
The profit figure exceeded both our prior estimate of Y1.5bn and the company’s projection
of Y1.37bn. The overshoot vs. the company’s projection was mostly due to
higher-than-expected same-store sales. Same-store sales grew 3.3% y/y at directly
managed stores and 0.1% at franchise stores. This difference was apparently due to (1)
more directly managed stores offering breakfast and take-out lunch boxes, and (2)
problems with staff recruitment at some franchise locations. As of end-1H, the total number
of stores came to 405, up 13 from end-FY15. New store openings for directly managed
stores fell short of the company’s target due to fewer-than-expected locations earmarked
for new store openings, especially in city centers. Meanwhile, new store openings by
franchisees exceeded the company’s estimate, driven by strong franchisee interest in
opening Karayama stores. Fixed costs were not as high as we had expected, due to
fewer-than-expected directly managed stores being opened, as well as success in lowering
rents at some stores.
Chart 8: Long-term Earnings (Y bn)
Source: Company materials; compiled by Daiwa. E: Daiwa estimates.
FY16 forecasts
For FY16, we expect revenue to rise 13% y/y to Y23.7bn (company projection Y23.8bn) and
operating profit to increase 16% to Y3.39bn (Y3.25bn). The main difference with the
company forecast is due to our more bullish forecast for same-store sales. We believe
same-store sales will rise 1.7% y/y (customer traffic up 1.9%, avg. ticket price down 0.2%),
vs. the company’s forecast of no change. Our estimates assume a net increase of 39 stores
(49 new store openings, 10 closings) from a year earlier to 431 as of end-FY16. The new
stores break down to 21 Katsuya locations in Japan, 13 Katsuya locations overseas, 12
Karayama locations, and three for other store formats. We expect the number of store
closings to be higher than usual due to some Karaage Yukari stores being removed from
the group. Although pork prices are likely to decline, we believe the gross margin will narrow
by 2.9 percentage points due to higher rice prices and a higher percentage of franchise
stores at Katsuya.
FY17 forecasts
For FY17, we see revenue growing 12% y/y to Y26.6bn and operating profit rising 19% to
Y4.02bn. We expect earnings growth to be driven by store expansion for Katsuya and
Karayama. Our estimates assume a net increase of 56 stores (58 new store openings, 2
0
1
2
3
4
5
6
0
5
10
15
20
25
30
35
FY06 07 08 09 10 11 12 13 14 15 16 E 17 E 18 E
Sales (left) Operating profit (right)(
(
(億円)
Revenue up 13% y/y, op
profit up 19%
Op profit to rise 16% y/y
on 13% revenue growth
Op profit to rise 19% on
12% revenue growth

- 11 -
Arcland Service Holdings (3085): 6 September 2016
closures) from a year earlier to 487 stores as of end-FY17, with new store openings
expected to break down to 22 domestic Katsuya locations, 12 overseas Katsuya locations,
and 24 Karayama locations. We expect new store openings to accelerate for Karayama,
driven by growth in both directly managed and franchise stores. We foresee same-store
sales flat with the year-earlier level. We expect the gross margin to drop 1.6 points y/y,
mainly due to a higher percentage of franchise stores at Katsuya.
FY18 forecasts
For FY18, we forecast revenue growth of 14% y/y to Y30.3bn and an operating profit
increase of 23% to Y4.94bn. We see earnings growth driven by accelerated new store
openings for Katsuya. Our estimates assume a net increase of 72 stores (74 new store
openings, 2 closures) to 559 locations. New store openings should break down into 22
domestic Katsuya locations, 12 overseas Katsuya locations, and 40 Karayama locations.
We foresee flat same-store sales.
V. Financial strategy
Cost of accelerating new store openings to be financed by cash on hand
The firm has been stepping up store expansion for Katsuya in recent years, keeping related
costs within the range of free cash flow. Given the prospect of robust new store openings for
Karayama going forward, we expect free cash flow to decrease in FY16. Further
acceleration in new store openings by Karayama could bring free cash flow into negative
territory with related costs to be financed by cash on hand and proceeds from the sale of
investment securities. We believe the firm may sell Y1.5bn in investment securities in FY17
and FY18 combined. The firm aims to keep its dividend payout ratio at around 20%, while
adopting the policy of maintaining steady dividends.
Chart 9: Cash Flow (Y bn)
Source: Company materials; compiled by Daiwa. E: Daiwa estimates.
-6
-5
-4
-3
-2
-1
0
1
2
3
FY11 12 13 14 15 16 E 17 E 18 E
Cash flows from investing activities Cash flows from operating activities Free cash flow
Op profit to rise 23% on
14% y/y revenue growth
Cost of accelerating new
store openings to be
financed by cash on
hand
- 12 -
Arcland Service Holdings (3085): 6 September 2016
VI. Risk factors
Potential risks include (1) risks associated with the short list of shareholders, (2) risks
associated with M&As, (3) risk of competition from new market entrants, and (4) risk of
ingredient price fluctuations.
(1) Short list of shareholders
Arcland Sakamoto owns a little under 53% of the firm’s shares. It is not likely to sell the
shares, given that the subsidiary is a key growth driver. If the parent should implement a
secondary offering, this would have a meaningful of impact on buying/selling pressures in
Arcland Service Holdings shares.
(2) Risk associated with M&As
The firm may pursue M&As going forward as part of its efforts to achieve its revenue target
of Y100.0bn for 2025. However, given the company’s lack of significant experience with
major M&A deals, we see this as a risk to earnings.
(3) Risk of competition from new market entrants
In our view, the firm has benefited from the growth of the fast casual market, including
Katsuya (positioned between family restaurants and fast food) in recent years. However,
the entry of newcomers in the tonkatsu restaurant chain market, including Matsuya Foods’
Matsunoya, may become a threat for both same-store sales and new store openings.
(4) Risk of ingredient price fluctuations
Significant changes in the price of ingredients (pork, rice, vegetables) would have a
meaningful impact on earnings. However, since ingredients are generally procured through
trading firms and wholesalers, the impact of less severe fluctuations should be negligible.

- 13 -
Arcland Service Holdings (3085): 6 September 2016
Chart 10: Consolidated Income Statement (Y mn; y/y %)
FY14 15 16 E 17 E 18 E 16 CP
Sales 17,623 (17.6) 20,942 (18.8) 23,700 (13.2) 26,600 (12.2) 30,300 (13.9) 23,800 (13.6)
Katsuya directly managed stores 9,494 (9.4) 10,367 (9.2) 11,210 (8.1) 12,330 (10.0) 13,790 (11.8)
Katsuya franchises stores 6,942 (34.0) 8,552 (23.2) 9,030 (5.6) 9,780 (8.3) 10,420 (6.5)
Other restaurant businesses 931 (6.0) 1,559 (67.5) 2,490 (59.7) 3,560 (43.0) 5,130 (44.1)
Other business 254 (2.2) 463 (82.3) 970 (109.5) 930 (-4.1) 960 (3.2)
Gross profit 9,694 (12.4) 11,082 (14.3) 11,840 (6.8) 12,875 (8.7) 14,241 (10.6)
Gross margin (%) 55.0 52.9 50.0 48.4 47.0
SG&A 7,101 (12.7) 8,159 (14.9) 8,450 (3.6) 8,855 (4.8) 9,301 (5.0)
SG&A ratio (%) 40.3 39.0 35.7 33.3 30.7
Operating profit 2,592 (11.6) 2,923 (12.8) 3,390 (16.0) 4,020 (18.6) 4,940 (22.9) 3,250 (11.2)
Operating profit margin (%) 14.7 14.0 14.3 15.1 16.3 13.7
Non-operating income/expenses 32 62 40 40 40
Recurring profit 2,624 (11.2) 2,985 (13.8) 3,430 (14.9) 4,060 (18.4) 4,980 (22.7) 3,300 (10.6)
Recurring profit margin (%) 14.9 14.3 14.5 15.3 16.4 13.9
Extraordinary gains/losses 36 -127 -130 -119 -118
Pretax income 2,660 (20.2) 2,858 (7.4) 3,300 (15.5) 3,941 (19.4) 4,862 (23.4)
Pretax income margin (%) 15.1 13.6 13.9 14.8 16.0
Net income 1,597 (18.0) 1,792 (12.2) 1,960 (9.4) 2,350 (19.9) 2,900 (23.4) 1,900 (6.0)
Net income margin (%) 9.1 8.6 8.3 8.8 9.6 8.0
No. of stores
All stores 316 (22.5) 392 (24.1) 431 (9.9) 487 (13.0) 559 (14.8)
Katsuya 302 (22.3) 340 (12.6) 371 (9.1) 403 (8.6) 435 (7.9)
Other (Karayama) 14 (27.3) 52 (271.4) 60 (15.4) 84 (40.0) 124 (47.6)
Same-store sales at directly managed stores (%) 101.5 102.3 101.7 100.0 100.0
Source: Company materials; compiled by Daiwa. E: Daiwa estimates. CP: Company projections.
Chart 11: Consolidated Balance Sheet (Y mn)
FY14 15 16 E 17 E 18 E
Cash and cash equivalents 8,817 6,310 6,210 6,740 7,490
Accounts receivable 801 1,054 1,250 1,450 1,650
Inventories 210 273 350 430 510
Current assets 10,190 7,972 8,320 9,230 10,360
Tangible fixed assets 2,213 2,536 2,840 3,330 4,010
Intangible fixed assets 7 332 330 330 330
Investments and other assets 2,208 5,809 6,930 7,630 8,320
Fixed assets 4,429 8,679 10,100 11,290 12,660
Total assets 14,620 16,651 18,420 20,520 23,020
Accounts payable 1,017 1,165 1,370 1,570 1,770
Short-term borrowings 0 0 0 0 0
Other 1,682 1,795 1,790 1,790 1,790
Current liabilities 2,699 2,960 3,160 3,360 3,560
Long-term borrowings 0 0 0 0 0
Other 809 963 960 960 960
Long-term liabilities 809 963 960 960 960
Total liabilities 3,509 3,923 4,120 4,320 4,520
Total net assets 11,110 12,727 14,300 16,200 18,500
Total liabilities and net assets 14,620 16,651 18,420 20,520 23,020
Source: Company materials; compiled by Daiwa. E: Daiwa estimates.
- 14 -
Arcland Service Holdings (3085): 6 September 2016
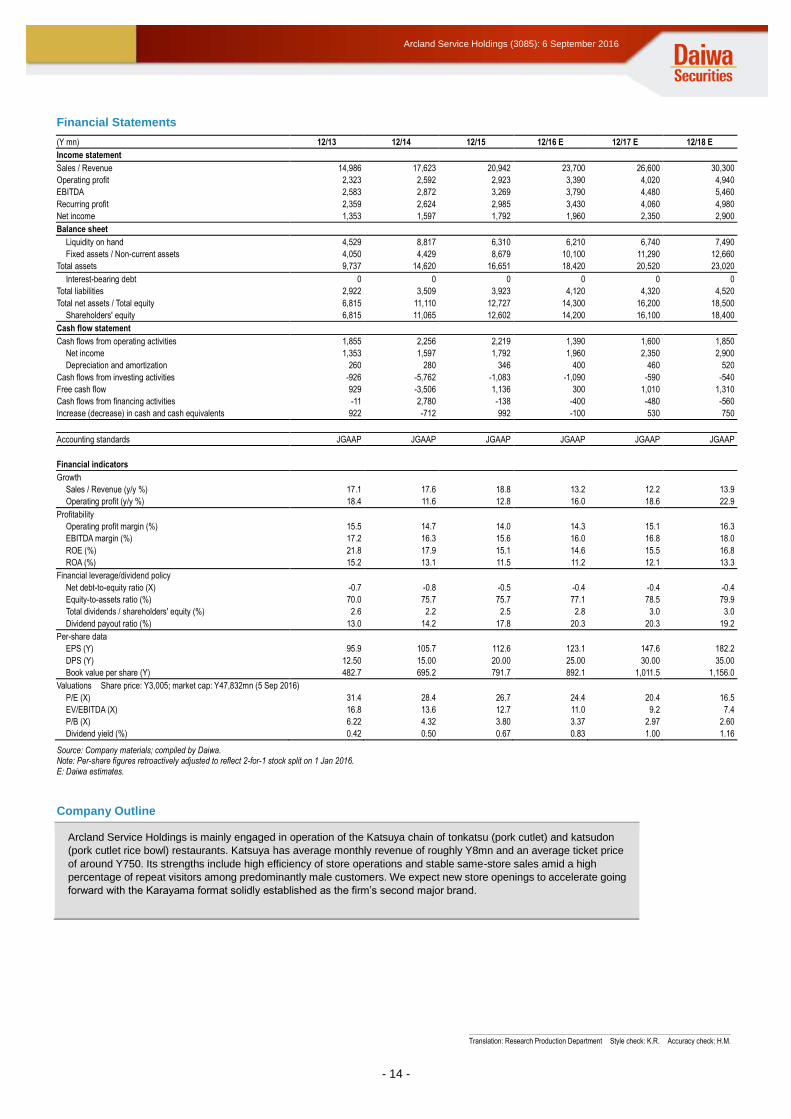
Financial Statements
(Y mn) 12/13 12/14 12/15 12/16 E 12/17 E 12/18 E
Income statement
Sales / Revenue 14,986 17,623 20,942 23,700 26,600 30,300
Operating profit 2,323 2,592 2,923 3,390 4,020 4,940
EBITDA 2,583 2,872 3,269 3,790 4,480 5,460
Recurring profit 2,359 2,624 2,985 3,430 4,060 4,980
Net income 1,353 1,597 1,792 1,960 2,350 2,900
Balance sheet
Liquidity on hand 4,529 8,817 6,310 6,210 6,740 7,490
Fixed assets / Non-current assets 4,050 4,429 8,679 10,100 11,290 12,660
Total assets 9,737 14,620 16,651 18,420 20,520 23,020
Interest-bearing debt 0 0 0 0 0 0
Total liabilities 2,922 3,509 3,923 4,120 4,320 4,520
Total net assets / Total equity 6,815 11,110 12,727 14,300 16,200 18,500
Shareholders' equity 6,815 11,065 12,602 14,200 16,100 18,400
Cash flow statement
Cash flows from operating activities 1,855 2,256 2,219 1,390 1,600 1,850
Net income 1,353 1,597 1,792 1,960 2,350 2,900
Depreciation and amortization 260 280 346 400 460 520
Cash flows from investing activities -926 -5,762 -1,083 -1,090 -590 -540
Free cash flow 929 -3,506 1,136 300 1,010 1,310
Cash flows from financing activities -11 2,780 -138 -400 -480 -560
Increase (decrease) in cash and cash equivalents 922 -712 992 -100 530 750
Accounting standards JGAAP JGAAP JGAAP JGAAP JGAAP JGAAP
Financial indicators
Growth
Sales / Revenue (y/y %) 17.1 17.6 18.8 13.2 12.2 13.9
Operating profit (y/y %) 18.4 11.6 12.8 16.0 18.6 22.9
Profitability
Operating profit margin (%) 15.5 14.7 14.0 14.3 15.1 16.3
EBITDA margin (%) 17.2 16.3 15.6 16.0 16.8 18.0
ROE (%) 21.8 17.9 15.1 14.6 15.5 16.8
ROA (%) 15.2 13.1 11.5 11.2 12.1 13.3
Financial leverage/dividend policy
Net debt-to-equity ratio (X) -0.7 -0.8 -0.5 -0.4 -0.4 -0.4
Equity-to-assets ratio (%) 70.0 75.7 75.7 77.1 78.5 79.9
Total dividends / shareholders' equity (%) 2.6 2.2 2.5 2.8 3.0 3.0
Dividend payout ratio (%) 13.0 14.2 17.8 20.3 20.3 19.2
Per-share data
EPS (Y) 95.9 105.7 112.6 123.1 147.6 182.2
DPS (Y) 12.50 15.00 20.00 25.00 30.00 35.00
Book value per share (Y) 482.7 695.2 791.7 892.1 1,011.5 1,156.0
Valuations Share price: Y3,005; market cap: Y47,832mn (5 Sep 2016)
P/E (X) 31.4 28.4 26.7 24.4 20.4 16.5
EV/EBITDA (X) 16.8 13.6 12.7 11.0 9.2 7.4
P/B (X) 6.22 4.32 3.80 3.37 2.97 2.60
Dividend yield (%) 0.42 0.50 0.67 0.83 1.00 1.16
Source: Company materials; compiled by Daiwa. Note: Per-share figures retroactively adjusted to reflect 2-for-1 stock split on 1 Jan 2016. E: Daiwa estimates.
Company Outline
Arcland Service Holdings is mainly engaged in operation of the Katsuya chain of tonkatsu (pork cutlet) and katsudon
(pork cutlet rice bowl) restaurants. Katsuya has average monthly revenue of roughly Y8mn and an average ticket price
of around Y750. Its strengths include high efficiency of store operations and stable same-store sales amid a high
percentage of repeat visitors among predominantly male customers. We expect new store openings to accelerate going
forward with the Karayama format solidly established as the firm’s second major brand.
Translation: Research Production Department Style check: K.R. Accuracy check: H.M.

- 15 -
Arcland Service Holdings (3085): 6 September 2016
Notes concerning market data, investment indicators, and income summary on pages 1-2
Estimates on page 1 by Daiwa Net income is that attributable to shareholders of parent Shares outstanding: Common shares outstanding (excl. treasury stock) Market cap: Based on shares outstanding and closing price as of indicated date EV: Market cap + interest-bearing debt – liquidity on hand EBITDA: Operating profit + depreciation & amortization ROE: Net income / average of start-FY and end-FY shareholders’ equity (figures based on net income attributable to shareholders of parent) Share Price Chart and per-share figures retroactively adjusted to reflect stock splits/reverse stock splits
- 16 -
Arcland Service Holdings (3085): 6 September 2016
IMPORTANT This report is provided as a reference for making investment decisions and is not intended to be a solicitation for investment. Investment decisions should be made at your own discretion and risk. Content herein is based on information available at the time the report was prepared and may be amended or otherwise changed in the future without notice. We make no representations as to the accuracy or completeness. Daiwa Securities Co. Ltd. retains all rights related to the content of this report, which may not be redistributed or otherwise transmitted without prior consent. Ratings Issues are rated 1, 2, 3, 4, or 5 as follows: 1: Outperform TOPIX/benchmark index by more than 15% over the next 12 months. 2: Outperform TOPIX/benchmark index by 5-15% over the next 12 months. 3: Out/underperform TOPIX/benchmark index by less than 5% over the next 12 months. 4: Underperform TOPIX/benchmark index by 5-15% over the next 12 months. 5: Underperform TOPIX/benchmark index by more than 15% over the next 12 months. Benchmark index: TOPIX for Japan, S&P 500 for US, STOXX Europe 600 for Europe, HSI for Hong Kong, STI for Singapore, KOSPI for Korea, TWII for Taiwan, and S&P/ASX 200 for Australia. (Criteria above apply to rating assignments or updates from Jan 2015. For ratings assigned or updated prior to Jan 2015, criteria refer to performance vs. TOPIX/benchmark index over six months.) Japan Conflicts of Interest: Daiwa Securities Co. Ltd. may currently provide or may intend to provide investment banking services or other services to the company referred to in this report. In such cases, said services could give rise to conflicts of interest for Daiwa Securities Co. Ltd. Daiwa Securities Co. Ltd. and Daiwa Securities Group Inc.: Daiwa Securities Co. Ltd. is a subsidiary of Daiwa Securities Group Inc. Ownership of Securities: Daiwa Securities Co. Ltd. may currently, or in the future, own or trade either securities issued by the company referred to in this report or other securities based on such financial instruments. Daiwa Securities Group has filed major shareholding reports for the following companies of which it owns over 5% (as of 15 August 2016): DAISUE CONSTRUCTION (1814); ICHIKEN (1847); NISSEI BUILD KOGYO (1916); Accordia Golf (2131); Samty (3244); Sansei Landic (3277); MUGEN ESTATE (3299); Nippon Healthcare Investment Corporation (3308); KFC (3420); KAWADA TECHNOLOGIES (3443); KI-STAR REAL ESTATE (3465); Billing System (3623); Enigmo (3665); Konoshima Chemical (4026); SEPTENI HOLDINGS (4293); Tri Chemical Laboratories (4369); RaQualia Pharma (4579); NOZAWA (5237); Nakayama Steel Works (5408); Toho Zinc (5707); TOKYO ROPE MFG. (5981); LINKBAL (6046); Allied Architects (6081); WILL GROUP (6089); NS TOOL (6157); Kamakura Shinsho (6184); HOPE (6195); HIRATA Corporation (6258); SANSO ELECTRIC (6518); W-SCOPE (6619); MITSUMI ELECTRIC (6767); SUMIDA CORPORATION (6817); Ferrotec (6890); ENOMOTO (6928); Astmax (7162); GMO Click Holdings (7177); Nojima (7419); V Technology (7717); Daiko Denshi Tsushin (8023); Money Partners Group (8732); Daiwa Office Investment Corporation (8976); Japan Rental Housing Investments (8986); Cerespo (9625); Imperial Hotel (9708); PARKER CORPORATION (9845). Lead Management: Daiwa Securities Co. Ltd. has lead-managed public offerings and/or secondary offerings (excluding straight bonds) in the past twelve months for the following companies: Yoshimura Food Holdings K.K. (2884); Torikizoku (3193); HOTLAND (3196); Activia Properties (3279); SIA REIT (3290); AEON REIT Investment Corporation (3292); Hulic Reit (3295); Nippon Healthcare Investment Corporation (3308); Tosei Reit Investment Corporation (3451); Kenedix Retail REIT Corporation (3453); Samty Residential Investment Corporation (3459); KI-STAR REAL ESTATE (3465); Mitsui Fudosan Logistics Park Inc. (3471); SHOEI YAKUHIN (3537); Nousouken (3541); KOMEDA Holdings (3543); Defactostandard (3545); KUSHIKATSU TANAKA (3547); OPTiM (3694); Mynet (3928); BENEFIT JAPAN (3934); Globalway (3936); Silver Egg Technology (3961); FUSO CHEMICAL (4368); OAT Agrio (4979); Interworks (6032); FIRSTLOGIC (6037); NIPPON VIEW HOTEL (6097); Recruit Holdings (6098); Japan Post Holdings (6178); GMO Media (6180); So-net Media Networks (6185); Atrae (6194); IWAKI (6237); TSUBAKI NAKASHIMA (6464); REFINVERSE (6531); Japan Investment Adviser (7172); Japan Post Insurance (7181); Japan Post Bank (7182); THE FIRST BANK OF TOYAMA (7184); ATOM (7412); AEON Financial Service (8570); ORIX JREIT (8954); HEIWA REAL ESTATE REIT (8966); Daiwa Office Investment Corporation (8976); Japan Hotel REIT Investment Corporation (8985); GAKKYUSHA (9769). (list as of 1 September 2016) Notification items pursuant to Article 37 of the Financial Instruments and Exchange Law
(This Notification is only applicable to where report is distributed by Daiwa Securities Co. Ltd.) If you decide to enter into a business arrangement with our company based on the information described in this report, we ask you to pay close attention to the following items. In addition to the purchase price of a financial instrument, our company will collect a trading commission* for each transaction as agreed beforehand with you. Since commissions
may be included in the purchase price or may not be charged for certain transactions, we recommend that you confirm the commission for each transaction. In some cases, our company also may charge a maximum of ¥ 2 million (including tax) per year as a standing proxy fee for our deposit of your securities, if you are a non-resident.
For derivative and margin transactions etc., our company may require collateral or margin requirements in accordance with an agreement made beforehand with you. Ordinarily in such cases, the amount of the transaction will be in excess of the required collateral or margin requirements.
There is a risk that you will incur losses on your transactions due to changes in the market price of financial instruments based on fluctuations in interest rates, exchange rates, stock prices, real estate prices, commodity prices, and others. In addition, depending on the content of the transaction, the loss could exceed the amount of the collateral or margin requirements.
There may be a difference between bid price etc. and ask price etc. of OTC derivatives handled by our company. Before engaging in any trading, please thoroughly confirm accounting and tax treatments regarding your trading in financial instruments with such experts as certified public
accountants. * The amount of the trading commission cannot be stated here in advance because it will be determined between our company and you based on current market conditions and the content of each transaction etc. When making an actual transaction, please be sure to carefully read the materials presented to you prior to the execution of agreement, and to take responsibility for your own decisions regarding the signing of the agreement with our company.
Corporate Name: Daiwa Securities Co. Ltd. Financial instruments firm: chief of Kanto Local Finance Bureau (Kin-sho) No.108 Memberships: Japan Securities Dealers Association, The Financial Futures Association of Japan, Japan Investment Advisers Association, Type II Financial Instruments Firms Association
Hong Kong This research is distributed in Hong Kong by Daiwa Capital Markets Hong Kong Limited which is regulated by the Hong Kong Securities and Futures Commission. Recipients of this research in Hong Kong may contact Daiwa Capital Markets Hong Kong Limited in respect of any matter arising from or in connection with this research. Singapore This research is distributed in Singapore by Daiwa Capital Markets Singapore Limited and it may only be distributed in Singapore to accredited investors, expert investors and institutional investors as defined in the Financial Advisers Regulations and the Securities and Futures Act. By virtue of distribution to these category of investors, Daiwa Capital Markets Singapore Limited and its representatives are not required to comply with Section 36 of the Financial Advisers Act (Section 36 relates to disclosure of Daiwa Capital Markets Singapore Limited’s interest and/or its representative’s interest in securities). Recipients of this research in Singapore may contact Daiwa Capital Markets Singapore Limited in respect of any matter arising from or in connection with the research.
Australia This research is distributed in Australia by Daiwa Capital Markets Australia Limited and it may only be distributed in Australia to wholesale investors within the meaning of the Corporations Act. Recipients of this research in Australia may contact Daiwa Capital Markets Stockbroking Limited in respect of any matter arising from or in connection with the research. Taiwan This research is distributed in Taiwan by Daiwa-Cathay Capital Markets Co., Ltd and it may only be distributed in Taiwan to institutional investors or specific investors who have signed recommendation contracts with Daiwa-Cathay Capital Markets Co., Ltd in accordance with the Operational Regulations Governing Securities Firms Recommending Trades in Securities to Customers. Recipients of this research in Taiwan may contact Daiwa-Cathay Capital Markets Co., Ltd in respect of any matter arising from or in connection with the research. Thailand This research is distributed to only institutional investors in Thailand primarily by Thanachart Securities Public Company Limited (“TNS”). This report is prepared by analysts who are employed by Daiwa Securities Group Inc. and/or its non-U.S. affiliates. This report is provided to you for informational purposes only and it is not, and is not to be construed as, an offer or an invitation to make an offer to sell or buy any securities. Neither Thanachart Securities Public Company Limited, Daiwa Securities Group Inc. nor any of their respective parent, holding, subsidiaries or affiliates, nor any of their respective directors, officers, servants and employees accept any liability whatsoever for any direct or consequential loss arising from any use of this research or its contents.
- 17 -
Arcland Service Holdings (3085): 6 September 2016
The information and opinions contained herein have been compiled or arrived at from sources believed to be reliable. However, Thanachart Securities Public Company Limited, Daiwa Securities Group Inc. nor any of their respective parent, holding, subsidiaries or affiliates, nor any of their respective directors, officers, servants and employees make no representation or warranty, express or implied, as to their accuracy or completeness. Expressions of opinion herein are subject to change without notice. The use of any information, forecasts and opinions contained in this report shall be at the sole discretion and risk of the user. Daiwa Securities Group Inc. and/or its non-U.S. affiliates perform and seek to perform business with companies covered in this research. Thanachart Securities Public Company Limited, Daiwa Securities Group Inc., their respective parent, holding, subsidiaries or affiliates, their respective directors, officers, servants and employees may have positions and financial interest in securities mentioned in this research. Thanachart Securities Public Company Limited, Daiwa Securities Group Inc., their respective parent, holding, subsidiaries or affiliates may from time to time perform investment banking or other services for, or solicit investment banking or other business from, any entity mentioned in this research. Therefore, investors should be aware of conflict of interest that may affect the objectivity of this research. United Kingdom This research report is produced by Daiwa Securities Co. Ltd. and/or its affiliates and is distributed by Daiwa Capital Markets Europe Limited in the European Union, Iceland, Liechtenstein, Norway and Switzerland. Daiwa Capital Markets Europe Limited is authorised and regulated by the Financial Conduct Authority and is a member of the London Stock Exchange, and Eurex. Daiwa Capital Markets Europe Limited and its affiliates may, from time to time, to the extent permitted by law, participate or invest in other financing transactions with the issuers of the securities referred to herein (the “Securities”), perform services for or solicit business from such issuers, and/or have a position or effect transactions in the Securities or options thereof and/or may have acted as an underwriter during the past twelve months for the issuer of such securities. In addition, employees of Daiwa Capital Markets Europe Limited and its affiliates may have positions and effect transactions in such securities or options and may serve as Directors of such issuers. Daiwa Capital Markets Europe Limited may, to the extent permitted by applicable UK law and other applicable law or regulation, effect transactions in the Securities before this material is published to recipients. This publication is intended for investors who are not Retail Clients in the United Kingdom within the meaning of the Rules of the Financial Conduct Authority and should not therefore be distributed to such Retail Clients in the United Kingdom. Should you enter into investment business with Daiwa Capital Markets Europe’s affiliates outside the United Kingdom, we are obliged to advise that the protection afforded by the United Kingdom regulatory system may not apply; in particular, the benefits of the Financial Services Compensation Scheme may not be available. Daiwa Capital Markets Europe Limited has in place organisational arrangements for the prevention and avoidance of conflicts of interest. Our conflict management policy is available at http://www.uk.daiwacm.com/about-us/corporate-governance-regulatory. Regulatory disclosures of investment banking relationships are available at https://daiwa3.bluematrix.com/sellside/Disclosures.action. Germany This document is distributed in Germany by Daiwa Capital Markets Europe Limited, Frankfurt branch, which is regulated by BaFin (Bundesanstalt fuer Finanzdienstleistungsaufsicht) for the conduct of business in Germany. Bahrain This research material is distributed by Daiwa Capital Markets Europe Limited, Bahrain Branch, regulated by The Central Bank of Bahrain and holds Investment Business Firm – Category 2 license and having its official place of business at the Bahrain World Trade Centre, South Tower, 7th floor, P.O. Box 30069, Manama, Kingdom of Bahrain. Tel No. +973 17534452 Fax No. +973 535113 This material is provided as a reference for making investment decisions and is not intended to be a solicitation for investment. Investment decisions should be made at your own discretion and risk. Accordingly, no representation or warranty, express or implied, is made as to and no reliance should be placed on the fairness, accuracy, completeness or correctness of the information and opinions contained in this document, Content herein is based on information available at the time the research material was prepared and may be amended or otherwise changed in the future without notice. All information is intended for the private use of the person to whom it is provided without any liability whatsoever on the part of Daiwa Capital Markets Europe Limited, Bahrain Branch, any associated company or the employees thereof. If you are in doubt about the suitability of the product or the research material itself, please consult your own financial adviser. Daiwa Capital Markets Europe Limited, Bahrain Branch retains all rights related to the content of this material, which may not be redistributed or otherwise transmitted without prior consent. United States This report is distributed in the U.S. by Daiwa Capital Markets America Inc. (DCMA). It may not be accurate or complete and should not be relied upon as such. It reflects the preparer’s views at the time of its preparation, but may not reflect events occurring after its preparation; nor does it reflect DCMA’s views at any time. Neither DCMA nor the preparer has any obligation to update this report or to continue to prepare research on this subject. This report is not an offer to sell or the solicitation of any offer to buy securities. Unless this report says otherwise, any recommendation it makes is risky and appropriate only for sophisticated speculative investors able to incur significant losses. Readers should consult their financial advisors to determine whether any such recommendation is consistent with their own investment objectives, financial situation and needs. This report does not recommend to U.S. recipients the use of any of DCMA’s non-U.S. affiliates to effect trades in any security and is not supplied with any understanding that U.S. recipients of this report will direct commission business to such non-U.S. entities. Unless applicable law permits otherwise, non-U.S. customers wishing to effect a transaction in any securities referenced in this material should contact a Daiwa entity in their local jurisdiction. Most countries throughout the world have their own laws regulating the types of securities and other investment products which may be offered to their residents, as well as a process for doing so. As a result, the securities discussed in this report may not be eligible for sales in some jurisdictions. Customers wishing to obtain further information about this report should contact DCMA: Daiwa Capital Markets America Inc., Financial Square, 32 Old Slip, New York, New York 10005 (telephone 212-612-7000). Ownership of Securities. For “Ownership of Securities” information please visit BlueMatrix disclosure Link at https://daiwa3.bluematrix.com/sellside/Disclosures.action. Investment Banking Relationships. For “Investment Banking Relationships” please visit BlueMatrix disclosure link at https://daiwa3.bluematrix.com/sellside/Disclosures.action. DCMA Market Making. For “DCMA Market Making” please visit BlueMatrix disclosure link at: https://daiwa3.bluematrix.com/sellside/Disclosures.action. Research Analyst Conflicts. For updates on “Research Analyst Conflicts” please visit BlueMatrix disclosure link at https://daiwa3.bluematrix.com/sellside/Disclosures.action. The principal research analysts who prepared this report have no financial interest in securities of the issuers covered in the report, are not (nor are any members of their household) an officer, director or advisory board member of the issuer(s) covered in the report, and are not aware of any material relevant conflict of interest involving the analyst or DCMA, and did not receive any compensation from the issuer during the past 12 months except as noted: no exceptions. Research Analyst Certification. For updates on “Research Analyst Certification” and “Rating System” please visit BlueMatrix disclosure link at: https://daiwa3.bluematrix.com/sellside/Disclosures.action. The views about any and all of the subject securities and issuers expressed in this Research Report accurately reflect the personal views of the research analyst(s) primarily responsible for this report (or the views of the firm producing the report if no individual analysts[s] is named on the report); and no part of the compensation of such analyst(s) (or no part of the compensation of the firm if no individual analyst[s)] is named on the report) was, is, or will be directly or indirectly related to the specific recommendations or views contained in this Research Report. The following explains the rating system in the report as compared to relevant local indices, based on the beliefs of the author of the report. (Criteria below apply to rating assignments or updates from Jan 2015. For ratings assigned or updated prior to Jan 2015, criteria refer to performance vs. TOPIX/benchmark index over six months.) "1": the security could outperform the local benchmark index by more than 15% over the next 12 months. "2": the security is expected to outperform the local benchmark index by 5-15% over the next 12 months. "3": the security is expected to perform within 5% of the local benchmark index (better or worse) over the next 12 months. "4": the security is expected to underperform the local benchmark index by 5-15% over the next 12 months. "5": the security could underperform the local benchmark index by more than 15% over the next 12 months. Additional information may be available upon request.


![#5 [3085] 20 лютого 2020audytoriya.lpnu.ua/wp-content/uploads/2020/02/аудиторія1-веб.pdf · ч. 5 [3085] 3 20 лютого 2020 СТУДІЇ „ВЕТЕРАНСЬКА](https://img.dokumen.tips/doc/110x75/5f02c4ed7e708231d405eb87/5-3085-20-f1-pdf-5-3085-3-20-.jpg)