Embed Size (px)
Citation preview

Prepared for:
Drs. Cassandra Newby-Alexander and Jeffery LittlejohnNorfolk State University
Brown Hall C 156700 Park Avenue
Norfolk, Virginia 23504(757) 823-8984
ARCHAEO-GEOPHYSICAL INVESTIGATION OFTHE EMMANUEL A.M.E. CHURCH AND FORMER GLASGOW STREET
LOCATION OF THE CHURCHPORTSMOUTH, VIRGINIA
AMEC Project No. 03-4996-0000Report of Cultural Resources Investigations 04-010
Prepared by:
Duane Simpsonand
Ryan Peterson
AMEC Earth & Environmental, Inc.690 Commonwealth Center11003 Bluegrass ParkwayLouisville, Kentucky 40299
(502) 267-0700(502) 267-5900 (FAX)
May 18, 2004

Archaeo-Geophysical Investigation of the Emmanuel A.M.E. May 18, 2004Church and Former Glasgow Street Location of the Church Page 1Portsmouth, Virginia
INTRODUCTION
This report details the results of the archaeo-geophysical investigation of the Emmanuel A.M.E. (AfricanMethodist Episcopal) Church and the former Glasgow Street location of the Church. Duane Simpson andRyan Peterson conducted the investigation from March 6-9, 2004. Drs. Cassandra Newby-Alexander andJeff Littlejohn of Norfolk State University provided logistical support and invaluable historical backgroundthat helped to guide the investigation and interpretation of the data. Numerous members of theEmmanuel A.M.E. Church and the Monumental Methodist Church were also present at various stages ofthe investigations and contributed additional information about the areas that were investigated. Anelectrical resistance survey was conducted in three separate investigation areas. West of the EmmanuelA.M.E. Church, an investigation was conducted to locate buried features that may have been associatedwith a former parsonage that was located in this area and possibly additional features that may pre-datethe parsonage. An area at the southeast corner of the Emmanuel A.M.E. Church was investigated todetermine the potential presence of a tunnel associated with the Underground Railroad that wassuspected to be located in this area. The final location investigated as part of this project was the formerGlasgow Street location of the church that burned in the nineteenth century. The techniques utilized andthe results of the investigations are included below.
PRINCIPLES OF ELECTRICAL METHODS
This brief introduction to resistance draws from various authors (Bevan 1983; Carr 1982; Clark 1996;Hasek 1999; Scollar et.al 1990; Weymouth 1986) who have discussed electrical methods in varyinglevels of detail. The principals described below provide a summary of electrical methods and provides abackground for the interpretations that are provided below.
All materials allow some movement of electrical charge (Scollar et.al. 1990:306). If the material easilytransmits the electrical charge, it is considered conductive, but if the flow is impeded the material isconsidered resistant to the flow of electricity. Metals and electrolytes (salts) are extremely conductive,whereas insulators like glass, plastics, air and ice are very weak in their ability to conduct electricity(Scollar et. al 1990). In the case of geophysical prospecting, the conductive medium for electrical currentis soils. An understanding of the constituent parts of soils as well as particle size, structure and macroversus micro capillary pores is necessary to be able to determine the conductivity of different soilmatrices.
Soils are comprised of three parts: air, water and mineral. The mineral and air portions of soils areinsulators offering little in the way of conductivity. Rainfall, however, contains dissolved carbon dioxideand carbonic acid from the atmosphere, forming positive and negative conducting electrolytes by reactionwith the minerals in the soil (Clark 1996:27). Soils with higher amounts of conductive minerals, salts orclayey soils, will allow greater conductivity (Figure 1A). As particle size increases, so does the resistanceof the soil. This increase in resistance is due to two reasons. As particle size constituents increase, thereis a reduction in the amount of free electrolytes within the soil due to the more rapid movement of waterthrough the matrix, as well as the increase of macrocapillary versus microcapillary pores. The loss of saltsor free electrolytes reduces the ability of the soil water to conduct the electrical current. Macrocapillarypores allow for the soil to drain more rapidly, with these void spaces being filled with air. Since air is aninsulator it does not allow good conduction. Therefore, sandy soils will tend to be more resistant thanclayey soils, since they are dominated by macro versus microcapillary pores. In the case of heavilysaturated soils, macrocapillary pores are filled with water and therefore even coarse soils, such as sands,will become extremely conductive.
Soil properties are relatively homogenous within small areas, such as an archeological site, but isolateddisturbances within the soil matrix will alter soil properties in confined areas, and can be recorded by theirslight or pronounced contrast to the soil matrix. Since archeological features represent a type ofdisturbance to the soil matrix they can be measured along with other types of subsurface disturbances.Measuring of these disturbances is based upon a few basic electrical principles.

Archaeo-Geophysical Investigation of the Emmanuel A.M.E. May 18, 2004Church and Former Glasgow Street Location of the Church Page 2Portsmouth, Virginia
Movement of charged particles through a conductive medium causes an electrical current. As Clark(1996:27) explains, an electrical potential difference, or voltage, is applied between the ends of anelectrical conductor, in this case soil, and a current flows through it, the size of the current dependingupon the resistance of the conductor. This resistance will be altered due to isolated soil characteristicsand the change can be measured across a site utilizing Ohm’s Law (Figure 1B). In addition, the current isinversely proportional to the resistance of the medium, indicating the potential difference to current flow.Since the resistance is proportional, it can be compared across various mediums.
The raw resistance measurements can be converted into resistivity, a bulk property of soils and othermaterials. All materials possess a specific range of resistivity to the passage of a current. Resistivityranges from approximately 1000 ohm for dry sand to as little as 10 ohm for clay. As explained previously,heavily saturated soils will make more resistant soils more conductive. Soils saturated by salt water canfall to less than 10 ohm in resistivity. In the case of the current project, heavily saturated soils were thenorm limiting resistance ranges from 200 to 20 ohm.
The application of current to a soil medium produces a potential field gradient (Figure 2A), whichexpands away from the current electrodes in a hemispherical pattern. The function of the currentelectrodes is to establish this field gradient which is then sampled (Figure 2B) by the potential electrodes(Clark 1996:29). The distance between probes dictates the theoretical maximum depth penetration of theresistance meter, but differing amounts of soil moisture can either increase or decrease the actual depthpenetration. Figure 2C shows this hemisphere of detection, which relates to the heavy dashed line inFigure 2A. The more current that passes through the anomaly the more easily delineated it becomeswithin the measurements. Thus the peak sensitivity of the instrument usually lies above its maximumdepth penetration. The collection at the Glasgow and North street parcels utilized a 0.50 m probespacing, which offered an average depth penetration of 0.35 to 0.65 meter below surface (bs) based onchanging soil moisture conditions.
The resistance data was collected using the RM15 resistance meter made by Geoscan Research. Thisinstrument utilizes a series of frame mounted probes to inject electrical current into the ground. A twinarray was utilized (Figure 1C). The twin array splits the Wenner configuration (Figure 2A) into twoseparate arrays that facilitate the collection of the data and improve interpretation of archeologicalfeatures.

Archaeo-Geophysical Investigation of the Emmanuel A.M.E. May 18, 2004Church and Former Glasgow Street Location of the Church Page 3Portsmouth, Virginia
(B) Ohm’s Law
For an electrical circuit, Ohm’s lawgives the formula below for measuringresistance (R) within a circuit, where Vand I are the potential differenceacross a resistor and the currentpassing through it respectively(Reynolds 1997).
R = V / I
This formula indicates that resistanceis a ratio of potential difference tocurrent flow. If we rearrange theformula, as shown below, we canmeasure the degree of differencebetween the resistance of differentmaterials (Clark 1996:27). The specificresistance is known as resistivity.
V = I x R
(A) MetalSaline soilClay
Increasing Organic soilConductivity Silt and loam
Sand and gravelRockAir voids
source: (Bevan 1983:51)
1C:Twin array configuration showing the fixed probes (C�P�) and the mobile array (C� P�). The distance of the fixed probes from the nearest point of the mobile array is 30x the probe spacing (ps). This distance will minimize the degree of noise between the probes to less than 3%. The twin array splits the Wenner array configuration in half (Figure 2A) making collection and interpretation of subsurface anomalies easier.
C� P�
2 0 m1
2
3
30(ps) = 30(1 m) = 30 mm
C� P�
(C)
Figure 1A: Chart indicating approximate degree of conductivity of variousearth materials. This list would simply be inversed whenreferring to the resistance of these same materials.
1B: Formula for Ohm’s Law and the calculation of specific resistance or resistivity.

Archaeo-Geophysical Investigation of the Emmanuel A.M.E. May 18, 2004Church and Former Glasgow Street Location of the Church Page 4Portsmouth, Virginia
Figure 2A: Cross sectional slice through the ground showing potential gradient basedon standard Wenner array, based on (Clark 1996:29). The equipotential lines are marked withthe percentage of the total potential difference they represent. Current flow is indicated by thedashed lines, which are orthogonal to the equipotential lines. The heavy dashed current lineindicates the maximum extent of penetration. The peak sensitivity of this array is locatedabove the heavy dashed line.
2B: Plot of the potential gradient between the current probes (C), indicating thepeak sensitivity area of the potential sample probes (P), based on (Clark 1996:29).
2C:The hemisphere of detection for a standard Wenner array, based on (Clark 1996:30). The twin array utilized for the testing at Black Hoe splits the Wenner into two C1P1 pairs. One pair is mobile the other fixed, with the mobile pair acting as the detector probes. The twin probe array spacing can be half as wide as the Wenner and achieve the same depth penetration.
20 30 40 45 50 55 60 70 80
C� ��������P� P� C�
(A)
C� ��������P� P� C�100
80
60
%
40
20
0
(B)
C� P�
P� C�
(C)

Archaeo-Geophysical Investigation of the Emmanuel A.M.E. May 18, 2004Church and Former Glasgow Street Location of the Church Page 5Portsmouth, Virginia
EQUIPMENT AND METHODOLOGY
Magnetic and electrical-based geophysical instruments have proven effective in numerous environmentaland archaeological site types around the world. The preferred instrument for the present investigation isthe RM15 electrical resistance meter produced by Geoscan Research. This instrument has a proven trackrecord throughout the world, is specifically designed for archaeology, and is becoming recognizedthroughout the United States as an effective non-invasive tool to determine the presence subsurfacearchaeological deposits and features. Due to the high incidence of iron noted the areas that wereinvestigated and the degree to which iron interferes with the magnetic signal of archaeological deposits, amagnetic-based survey was not conducted as a part of this project.
The RM15 meter has a fixed frame unit (PA-5), with a number of different probe spacing alternatives.Theoretically, the distance between probes is equal to the depth of penetration of the electrical current;hence the reason why the machine possesses different measured probe spaces, providing an array ofdifferent target depths from 0.25 to 2.0 m. A twin-probe array configuration was used for the presentinvestigation. This configuration utilizes a pair of fixed probes within the PA-5 frame connected to a set ofremote probes, creating a complete circuit. The RM15 resistance meter is fully computerized and iscapable of storing 30,000 measurements for later downloading.
The data collection involved the establishment of a 10-x-10-m survey grids at each investigation area.Partial grids were also established at locations where obstacles were present. Grid points werereferenced to surrounding landmarks or recorded with a GPS unit. The final step in preparing theinvestigation area was the creation of a base map of surface conditions within the grids, focusing onabove ground obstructions and depressions. Detailed observations of the surface facilitate more efficientand accurate data collection.
The resistance meter data sets were then collected. Measured ropes marked every 0.25 m were used toguide the RM-15, ensuring proper placement throughout the data collection. The RM-15 resistanceinvestigation was conducted at a transect interval of 25 cm and sampling interval of four measurementsper meter.
A BRIEF HISTORY OF THE EMMANUEL A.M.E. CHURCH
The following summary of the history of the present Emmanuel A.M.E. Church is summarized from thework by Stewart (1944), the Emmanuel A.M.E. Church history, and personal communication with Dr.Newby-Alexander and members of the church. The original church, Monumental Methodist Church, wasbuilt at the Glasgow Street location in 1772. In 1831, the “black codes” were developed as a result of theNat Turner Rebellion. The result was the requirement of separate places of worship for blacks and whites.The white portion of the congregation moved to the Dinwiddie Street Methodist Church and passed theOld Glasgow Church to the members of the black congregation. The Old Glasgow Street Church becameknown as the African Church and served as a place of worship until it mysteriously burned on September26, 1856. The current Emmanuel A.M.E. Church was constructed in 1857. Between the church andGreen Street a two-story parsonage was constructed during the pastorate of Rev. W. G. Alexander(1883-1887) during the late nineteenth century. The parsonage was demolished sometime after the1940s, and no evidence of this structure is presently visible on the ground surface.
RESULTS AND INTERPRETATIONS
The methodology for interpreting the data collected from both the Glasgow Street and North Streetinvestigation areas will rely heavily on three main factors, including standard geophysical theory, site-specific geomorphology, and local historical records.

Archaeo-Geophysical Investigation of the Emmanuel A.M.E. May 18, 2004Church and Former Glasgow Street Location of the Church Page 6Portsmouth, Virginia
Emmanuel A.M.E. Church - North Street Parcel
The lot on which the Emmanuel A.M.E. Church is located is on North Street near its intersection withGreen Street. The church still stands in the original location on which it was constructed in 1857. Theparsonage was located on the west side of the church between the church and Green Street, and wasconstructed during the period of 1883 through 1887 (Figure 3). The parsonage was demolishedsometime after the 1940s. The investigation of this area extended from the short retaining wall along thesidewalk that forms the northern boundary of the lot and extends 30 m to the south, in the vicinity of tireruts that have been formed by church members parking in the area. The church delineates the easternboundary of the investigation area, while the western boundary is defined by another short retaining wallalong the present sidewalk. Three trees currently stand in the center of the area surveyed. Thesouthernmost tree seems old enough to have been living while the parsonage was still standing. The twotrees further to the north are likely located within the footprint of the former parsonage. Ground coverthroughout the parcel consisted of a mowed lawn. The area was generally flat with a few noticeablesurface depressions. A historical marker and a wooden cross are located in the northwest corner of thelot (Figure 4). A fence post was also noted near the center of the grid adjacent to a tree.
Figure 3. Late nineteenth century image of the Emmanuel A.M.E. Church and adjacentparsonage.
Archaeo-Geophysical Investigation of the Emmanuel A.M.E. May 18, 2004Church and Former Glasgow Street Location of the Church Page 7Portsmouth, Virginia
Figure 4. Photograph of the area investigated adjacent to the Emmanuel A.M.E. Church(southeast view).
Archaeo-Geophysical Investigation of the Emmanuel A.M.E. May 18, 2004Church and Former Glasgow Street Location of the Church Page 8Portsmouth, Virginia
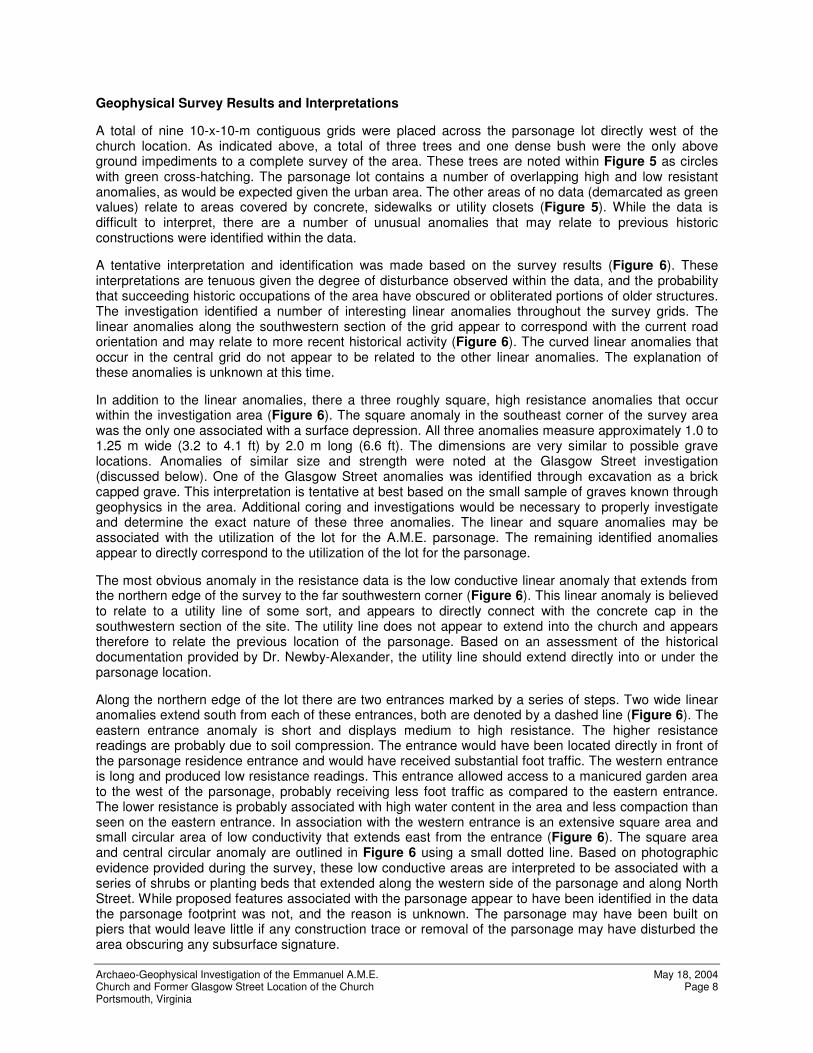
Geophysical Survey Results and Interpretations
A total of nine 10-x-10-m contiguous grids were placed across the parsonage lot directly west of thechurch location. As indicated above, a total of three trees and one dense bush were the only aboveground impediments to a complete survey of the area. These trees are noted within Figure 5 as circleswith green cross-hatching. The parsonage lot contains a number of overlapping high and low resistantanomalies, as would be expected given the urban area. The other areas of no data (demarcated as greenvalues) relate to areas covered by concrete, sidewalks or utility closets (Figure 5). While the data isdifficult to interpret, there are a number of unusual anomalies that may relate to previous historicconstructions were identified within the data.
A tentative interpretation and identification was made based on the survey results (Figure 6). Theseinterpretations are tenuous given the degree of disturbance observed within the data, and the probabilitythat succeeding historic occupations of the area have obscured or obliterated portions of older structures.The investigation identified a number of interesting linear anomalies throughout the survey grids. Thelinear anomalies along the southwestern section of the grid appear to correspond with the current roadorientation and may relate to more recent historical activity (Figure 6). The curved linear anomalies thatoccur in the central grid do not appear to be related to the other linear anomalies. The explanation ofthese anomalies is unknown at this time.
In addition to the linear anomalies, there a three roughly square, high resistance anomalies that occurwithin the investigation area (Figure 6). The square anomaly in the southeast corner of the survey areawas the only one associated with a surface depression. All three anomalies measure approximately 1.0 to1.25 m wide (3.2 to 4.1 ft) by 2.0 m long (6.6 ft). The dimensions are very similar to possible gravelocations. Anomalies of similar size and strength were noted at the Glasgow Street investigation(discussed below). One of the Glasgow Street anomalies was identified through excavation as a brickcapped grave. This interpretation is tentative at best based on the small sample of graves known throughgeophysics in the area. Additional coring and investigations would be necessary to properly investigateand determine the exact nature of these three anomalies. The linear and square anomalies may beassociated with the utilization of the lot for the A.M.E. parsonage. The remaining identified anomaliesappear to directly correspond to the utilization of the lot for the parsonage.
The most obvious anomaly in the resistance data is the low conductive linear anomaly that extends fromthe northern edge of the survey to the far southwestern corner (Figure 6). This linear anomaly is believedto relate to a utility line of some sort, and appears to directly connect with the concrete cap in thesouthwestern section of the site. The utility line does not appear to extend into the church and appearstherefore to relate the previous location of the parsonage. Based on an assessment of the historicaldocumentation provided by Dr. Newby-Alexander, the utility line should extend directly into or under theparsonage location.
Along the northern edge of the lot there are two entrances marked by a series of steps. Two wide linearanomalies extend south from each of these entrances, both are denoted by a dashed line (Figure 6). Theeastern entrance anomaly is short and displays medium to high resistance. The higher resistancereadings are probably due to soil compression. The entrance would have been located directly in front ofthe parsonage residence entrance and would have received substantial foot traffic. The western entranceis long and produced low resistance readings. This entrance allowed access to a manicured garden areato the west of the parsonage, probably receiving less foot traffic as compared to the eastern entrance.The lower resistance is probably associated with high water content in the area and less compaction thanseen on the eastern entrance. In association with the western entrance is an extensive square area andsmall circular area of low conductivity that extends east from the entrance (Figure 6). The square areaand central circular anomaly are outlined in Figure 6 using a small dotted line. Based on photographicevidence provided during the survey, these low conductive areas are interpreted to be associated with aseries of shrubs or planting beds that extended along the western side of the parsonage and along NorthStreet. While proposed features associated with the parsonage appear to have been identified in the datathe parsonage footprint was not, and the reason is unknown. The parsonage may have been built onpiers that would leave little if any construction trace or removal of the parsonage may have disturbed thearea obscuring any subsurface signature.

Archaeo-Geophysical Investigation of the Emmanuel A.M.E. May 18, 2004Church and Former Glasgow Street Location of the Church Page 9Portsmouth, Virginia
Figure 5. Resistance Survey of Parsonage Lot, west of A.M.E. Church onNorth Street.
The green hatched circles mark locations of trees or bushes.Areas of solid green mark areas that were unable to be surveyeddue to surface concrete.

Archaeo-Geophysical Investigation of the Emmanuel A.M.E. May 18, 2004Church and Former Glasgow Street Location of the Church Page 10Portsmouth, Virginia
Figure 6. Resistance Survey of Parsonage Lot, west of A.M.E. Churchon North Street, including interpretations.
The green hatched circles mark locations of trees or bushes.Areas of solid green mark areas that were unable to be surveyeddue to surface concrete.Red dotted lines denote linear anomalies.Red dashed squares denote possible grave locations.Light blue dashed lines denote entrances into parsonage lot.Blue line and square denotes utility line and associated closet.

Archaeo-Geophysical Investigation of the Emmanuel A.M.E. May 18, 2004Church and Former Glasgow Street Location of the Church Page 11Portsmouth, Virginia
Emmanuel A.M.E. Church - Suspected Tunnel Location
Based upon documentary evidence in the form of a slave narrative and an unusual architectural featureinside of the southeast portion of the church, Dr. Newby-Alexander believed that a tunnel that would havebeen part of the Underground Railroad might be present in this area. Additional investigation wasconducted along the southeast corner of the church where the tunnel was suspected. A resistance surveywas conducted in this area with a twin probe array (described above). Modifications to the investigation inthis area involved increasing the spacing of the mobile probes to 1 m separation and increasing thesensitivity of the RM-15 by adjusting the gain and slowing the data logging rate. An area measuring 10 mnorth-south by 2 m east-west was investigated (Figure 7). The grid was bound on the north by a largegray power unit and extended 10 m south to the vicinity of the red door (see Figure 7). Subsequentanalysis of the data collected revealed no evidence of a tunnel or hidden subterranean room that extendsbeyond the foundation of the church in this area (Figure 8).
Figure 7. Southeast corner of the Emmanuel A.M.E. Church - area of suspected tunnel.
Geophysical Survey Results and Interpretations
As indicated above the resistance results provided no evidence of a linear anomaly extending from thechurch toward the parking lot as would be expected if a tunnel or ditch extended out of the church in thislocation (Figure 8). While there are some smaller anomalies, these probably represent constructiondisturbance from one of the number of building episodes that have taken place within the area.

Archaeo-Geophysical Investigation of the Emmanuel A.M.E. May 18, 2004Church and Former Glasgow Street Location of the Church Page 12Portsmouth, Virginia
Figure 8. Resistance Survey of side lot, east of theEmmanuel A.M.E. Church on North Street.
The survey extended from the rear door north to theelectrical box, pictured in Figure 6 and east from theedge of the church to the current parking lot.
Emmanuel A.M.E. Church
Electrical box
Rear Door,Southeasterncorner ofchurch
Parking Lot

Archaeo-Geophysical Investigation of the Emmanuel A.M.E. May 18, 2004Church and Former Glasgow Street Location of the Church Page 13Portsmouth, Virginia
Glasgow Street Church Parcel
The former location of the Glasgow Street Church is located on the south side of Glasgow Street,between Dinwiddie and Court Streets (Figure 9). The area in which the former church was located iscurrently used as a small neighborhood park. During the twentieth century, a reinforced concrete pad wasconstructed on a portion of this lot and a Quonset hut was built at this location. The Quonset hut and theassociated concrete were recently removed. Following the removal of the concrete, archaeologists fromthe Virginia State Archaeologist’s office conducted investigations at the Glasgow Street Church location.A historic burial location was discovered in the area that was formerly covered by concrete. The brickand/or stone covered burial was identified approximately 15-20 cm below the present ground surfaceduring the excavation of a 50-x-50-cm unit. The burial was not removed and the unit was backfilled. Thelocation of the unit was still evident at the time of the geophysical investigation.
Figure 9. Resistance survey at the former Glasgow Street Church site (south view).
Geophysical Survey Results and Interpretations
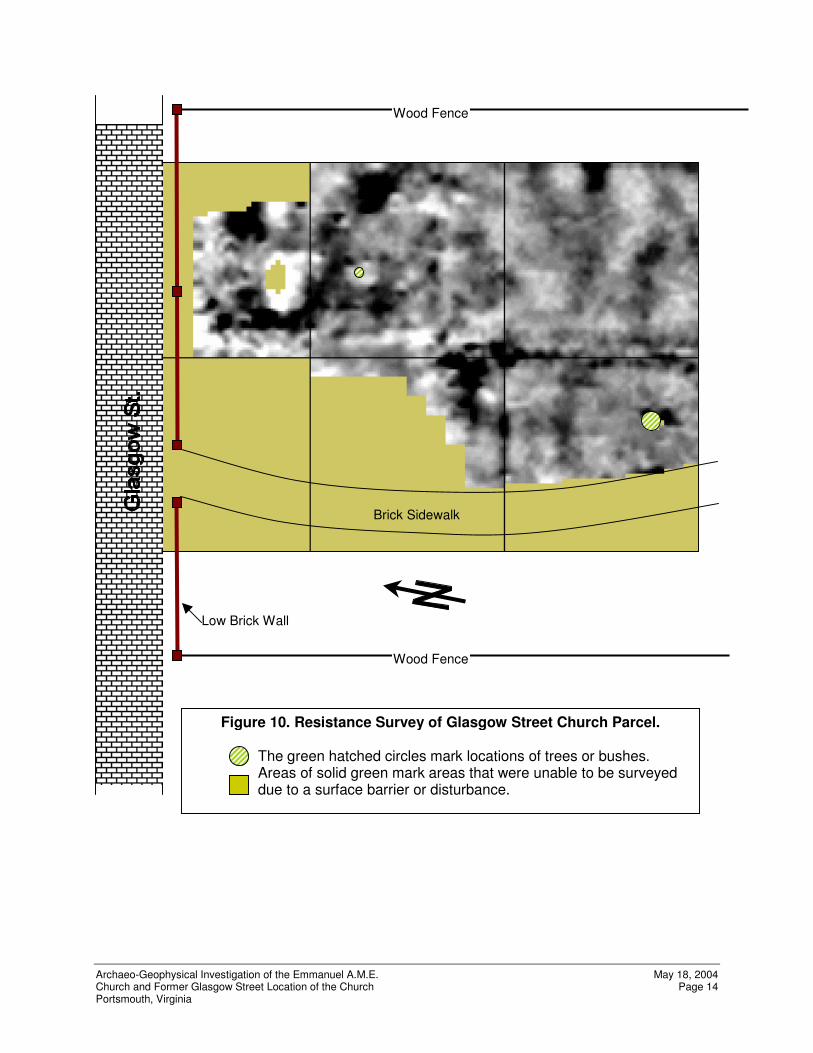
As with the survey of the parsonage area along North Street, the area of the Glasgow Street church hasexperienced a substantial level of disturbances. Based on the number of overlapping high and lowresistant anomalies, this is to be expected given the location in the heart of a well established urban area.A single tree, denoted by a green hatched circle, was the only obstruction within the grid that hindereddata collection. The areas of no data (demarcated as green values) relate to areas that were notsurveyed due to disturbance or surface barriers (Figure 10). Although disturbance levels were high, someprobable cultural anomalies were identified within the data.
Archaeo-Geophysical Investigation of the Emmanuel A.M.E. May 18, 2004Church and Former Glasgow Street Location of the Church Page 14Portsmouth, Virginia
Figure 10. Resistance Survey of Glasgow Street Church Parcel.
The green hatched circles mark locations of trees or bushes.Areas of solid green mark areas that were unable to be surveyeddue to a surface barrier or disturbance.
Wood Fence
Low Brick Wall
Brick Sidewalk
Wood Fence
Archaeo-Geophysical Investigation of the Emmanuel A.M.E. May 18, 2004Church and Former Glasgow Street Location of the Church Page 15Portsmouth, Virginia
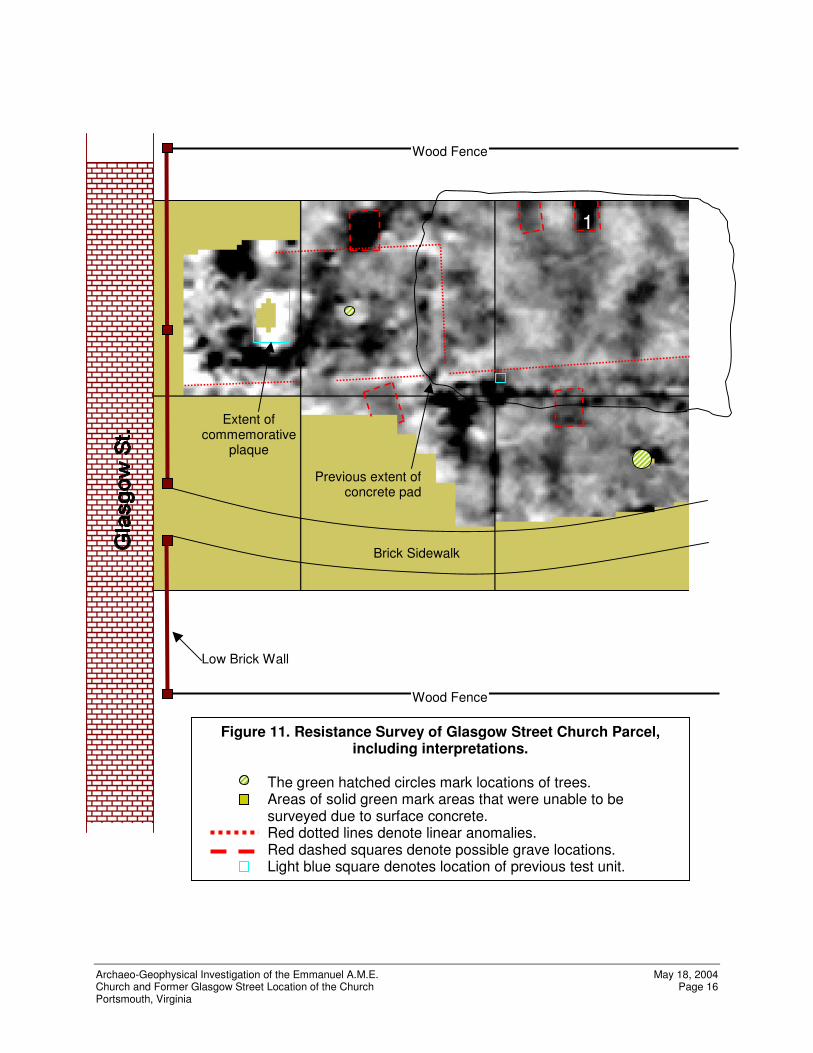
A tentative interpretation and identification of the anomalies was made based on the survey results(Figure 11). These interpretations are tenuous given the degree of disturbance observed within the data,and the probability that succeeding historic occupations of the area have obscured or obliterated portionsof older construction activity. Unlike the interpretations offered for the Emmanuel A.M.E. parsonage lot,there has been some archeological excavations conducted by the State Archaeologist within the GlasgowStreet parcel. One of the excavations identified a brick capped grave located along the eastern side of thelot. This burial is shown as a high resistant anomaly along the eastern edge of the survey grid, labeled asgrave 1, shown in Figure 11. The second test unit is denoted as a small light blue square (Figure 11). Inaddition to this specific ground-truthed burial, additional roughly rectangular anomalies were identifiedwithin the data. These anomalies, denoted by dashed red squares, are also believed to be graves, somethough do not appear to have been capped given the reduced resistance strength noted within the data(Figure 11). Some of these possible graves run perpendicular to the linear anomalies identified in thedata.
These linear anomalies, denoted by dotted red lines, may relate to the walls of the original church locale(Figure 11). These linear anomalies are not consistent across the entire length of the lot. The lack ofcontinuity probably relates to obliteration of the possible wall foundations by later utilization of the lot. Thepossible grave locations run up to, and perpendicular to, the possible church walls. The placement issimilar to graves noted at the present Church location on North Street. This similarity may help to furthercorroborate the evidence that these rectangular anomalies are in fact historic grave locations. As with theparsonage data, these interpretations are tentative based on the small sample of graves known throughgeophysics in the area. Additional coring and investigations would be necessary to properly investigateand determine the exact nature of these rectangular anomalies.
SUMMARY AND RECOMMENDATIONS
Intriguing results were obtained at the present Emmanuel A.M.E. Church and at the former GlasgowStreet church site. Additional archival research as well as ground-truthing of the anomalies would serve tofurther refine the interpretations presented above. Prior to the commencement of ground disturbingactivities, archaeological investigation may be necessary. At a minimum, any known graves or probablegrave locations identified by the geophysical data should be investigated, relocated, or avoided, inaccordance with state, local, and Federal laws.
Archaeo-Geophysical Investigation of the Emmanuel A.M.E. May 18, 2004Church and Former Glasgow Street Location of the Church Page 16Portsmouth, Virginia
Wood Fence
Wood Fence
Brick Sidewalk
Low Brick Wall
Previous extent ofconcrete pad
Extent ofcommemorative
plaque
Figure 11. Resistance Survey of Glasgow Street Church Parcel,including interpretations.
The green hatched circles mark locations of trees.Areas of solid green mark areas that were unable to besurveyed due to surface concrete.Red dotted lines denote linear anomalies.Red dashed squares denote possible grave locations.Light blue square denotes location of previous test unit.Blue line and square denotes utility line and associated closet.
1

Archaeo-Geophysical Investigation of the Emmanuel A.M.E. May 18, 2004Church and Former Glasgow Street Location of the Church Page 17Portsmouth, Virginia
REFERENCES CITED
Bevan, B. 1983 Electromagnetics for mapping Earth Features. Journal of Field Archeology, 10(1): 47-54.
Carr, C. 1982 Handbook on Soil Resistivity Surveying. Center for American Archeology Press, Evanston, Illinois.
Clark, A.1996 Seeing Beneath the Soil: Prospecting Methods in Archaeology. B.T. Batsford Ltd,London.
Hasek, V.1999 Methodology of Geophysical Research in Archaeology. BAR International Series 769.British Archaeological Reports, Oxford.
Scollar, I., A. Tabbagh, A. Hesse and I. Herzog1990 Archaeological Prospecting and Remote Sensing. Cambridge University Press,Cambridge UK.
Stewart, C.1944 The African Society becomes Emmanuel A.M.E. Church. Guide Quality Press: Norfolk,VA.
Weymouth, J.W.1986 Geophysical Methods of Archaeological Site Surveying. In Advances in ArchaeologicalMethod and Theory, edited by M.B. Schiffer, pp. 311-396. Academic Press, New York.
Various excerpts from the history of the Emmanuel A.M.E. Church recorded by past pastors andother members of congregation. Original Manuscripts on file at the Emmanuel A.M.E. Church.