Embed Size (px)
Citation preview

ArcGIS Pro:
Working with Temporal DataNathan Shephard
Stephen Heidelberg

Types of Temporal Data
Moving
Features
• Airplanes, boats,
vehicles
• People, animals
• Storm centers
Discrete
Events
• Crimes
• Accidents
• Earthquakes,
lightning strikes,
volcanic events
Stationary
Recorders
• Weather stations
• Traffic sensors
• Stream gauges
Change &
Growth
• Demographics
• Fire perimeters
• Flood extents
• Country Boundaries

The nature of temporal data
• Conceptualizations of time can vary
- Linear (directional)
- Each moment is unique, time moves forward
- Eg: Purchase of a home
- Cyclic (repeating)
- Moments are repeated, time loops back around
- Eg: Daily feeding schedule at a zoo
• ArcGIS assumes that time is linear
http://www.businessinsider.com/how-different-cultures-understand-time-2014-5
Start
Middle

The nature of temporal data
• Time is relative to something
- Clock-driven time
- “On Jan 10th, 1990, at 11.00am, …” (Gregorian Calendar, UTC)
- Hourly water temperatures
- Crime occurrences
- Event-driven time
- “At T-minus 10 minutes, …”
- Days since a specific earthquake
- Planning / conducting a military exercise
- State-driven time
- “2 seconds after the vehicle stops, …”
- Automated factory scheduling
- Melting of ice sheets
http://www.businessinsider.com/how-different-cultures-understand-time-2014-5

The nature of temporal data
• Temporal data can be:
- A moment
- Information is captured / defined for a specific point in time
- Described as a single time-value
- Eg: The exam starts at 9.00am
- A duration
- Information is captured / defined for an interval of time
- Can be described as either [start-time + length-of-time] or [start time + end-time]
- ArcGIS Pro requires the latter storage format
- Eg: The exam lasts for 90 minutes; or The exam ends at 10.30am
http://www.businessinsider.com/how-different-cultures-understand-time-2014-5
Moments
Duration
Moment
Duration

The nature of temporal data
• The frequency of data collection can be:
- Regular
- Data values are collected at a constant rate
- Eg: Hourly GPS positions from a vehicle tracker
- Eg: A 10-year census
- Irregular
- Data values are collected on indeterminate events, or whenever required
- Eg: The occurrence of crimes
- Eg: Changes in political boundaries
http://www.businessinsider.com/how-different-cultures-understand-time-2014-5
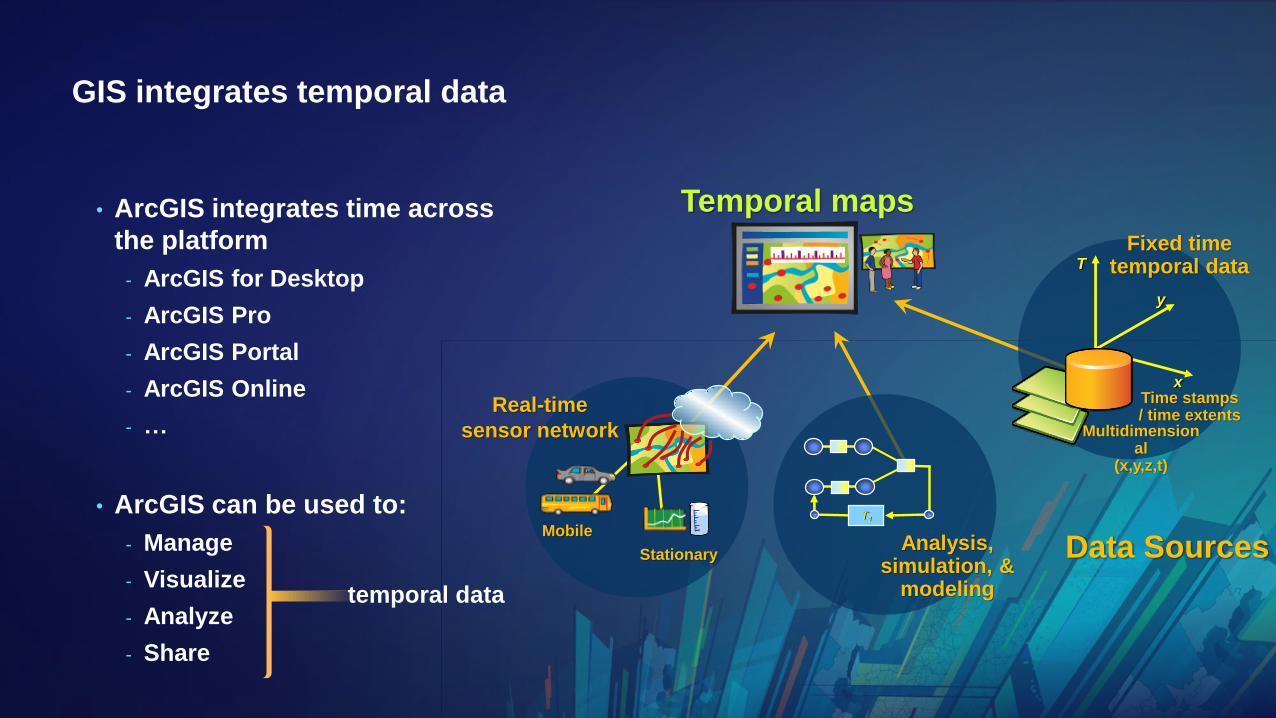
GIS integrates temporal data
• ArcGIS integrates time across
the platform
- ArcGIS for Desktop
- ArcGIS Pro
- ArcGIS Portal
- ArcGIS Online
- …
• ArcGIS can be used to:
- Manage
- Visualize
- Analyze
- Share
T1
Analysis, simulation, &
modeling
Fixed time temporal data
Temporal maps
Stationary
Mobile
Real-time
sensor network
x
y
T
Multidimensional
(x,y,z,t)
Time stamps / time extents
Data Sources
temporal data

A quick note
This session covers:
- Structuring…
- Visualizing…
- Sharing…
…Temporal Data in ArcGIS Pro
• Not:
- Analyzing, Editing, Generating Space-Time Cubes, …

Structuring temporal data

Supported data storage types
• Data that can be presented as tabular rows
- Feature layers
- Mosaic datasets
- NetCDF layers
- Tables
- Raster catalogs
- Tracking layers / Stream layers
- Network dataset layers with traffic data
• Plus service layers with historical content and updating data feeds

Storing temporal values – best practice
• Store time values in a date field
- A field type that stores dates, times, or dates-and-times
- Supports more sophisticated database queries
- Easiest to configure on the layer
- * Note: we will cover using ‘Range’ (numbers) for time values later
• Store temporal data in row format
- Pro filters tabular content by rows
- Each time-aware data entry should be a single record/row
• Index the date field
- Interactively filtering rows means many database queries
• Consider storing date values in UTC or GMT
- If your data covers multiple time zones, ‘10am’ becomes unreliable

When data comes from across multiple time zones…?
• Pro does integrate, and allow for, data across different time zones
• The map has a time zone (values shown on the Time Slider)
• A layer has a time zone, and all values must be for the same time zone
• Ensure all values in the layer are in the same time zone
- Use the Convert Time Zone GP tool, as needed
- Adjusts the rows’ time values (in a date field)
from one time zone to another
• Tip: Convert to standard time (UTC1 or GMT2)- Avoid issues with daylight savings time
1 Coordinated Universal Time2 Greenwich Mean Time

When temporal values are not in Date format…?
• Convert values into a date field type
- Use the Convert Time Field GP tool
- Converts Text/Number fields into a new Date field
- “July 09, 2016” 07/09/2016 MM/DD/YYYY
- You can define a custom text format, if needed
• The tool allows other time conversions

When temporal values are stored across multiple columns…?
• Expand the data into one time-stamp per row
- Use the Transpose Fields GP tool
- Shifts data stored in columns into individual rows
- Geometry shapes are duplicated
- Choose which other fields are brought across

When you need durations between events…?
• Pull the next row’s time-value into the current row
- Use the Calculate End Time GP tool
- Populates an end time field with the next record’s start time
- The last record duplicates its start and end times
Result

Modeling data… as separate rows (best general interaction)
• Each row contains all feature values, regardless of which ones change
- Pros: anything can change per row (including shape), simple to configure, one table
- Cons: potential for significant duplicated content
• Well-suited for:
- Moving objects, like vehicle tracking
- Changing polygonal areas, like fires boundaries

Modeling data… using a joined table (optimal database method)
• A primary table, with a one-to-many join to a time-centric data table
- Pros: optimized data storage, decide which values update, not hard to configure
- Cons: multiple tables, slower general performance
• Well-suited for:
- Stationary objects, like stream-gauge monitoring devices
- Mostly-static polygonal areas, like parcels to a tax assessment table

Modeling temporal data… using Range (for numeric values)
• Same rules as previous, but values are stored as numbers (instead of dates)
• Can save needless conversion to Date format
• Well-suited for:
- Event-driven sequential data, like “contamination levels each hour after the spill”
- Huge time extents, like “tectonic plate movement across 100 million years”
- “Stop-motion” style animation
(using interpolated positions)

Visualizing temporal data

Visualizing temporal data in ArcGIS Pro – two steps
1. Configure time data properties for each layer
- Specify which field/s drive time
- Set the layer’s full time extent
- Indicate a refresh rate for live feed data
- Set the time zone
2. Set the current time extent for the map
- The map has a well-defined temporal extent (and timezone)
- Use the interactive slider to change the map time
- Use the time step for regularly-captured time data
The time slider automatically appears with time-enabled layers (and range)
Layer
Field
Format
Extent
Zone
Rate

DemoTemporal data in ArcGIS Pro
- Import MXD workflow
- Configuration of the time slider
- Using Range instead of Time

Modeling data in Mosaic Datasets
• Mosaic datasets are like a table of raster images
- The table can contain date field/s
- Common in long-term aerial imagery capture
- Also common for storing analysis results through time
• They act just like feature data stored as separate rows
• Open the Mosaic dataset table from the Footprint layer

Modeling data from NetCDF layers
• NetCDF is a file format for spatio-temporal data
- Contains multiple dimensions (x, y, z, t)
- Often has many variables (temp, pressure, salinity, …)
• Time values are (often) available as a dimension
• Author the NetCDF Layers to include the time dimension
- You can author feature or raster layers from NetCDF
• They act just like feature data stored as separate rows
X
Y

DemoNetCDF Data

Sharing temporal data

A variety of ways to share temporal visualizations
• As a time-enabled web map
- TIP: Publish time-aware web maps from Pro (instead of per-layer in 10.x)
- Open Pro, import an mxd, and publish the web map directly
- Extra tip: Replace the basemap (to avoid group layers)
• As time-enabled image services (Portal only)
• As an animation / video
• As a series of exported images
• As a temporal map book
• As “small multiples” on a single layout
• As map or layer packages

Create web map services
• Map services preserve the time information from time-enabled layers
- Used to query and display content (with the time slider)
• Example temporal web maps:
- Atlantic Storms (1993-95)
- Imported an MXD, updated the basemap, publish
- One year of ice pack imagery (North Pole)
- Time-aware aerial imagery

DemoTime-aware web maps
Using Z for time (space-time cube)
Authoring Temporal Animations
- Introduction to keyframing

DemoAuthoring Temporal Animations
- Telling a GIS story
- Using time and range
- Adding information & overlays
- Using dynamic text elements

Please Take Our Survey on the App
Download the Esri Events
app and find your event
Select the session
you attended
Scroll down to find the
feedback section
Complete answers
and select “Submit”

• @NathanCShephard
• @SteveHeidelberg
Questions???