Embed Size (px)
Citation preview


Vivek Sharma Group Program Manager, Exchange Datacenter Microsoft
Behind the Curtain: How we run Exchange Online
ARC301

Setting some context…all the things we can (or not) share

This is not a marketing or a sales session! Not here to push anyone to the cloud
—simply sharing the journey as we know you all love Exchange, technology and are keeping a watchful eye on where the cloud is heading
Feedback was overwhelmingly positive from last MEC
Good news is: we’re going to show you even more about how Exchange Online runs at massive scale
Bad news is: yep, a lot of what we’ll show you is engineering-cloud-stuff—not directly applicable to on-premises
Caveats (this is the slide they make us put in)
We are going to try and show you details • Including technology which only lives @ Microsoft • Process and culture • Technology backing the service
Some of these are outside the Exchange product, are only used within Microsoft
Some points will be necessarily vague or omitted altogether, e.g. • HW/Vendor: we cycle through a LOT of gear from a variety of vendors• Interdependent systems that do not exist in the enterprise product • Exact numbers of things—always changing, easily misinterpreted
BUT…
EXACT DETAILS NOT AVAILABLE

Exchange Online Scale#’s, figures and all such things

The Evolution of Online
Hands-on, manual
Issues can be fixed by a few people
On-premises as the base
Atomically automated, human orchestrated
Issues often span areas, teams, individuals
Tweak architecture to match usage
Machine orchestrated
Dev == Ops. Everyone fixes.
Architecture is forward-looking
100K – 1M+
~250+
Every year
1M – 10M+
~2000+
5-6x a year
100M – 1B+
~100,000+
Every week
GLOBAL SCALECOUNTRY SCALECITY SCALE
we are here

Everything changes at global scaleFrom
Turnkey software (SCOM, Windows, SQL) Generalist workforce Small failure domainsErrors that can be ignored or dealt with later Easier to scale to customer issues
To
Highly customized, purpose driven automation Specialists owning their piece of the puzzle e2e Potentially HUGE failure domains .01% error rate at 1B daily transactions is HUGE Every action has consequences to vast number of users Everything eventually breaks, we have to continuously (re)invent
Chicago
Cheyenne
DublinAmsterda
m
Hong Kong
Singapore
San Antonio
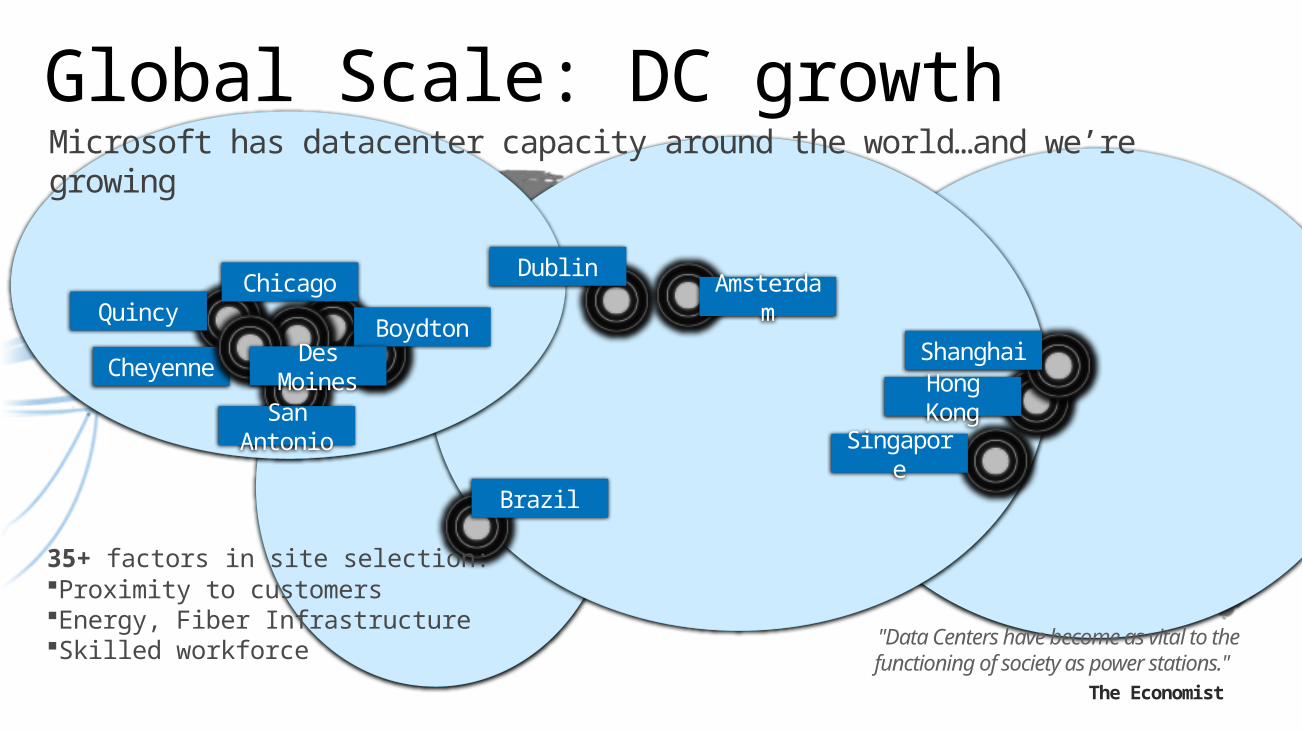
Microsoft has datacenter capacity around the world…and we’re growing
BoydtonShanghai
Quincy
Des Moines
Brazil
35+ factors in site selection:Proximity to customersEnergy, Fiber InfrastructureSkilled workforce "Data Centers have become as vital
to the functioning of society as power stations."
The Economist
Global Scale: DC growth

Global Scale: Capacity growth
7/1/2012 9/21/2012 11/10/2012 1/9/2013 2/15/2013 4/5/2013 5/21/2013 7/5/2013 8/9/2013 9/19/2013 11/1/2013 1/9/2014
# of servers running Exchange Online from Aug 1st, 2012 to now—600% growth
Likely hitting (another) “hockey stick” in growth

Global Scale: Transaction growth
1/1/
2014
1/5/
2014
1/9/
2014
1/13
/201
4
1/17
/201
4
1/21
/201
4
1/25
/201
4
1/29
/201
4
2/2/
2014
2/6/
2014
2/10
/201
4
2/14
/201
4
2/18
/201
4
2/22
/201
4
2/26
/201
4
3/2/
2014
3/6/
2014
3/10
/201
4
3/14
/201
4
3/18
/201
4
3/22
/201
40
1000000000
2000000000
3000000000
4000000000
5000000000
6000000000
7000000000
8000000000
9000000000
End user authentication transactions went from 5 billion to 8 billion (62%) in just last three months
(Some of it was self-inflicted)
Our product and service infra has to handle spikes and unexpected growth

Global scale: Transforming our technology
Office365.com
Our surface area is too big/partitioned to manage sanelyService management is largely done via our Datacenter Service Fabric
North America 1 North America n Europe 1
DATA
CEN
TER
AU
TO
MATIO
N

All of it boils down to three pillars
DataDriven
Secure
Automated
Big DataExternal SignalsSystem Signals
AccessApprovalAuditingCompliance
ChangesSafety
OrchestrationRepair
We simplify by focusing all our work along the three pillars—these work in tandem to create a great service fabric
Allows us to create a virtuous automation system that is SAFE, DATA DRIVEN while being AGILE at very high scale
Machine Learning

Zoom in: our Service Fabric
…is made up of a lot of stuff
Orchestration Central Admin (CA), the change/task engine for the service
Deployment/Patching Build, System orchestration (CA) + specialized system and server setup
Monitoring eXternal Active Monitoring (XAM): outside in probes, Local Active Monitoring (LAM/MA): server probes and recovery, Data Insights (DI): System health assessment/analysis
Diagnostics, Perf Extensible Diagnostics Service (EDS): perf counters, Watson (per server)
Data (Big, Streaming)
Cosmos, Data Pumpers/Schedulers, Data Insights streaming analysis
On-call Interfaces Office Service Portal, Remote PowerShell admin access
Notification/Alerting Smart Alerts (phone, email alerts), on-call scheduling, automated alerts
Provisioning/Directory
Service Account Forest Model (SAFM) via AD and tenant/user addition/updates via Provisioning Pipeline
Networking Routers, Load Balancers, NATs
New Capacity Pipeline
Fully automated server/device/capacity deployment
DATA
CEN
TER
AU
TO
MATIO
N

Demo
Visualizing Scale

Data Driven
using signals to improve the service via our “Data Insights Engine”

Multi-signal analysis
Data driven automationConfidence in data
communicate
snooze
recover
block
A
U
T
O
Evolution of monitoring

Data Insights Engine
Has to process 100-500 million events/hour—and growing every day
Highly purposed to collect, aggregate and reach conclusions
Built on Microsoft Azure and SQL Azure
Uses latest streaming tech similar to storm, spark
DI Pipeline

Signals: Outside-In monitoring
PARTITION PARTITION
Office365.com
Each scenario tests each DB WW ~5mins—ensuring near continuous verification of availability
From two+ locations to ensure accuracy and redundancy in system
250 million test transactions per day to verify the service
Synthetics create a robust “baseline” or heartbeat for the service
NETWORK NETWORK NETWORK NETWORK

Signals: Usage based Aggregated error signals from real service usage
Tells us when something is wrong at the user/client level
Allows us to catch failure scenarios that we didn’t anticipate

Build confidence via multiple signals
If something is happening across many entities/signals, then it must be true
Apply “baseline” from outside-in as a source of truth
If each signal has reasonability fidelity—you get ~100% accuracy
We use this technique to build “Red Alerts”

+’ing these signals lets us triangulate
Combining signals, errors and scopes we can tell what is wrong and where
Dramatically reduces MTTR as no one has to fumble around for root cause
Allows automated recovery—with high confidence comes incredible power

Anomaly detection via machine learning
Deviation from normal means something might be wrong99.5% and 0.5% historical thresholds
Moving Average +/- 2 Standard Deviations
Methodology for data computed

Auto-posting to health dashboard4:46 PM is when the alert was raised
This is 4:46 PM!
Allows us to inform customers in real-time
Keeps engineers focused on recovery
Improves transparency with support and others who keep customers happy

Demo
Signal Analysis

Action
doing work @ massive scale via “Central Admin” (CA)

All actions through “CA” Why? Changes can be easily destructive, specially if done directly by humansSolution: conduct all actions via a safe, reliable, high throughput system
Central Admin is essentially the “brain” operating the service
Engineers express intent to CA via code (C# “workflows”) or PowerShell • Engine then safely applies change
across the desired scopes• Data from DI Pipeline informs CA to
ensure safety
CAPACITY

CA at work: workflows for service mgmt.
All actions are built using ‘workflows’, e.g. deployment, repair, recovery, patching
Even higher order work is done in CA, e.g. rebalance a DAG automatically
Every month we run ~50 million workflows. The system is robust enough to handle failures without human intervention

Let’s talk about a more complex workflow
View of various stages of adding new capacity to the service

New Capacity Pipeline
Using the systems approach, we shrunk months to DAYS to add new capacity
Pipeline built on CA and rich Data systems, including DI for “service green-lighting”

But even after capacity, work doesn’t end
We fix/replace 10K or more HW issues every month
Repair == detect + triage + ticket + track completion + bring back to service
HDD, Controllers are top issues—for good reason, that’s where the bulk of the hard work is happening

Speaking of repair… “Repairbox” Specialized CA WF that scans and fixes variety of service issues• Consistency checks (e.g. member of the right
server group) • HW repair (automated detection, ticket opening
and closing) • NW repair (e.g. firewall ACL) • “Base config” repair such as hyper-threading
on/off
Our solution to scale along with number of servers, deal with stragglers etc.
Live Capacity
New Capacity Total
Issue
HyperThreading 398 44 442
HardDisk 195 30 225
PPM 105 105
WinrmConnectivity 96 1 97
Memory 53 10 63
HardDiskPredictive 39 14 53
Motherboard 41 2 43
NotHW 34 4 38
DiskController 28 9 37
PowerSupply 16 6 22
CPU 9 13 22
OobmBootOrder 19 2 21
Other 18 3 21
ILO IP 12 4 16
ILO Reset 14 2 16
Fan 10 3 13
NIC 9 2 11
InventoryData 4 2 6
NIC Firmware 5 5
ILO Password 1 4 5
OobmPowerState 5 5
Cache Module 4 1 5
High Temp 2 1 3
PSU 2 2
Cable 1 1
Spare 1 1
Total 1120 158 1278
Tickets Opened: 1278
Tickets Closed: 1431
Tickets Currently Active: 196
% Automated Found: 77% Average time to complete (hrs): 9.43
95 Percentile (hrs): 28.73

Repairs: software 1) Run a simple patching cmd to initiate
patching: Request-CAReplaceBinary2) CA creates a patching approval request
email with all relevant details 3) CA applies patching in stages (scopes)
and notifies the requestor4) Approver reviews scopes and determines
if the patch should be approved5) Once approved, CA will start staged
rollout (first scope only contains 2 servers)
6) CA moves to the next stage ONLY if the previous scope has been successfully patched AND health index is high
7) Supports “Persistent Patching” mode

Network: it’s a precious resource
Network failures are the worst to troubleshoot/fix• Seen everything from ISP/peering failures, cable cuts (freeze!), network
gear failing due to software bugs Our job is to try and get ahead of failures and/or fix fast via failovers. We automatically failover for NAT or VIP failures—no human involved

Network: glue b/w capacity and users Old network design…
Large failure domains results in huge impact when things go wrong
Double-triple redundancy without much more gain, and lot more cost
Dedicated network design—not shared with anyone!
Remove any extra hops that don’t add anything useful
Application specific logic like NATs embedded in each rack
Load Balancer Load Balancer
Host (Multiple Properties)
L2 Agg L2 Agg
L2 Hosts L2 Hosts L2 Hosts
FirewallFirewall
AR (L3) AR (L3)
Core
10G Routed10G Dot1Q1G or 10G Dot1Q1G Dot1Q1G Routed
To new:

Demo
Capacity Management

Putting it all together
Making engineers responsible and responsive

Our Service PhilosophyPrinciples: • Engineering first—processes help but are
not the only solution • High emphasis on MTTR across both
automated and manual recovery • Use of automation to “run” the service
wherever possible, by the scenario owners
• Direct Escalation, Directly Responsible Individual as the default model
• Low tolerance for making the same mistake twice
• Low tolerance for “off the shelf” solutions to solve core problems
• Bias towards customer trust, compliance and security
All of this backed by rigorous, hands on attention to the service by entire team • MSR (Monthly Service Review –
scrutiny on all service aspects) • Weekly IM hand-off (managers)• Monthly Service Readiness review
(track customer satisfaction) • Component level hand-offs,
incident/post-mortem reviews (everyone)
What we are today is a mix of experimentation, learning from others and industry trends (and making a lot of mistakes!)

Product Team
Our “DevOps” modelTraditional
IT •Highly skilled, domain specific IT (not true Tier 1)•Success depends on static, predictable systems
Service IT•Tiered IT•Progressive escalations (tier-to-tier)•“80/15/5” goal
Direct Support
•Tier 1 used for routing/escalation only•10-12 engineering teams provide direct support of service 24x7
DevOps•Direct escalations•Operations applied to specific problem spaces (i.e. deployment)•Emphasize software and automation over human processes
Service
Operations
Service
Tier 2 Operations
Tier 1 Operations
Product Team
Service
Tier 1 Operations
Service
Pro
du
ct
Team
Op
era
tion
s
Software Aided Processes
Su
pp
ort
Oth
erProduct
Team
we are here

Roles and responsibilitiesOn-call Engineers: everyone is expected to be on-call across PM, Dev, Test, SE
Incident Managers: Team managers are expected to act as senior individuals as needed for incidents
SLT Rotation: “exec IMs” for when customers are impacted
Communications Management: updates comms to customer portal, conduit between support and engineering
September People Impact1. 176 unique on-calls were paged2. 33 of them got > 15 pages (40% of pages)3. 30 got >= 8 and <= 15 (35%)4. 113 < 8 pages (15% of pages)

Incident ManagementAll about managing the heat of the moment—doing the right things at the right time
IMs get paged automatically to:• Find the right people to work on a problem• Make sure recovery is priority 0 • Keep everyone focused and sane • Being accountable for making decisions under
pressure
Incident Protocol is a set of customer centric guidelines for each IM • Classification of incident types • Rules of engagement • SLA and other customer promises

Demo
On-call, escalations etc.

Hello from the team!
NETWORKING
DIRECTORY, SECURITY, PROVISIONING
CA, CAPACITY
INSIGHTS, MONITORING

We are here to serve youThe investments we make allow us to continuously improve the service for everyone
We have virtuous cycles in place to learn from any issues, prevent them in the future
Any technology that makes core Exchange better (scale, auto-healing, features) are shipped to on-premises
Core product/on-premises sees more validation at higher stress on an ongoing basis
We are always looking for feedback—mail: [email protected]

1. Go to the Pre-Release Programs Booth
2. Tell us about your Office 365 environment/or on premises plans
3. Get selected to be in a program
4. Try new features first and give us feedback!
Start now at:http://prereleaseprograms-public.sharepoint.com/
Pre-Release Programs TeamBe first in line!


© 2014 Microsoft Corporation. All rights reserved. Microsoft, Windows and other product names are or may be registered trademarks and/or trademarks in the U.S. and/or other countries.The information herein is for informational purposes only and represents the current view of Microsoft Corporation as of the date of this presentation. Because Microsoft must respond to changing market conditions, it should not be interpreted to be a commitment on the part of Microsoft, and Microsoft cannot guarantee the accuracy of any information provided after the date of this presentation. MICROSOFT MAKES NO WARRANTIES, EXPRESS, IMPLIED OR STATUTORY, AS TO THE INFORMATION IN THIS PRESENTATION.