Embed Size (px)
Citation preview

ARC STORMSURGE: INTEGRATING HURRICANE STORM SURGE MODELING AND GIS1
Celso M. Ferreira, Francisco Olivera, and Jennifer L. Irish2
ABSTRACT: Arc StormSurge is a data model that integrates geographic information systems and the hurricanewave and surge model SWAN+ADCIRC, which is the coupling of the Simulating WAves Nearshore (SWAN)wave model and the Advanced Circulation (ADCIRC) hydrodynamic model. The Arc StormSurge data model is ageodatabase, which is a relational database that can contain georeferenced information. It includes feature clas-ses in feature datasets and tables, all related among them through relationship classes, and raster catalogs andgrids. In addition to the data model schema, Arc StormSurge includes a number of pre- and post-processing toolsthat help integrate spatial data and numerical modeling. As an illustration, Arc StormSurge was used tosupport the modeling of Hurricane Bret, which made landfall in the Corpus Christi area in Texas in 1999. Byusing Arc StormSurge, it was possible to take advantage of already available geo-referenced information (e.g.,base maps, land cover datasets, and monitoring station locations) for the model setup, and for identifying spatialpatterns in the model results by presenting them in map format.
(KEY TERMS: flooding; hydrodynamics; geographic information system; simulation.)
Ferreira, Celso M., Francisco Olivera, and Jennifer L. Irish, 2013. Arc StormSurge: Integrating HurricaneStorm Surge Modeling and GIS. Journal of the American Water Resources Association (JAWRA) 50(1): 219-233.DOI: 10.1111/jawr.12127
INTRODUCTION
Hurricanes are a major cause of loss of human lifeand property in many coastal cities around the world.In the United States (U.S.), in particular, coastalflooding caused by hurricanes has been one of themost costly natural disasters totaling approximately$370 billion dollars in the last 20 years (Lott andRoss, 2006). It is therefore essential to accurately pre-dict storm surges to assess an area’s flood risk andplan to minimize their impact.
Historical records of storms are too short and toosparse to support reliable statistical predictions ofhurricane surge levels; thus, numerical analysis is
used for simulating and predicting flooding in coastalareas. In recent years, improvements in the under-standing of the physics of storm surge processes haveled to the development of computationally intensehydrodynamic models capable of estimating hurricaneflood elevations (Resio and Westerink, 2008). How-ever, developing the input to these models requires asignificant amount of data and conversion to a model-specific format, and, usually, the model output is notin a format ready for interpretation and for conveyingthe findings to the public and decision makers. Inthis context, geographic information systems (GIS)can play an important role in pre- and post-process-ing spatial information and supporting input/outputvisualization.
1Paper No. JAWRA-12-0228-P of the Journal of the American Water Resources Association (JAWRA). Received October 31, 2012; acceptedJuly 24, 2013. © 2013 American Water Resources Association. Discussions are open until six months from print publication.
2Respectively, Assistant Professor (Ferreira), Department of Civil, Environmental and Infrastructure Engineering, George Mason Univer-sity, 4400 University Drive, MS 6C1, Fairfax, Virginia 22030; Associate Professor (Olivera), Department of Civil Engineering, Texas A&MUniversity, College Station, Texas 77843; and Associate Professor (Irish), Department of Civil and Environmental Engineering, VirginiaTech, Blacksburg, Virginia 24061 (E-Mail/Ferreira: [email protected]).
JOURNAL OF THE AMERICAN WATER RESOURCES ASSOCIATION JAWRA219
JOURNAL OF THE AMERICAN WATER RESOURCES ASSOCIATION
Vol. 50, No. 1 AMERICAN WATER RESOURCES ASSOCIATIONFebruary 2014

This article discusses the development of an Arc-GISTM data model and a set of tools for the coupledADvanced CIRCulation and unstructured-grid versionof Simulating WAves Nearshore (SWAN+ADCIRC)hydrodynamic and wave models, respectively (Dietrichet al., 2011). An automated file conversion betweenArcGISTM and the model formats is used to ease thepreparation of the input files. Visualization of theresults is accomplished through maps, generatedautomatically with ArcGISTM. As part of this workingframework, we propose the use of a geodatabase spe-cifically designed to store the spatial informationneeded for modeling storm surges with SWAN+ADCIRC. An example of the application of our frame-work to the simulation of the storm surge of 1999’sHurricane Bret in Corpus Christi, Texas, is alsoincluded to demonstrate the utility of Arc StormSurge(Ferreira, 2012).
BACKGROUND
SWAN+ADCIRC
There are many numerical models that simulatehurricane storm surges. The ADCIRC model (Luet-tich and Westerink, 2004), the Sea, Lake, and Over-land Surge from Hurricane model (Jelesnianski et al.,1992), the fully nonlinear Finite Volume CoastalOcean Model (Chen et al., 2003), the Eulerian-Lagrangian CIRCulation model (Zhang and Baptista,2004), and the SWAN+ADCIRC coupled wave andsurge model (Dietrich et al., 2011) are examples ofsuch models. The framework presented here has beendeveloped to work, specifically, with the SWAN+ADCIRC model; however, it can be easily modifiedto work with other computational models. The selec-tion of the SWAN+ADCIRC model responds to therecommendation of the National Research Council’sCommittee on the Federal Emergency ManagementAgency (FEMA) flood maps for using coupled two-dimensional (2-D) wave and surge models to calculatebase flood elevations to decrease the uncertainty indetermining water levels for coastal flooded areas(National Research Council, 2009). The SWAN+ADCIRC model has been successfully applied nation-wide for storm surge studies in a number of locations(e.g., Dietrich et al., 2011; Ratcliff and Smith, 2011).
The ADCIRC model (Luettich and Westerink, 2004)is a physics-based, finite-element, shallow-watermodel that solves the mass and momentum equationsfor water levels and current velocities at a range ofscales. For storm surge modeling, the 2-D Depth-Integrated version of ADCIRC is typically used. This
version of the program solves the Generalized WaveContinuity Equation and the vertically integratedmomentum equations, which are, respectively,
@2f@t2
þ s0@f@t
þ @ ~Jx
@xþ @ ~Jy
@y�UH
@s0@x
� VH@s0@y
¼ 0;
ð1Þ
where:
~Jx ¼�Qx@U
@x�Qy
@U
@yþ fQy� g
2
@f2
@x
�gH@
@x
Ps
gq0� ag
� �þ ssx;windþ ssx;waves � sbx
q0
þðMx�DxÞþU@f@t
þ s0Qx�gH@f@x
;
ð2Þ
~Jy ¼�Qx@V
@x�Qy
@V
@y� fQx � g
2
@f2
@y
� gH@
@y
Ps
gq0� ag
� �þ ssy;wind þ ssy;waves � sby
q0
þ ðMy �DyÞ þ V@f@t
þ s0Qy � gH@f@y
;
ð3Þ
and
@U
@tþU
@U
@xþ V
@U
@y� fV
¼ �g@
@xfþ Ps
gq0� ag
� �þ ssx;wind þ ssx;waves � sbx
q0H
þMx �Dx
Hð4Þ
@V
@tþU
@V
@xþ V
@V
@yþ fU
¼ �g@
@yfþ Ps
gq0� ag
� �þ ssy;wind þ ssy;waves � sby
q0H
þMy �Dy
H;
ð5Þwhere H [L] is the total water depth (f + h), t [T] is thetime, f [L] is the surge elevation above mean sea-level, h [h] is the bathymetric depth, U and V [L/T] arethe depth-integrated horizontal velocity vectors inx- and y-directions, respectively, Qx [L2/T] = UH andQy [L2/T] = VH are fluxes per unit width, P [M/LT2]is the barometric pressure, f [1/T] is the Coriolis force
JAWRA JOURNAL OF THE AMERICAN WATER RESOURCES ASSOCIATION220
FERREIRA, OLIVERA, AND IRISH

coefficient, ss,wind [M/LT2] is the free-surface shearstress, sb [M/LT2] is the bottom shear stress, ss,waves
[M/LT2] is the wave radiation stress, M [M/LT2] arelateral stress gradients, D [M/LT2] are momentumdispersion terms, s0 [dimensionless] is a numericalparameter that optimizes phase propagation proper-ties, and q0 [M/L3] is the water density. The SWANmodel is a third-generation spectral wave model thatcomputes the time and spatial variation in directionalwave spectra (Booij et al., 1999). For wave modeling,SWAN uses the following action balance equation(Booij et al., 1999)
@N
@tþr
x! cg!þ C
!� �N
h iþ @chN
@hþ @crN
@r¼ Stot
r;
ð6Þ
where N [M/T] is the wave action density; x! [L]refers to the 2-D geographic space; cg [L/T] isthe wave group velocity; C [L/T] is the currentvelocity; h [rad] is the wave propagation direction;ch [rad/T] is the propagation velocity in spectral spaceh; r [rad/T] is the wave radian frequency; cr [rad/T2]is the propagation velocity in spectral space r; andStot [M/T3] is the source term representing wavegrowth by wind, action lost due to white capping, surfbreaking and bottom friction, and action exchangedbetween spectral components due to nonlinear effectsin deep and shallow water. A more detailed discus-sion of the governing equations used in ADCIRC andSWAN, and of the SWAN+ADCIRC coupling, can befound in Luettich and Westerink (2004), Booij et al.(1999), and Dietrich et al. (2011), respectively. Forstorm surge simulation, ADCIRC is forced by thewind and pressure fields and the wave radiation
stress resulting from the wave model. Tides and riverinflow can also be added as boundary conditions.SWAN, in turn, is forced by the wind field and uses thewater elevations and depth-averaged currents fromthe surge model as input to compute the propagationvelocities in geographic and spectral spaces. SWANcan also receive Manning’s n values from ADCIRC,which SWAN uses to compute a bottom friction thatvaries spatially. The coupled SWAN+ADCIRC model(Dietrich et al., 2011) uses the same unstructuredmesh of finite elements for both the wave and hydrody-namic models. The SWAN+ADCIRC input and outputfiles considered in this study are described in Table 1.
Geographic Information Systems
According to Longley et al. (2005), GIS can bedefined as a science, discipline, technology, and prob-lem-solving methodology dedicated to the description,explanation, and prediction of patterns and process atgeographic scales. Here, we provide a brief descriptionof key GIS concepts relevant to the development of ArcStormSurge. The reader is referred to Longley et al.(2005) and Zeiler (1999), among others, for a moredetailed discussion of GIS concepts and definitions.
A geodatabase is a relational database that canstore geographic information (Olivera et al., 2006). Ina geodatabase, data are implemented as object classes,feature classes, raster datasets, and Triangular Irreg-ular Network (TIN) datasets, among others. Tablesare collections of attributed nongeographic objects.Feature classes are collections of attributed geographicobjects, or features, which can be points, lines, orpolygons. In a feature class, all features are of the
TABLE 1. SWAN+ADCIRC File Names and Descriptions.
Name Model I/O Description
fort.13 ADCIRC Input Nodal attributes (e.g., Manning’s n)fort.14 ADCIRC Input Mesh and boundary informationfort.15 ADCIRC Input ADCIRC model control file and periodic boundary conditionsfort.22 ADCIRC Input Single meteorological forcingfort.221 ADCIRC Input Meteorological forcing wind fieldsfort.222 ADCIRC Input Meteorological forcing pressure fieldsfort.61 ADCIRC Output Water elevation time series at recording pointsfort.62 ADCIRC Output Depth average velocity time series at recording pointsfort.63 ADCIRC Output Water elevation time series in all nodesfort.64 ADCIRC Output Depth average velocity time series at all nodesfort.71 ADCIRC Output Atmospheric pressure time series at recording pointsfort.72 ADCIRC Output Wind time series at recording pointsfort.73 ADCIRC Output Atmospheric pressure time series at all nodesfort.74 ADCIRC Output Wind time series at all nodesfort.26 SWAN Input SWAN model control fileswan_DIR.63 SWAN Output Wave direction at all nodesswan_HS.63 SWAN Output Wave height at all nodesswan_TM01.63 SWAN Output Wave period at all nodes
Note: SWAN, Simulating WAves Nearshore; ADCIRC, Advanced Circulation.
JOURNAL OF THE AMERICAN WATER RESOURCES ASSOCIATION JAWRA221
ARC STORMSURGE: INTEGRATING HURRICANE STORM SURGE MODELING AND GIS

same type of geometry. Feature classes can be groupedunder feature datasets to establish topologic relationsamong features of different classes. In addition, rela-tionship classes store relational information betweenfeatures and/or object classes, representing the depen-dency between their objects. A raster dataset is a gridand a raster catalog is a collection of raster datasetsdefined in table format in which each record repre-sents an individual raster dataset in the catalog(ESRI, 2013). A TIN dataset contains a set of trianglesthat contain a value that usually represents a surface.
Data models are database schemas used to storeinformation of real-world systems in an organizedframework. Geographic data models, or geodatamod-els, specifically, can store geographic information andrelate their geographic features (e.g., coast lines, gaugestations, flooded areas) to GIS cartographic features(e.g., lines, points, and polygons) (Maidment, 2002). Ina geodatamodel, the modeler can additionally embedmeaning to GIS features, incorporating system states,properties, and behaviors for a specific application(Glennon, 2010). Examples of geodatamodels for waterresources and marine sciences are Arc Hydro (Maid-ment, 2002) and Arc Marine (Wright et al., 2007),respectively. The Environmental Systems ResearchInstitute (ESRI) has also developed thematic geodata-models for other applications (ESRI, 2012a).
Geographic information system has been used inthe past to support hydrodynamic modeling mostly asa tool to pre- and post-process geographic informa-tion. A review of the integration of computationalfluid dynamics and GIS is presented by Wong et al.(2007). Specifically, regarding coastal hydrodynamics,Yu et al. (2001) developed a storm surge numericalforecast model and integrated it with GIS for query-ing and visualizing spatial information. In theirstudy, they used two subsystems: a numerical schemeto calculate the surge by means of a finite-differencediscretization of the depth-averaged mass andmomentum equations, and GIS to visualize theresults. Another example of integration of GIS andhydrodynamics is presented by Ng et al. (2009), inwhich a GIS interface is used to pre- and post-processspatial information for and from a three-dimensional(3-D) coastal hydrodynamic sediment and heavymetal transport numerical model. They developed auser-friendly interface to generate input files for themodel, and incorporated functionality to process 3-Dresults and to convert point time series into rastertime series. Zerger and Wealands (2004) used GIS togenerate static coastal flood risk maps, to supportstakeholders’ decision making, from the results of anumerical model (i.e., Mike21) simulations. They alsoreported the difficulty of managing the large numberof raster flood maps involved. Irby et al. (2009) usedhurricane computational model results and Google
EarthTM (Google Inc., 2013) to develop visualizationtechniques to help raise public awareness of hurri-cane storm surge risk.
Existing SWAN+ADCIRC Pre- and Post-Processors
Commercial software packages are available to pre-and post-process hurricane model files and help visual-ize their results (e.g., Surface-water Modeling System— SMS [Aquaveo, 2012]). These applications provideinterfaces for a number of coastal and riverine modelsincluding ADCIRC. Among other capabilities, theyprovide tools for mesh creation, editing, model setup,and result visualization. The National Research Coun-cil of Canada, for example, has developed BlueKenueTM (National Research Council of Canada, 2013),which provides general triangular mesh generationand visualization capabilities for ADCIRC output files.Similarly, FigureGen (Dietrich et al., in press) readsADCIRC mesh files, geospatial parameters, and modelresults to create figures. Other applications for pre-processing ADCIRC input files are also available fromthe ADCIRC user community (i.e., www.adcirc.org).These programs can calculate a number of geospatialparameters, perform mesh diagnosis (e.g., nodesconnectivity), and provide tidal inputs. Although, asmentioned above, there are a number of commercialapplications and user-developed computer codes forpre- and post-processing ADCIRC files, to the best ofour knowledge, there is no application that integratesSWAN+ADCIRC with GIS for hurricane storm surgemodeling. The Arc StormSurge geodatamodel and toolspresented here are a framework that allows the use ofthe already established storm surge model SWAN+ADCIRC and ArcGISTM to pre- and post-process spatialinformation. The use of Arc StormSurge, however, isrecommended to users with GIS experience because ofall the GIS concepts involved.
ARC STORMSURGE DATA MODEL
Arc StormSurge includes a data model, in geodat-abase format, designed to store the spatial informationneeded for ADCIRC and SWAN. Figure 1 shows theArc StormSurge framework. In the geodatabase, thenames of the feature datasets, feature classes, attri-butes, and relationship classes are fixed to ensure thefunctionality of the Arc StormSurge tools. As with anyother data model, additional features and attributescan be added by the user depending on the specifics ofthe problem being studied, making the Arc Storm-Surge data model entirely customizable.
JAWRA JOURNAL OF THE AMERICAN WATER RESOURCES ASSOCIATION222
FERREIRA, OLIVERA, AND IRISH
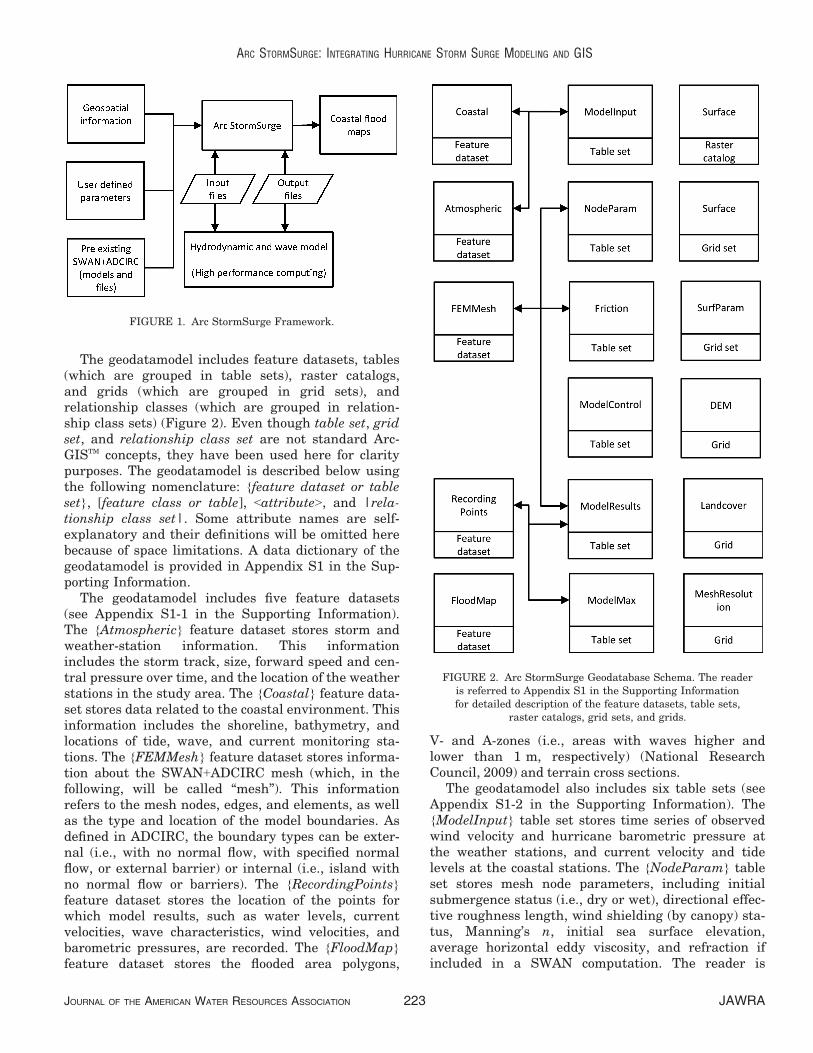
The geodatamodel includes feature datasets, tables(which are grouped in table sets), raster catalogs,and grids (which are grouped in grid sets), andrelationship classes (which are grouped in relation-ship class sets) (Figure 2). Even though table set, gridset, and relationship class set are not standard Arc-GISTM concepts, they have been used here for claritypurposes. The geodatamodel is described below usingthe following nomenclature: {feature dataset or tableset}, [feature class or table], <attribute>, and |rela-tionship class set|. Some attribute names are self-explanatory and their definitions will be omitted herebecause of space limitations. A data dictionary of thegeodatamodel is provided in Appendix S1 in the Sup-porting Information.
The geodatamodel includes five feature datasets(see Appendix S1-1 in the Supporting Information).The {Atmospheric} feature dataset stores storm andweather-station information. This informationincludes the storm track, size, forward speed and cen-tral pressure over time, and the location of the weatherstations in the study area. The {Coastal} feature data-set stores data related to the coastal environment. Thisinformation includes the shoreline, bathymetry, andlocations of tide, wave, and current monitoring sta-tions. The {FEMMesh} feature dataset stores informa-tion about the SWAN+ADCIRC mesh (which, in thefollowing, will be called “mesh”). This informationrefers to the mesh nodes, edges, and elements, as wellas the type and location of the model boundaries. Asdefined in ADCIRC, the boundary types can be exter-nal (i.e., with no normal flow, with specified normalflow, or external barrier) or internal (i.e., island withno normal flow or barriers). The {RecordingPoints}feature dataset stores the location of the points forwhich model results, such as water levels, currentvelocities, wave characteristics, wind velocities, andbarometric pressures, are recorded. The {FloodMap}feature dataset stores the flooded area polygons,
V- and A-zones (i.e., areas with waves higher andlower than 1 m, respectively) (National ResearchCouncil, 2009) and terrain cross sections.
The geodatamodel also includes six table sets (seeAppendix S1-2 in the Supporting Information). The{ModelInput} table set stores time series of observedwind velocity and hurricane barometric pressure atthe weather stations, and current velocity and tidelevels at the coastal stations. The {NodeParam} tableset stores mesh node parameters, including initialsubmergence status (i.e., dry or wet), directional effec-tive roughness length, wind shielding (by canopy) sta-tus, Manning’s n, initial sea surface elevation,average horizontal eddy viscosity, and refraction ifincluded in a SWAN computation. The reader is
FIGURE 2. Arc StormSurge Geodatabase Schema. The readeris referred to Appendix S1 in the Supporting Informationfor detailed description of the feature datasets, table sets,
raster catalogs, grid sets, and grids.
FIGURE 1. Arc StormSurge Framework.
JOURNAL OF THE AMERICAN WATER RESOURCES ASSOCIATION JAWRA223
ARC STORMSURGE: INTEGRATING HURRICANE STORM SURGE MODELING AND GIS

referred to the ADCIRC manual (Luettich and West-erink, 2004) for detailed definition of the model vari-ables and parameters. The {Friction} table set storeslookup tables that relate the terrain land cover at themesh nodes to friction parameter values such as Man-ning’s n, surface canopy factor, and surface roughnesslength factor. Terrain land cover categories from theNational Land Cover Dataset for years 1992 (Vogel-mann et al., 2001), 2001 (Homer et al., 2004), and2006 (Fry et al., 2011), the National Wetlands Inven-tory for year 1993 (U.S. Fish and Wildlife Service,2012), and the Coastal Change Analysis Program foryears 1996, 2001, and 2006 (NOAA, 2011a) areincluded. For each land cover dataset, parameter val-ues were obtained from Arcement and Scneider(1989), Tsihrintzis and Madiedo (2000), Luettich andWesterink (2004), Wamsley et al. (2009), Bunya et al.(2010), and Atkinson et al. (2011). The tables can beedited if site-specific data are available. The {Model-Control} table set stores information related to thecomputational simulations including the number ofdays of the simulation, the time step and the mapcoordinate system. The {ModelResults} table setstores time series generated by the computationalmodel including depth-averaged current velocities,water levels and depths, wind and pressure, and wavecharacteristics (i.e., direction, height, and period) atthe mesh nodes and recording points. The {Model-Max} table set is similar to the previous table set, but itstores only maximum values, rather than complete timeseries, at both mesh nodes and the recording points.
The geodatamodel includes four raster catalogs(i.e., sets of grids that store time series) and fifteengrids (see Appendix S1-3 in the Supporting Informa-tion). The four raster catalogs store time series ofwater elevation, water depth, wave height, and waveperiod over time. Four grids store the maximumwater elevation, maximum water depth, maximumwave height, and maximum wave period from thecorresponding raster catalogs; nine other grids storethe mesh resolution and friction parameters (e.g.,Manning’s n, surface canopy factor); and two gridsstore the ground elevation and land cover data.
The geodatamodel also includes seven sets of rela-tionship classes that relate tables to feature classes infeature datasets (see Appendix S1-4 in the SupportingInformation). These relationship classes relate windand pressure data in {ModelInput} to the weather sta-tions in {Atmospheric}, and water elevation, currentvelocity, wave characteristics, and tide data in {Model-Input} to the monitoring stations in {Coastal}. Theyalso relate the node parameters in {NodeParam} to thenodes in {FEMMesh}; the model output in {ModelRe-sults} and {ModelMax} to the nodes in {FEMMesh} andpoints in {RecordingPoints}; and the boundary type in{FEMMesh} to the model settings in {ModelControl}.
ARC STORMSURGE TOOLS
The Arc StormSurge tools help the exchange ofinformation between the hydrodynamic models andthe geodatabase. The tools were developed using thePYTHONTM programming language (van Rossum,1998) with the NumPY and SciPY libraries, and ArcObjectsTM with the Arc PY library for ArcGISTM. Theyhave been developed in three formats: as PYTHONscripts, as ArcGISTM toolboxes that can be used withModel Builder, and as an ArcGISTM toolbar. The toolscan be classified into pre-processing and post-process-ing tools, plus one tool that creates an empty ArcStormSurge geodatabase on-the-fly in a user-definedfolder. We describe the tool names with the followingnotation Toolname and the SWAN+ADCIRC inputand output files with \filename\.
Pre-Processing Tools
The pre-processing tools are organized in five groups:(1) mesh tools; (2) spatial parameter tools; (3) record-ing point tools; (4) computational model setting tools;and (5) atmospheric forcing tools. The actions performedby some of these tools are mentioned below. A completedescription of the pre-processing tools is presented inAppendix S2-1 in the Supporting Information.
The mesh tools populate {FEMMesh} based on a\fort.14\ file (see Table 1 for a description of theSWAN+ADCIRC input and output files), or create anew \fort.14\ based on {FEMMesh} and {Coastal}.Some of the tools also allow editing {FEMMesh}, whichautomatically updates the corresponding \fort.14\.
The spatial parameter tools create the frictionparameter grids (i.e., Manning’s n, surface canopyfactor and surface roughness length) based on a landcover grid and the lookup tables in {Friction}, andpopulate the mesh node friction parameters in {Node-Param} based on a weighted average of the parame-ter grid values in their area of influence (i.e., thepoints that are closer to a given node than to anyother node). These tools also populate {NodeParam}based on a \fort.13\ file, or create/update \fort.13\based on user modification of {NodeParam}.
The recording point tools populate {Recording-Points} based on a \fort.15\ file, or update \fort.15\based on {RecordingPoints}.
The model setting tools populate {ModelControl}based on \fort.15\ and a \fort.26\ file. This informa-tion is stored in the table containing details of the set-tings used to perform a given simulation and can laterbe used to create metadata for the post-processed files.
The atmospheric forcing tools populate {Atmo-spheric} based on the Atlantic Best Track data files
JAWRA JOURNAL OF THE AMERICAN WATER RESOURCES ASSOCIATION224
FERREIRA, OLIVERA, AND IRISH

\HURDAT\ (NOAA, 2011b), which is the officialrecord of tropical storms and hurricanes of the Atlan-tic Ocean, Gulf of Mexico, and Caribbean Sea thatmade landfall in the U.S., as well as from alreadyexistent wind and pressure field files \fort.221\ and\fort.222\, respectively.
Post-Processing Tools
The post-processing tools are organized in threegroups: (1) tools that import computational modelresults; (2) tools that process computational modelresults; and (3) tools that map inundated areas fromcomputational model results. A summary of the post-processing tools is presented in Appendix S2-2 in theSupporting Information.
The tools that import computational model resultspopulate {ModelResults} based on the \fort.63\,\fort.64\, \swan_DIR.63\, \swan_HS.63\, \swan_TM01.63\, \fort.73\, and \fort.74\ files for the meshnodes, and \fort.61\, \fort.62\, \fort.71\, and\fort.72\ for the recording points. They also populate{ModelMax} based on the maximum values in{ModelResults} for both mesh nodes and recordingpoints.
The tools that process model results create rastercatalogs of interpolated values of {ModelResults} andgrids of interpolated values of {ModelMax}. To easethe analysis, all raster catalogs and grids have thesame cell size as and are snapped to the ground eleva-tion grid. The interpolation method can be chosen outof any ArcGISTM standard interpolation schemes.These tools also query {ModelResults} and {Model-Max} and can identify, for example, areas that will beflooded with a water depth greater than a given valuefor a period longer than a given value. Finally, timeseries plots can be generated based on {ModelResults}.
The tools that map floodplains populate {Flood-Map} based on the difference between the waterlevels in {ModelMax} and ground elevation grid(i.e., digital elevation model [DEM]), which shouldalso be stored in the geodatabase. These tools canalso be used to view model results using cross-sectionalcuts, and to identify V- and A-zones (NationalResearch Council, 2009) based on the wave heightsstored in {ModelMax}.
APPLICATION OF ARC STORMSURGETO HURRICANE BRET
As an illustration, the Arc StormSurge data modeland tools were used in the simulation of Hurricane
Bret. Hurricane Bret made landfall in 1999 close tothe city of Corpus Christi on the Texas Gulf Coast.Corpus Christi is located on the margins of CorpusChristi Bay and Nueces Bay, which are connected tothe open sea through Aransas Pass and protected bybarrier islands. The city of Corpus Christi has faced anumber of hurricane-related damage episodes inrecent decades (e.g., Hurricane Beulah in 1967, Hur-ricane Bret in 1999, and, most recently, HurricaneAlex in 2010). Hurricane Bret, specifically, was a Cat-egory 3 storm, according to the National HurricaneCenter, with wind velocities of around 180 km/h atlandfall and minimum pressure of 944 mb (NOAA,2001). Because of the large number of tools in ArcStormSurge, only a few of them are presented here,namely, the ones that best illustrate the SWAN+ADCIRC and GIS integration. This illustration doesnot aim for providing the most accurate modeling ofHurricane Bret storm surge, neither for validatingthe accuracy of SWAN+ADCIRC in modeling stormsurge inundation, but for demonstrating the ArcStormSurge capabilities.
Arc StormSurge Pre-Processing Tools
Importing Atmospheric Data to GIS. In thisstudy, the TC96 model (Thompson and Cardone,1996) was used to estimate the wind and pressurefields of Hurricane Bret based on the \tropfile\ trackdata file developed by Oceanweather, Inc. The Read-HURDAT tool was used to read \tropfile\, extractthe hurricane meteorological information (i.e., for-ward speed, central pressure, size, and location) andto create a number of points that represent the posi-tion of the hurricane at different times, which werestored in [HurricaneEyePath] in {Atmospheric}. TheCreateTrack tool was used to create a line thatrepresents the hurricane track that was stored in[HurricaneTrack] also in {Atmospheric}. The Import-WindPressure tool was used to read the TC96 modelresult files \fort.221\ and \fort.222\ (see Table 1)that store wind and pressure field information, andpopulate [WindTB] and [PressureTB] in {ModelIn-put}. This wind and pressure field information wasused to force the SWAN+ADCIRC simulations. Fig-ure 3 presents the study area, Hurricane Bret loca-tion and track, and forward speed as it progressestoward landfall.
Combining Model Meshes with Arc Storm-Surge. A considerable amount of effort is devoted todeveloping high-resolution regional meshes (e.g.,FEMA, 2013) and a common approach is to createnew meshes taking advantage of existing ones with-out sacrificing accuracy. To demonstrate the use of
JOURNAL OF THE AMERICAN WATER RESOURCES ASSOCIATION JAWRA225
ARC STORMSURGE: INTEGRATING HURRICANE STORM SURGE MODELING AND GIS

Arc StormSurge tools for mesh editing, the case ofthe combination of two existing and validated modelmeshes is presented here. Although SMS (Aquaveo,2012) also has this capability, it has been included inArc StormSurge to allow mesh editing in a GIS envi-ronment. In this example, we will preserve the high-est resolution in the areas of greatest interest, whilecomputational efficiency is retained by using lowerresolution elsewhere. One of these two meshes is theTexas Mesh (Dawson et al., 2011 and Kennedy et al.,2011), which is an unstructured grid with 3.3 millionnodes and 6.6 million elements covering the Gulf ofMexico and part of the Atlantic Ocean. It has a highresolution along the Texas coast and inland areas;however, because of its high resolution, SWAN+ADCIRC simulations can consume up to 785 proces-sor-hours per day of storm duration (simulationsperformed with 600 processors on the Lonestar LinuxCluster [Texas Advanced Computing Center — TACC2013]). The other mesh, the East Coast Mesh (ECM)(Mukai et al., 2002), has approximately 250,000nodes and 500,000 elements, and covers the Gulf ofMexico and the East Coast of the U.S., withoutinland areas. This mesh allows numerical simulationsin approximately 30 processor-hours per storm daysimulated (simulations performed with 600 processorson the Lonestar Linux Cluster [Texas AdvancedComputing Center — TACC 2013]).
Using Arc StormSurge, each mesh’s \fort.14\ filewas used to create feature classes [MeshNodes],[MeshEdges], and [BoundaryNodes] in {FEMMesh}using the tools ImportNodes, ImportEdges, andImportBoundaryNodes. To avoid feature dataset andfeature class name duplication, each mesh wasimported to a different Arc StormSurge geodatabase.Next, in a third Arc StormSurge geodatabase, new[MeshNodes] and [BoundaryNodes] were created bymerging selected mesh nodes and boundaries from theoriginal mesh feature classes. Mesh edges were firstdefined in TIN format using the constrained Delaunaymesh triangulation method (ESRI, 2012b). Subsequentmanual editing was necessary to avoid numericalinstability (i.e., values exponentially growing or oscil-lating around the solution that have no relation to thesolution of the original differential equations). Stan-dard GIS functions (i.e., TIN editing tools) were usedto modify the mesh elements; that is, adjust the ele-ment sizes, swap nodes/edges, change node locations,and add/delete elements. The boundary condition typeswere also defined manually. The TINtoMesh tool wasthen used to create [MeshEdges] and update [Mesh-Nodes] and [BoundaryNodes] so that the three featureclasses together define a SWAN+ADCIRC mesh. Once[MeshNodes], [MeshEdges], and [BoundaryNodes]have been finalized, the CreateFiniteElementMesh toolwas used to create a \fort.14\ file. After combiningboth meshes, the new resulting mesh had approxi-mately 1.3 million nodes and 2.5 million elements. Theareas around the Baffin, Corpus Christi, Nueces, SanAntonio, and Matagorda Bays were represented usinghigh-resolution information; while, in other coastalareas and offshore, lower resolution was used (Figure 4).
Next, using the tools ImportGeospatialParameters,CreateFrictionalRaster, and FrictionToNodes, thespatial parameters of the Texas Mesh (e.g., Man-ning’s n) were transferred to the new mesh, and anew parameter file \fort.13\ for the new mesh wascreated. Maps of the frictional drag at the sea bottom,represented by Manning’s n, and the wind blockingareas (surface canopy coefficient) are presented inFigure 5. For the new mesh, the computational runtime was approximately 276 processor-hours perstorm day (simulations performed with 600 proces-sors on the Lonestar Linux Cluster [Texas AdvancedComputing Center — TACC 2013]), which is a 64%reduction with respect to the 785 processor-hoursrequired when using the Texas Mesh without com-promising accuracy as it is discussed in the results.
Arc StormSurge Post-Processing Tools
ImportMeshWaterLevel was used to import thewater levels, calculated by SWAN+ADCIRC at every
FIGURE 3. Study Area and Hurricane Bret Track Created Usingthe “ReadHURDAT” and “Create Track” Tools, and Stored in the[HurricaneEyePath] Feature Class. The figure shows the hurricanetrack points and the graph of forward speed. Selected points indi-cate hurricane landfall forward speed.
JAWRA JOURNAL OF THE AMERICAN WATER RESOURCES ASSOCIATION226
FERREIRA, OLIVERA, AND IRISH

mesh node, to the [MeshWater] table. Similarly,ImportWaveHs was used to import the wave heights,also calculated by SWAN+ADCIRC at every mesh node,to the [MeshWaveHs] table. The ExtractMeshMAXwsand ExtractMeshMAXwhs tools were also used toextract the maximum water levels and wave heights ateach node for the entire simulation period and storethem in the [MeshMAXWater] and [MeshMAXWaveHs]tables. These tables are related to the mesh nodes by
means of the relationship classes in |ResultsToMesh|.CreateSurface was used to create grids of maximumwater elevations and wave heights. The conversionfrom point to raster was accomplished using the natu-ral neighbor interpolation algorithm of ArcGISTM butother interpolation algorithms could have also beenused. To have consistent water and ground elevationdata, the cell size of the water elevation grids was setequal to that of the DEM stored in {Coastal} and their
FIGURE 5. Frictional Drag at the Sea Bottom: Manning’sn (top); and Surface Canopy Coefficient (bottom).
FIGURE 4. New SWAN+ADCIRC Mesh Created with ArcStormSurge. Gray color reflects the mesh node density (top) anddetail of the mesh resolution in the Aransas Pass area (bottom).
JOURNAL OF THE AMERICAN WATER RESOURCES ASSOCIATION JAWRA227
ARC STORMSURGE: INTEGRATING HURRICANE STORM SURGE MODELING AND GIS

cells were snapped. In this study, we used the 1-arc-second topographic data from the National ElevationDataset (USGS, 2011) and, therefore, we adopted aresolution of 30 m.
RESULTS
Mesh Validation
To validate the new mesh against the Texas Mesh,we defined 22 recording points with the UpdateRecording Points tool (Figure 6), and simulated Hur-ricane Bret using the same model setup and runningon the same computational platform for both the newmesh and the Texas Mesh. Water level time serieswere extracted for each recording point for both simu-lations. A comparison of the results for 4 of the 22selected recording points is presented in Figure 7.Each plot represents the evolution of the surge (i.e.,water level above mean sea level [MSL]) over thesimulation period for one recording point. The corre-spondence in the surge values and timing betweenboth simulations can be readily observed. Recordingpoints #8 and #9 are offshore locations near the coast;thus, we also included the results obtained with theECM. Recording points #20 and #17 are inside thebays, and outside the domain of the ECM.
A comparison of the maximum peak surges at the22 recording points for the new mesh and the TexasMesh simulations is presented in Figure 8. The corre-lation coefficient R2 was 0.968. It was observed thatthe discrepancy between peak surges ranged from
FIGURE 6. Recording Points Stored in the[stWaterLevel] Feature Class.
FIGURE 7. Comparison of the Calculated Surge Water Levels at Four Selected Recording Points for Hurricane Bret with Different Meshes.
JAWRA JOURNAL OF THE AMERICAN WATER RESOURCES ASSOCIATION228
FERREIRA, OLIVERA, AND IRISH

0.00 to 0.11 m with its maximum value in the off-shore recording points #5, #7, #11, #12, #13, and #14;which, given the model uncertainties, can be consid-ered very small.
Model Validation
The intent of the study is not to validate SWAN+AD-CIRC hurricane surge simulation of Hurricane Bret,
neither is it to develop the best estimate of HurricaneBret flooding extent, rather it is to describe and dem-onstrate the Arc StormSurge tools. A comparison ofthe model results calculating hurricane surge andwaves from Hurricane Bret to measured data was per-formed using data from the National Data Buoy Cen-ter (NOAA, 2013a), the Tides & Currents database(NOAA, 2013b), and the Texas Coastal Ocean Observa-tion Network (Division of Nearshore Research, 2013).The location of the measurements stations was storedin the {Coastal} feature dataset as a point featureclass (Figure 6). The Update Recording Points tool wasused to include these stations in the ADCIRC controlfile /fort.15/ so model results were recorded in theselocations.
The comparison of water levels calculated by themodel and the measured data is presented in Fig-ure 9. According to the measurement stations, Hurri-cane Bret produced surges from 0.8 m along the coastto 0.5 m inside the bays. The model overestimatesthe peak surge for all four stations and predicts thetiming for the rise of surge a little earlier thanthe actual measured data. Those differences wereexpected due to the reduced complexity wind modelapplied for the simulations. In general, the differ-ences in peak surge ranged from 0.2 to 0.4 m. At BobHall Pier, an offshore station near the coast, themodel predicted the surge decline better than inthe bay side stations, where the model predicted thesurge to take longer to decrease (Port Aransas, NavalStation and Rock Port). The wave results were
FIGURE 8. Comparison of the Peak Surge Elevationsfor the 22 Recording Points Calculated Using the
New Mesh and the Texas Mesh.
FIGURE 9. Comparison of the Calculated Surge Water Levels and Measured Data at Four Measurement Stations for Hurricane Bret.
JOURNAL OF THE AMERICAN WATER RESOURCES ASSOCIATION JAWRA229
ARC STORMSURGE: INTEGRATING HURRICANE STORM SURGE MODELING AND GIS

compared to the NOAA Buoy 42020 (60NM SSE ofCorpus Christi). Predicted significant wave heightsand the average wave period were compared to themeasured data and the results are presented in Fig-ure 10. The model captured well the wave heightsgenerated by Hurricane Bret; measurements indi-cated wave heights up to 8 m and the model slightlyoverestimated the maximum wave height by 1 m.The wave periods ranged from 4 to 11 s and were notso well captured by the model including the maxi-mum period (10 s) during the maximum waveheights.
Flooded Areas
The delineation of flooded areas (i.e., flood poly-gons) was automated with an algorithm that com-bines the mapping of wet and dry areas (takingadvantage of the ADCIRC wetting and drying scheme
[Blain et al., 2010]) and the flooding depths resultingfrom the model output and the DEM topography.This algorithm excludes from the flood polygons: (1)areas that have a lower elevation than the waterlevel but are isolated from any water body; and (2)areas whose ground elevation is greater than the cal-culated flood level but that were included in the wet-ted area of influence of a node. The resulting
FIGURE 10. Comparison of the Calculated WaveHeight and Period to Measured Data at the
NOAA Buoy 42 for Hurricane Bret.
FIGURE 11. Model Results for Hurricane Bret:(top) Maximum Surge Levels in Corpus Christi Bay;
(bottom) Water Depth Over Flooded Areas in Nueces Bay.
JAWRA JOURNAL OF THE AMERICAN WATER RESOURCES ASSOCIATION230
FERREIRA, OLIVERA, AND IRISH

maximum surge levels from the Hurricane Bret simu-lation are shown in Figure 11. As an example,Figure 11 also shows the flooded areas classifiedby water depth in Port Aransas.
SUMMARY AND CONCLUSIONS
Hurricane surges are a major cause of loss ofhuman lives and destruction of infrastructure.Therefore, it is crucial to be able to rapidly predictflood extents and magnitudes to better protectcoastal communities. Integrating state-of-the-art hur-ricane storm models with GIS allows speeding upspatial analyses of surge events and conveying infor-mation to decision makers, stakeholders, and thegeneral public.
Arc StormSurge is a data model that integrates theSWAN+ADCIRC hurricane wave and surge coupledmodel and ArcGISTM. It includes a number of pre- andpost-processing ArcGISTM tools that help integrate spa-tial data and numerical modeling, and can be used forsetting up the model, or for post-processing simulationresults, streamlining flood map delineation, and shar-ing information. Although other options for enteringdata, and interpreting and presenting SWAN+ADCIRCresults are available, they are not embedded in GISand lack the available GIS methods and tools for datadevelopment and integration and spatial analysis.Moreover, as expertise in GIS becomes more commonamong modelers, Arc StormSurge will provide a set oftools in an already familiar working environment. Inthis article, we present GIS functionality to editmeshes, create geospatial parameters, import monitor-ing stations, visualize hurricane atmospheric data, andto create flood maps. Furthermore, although notaddressed in this study, the Arc StormSurge geodata-base sets the grounds for benefiting from GIS function-ality such as geospatial analyses, 3-D visualization,GIS web servers, and GIS mobile applications toadvance hurricane storm surge planning, decision mak-ing, evacuation, and disaster response in the future.
As an illustration, Arc StormSurge was used tosupport the modeling of Hurricane Bret, which madelandfall in the Corpus Christi area in Texas in 1999.First, it was used to convert two SWAN+ADCIRCexisting model meshes, the ECM and the Texasmesh, to a single mesh with higher resolution in thestudy area and lower resolution elsewhere. Second,Arc StormSurge was used to extract information fromgeospatial data and input them to the numericalmodel. Third, Arc StormSurge was used to mapmodel input (i.e., atmospheric variables) and output(i.e., floodplains) in a GIS environment.
With Arc StormSurge as the foundation, futurestudy by the researchers will focus on the develop-ment of web applications that take advantage of GISin the cloud and GIS web services. These additionaltools could support a number of applications thatrange from coastal community and regional planningto real-time surge-flood alert systems.
SUPPORTING INFORMATION
Additional Supporting Information may be foundin the online version of this article:
Appendix S1. Geodatabase schema.Appendix S2. Pre-processing and post-processing
tools.The geodatabase, codes, and tools presented here
are open source and freely available to any user.Because of expected improvements and updates, cur-rently the geodatabase schema as well as the toolfiles can only be obtained by contacting the authors.The authors are working on making the tools avail-able through a website.
ACKNOWLEDGMENTS
This research was funded by the Texas General Land Office viaa Grant/Cooperative Agreement from the National Oceanic andAtmosphere Administration (Grant No. 10-051). The viewsexpressed herein are those of the authors and do not necessarilyreflect views of NOAA or any sub-agencies. The use of trade namesdoes not constitute an endorsement in the use of these products bythe U.S. Government. The authors thank Oceanweather, Inc., forallowing us to use their planetary boundary layer model. Theauthors acknowledge the Texas Advanced Computing Center(TACC) at The University of Texas at Austin (http://www.tacc.utexas.edu) for providing HPC resources that have contributed to theresearch results reported within this article.
LITERATURE CITED
Aquaveo, 2012. Surface Modeling System (SMS). http://www.aqua-veo.com/sms, accessed April 2011.
Arcement, G.J. and V.R. Scneider, 1989. Guide for Selecting Man-ning’s Roughness Coefficients for Natural Channels and FloodPlains. U.S. Geological Surver Water-Supply Paper 2339, U.S.Geological Survey, Denver, Colorado.
Atkinson, J., H. Roberts, S.C. Hagen, S. Zhou, P. Bacopoulos, S.Medeiros, J. Weishampel, and Z. Cobell, 2011. Deriving Fric-tional Parameters and Performing Historical Validation for anADCIRC Storm Surge Model of the Florida Gulf Coast. FloridaWatershed Journal 4(2):22-27.
Blain, C.A., R.S. Linzell, C. Massey, and P. Chu, 2010. ValidationTest Report for the Advanced CIRCulation Model (ADCIRC)v45.11. Naval Research Laboratory, United States Navy, Sten-nis Space Center, Slidell, Mississippi.
JOURNAL OF THE AMERICAN WATER RESOURCES ASSOCIATION JAWRA231
ARC STORMSURGE: INTEGRATING HURRICANE STORM SURGE MODELING AND GIS

Booij, N., R.C. Ris, and L.H. Holthuijsen, 1999. A Third GenerationWave Model for Coastal Regions. Model Description and Valida-tion. Journal of Geophysical Research 104:7649-7666.
Bunya, S., J. Dietrich, J. Westerink, B. Ebersole, J. Smith, J.Atkinson, R. Jensen, D. Resio, R. Luettich, C. Dawson, V. Car-done, A. Cox, M. Powell, H. Westerink, and H. Roberts, 2010.A High-Resolution Coupled Riverine Flow, Tide, Wind, WindWave, and Storm Surge Model for Southern Louisiana and Mis-sissippi. Part I: Model Development and Validation. MonthlyWeather Review 138:345-377.
Chen, C., H. Liu, and R. Beardsley, 2003. An Unstructured Grid,Finite-Volume, Three-Dimensional, Primitive Equations OceanModel: Application to Coastal Ocean and Estuaries. Journal ofAtmospheric and Oceanic Technology 20:159-186.
Dawson, C., E.J. Kubatko, J.J. Westerink, C. Trahan, C. Mirabito,C. Michoski, and N. Panda, 2011. Discontinuous Galerkin Meth-ods for Modeling Hurricane Storm Surge. Advances in WaterResources 34:1165-1176.
Dietrich, J.C., C.N. Dawson, J.G. Fleming, R.A. Luettich, J.J. West-erink, Z. Cobell, J.H. Atkinson, H. Lander, B.O. Blanton, andC.M. Szpilka, in press. Real-Time Forecasting and Visualizationof Hurricane Waves and Storm Surge Using SWAN+ADCIRCand FigureGen. In: Computational Challenges in the Geoscienc-es, C.N. Dawson and M. Gerritsen (Editors). Institute for Math-ematics and Its Applications, v156, Springer, Verlag, Berlin,Heidelberg, New York.
Dietrich, J.C., M. Zijlema, J.J. Westerink, L.H. Holthuijsen, C.Dawson, R.A. Luettich, R. Jensen, J.M. Smith, G.S. Stelling,and G.W. Stone, 2011. Modeling Hurricane Waves and StormSurge Using Integrally-Coupled, Scalable Computations. CoastalEngineering 58:45-65.
Division of Nearshore Research, 2013. Texas Coastal and OceanObservation Network. http://lighthouse.tamucc.edu/TCOON/HomePage, accessed March 2013.
ESRI (Environmental Systems Research Institute), 2012a. DataModels. http://support.esri.com/en/downloads/datamodel, accessedMarch 2011.
ESRI (Environmental Systems Research Institute), 2012b. Funda-mentals of TIN Triangulation in ArcGIS. http://help.arcgis.com/en/arcgisdesktop/10.0/help/index.html#//00600000000z000000.htm, accessed March 2011.
ESRI (Environmental Systems Research Institute), 2013. RasterData Organization. http://resources.arcgis.com/en/help/main/10.1/index.html#//009t0000000n000000, accessed August 2013.
FEMA (Federal Emergency Management Agency), 2013. Region IIICoastal Analysis and Mapping. http://www.r3coastal.com/faqs,accessed April 2013.
Ferreira, C.M., 2012. The Influence of Coastal Wetlands on Hurri-cane Surge and Damage with Application to Planning UnderClimate Change. Doctoral Dissertation, Texas A&M University,College Station, Texas.
Fry, J., G. Xian, S. Jin, J. Dewitz, C. Homer, L. Yang, C. Barnes,N. Herold, and J. Wickham, 2011. Completion of the 2006National Land Cover Database for the Conterminous UnitedStates. Photogrammetric Engineering & Remote Sensing 77(9):858-864.
Glennon, A., 2010. Creating and Validating Object-Oriented Geo-graphic Data Models: Modeling Flow within GIS. Transactionsin GIS 14(14):23-42.
Google Inc., 2013. Google Earth (Version 7.0.3.8542) [Software].http://www.google.com/earth/index.html, accessed January 2013.
Homer, C., C. Huang, L. Yang, B. Wylie, and M. Coan, 2004. Devel-opment of a 2001 National Landcover Database for the UnitedStates. Photogrammetric Engineering and Remote Sensing 70(7):829-840.
Irby, D., M. Mohammadi-Aragh, R. Moorhead, and P. Amburn,2009. Improving the Understanding of Hurricanes: VisualizingStorm Surge. Oceans 1-3:1442-1445.
Jelesnianski, C.P., J. Chen, and W.A. Shaffer, 1992. SLOSH: Sea,Lake, and Overland Surges from Hurricanes. Technical ReportNWS 48, National Oceanic and Atmospheric Administration,Silver Springs, Maryland, 71 pp. [Available from NOAA/AOMLLibrary, 4301 Rickenbacker Cswy., Miami, Florida 33149.]
Kennedy, A.B., U. Gravois, B.C. Zachry, J.J. Westerink, M.E. Hope,J.C. Dietrich, M.D. Powell, A.T. Cox, R.A. Luettich, Jr., andR.G. Dean, 2011. Origin of the Hurricane Ike Forerunner Surge.Geophysical Research Letters 38:L08608.
Longley, P.A., D.J. Maguire, M.F. Goodchild, and D. Rhind, 2005.Geographical Information Systems and Science. John Wiley &Sons, New York City, New York.
Lott, N. and T. Ross, 2006. Tracking and Evaluating U.S. BillionDollar Weather Disasters, 1980-2005. National Climatic DataCenter (NCDC). http://www1.ncdc.noaa.gov/pub/data/papers/200686ams1.2nlfree.pdf, accessed July 2011.
Luettich, R. and J. Westerink, 2004. Formulation and NumericalImplementation of a 2D/3D ADCIRC Finite Element Model Ver-sion 4.46. http://adcirc.org/adcirc_theory_2004_12_08.pdf, accessedNovember 2010.
Maidment, D.R. (Editor), 2002. Arc Hydro: GIS for WaterResources. ESRI Press, Redlands, California.
Mukai, A.Y., J. Westerink, R. Luetich, and D. Mark, 2002. EastCoast 2001. A Tidal Constituent Database for Western NorthAtlantic, Gulf of Mexico and Caribbean Sea. Coastal InletsResearch Program Report, 194 pp. Coastal and HydraulicsLaboratory ERDC/CHL TR-02-24, US Army Corps of Engineers,Engineer Research and Development Center, Vicksburg,Michigan.
National Research Council, 2009. Mapping the Zone: ImprovingFlood Map Accuracy. The National Academy Press, Washington,D.C.
National Research Council of Canada, 2013. Blue KenueTM SoftwareTool for Hydraulic Modellers (Version 3.3.4) [Software]. http://www.nrc-cnrc.gc.ca/eng/solutions/advisory/blue_kenue_index.html,accessed January 2013.
Ng, S., O. Wai, Y. Li, Z. Li, and Y. Jiang, 2009. Integration of aGIS and a Complex Three-Dimensional Hydrodynamic, Sedi-ment and Heavy Metal Transport Numerical Model. Advancesin Engineering Software 40:391-401.
NOAA (National Oceanic and Atmospheric Administration), 2001.Preliminary Report: Hurricane Bret. http://www.nhc.noaa.gov/1999bret.html, accessed January 2010.
NOAA (National Oceanic and Atmospheric Administration), 2011a.NOAA Coastal Change Analysis Program (C-CAP) RegionalLand Cover Database. Data Collected 1995-Present. NationalOceanic and Atmospheric Administration (NOAA), Coastal Ser-vices Center, Charleston, South Carolina. http://www.csc.noaa.gov/landcover, accessed March 2011.
NOAA (National Oceanic and Atmospheric Administration), 2011b.Atlantic Basin Hurricane Database (HURDAT). http://www.aoml.noaa.gov/hrd/hurdat/, accessed July 2011.
NOAA (National Oceanic and Atmospheric Administration), 2013a.National Data Buoy Center. http://www.ndbc.noaa.gov/, accessedMarch 2013.
NOAA (National Oceanic and Atmospheric Administration), 2013b.Tides and Currents. http://tidesandcurrents.noaa.gov/, accessedMarch 2013.
Olivera, F., M. Valenzuela, R. Srinivasan, J. Choi, H. Cho, S. Koka,and A. Agrawal, 2006. ArcGIS-SWAT: A Geodata Model andGIS Interface for SWAT. Journal of the American WaterResources Association 42:295-309.
JAWRA JOURNAL OF THE AMERICAN WATER RESOURCES ASSOCIATION232
FERREIRA, OLIVERA, AND IRISH

Ratcliff, J. and J.M. Smith, 2011. Sea Level Rise Impacts to Mili-tary Installations in Lower Chesapeake Bay. Proceedings, Solu-tions to Coastal Disasters. ASCE, Reston, Virginia, pp. 740-752.
Resio, D. and J. Westerink, 2008. Modeling the Physics of StormSurges. Physics Today 61(9):33-38.
van Rossum, G., 1998. Python: A Computer Language. Version1.5.1. Stichting Mathematisch Centrum, Amsterdam. http://docs.python.org/3/copyright.html, accessed January 2013.
Thompson, E.F. and V.J. Cardone, 1996. Practical Modeling of Hur-ricane Surface Wind Field. Journal of Waterway, Ports, Coastaland Ocean Engineering 122(4):195-205.
Tsihrintzis, V. and E. Madiedo, 2000. Hydraulic Resistance Deter-mination in Marsh Wetlands. Water Resources Management14:285-309.
U.S. Fish and Wildlife Service, 2012. The National Wetlands Inven-tory (NWI). http://www.fws.gov/wetlands/, accessed May 2011.
USGS (U.S. Geological Survey), 2011. National Elevation Dataset.http://ned.usgs.gov/, accessed August 2011.
Vogelmann, J.E., S.M. Howard, L. Yang, C.R. Larson, B.K. Wylie,and J.N. Van Driel, 2001. Completion of the 1990’s NationalLand Cover Data Set for the Conterminous United States. Photo-grammetric Engineering and Remote Sensing 67:650-662.
Wamsley, T., M. Cialone, J.M. Smith, J. Atkinson, and J.D. Rosati,2009. Influence of Landscape Restoration and Degradation onStorm Surge and Waves in Southern Louisiana. Natural Haz-ards 51:207-224.
Wong, D.W., F. Camelli, and M. Sonwalkar, 2007. IntegratingComputational Fluid Dynamics (CFD) Models with GIS: AnEvaluation on Data Conversion Formats. In: Proceedings SPIE675312, Geoinformatics 2007: Geospatial Information Science,675312 (July 26, 2007) 33(1, 2):675312-1-675312-11. doi: 10.1117/12.761763; http://dx.doi.org/10.1117/12.761763.
Wright, D.J., M.J. Blongewicz, P.N. Halpin, and J. Breman, 2007.Arc Marine: GIS for a Blue Planet. ESRI Press, Redlands, Cali-fornia.
Yu, F.J., Z.H. Zhang, and Y.H. Lin, 2001. A Storm Surge Numeri-cal Forecast System Based on GIS, Proceedings, XXIX Interna-tional Association of Hydraulic Engineering and ResearchCongress. Tsinghua University Press, Beijing.
Zeiler, M., 1999. Modeling Our World – The ESRI Guide to Geodat-abase Design. ESRI Press, Redlands, California.
Zerger, A. and S. Wealands, 2004. Beyond Modelling: Linking Mod-els with GIS for Flood Risk Management. Natural Hazards33:191-208.
Zhang, Y.L. and A.M. Baptista, 2004. Benchniarking a New Open-Source 3D Circulation Model (ELCIRC). In: ComputationalMethods in Water Resources, Vols. 1 and 2, C.T. Miller, M.W.Farthing, W.G. Gray, and G.F. Pinder (Editors). ElsevierScience, Amsterdam, Netherlands, pp. 1791-1800.
JOURNAL OF THE AMERICAN WATER RESOURCES ASSOCIATION JAWRA233
ARC STORMSURGE: INTEGRATING HURRICANE STORM SURGE MODELING AND GIS