Embed Size (px)
Citation preview
A.R.A.M.E.
DOCUMENT TYPE: SYSTEM DESIGN DOCUMENT
TITLE: RADIONUCLIDE MONITORING STATION SYSTEM DESIGNDOCUMENT
CAGE CODE: A3510
DOCUMENT No.: TL 18095 PAGE: I of IV, 48
PROJECT Ref.:
ISSUE No.: 4
PREPARED BY: A.R.A.M.E. TEAM
CHECKED BY: M. LAPOLLA
PROJECT LEADER: M. CHIANELLA DATE:
PAPM: DATE:
PROGRAM MANAGER: R. DE NICHILO DATE:
CONFIGURATION: L. E. RONDELLI
DATE FOR APPROVAL:

A.R.A.M.E. Ref: TL 18095Project Ref.:Issue: 4 Page: II
Any information contained in this document is property of LABEN S.p.A. andis strictly private and confidential. All rights reserved.
DISTRIBUTION LIST
POS. NAME DEPT. N°
R. DE NICHILO LABEN
M. CHIANELLA LABEN
M. LAPOLLA LABEN
P.T.S. CTBTO

A.R.A.M.E. Ref: TL 18095Project Ref.:Issue: 4 Page: III
Any information contained in this document is property of LABEN S.p.A. andis strictly private and confidential. All rights reserved.
CHANGE RECORD
Issue Date Sheet Description of Change Release
1 AUG. 01 ALL FIRST ISSUE OF THE DOCUMENT ---
2 DEC. 02 ALL ISSUE REVIEWED AFTER STATION INSTALLATION ---
3 APR. 03 ALL ISSUE REVISED AFTER CTBTO COMMENTS ---
4 SEP.03 ALL ISSUE REVISED AFTER CTBTO COMMENTS ---

A.R.A.M.E. Ref: TL 18095Project Ref.:Issue: 4 Page: IV
Any information contained in this document is property of LABEN S.p.A. andis strictly private and confidential. All rights reserved.
TABLE OF CONTENTS1. INTRODUCTION ..........................................................................................................1
1.1. SCOPE ........................................................................................................................... 11.2. KEYWORDS................................................................................................................... 1
2. REFERENCE DOCUMENTS........................................................................................23. OVERALL STATION’S FEATURES ............................................................................34. STATION’S SPECIFIC DESCRIPTION........................................................................4
4.1. STATION MANAGEMENT (AND DATA ACQUISITION) SYSTEM..................................... 54.1.1. Data Flow Chart ........................................................................................................................... 54.1.2. Connection Chart ......................................................................................................................... 74.1.3. Software Documentation.............................................................................................................. 84.1.4. Data Acquisition from the Sampler............................................................................................... 8
4.2. AIR SAMPLER CINDERELLA............................................................................................ 94.2.1. Air Sampling Unit........................................................................................................................ 144.2.2. The Control Unit ......................................................................................................................... 174.2.3. The Filter Manipulator Unit ......................................................................................................... 18
4.3. GAMMA MEASUREMENT SYSTEM ................................................................................ 234.3.1. Detector...................................................................................................................................... 234.3.2. Cooler System............................................................................................................................ 254.3.3. MCA DSPEC Plus ...................................................................................................................... 254.3.4. Analysis SW Gamma Vision ...................................................................................................... 264.3.5. High Level Programming............................................................................................................ 27
4.4 METEOROLOGICAL STATION........................................................................................ 284.4.1 Central Data Acquisition............................................................................................................. 284.4.2 Atmospheric pressure ................................................................................................................ 294.4.3 Precipitation................................................................................................................................ 294.4.4 Temperature and Humidity......................................................................................................... 304.4.5 Wind Speed / Direction .............................................................................................................. 30
4.5 INDOOR SENSORS ......................................................................................................... 314.5.1 Detector’s Temperature ............................................................................................................. 314.5.2 Tampering Switches on Station.................................................................................................. 314.5.3 Indoor Humidity and Temperature ............................................................................................. 31
4.6. UPS SYSTEM................................................................................................................... 32
5. STATION MANAGEMENT SYSTEM..........................................................................335.1. WORKSTATION ........................................................................................................... 335.2. AUTHENTICATION UNIT.............................................................................................. 345.3. GPS CLOCK................................................................................................................. 345.4. DATA LOGGER............................................................................................................ 355.5. STATION MANAGEMENT SOFTWARE....................................................................... 35
5.5.1. System Controlling ..................................................................................................................... 365.5.2. Routine/Non Routine Operation ................................................................................................. 37
5.6. DATA ARCHIVE MANAGEMENT..................................................................................... 475.7 DATA SECURITY ............................................................................................................. 48

A.R.A.M.E. Ref: TL 18095Project Ref.:Issue: 4 Page: 1
Any information contained in this document is property of LABEN S.p.A. andis strictly private and confidential. All rights reserved.
1. INTRODUCTION
1.1. SCOPE
Scope of the document is to give a specific and detailed description of ARAME stations,as designed and manufactured by Laben. This document is a general document,applicable for all the ARAME stations. Specific details, relevant to the single stations, willbe described in the relevant User Manuals (issued by Laben), and in the SSOM (SpecificStation Operation manual, issued by CTBTO).
1.2. KEYWORDS
The main keywords that will be employed are:
ARAME Automatic Radionuclide Air Monitoring EquipmentRMS Radionuclide Monitoring SystemIDC International Data CenterUPS Uninterruptable Power SupplyHW HardwareSW SoftwareHPGe Germanium Hiper-PureARAME Automatic Radionuclide ir Monitoring EquipmentCTBTO Comprehensive Nuclear Test-Ban-Treaty OrganizationPTS Provisional Test SecretarySOH Status Of the HealthMMI Man Machine Interface

A.R.A.M.E. Ref: TL 18095Project Ref.:Issue: 4 Page: 2
Any information contained in this document is property of LABEN S.p.A. andis strictly private and confidential. All rights reserved.
2. REFERENCE DOCUMENTS
Reference documents are the Station’s technical documents, as listed below.
Station User Manual (with the relevant annexes) by LabenStation SW Architectural design by Laben.Specific Station Operation manual (SSOM) by CTBTOStation Acceptance Data Package (ADP) by Laben

A.R.A.M.E. Ref: TL 18095Project Ref.:Issue: 4 Page: 3
Any information contained in this document is property of LABEN S.p.A. andis strictly private and confidential. All rights reserved.
3. OVERALL STATION’S FEATURES
The main functions of the ARAME station is to acquire, process and trasmit data fromvarious sensors to the International Data Centre (IDC) in Vienna (and where applicablealso to a local National Data Centre).The main data (γ-energy spectrum, metereological, state of the health) are tagged withUTC time by a GPS receiver, and with ancillary information, and routed to IDC (and NDC)in a specific format (IMS-2) using a resident e-mail server through a satellite data link, thatalso allows secure remote control with authentication. A local archive holds two months ofdata backup available on line.
The main feature of the station are :
Air sampling : > 500 m3/ h Automatic filter handling Up to 14 days of unattended operation HPGe detector efficiency : > 65% Base line sensitivity : 10-30 Bq/ m3 for 140Ba Advanced Data Management System Data security protection by Digital Signature Metereological data acquisition Anti-tampering sensors

A.R.A.M.E. Ref: TL 18095Project Ref.:Issue: 4 Page: 4
Any information contained in this document is property of LABEN S.p.A. andis strictly private and confidential. All rights reserved.
4. STATION’S SPECIFIC DESCRIPTION
The Automatic Radionuclide Air Monitoring Station (ARAME) station works in automaticand independent way, without human intervention (supplying apart). The main items thatcompose the structure of each station can be summarised as follows:
- The Station Management System- The Air Sampling System- The gamma measurement system- The Meteo Detection System- The Indoor Sensors- The Uninterruptible Power Supply System
The central computer (part of the Station Management system) interfaces and acquiredata from all the other systems. The data are relevant either to the measurement (nuclearand meteorological), or to the state of health of each component of the station.Data acquired are stored locally and sent to the International Data Center in Vienna via asatellite link (GCI) or (when available) through network infrastructures present at the site.
STATION PHYSICAL LAYOUT
STATIONCOMPUTER
CTBTO(GCI INTERFACE)
ORTEC DSPEC+(DETECTOR)
ENVIRONMENTSENSORS
(DATALOGGER OPTO22)
POWER SUPPLY(UPS SNMP ADAPTER)
HUB(LABEN)
ETHERNET LINK (TCP/IP)SERIAL LINK RS485SERIAL LINK RS232
DIGITAL INPUTANALOG INPUT
METEO(BABUC ABC LASTEM)
MTO
AIR SAMPLER(SENYA CINDERELLA)
QLC PLC
FILTER EQUIP.(DATALOGIC)
MTO QLC PLC
BAR CODE READER 1(COLLECT)
BAR CODE READER 2(DECAY)
BC-1 BC-2
BC-1
BC-2
HPGE (CRYSTAL TEMP.)TEMP (ROOM TEMP., HUM.)
COOL (ELECTRIC COOLER)
WHITE CABLE (DOOR)
BNC/10BT

A.R.A.M.E. Ref: TL 18095Project Ref.:Issue: 4 Page: 5
Any information contained in this document is property of LABEN S.p.A. andis strictly private and confidential. All rights reserved.
4.1. STATION MANAGEMENT (AND DATA ACQUISITION) SYSTEM
Specific information about the Station Management system will be detailed in chap. 5;herebelow it is described from a functional point of view.
4.1.1. Data Flow Chart
The Data Flow Chart (DFC) can be summarised starting from the CINDERELLA airsampler. The air sampling is characterised by a sampling time (generally of 24 hours, butcustomisable for specific processes and reasons) which corresponds to a sampled volumeof air that may change from a minimum value of about 12.800 m3 , supposing an averageof 530 m3/h, up to 20.000 m3 , supposing an average of about 850 m3/h (nominal valuesbased upon our first experience vary from 13.000 to 14.500 m3). After that the air hasbeen sampled and the particulate, collected on the filter, decayed for 24 hours, the dataare available for the spectrometric analysis. The spectrometric measurement areperformed by the HPGe Detector, connected to a digital Multichannel Analyzer (generallya 24-hour measure, but customisable for specific processes and reasons). TheMultichannel Analyser (MCA) DSPECPLUS, provided by ORTEC, receives the detectedpulses from the detector. A dedicated software (MAESTRO) controls the digital MCA. TheMCA with MAESTRO represents the acquisition step and can be considered as a whole.The analysis step is represented (on site) by the Gamma Vision SW (always provided byORTEC). Gamma Vision SW generates spectra and text files that contain all theinformation about the acquired spectra. An important feature is achieved by the .spectrafiles conversion (.spc to .rms, which permits to convert the files in the CTBTO requestedformat. In fact, the IDC in Vienna has the necessity, by using other software packages toreceive .rms files in IMS2 format. The output-generated file is called, for example,yearmonthdayhourminutesecond_progressivenumber.rms. Nine digits compose theprogressive number after the underscore that is randomly generated by the IMS logic. Oneexample of the generated file is:
20010621123713_000000076.rms
Where 2001 is the year, 0621 the date (month and day), 163713 the time (hours, minutesand seconds), 000000076 the random ims generated number. This is the file that is sentto the IDC.

A.R.A.M.E. Ref: TL 18095Project Ref.:Issue: 4 Page: 6
Any information contained in this document is property of LABEN S.p.A. andis strictly private and confidential. All rights reserved.
Fig. 2: DATA Flow Chart
HPGeDETECTOR
MCADSPECPLUS MAESTRO V
3.2
GAMMAVISION 3.2
CTBTOREQUESTED
OUTPUT
ACQUISITION ANALYSIS
PERKINELMER
CONNECTION32
SPC2RMSCONVERTER
CINDERELLASAMPLER

A.R.A.M.E. Ref: TL 18095Project Ref.:Issue: 4 Page: 7
Any information contained in this document is property of LABEN S.p.A. andis strictly private and confidential. All rights reserved.
4.1.2. Connection Chart
The backbone of station data connections is the Ethernet. There are direct connections tothe Ethernet network from Data Logger, the digital multichannel analyser DSPECPLUS , theUPS system and the Local PC controlling the station. The GCI VSAT Equipment isconnected via Router to Ethernet.Most of the SOH data (Detector temperature monitoring device, Environmental Sensorsand so on) are transmitted through analog/digital connection to the Data Logger. The BarCode Readers (2-3 lines), the Meteorological Station and CINDERELLA PLC areconnected via a RS232 serial connection to the Data Logger. The CINDERELLA QLC isconnected via a RS485 serial connection to the data logger, as well.
The Station is managed automatically and data is sent without user intervention to IDC.The data is either related to the measurement data (nuclear and meteorological), or to thestatus of each component at the station (SOH – Status Of the Heath). Moreover thecomputer system supports interfaces also, to talk with external infrastructures (powermanagement system, shelter controller, Programmable Logic Control Unit (PLC), etc.). Allthe data are processed by the PC and prepared for sending to the external users (IMS 2.0protocol).
Ethernet line
GCI V SatEquipment
Serial I/F Modem
RS 232/485Log/AnalogSi l
Data
Air SamplerCINDERELLA
HPGeDETECTOR
Bar code reader
Meteo
UPS1
UPS2
EnviromentalSensor
Power line
To IDC viaantenn
To NDCTelephone
link
PC StationController
RS 232
RS 232
RS 232
RS 232
RS 232RS 232
Ethernetli
Power line
Power line
Power line
Power line
Digital/AnalogSignals
RS 232
Ethernetli
DSPEC-
RS 232
EthernetEthernet
RS 485

A.R.A.M.E. Ref: TL 18095Project Ref.:Issue: 4 Page: 8
Any information contained in this document is property of LABEN S.p.A. andis strictly private and confidential. All rights reserved.
4.1.3. Software Documentation
The SW is developed using Microsoft Windows NT OS. This matter will be fully describedin paragraph 5.
4.1.4. Data Acquisition from the Sampler
The data acquisition from the sampler can be divided in two different items:- Sampler Data- Spectral Data
The Sampler Data are concerning both the sampling information and the State of Healthof the CINDERELLA System. The Spectral Data are related to the nuclear activitymeasurements. The local PC manages both of them.

A.R.A.M.E. Ref: TL 18095Project Ref.:Issue: 4 Page: 9
Any information contained in this document is property of LABEN S.p.A. andis strictly private and confidential. All rights reserved.
4.2. AIR SAMPLER CINDERELLA
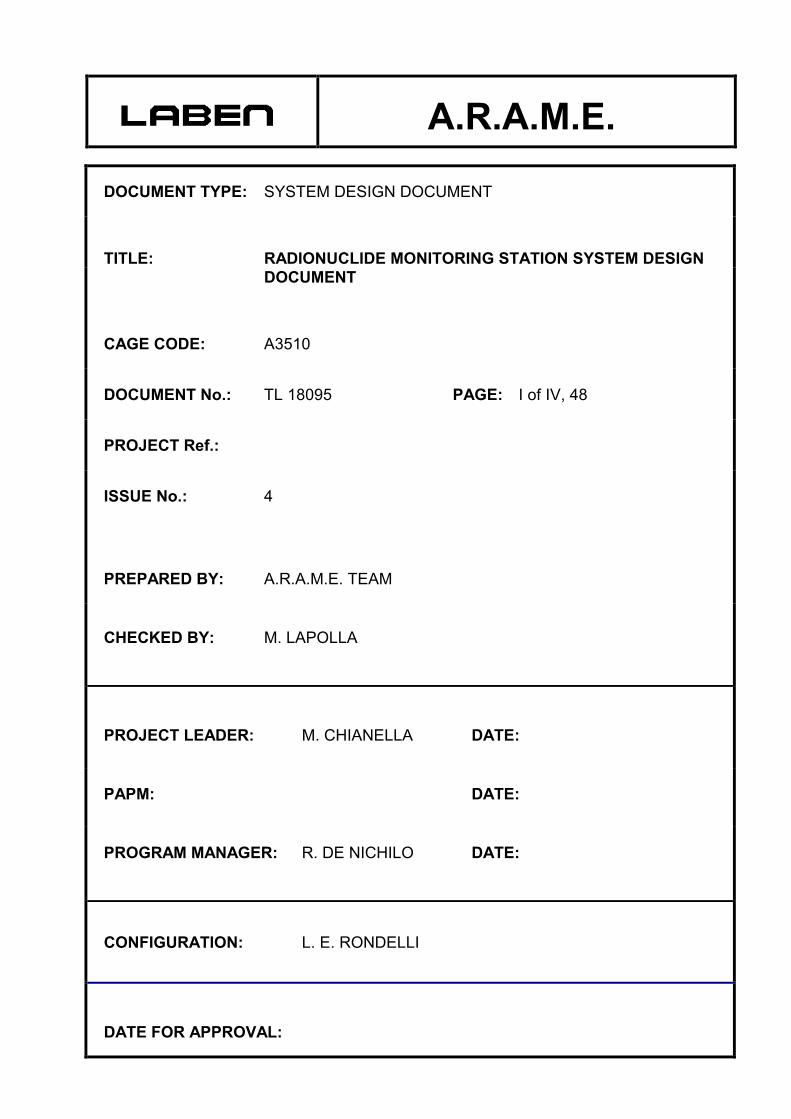
The Automated Air Sampling Station, supplied by SENYA Ltd., is the JL 500CINDERELLA II model. Cinderella machine is composed by three main units : the air-sampling unit, the data management and alarm unit (control unit) and the filtermanipulation unit.As outlined before, the Station is fully automated and only once every fifteen days anoperator is needed to mount fresh filters. In the mean time the station is working inautomatic mode.Operation mode is based on a 24 hours cycle, that means that the filter is change daily.The technical Characteristics of CINDERELLA are listed in table 1, while some picturesare shown in the figures below.
System AutomatedAir flow > 500 m3/ h
Collection time 24 or 6 hours select. (24 default)Decay time 24 or 6 hours select. (24 default)
Measurement time 24 or 6 hours select. (24 default)Time for reporting Protocol depending
Particle collection Efficiency ≥90%Air flow measuring accuracy Better then 5%
Filter. Glass fibre filters. Efficiency SENYA GF/A; ≥ 97% at ∅=0.2 µmSENYA CS 5.0; ≥ 97% at ∅=0.2 µm
Particulate collection efficiency For filter ≥ see aboveGlobal ≥ 70% at ∅=10 µm
State of health Stored and remotely accessible
Auxiliary dataMeteorological data, as option YES
Flow rate measured and updated every 10 sData availability Systems depending
Table 1: Measurements system technical characteristics (SENYA Ltd.)
A.R.A.M.E. Ref: TL 18095Project Ref.:Issue: 4 Page: 10
Any information contained in this document is property of LABEN S.p.A. andis strictly private and confidential. All rights reserved.
Fig 4.2.1.1 : The JL 500 SENYA Automated Air Sampling Station (SENYA Ltd.)

A.R.A.M.E. Ref: TL 18095Project Ref.:Issue: 4 Page: 11
A
Aluminium cassettes arecleaned and reloaded afteruse
ny information contained in this documeis strictly private and confiden
Fig 4.2.1.2. : The JL 500 SENY
Filter is cut, piled and moved to sample counting unit
nt is property of LABEN S.p.A. andtial. All rights reserved.
A Automated Air Sampling Station process scheme(SENYA Ltd.)

A.R.A.M.E. Ref: TL 18095Project Ref.:Issue: 4 Page: 12
Any information contained in this document is property of LABEN S.p.A. andis strictly private and confidential. All rights reserved.
Fig. 4.2.1.3. : CINDERELLA Station without the cover shield: the new cassette track, thecontrol panel, the robotic arm and the used cassette track.
Fig. 4.2.1.4. : CINDERELLA II Station without the cover shield: the pump connection.

A.R.A.M.E. Ref: TL 18095Project Ref.:Issue: 4 Page: 13
Any information contained in this document is property of LABEN S.p.A. andis strictly private and confidential. All rights reserved.
Fig. 4.2.1.5. : CINDERELLA Station without the cover shield: the used cassette track.
Fig. 4.2.1.6. : CINDERELLA Station: the control panel.

A.R.A.M.E. Ref: TL 18095Project Ref.:Issue: 4 Page: 14
Any information contained in this document is property of LABEN S.p.A. andis strictly private and confidential. All rights reserved.
4.2.1. Air Sampling Unit
The air sampling unit is composed by the inlet tube with the sampling head, the pumpingunit and the flow measurement unit.The air sampling must respect the requirement of a minimum flow rate of 500 m3/h andmaximum flow rate of 1000 m3/h.The inlet tube is a 460 x 290 mm iron inox rectangular tube. The length is adjusted,depending to the station, while the sampling head has been designed “ad hoc”, in order toassure a good air sampling and filter protection also in prohibitive environmental condition(snow storm and so on). In fig. 4.2.1.5. are shown two pictures of the head.
The pumping unit is composed by a vacuum pump, that is a SIEMENS ELMO-G gas ringVP, managed by a frequency converter, adopted to control the flow rate. With a 0 mbarpressure difference, the pump achieves a 1050 m3/h flow rate, while with a 200 mbarmaximum pressure difference, it achieves a flow rate of 720 m3/h (obviously in absence offilter).It is supplied by a 400 Volt / 50 Hz, 3 phase, 9 kW main power, while the CinderellaProgrammable Logic Control unit manages the (automatic) on/off of the pump.
The flow value measurement is based on the detection of the pressure difference overthe orifice (located between the filtering unit and the pump).The operational principle for the flow measurement is the evaluation of the pressure dropcreated in an air flow by an orifice. As the fluid approaches the orifice, the pressureincreases slightly, and then drops suddenly as the orifice is passed. The decrease inpressure is a result of the increased velocity of the gas passing thru the reduced area ofthe orifice. When the velocity decreases as the fluid leaves the orifice, the pressureincreases toward the original level. All of the pressure loss is not recovered because offriction and turbulence losses in the stream. The pressure drops across the orificeincreases when the rate of flow increases. When there is no flow, there is not differential.The differential pressure is proportional to the square of the velocity, it therefore followsthat if all other factors remain constant, then the differential is proportional to the square ofthe rate of the flow.This difference, in our case, is stored in a 4-20 mA message that is read by the Cinderelladata logger (VAISALA QLC50) that evaluates these data, performing also the STPcorrection, acquiring the static pressure and temperature data, detected just before theorifice (see fig. 4.2.1.1.).This data logger contains its own software inside and the characterisation of the airflow isdone by different variables (pressure in Pascal, flow rate in dm3/s, total collected volumeand total used volume). This data remain available in memory even in the case of electricfailure. The system computer reads this panel meter via an RS-232 connection.

A.R.A.M.E. Ref: TL 18095Project Ref.:Issue: 4 Page: 15
Any information contained in this document is property of LABEN S.p.A. andis strictly private and confidential. All rights reserved.
Fig. 4.2.1.1: CINDERELLA Air intake system logic scheme
Figure 4.2.1.2: Front wiew of the pump

A.R.A.M.E. Ref: TL 18095Project Ref.:Issue: 4 Page: 16
Any information contained in this document is property of LABEN S.p.A. andis strictly private and confidential. All rights reserved.
Figure 4.2.1.3 : The pump: inside the container
Figure 4.2.1.4 : The pump arrangement inside the container

A.R.A.M.E. Ref: TL 18095Project Ref.:Issue: 4 Page: 17
Any information contained in this document is property of LABEN S.p.A. andis strictly private and confidential. All rights reserved.
Figure 4.2.1.5 : The sampling head
4.2.2. The Control Unit
The Control Unit is composed by a programmable logic control unit (PLC) that controls thewhole CINDERELLA System, and by a data logger (QLC) that manages the internal data.As control unit, may be considered also the manual control panel, placed in the front sideof Cinderella.The control panel manages the whole CINDERELLA System. Starting from the left side ofit there is the red alarm button with specific key that is used to stop immediately theCINDERELLA system. The main functions digital panel on its right, allows to control, byadopting the manual mode, all the operations performed with the CINDERELLA system.The vacuum condition is managed by the little display on the right side of the mainfunction panel. Proceeding still to the right there is the flow volume display that shows theair flow that is passing through the pump.The PLC and QLC units has in charge the whole automatic managing of Cinderellaactivities, and the data acquisition-reporting to the station management unit.The PLC is mainly dedicated to the managing of Cinderella automatism, the alarms andstatus notification, while QLC is mainly responsible of the evaluation of analog/digitalparameters acquisition and notification. The connection with the Station management unitare performed by serial lines and precisely : RS232 for the PLC and the RS485 for theQLC.A modem device is supplied for external connection in order to perform upgrading on PLCsoftware directly from remote by telephone line, for reparing or maintenance activity.

A.R.A.M.E. Ref: TL 18095Project Ref.:Issue: 4 Page: 18
Any information contained in this document is property of LABEN S.p.A. andis strictly private and confidential. All rights reserved.
4.2.3. The Filter Manipulator Unit
The filter manipulation unit, with its 3D arm for sample preparation and the Bar CodeReaders is the main automotive part, since it ensure the automated control of filters duringthe air sampling, decay and measurement phases, and filter cassette/sample storageprocess. The operator of the station will first prepare the filter cassettes, with the filterpapers and then loads the cassettes to the system in the relevant fresh filter storagecontainer, while a used cassette storage container is foreseen for the processed one’s.The filter change is done by a simple sliding tray, controlled by a micro logic. Both filterstores are spring loaded. In this way, the sliding try takes always the highest filter cassettein the clean filter storage of the system and then places the sampled filter into the springloaded storage. This permits all the system to be controlled by only one moving part.The Cinderella will automatically prepare samples (cut, let decay, move to themeasurement and, finally, stores), To avoid any possibility of filter’s falsification, the usedfilter is signed by its own code that is read 2 times by the Bar Code Readers during thefirst process (from new filter cassette to inlet tube, and from air sampling to cutting anddecay phase) .The Sample Preparation is performed by the 3D arm with the cutting head, a vacuumpump and a storage tray. The arm works on 3 axis (x, y, z) and has a special cutting head;the cutting head cuts the filter, that has just come out from the sampling position (after 24hours sampling), into 15 equal parts measuring 84 ∗ 82 mm2. Then it places them insquare form plastic holder. After 24 hour of decay, the plastic holder with the cutted filter(sample), is placed on the detector for spectra measurement.
Figure 4.2.3.1. : Exploded Vision of the CINDERELLA Station

A.R.A.M.E. Ref: TL 18095Project Ref.:Issue: 4 Page: 19
Any information contained in this document is property of LABEN S.p.A. andis strictly private and confidential. All rights reserved.
The unit has the PLC controller unit (as described before), with pre-programmedsoftware, that manage all the manipulation activities. All the movements are performed byDC controlled and motorised drives system. The motors are MAXON 117438 withintegrated Line Driver (type: HEDL 5540).
Figure 4.2.3.2. : Operative working logic of the CINDERELLA Station

A.R.A.M.E. Ref: TL 18095Project Ref.:Issue: 4 Page: 20
Any information contained in this document is property of LABEN S.p.A. andis strictly private and confidential. All rights reserved.
CINDERELLA’s cassette is designed in order to perform a matrix under the glassfiber filterto concentrate the air/particles flow into 15 circular areas (diameter 76,5 mm). The filter isthen cut, automatically, into 15 square pieces and stacked one upon another (totaldimension of the stack 82x84x8mm). The filter stack is put in a plastic holder. This twosteps system (airflow concentration and cut) gives a very good geometry for gammaspectroscopy measurements.A precise requirement is relevant to the particulate collection efficiency (> 80% for 0.2 µmparticles and > 60 % for 10 µm particles). Glass fibre filters that have been alreadyemployed is the Camfil CS5.0. With the adopted filter, the requirement has been alreadyrespected.
Figure 4.2.3.3. : The cutting head

A.R.A.M.E. Ref: TL 18095Project Ref.:Issue: 4 Page: 21
Any information contained in this document is property of LABEN S.p.A. andis strictly private and confidential. All rights reserved.
Figure 4.2.3.4. : The cutted filter storage cassette
Fig. 4.2.3.5. : The filters plastic beaker

A.R.A.M.E. Ref: TL 18095Project Ref.:Issue: 4 Page: 22
Any information contained in this document is property of LABEN S.p.A. andis strictly private and confidential. All rights reserved.
Fig. 4.2.3.6. : Filters’ measurement procedures
The entire filters are flagged by a code. This code is a bar code. This is an identificationcode written on an etiquette that is sealed on the filter by the operator. When the filter isperforming his path, a bar code reader (laser based), is reading the identification code ofthe filter. With this operation it is possible to avoid any filter substitution.The filter identifier, for radionuclide automated stations, consists of 13 digits according tothe IMS standard:ccyyyymmddhhPpwhere:cc is the CTBT station number,yyyymmddhh represent the date and time (year, month, day and hour) of collection statrtPp is split identifier (11 for radionuclide whole samples, that is our case).
In case of missing reading, mistake of the sequence, or wrong data expected, error alarmis reported.
The single filter is cuttedin 15 pieces, stackedonce upon the othermaking a total high of 8mm
A.R.A.M.E. Ref: TL 18095Project Ref.:Issue: 4 Page: 23
Any information contained in this document is property of LABEN S.p.A. andis strictly private and confidential. All rights reserved.
4.3. GAMMA MEASUREMENT SYSTEM
4.3.1. Detector
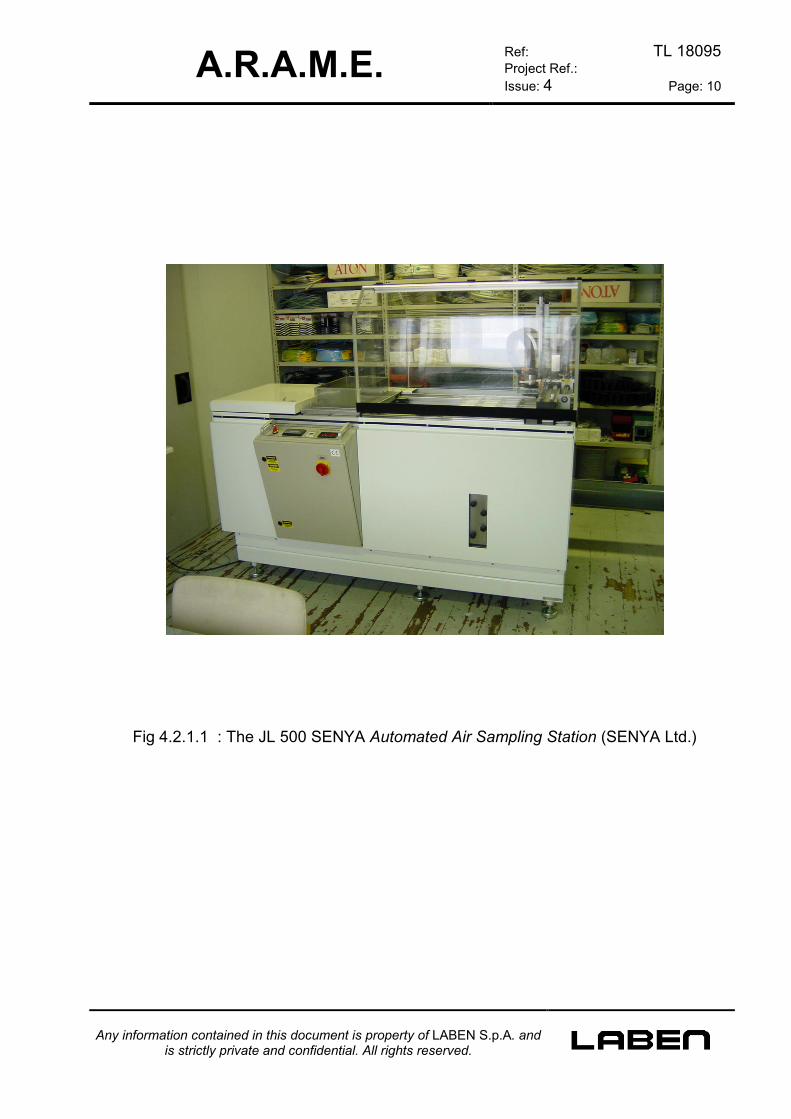
The adopted detector is provided by EG&G ORTEC. This is a High Purity Germanium(HPGe) P-type detector, ORTEC GEM-65195-S model. The detector performancesrequired are listed in table 2. The detector head has a coaxial geometry. The total depthof the detector is 228.3 mm.
Requirements
Relative Efficiency > 40% warrantedPreamplifier Remote preamplifier with 8” (20
cm) separation from crystalhousing
Peak Resolution <2.5 KeV FWHM @ 1332 KeV<1.4 KeV FWHM @ 477 KeV
Peak to Compton Ratio Warranted to be >68:1 @ 1332KeV
Energy Range Detector energy range 40-2700KeV.
Sensor Standard sensor in the end-capmeasures the temperature of thecrystal. Detector include astandard HV shutdown circuit
Table 2: HPGe detector requirements

A.R.A.M.E. Ref: TL 18095Project Ref.:Issue: 4 Page: 24
Any information contained in this document is property of LABEN S.p.A. andis strictly private and confidential. All rights reserved.
The HPGe detector is housed in a chamber surrounded by a lead shield, in order toprevent any influence to the spectra detected, caused by environmental noise. Thechamber’s entrance window is approachable from the bottom of the lead shield.The adopted lead shield is 10 cm thick. It contains two linings of Cu (1 mm) and Sn (2mm) respectively. Lead cover opening is controlled by the same Cinderella PLC as thewhole system.
Figure 4.3.1.1. : The detector chamber
Fig. 4.3.1.2.: The detector chamber: the lead shield

A.R.A.M.E. Ref: TL 18095Project Ref.:Issue: 4 Page: 25
Any information contained in this document is property of LABEN S.p.A. andis strictly private and confidential. All rights reserved.
4.3.2. Cooler System
The adopted cooler, supplied by ORTEC, is the EC-III electrical cooler. Included with theEC-III cooled detectors there is the CryosecureTM power control module. This devicesenses the main power supply loss and prevents the re-application of the detector’s biasand the start up of the compressor as well, if the power has been cut off for more then 15minutes. This is used as a prevention of short cycling on the detector’s full cycle. Thissmart feature has been implemented to prevent any detector crystal damage.
4.3.3. MCA DSPEC Plus
The Spectroscopy System is the DSPECPLUS provided by ORTEC. It’s a Digital Gamma-Ray Spectrometer "plug-and-play" network ready, characterised by an excellent resolutionand stability, for use with all types of germanium detectors. It is a PC-based package thatconnects easily to LANs. It is computer controlled with built-in In Sight™ VirtualOscilloscope Highly automated, including Detector Optimise function and patented DigitalAutomatic Pole Zero/BLR adjust. Also the crystal temperature is online monitored. Thisfeature allows the control of the status of the crystal. The temperature measurement isperformed by a thermocouple embedded into the detector crystal.The Digital MCA is SW controlled. The MAESTRO-32 SW, provided by ORTEC, whichpermits to interface the MCA with the analysis SW Gamma Vision, achieves this feature.

A.R.A.M.E. Ref: TL 18095Project Ref.:Issue: 4 Page: 26
Any information contained in this document is property of LABEN S.p.A. andis strictly private and confidential. All rights reserved.
4.3.4. Analysis SW Gamma Vision
The analysis software, provided by ORTEC, is the Gamma Vision-32 package. Thispackage is allowed to operate over multiple protocols, including TCP/IP (Internet protocol)and NetBEUI (Microsoft Protocol) while simultaneously using the NetBIOS over IPX/SPXprotocol for communicating with our Ethernet based hardware including DSPECPLUS. Thecontrol software is operating only over the IPX/SPX network protocol. However, the mostpowerful feature is that Gamma Vision-32 operates over 32-bit Windows network withoutcustom, proprietary protocols. Gamma Vision-32 can import and export files using theRMS format. In addition no proprietary formats for data acquisition are used by ORTEC.The analyses Software Specifications are listed in the table below.
Requirements ORTEC Gamma VisionPTS/CTBTO Spectrum fileformat
Conversion software canimport and export IMSformatted spectra
High Voltage Ramp All ORTEC detectors includean R-C circuit forautomatically ramping thevoltage. No matter ifcomputer controlled ormanual based HV suppliesare used
Command Language Gamma Vision includes acomprehensive JOBcommand language forbuilding batch files forrunning all major functions ofthe data acquisition andanalysis system
Auto File Save Saving files is built into theJOB language
Table 3: Analysis Software Specifications

A.R.A.M.E. Ref: TL 18095Project Ref.:Issue: 4 Page: 27
Any information contained in this document is property of LABEN S.p.A. andis strictly private and confidential. All rights reserved.
4.3.5. High Level Programming
With high level programming it is identify the capability of getting, converting andmanaging the data and controlling the nuclear and meteo instrumentation available fromthe station.
# HOW TO GET DATA FROM MCA
The data are available from the MCA by the interface provided by MAESTRO-32 SW. Itmanages different types of files.
The detector’s files are the .CFG and .CXT. The first one contains the System DetectorConfiguration information used by the MCA32.EXE. The second one is a context file (foreach detector) that is automatically created and that contains all the extra informationabout the detectors. Both these files have a binary format.
The Spectrum files are the .CHN, .SPC, .ROI. The first one is the channels file; a specialMAESTRO-32 spectral data file; it has a binary format. The second one contains thespectrum with the full analysis settings, calibration, description, etc. It has an “inform” typebinary format. The last file type contains the channel pairs created the Region of interest(ROI)/Save file function. It has a binary format as well.
The miscellaneous files are the .LIB, .RPT, .TXT extended files. The first one is a libraryfile and has an “inform” binary format. The second file type is a report file that contains theoutput of the analysis engine. It has a ASCII text format. The last one is a text file used bythe print function and has a general ASCII text format.
# CONVERTING DATA TO IMS 2.0 FORMAT
The requested CTBTO data files have to be .RMS extended. An executable file calledspc2rms converter provides the conversion from .SPC to .RMS. The CTBTO output file isnamed samplephd.rms. This is the file that has to be sent via Internet connection to theIDC. It has IMS 2.0 format.
# CONTROL MCA/DETECTOR
The control of the DSPECPLUS MCA is performed by Gamma Vision-32 SW.Concerning the detector’s set-up, controlling its hardware (HW) does the control of thedetector. These adjustments can be done, by using the ADC set-up and Adjust Controlsfunctions of Gamma Vision-32 SW. With these operations, in fact, it is possible to adjustthe conversion gain, the High Voltage (HV), the amplifier gain, the shaping time and thepole zero adjustment of the selected detector. A detector’s internal parameter can bechanged only when the detector is not in acquiring mode.

A.R.A.M.E. Ref: TL 18095Project Ref.:Issue: 4 Page: 28
Any information contained in this document is property of LABEN S.p.A. andis strictly private and confidential. All rights reserved.
4.4 METEOROLOGICAL STATION
The Meteorological Station must be considered as an integrating part of the monitorstation, because the radiological data have to be put in relation with the meteoparameters, and precisely :
- Wind direction- Wind speed- Temperature- Humidity- Precipitation- Barometric pressure
The acquisition unit is connected to the computer system via serial (RS232) interface, forthe data correlation with the nuclear measurement.The meteorological station is provided by LASTEM with the exception of the wind speedmeasurement device that will be provided by WINDOBSERVER GILL.
4.4.1 Central Data Acquisition
The meteo data acquisition is the Lastem Babuc ABC intelligent data logger, able toacquire the analogic signals from the sensors, transducing it in metereological parameters.It is also able to perform data processing, as data average in time slots, data integrationand so on.Moreover, by the sensors connectors, it supply the power necessary for all theinstruments.

A.R.A.M.E. Ref: TL 18095Project Ref.:Issue: 4 Page: 29
Any information contained in this document is property of LABEN S.p.A. andis strictly private and confidential. All rights reserved.
4.4.2 Atmospheric pressure
The sensor for the atmospheric pressure is a temperature compensated barometer, basedon piezometric principle that measures the absolute pressure. Preferably, it will beinstalled internally to the detection station, with an external air intake. Its maincharacteristics are:
Measurement field 850....1050 mbarTolerance 0,5 %Measured altitude. -300......+2000 m slmEnvironmental limits -10 °C....+60 °CModel (temperature compensated) CX111P
Table 4: Atmospheric pressure sensor characteristics
4.4.3 Precipitation
The presence of precipitation is detected by an electrical rain sensor. Rain presencesensor is able to discriminate pluviometric rainfall from condensation. The measurementprinciple employed is that of conducivity between two electrodes; these are kept at aboveenviromental temperatures in order to prevent condensation forming. The sensor can bemounted on Ø 50 mm poles.Its main characteristics are:
Output 100 mV ±0,02: present200 mV ± 0,02: absent
Environmental limits -15°C....+50 °CWeight 0,4 KgModel (with heather) C401A
Table 5: Precipitation Intensity Device Characteristics

A.R.A.M.E. Ref: TL 18095Project Ref.:Issue: 4 Page: 30
Any information contained in this document is property of LABEN S.p.A. andis strictly private and confidential. All rights reserved.
4.4.4 Temperature and Humidity
The sensors are protected against direct sun beams with anti-radiant devices. Thetemperature sensor is a PT100 termoresistence, while the humidity sensor is based on thevariance of the capacitive effect due to a change in environmental humidity. The maincharacteristics are the following:
Temperature range -30... +70 °CMeasurement field for relativehumidity
0....100 %, 10....98 % eff.
Temperature tolerance +/- 0,2 °CRelative humidity tolerance 3 %Power consumption 5 WElectrical spark protection gas arrester and tranzorbWeight 4,6 KgModel (output 0..20 mA) C512TH
Table 6: Air temperature and humidity device characteristics
4.4.5 Wind Speed / Direction
The device employed for these functions is an anemometer sensor based on ultrasoundtechnology, able to detect speed and wind direction on horizontal plane.It is supported by an heater system, when the employment foresee hazardousenvironmental condition.The main characteristchs of the sensor are listed herebelow:
Model Sonic anemometer “Windobserver Gill”Sampling frequency 39 cpsVelocity measuring field: 0 – 65 m/secVelocity meas. Error limit: 0 – 20 m/sec = 2%Direction measuring field: 0 – 359 °Direction meas. Error limit: 0 – 40 m/sec = 2%Sensor output signals: 2 0 – 5 VccPower supply 9 – 30 VccMax. cable length 25 m.
Table 7: Anemometer Sensor Characteristics

A.R.A.M.E. Ref: TL 18095Project Ref.:Issue: 4 Page: 31
Any information contained in this document is property of LABEN S.p.A. andis strictly private and confidential. All rights reserved.
4.5 INDOOR SENSORS
The indoor sensors can be divided into four main categories: detector’s temperaturesensor, tampering and switches on the station and indoor temperature and humiditysensors.
4.5.1 Detector’s Temperature
A PT100 (PD platinum 100 Ω - 0 °C) thermocouple, will transduce the Germanium crystaltemperature in a resistance value. This value is acquired by a module in the system datalogger, that convert it to the temperature relevant value . This value is sent to the StationPC as part of the SOH data.
4.5.2 Tampering Switches on Station
To avoid any sort of tampering actions the station is configured with anti tamperingsensors at the entrance door, and, where necessary, also in windows and so on. Whenthe sensor are more than one, they are putted in series, in order that when one of these isactivated, a digital module on the system data logger acquire the changing of status, anda notification is sent to the Station PC. The alarm status is generated and displayed to thelocal operator, to the IDC and is written in the E-log.
4.5.3 Indoor Humidity and Temperature
The indoor temperature and humidity sensors are the Lastem DME 701 sensors. Theseare a Thermohygrometer device dedicated to rooms or duct measuring with normalisedoutputs and ranges locally selectable.

A.R.A.M.E. Ref: TL 18095Project Ref.:Issue: 4 Page: 32
Any information contained in this document is property of LABEN S.p.A. andis strictly private and confidential. All rights reserved.
4.6. UPS SYSTEM
The UPS System has been employed in order to prevent the station from sudden powerdown, assuring an autonomy of the station of about 20 minutes, before performing theshut-down procedure.Two UPS are adopted to supply the system in case of main power failure. These items areLAN3000 (3000VA) on-line UPS provided by CHLORIDE.The first one, the “master”, is dedicated to supply the Station Computer and all the otherequipment relevant to the measurement and data transmission (data logger, EthernetHub, Multi-channel analyser, electric cooler and so on). The second one is relevant toCinderella system.Only the conditioning system of the station, and the Cinderella pump will not be sustainedby UPS.Both the UPS are linked (and managed) by the Station Manager Computer by an ethernetconnection, through the hub.In this way, when there is a main power failure at the station, the UPS “master” willsustain the station up to the autonomy of its batteries arrive at the 15%, then theshutdown procedure is activated by the Computer. Note that the value of 15% has beenevaluated from the power consumption of the system sustained, in order to assure aboutthe 20 minutes of autonomy requested.When the shut-down procedure starts, the following steps will be performed: the spectraacquisition is stopped and saved, the High Voltage to the detector is switched off, and alldata are saved and sent to IDC, then the shut-down of the Computer starts.When the shut-down procedure starts, a command is sent to the second UPS for theimmediate switch off (if Cinderella is not in the cutting phase, it doesn’t need a shut downprocedure). If the Cinderella is in the cutting phase, the command is ignored, andCinderella will continue the operations up to the end.When the power is restored, the UPS is re-actived, and the system restart automatically.Note that when the shut-down procedure is started, it can not be stopped even if the mainpower is restored before the end of the procedure.

A.R.A.M.E. Ref: TL 18095Project Ref.:Issue: 4 Page: 33
Any information contained in this document is property of LABEN S.p.A. andis strictly private and confidential. All rights reserved.
5. STATION MANAGEMENT SYSTEM
The Station management System is in charge the management of the whole Station.It is mainly composed by a computer facility designed to automate and survey the Station.
The PC schedules and controls the activities concerning acquisition, archiving andtransmission of spectral data to International Data Centre.It performs surveillance of the station with a continuous check of State-of-health data,alarm detection and notification to the IDC. ; automates the IMS station with controls overon-site equipment in performing routine and non-routine operations.Built-in procedures support the execution of non-routine operation, as background testingand efficiency calibration. Local activation is accomplished with a simple interaction likepressing a button or entering a high-level command.Parameters and status concerning the equipment and the processes at the station aregraphically presented into a local operator interface.
The following sections describe the hardware infrastructure and the commercial softwaresupplied for the Station management System and provides technical specifications for thesoftware that LABEN developed in the frame of this project.
5.1. WORKSTATION
The Computer System is a PC-520 rack mounting computer with a CPU INTEL PIII 800MHz. The system has a Static RAM of 256 Mbytes at 100 MHz and two 40 Gbyte HardDisk. Moreover it is equipped by a CD writer.The commercial software packages installed are:
- Operative System: Windows NT 4.0 (English version) with network interfaceand TCP/IP protocol
- Developing Software : Visual C++- Mail system : Gordano NT Mail- Burning Software NERO- Remote connection : PC Anywhere (English version)- Anti Virus Software : Viruscan
Moreover it is also installed the ORTEC Gamma Vision and Maestro Software toperform spectra analysis and acquisition.

A.R.A.M.E. Ref: TL 18095Project Ref.:Issue: 4 Page: 34
Any information contained in this document is property of LABEN S.p.A. andis strictly private and confidential. All rights reserved.
5.2. AUTHENTICATION UNIT
The authentication unit is supplied by CTBTO. It consists in a LUNA PCMCIA device thatperform the digital signature of the outgoing messages/data, and the authentication of theincoming commands (if any).
5.3. GPS CLOCK
The adopted GPS Synchronised module for Computer Clock Synchronisation is theNTS150 Truetime module . It provides the time for external users by an ethernet i/f. Timeis derived from the GPS satellite system with an accuracy of 1 microsecond to UTC.
NTS150 SpecificationsGPS Generator Mode:Timing Accuracy: 1 microsecond to UTC (with SA)Position Accuracy: 25 Meters SEP (without SA)Receiver input: 1575 MHz L1 C/A codeTracking: 6 parallel channelsAcquisition Time: Warm Start (has ephemeris data and position): <3 minutes. Cold start: <
20 minutesUTC to Local Offset: User selectable in hours and minutesDaylights savings: User programmable to select hour and day when DST begins and
ends.Leap second: User programmable for day of occurrence, automatic with GPS ModeSynchronised Generator Mode:Analog Input Code: IRIG A o BRatio: 2:1 to 5:1Amplitude: 0.5 to 10 VppImpedance: 50-600-10k ohms, internal switch (single ended) selectableConnector: RJ45Timing Accuracy: 2 MicrosecondsRS-422 Input Code: IRIG A o BTiming Accuracy: 2 MicrosecondsConnector: DB9External PPS: 1 microsecond timing accuracyError Bypass: Factory set to three frames
Table 8: GPS time Specifications

A.R.A.M.E. Ref: TL 18095Project Ref.:Issue: 4 Page: 35
Any information contained in this document is property of LABEN S.p.A. andis strictly private and confidential. All rights reserved.
5.4. DATA LOGGER
The data logger is an OPTO 22 Ethernet I/O system with a SNAP-B3000ENET brain.The data logger is a modular system, able to house up to 16 modules, either analog/digitalI/O modules, either serial (RS232, RS485) modules.It is the “core” of the station management system from a point of view of the datacollection, because it interfaces almost all the “external” equipment, and precisely:Cinderella PLC (via RS232 i/f)Cinderella QLC (via RS485 i/f)Bar Code Readers (via RS232 i/f)Meteo station (via RS232 i/f)Germanium temperature sensor (via analog I/O i/f)Internal temperature/humidity (via analog I/O i/f)Tampering sensors (via digital I/O i/f)
5.5. STATION MANAGEMENT SOFTWARE
The main function of the station computer system is to acquire data from the externaldevices (mainly the spectra data, but also meteo, SOH and so on) and to transmit them tothe International Data Centre (IDC) and, where applicable, to the National Data Centre(NDC): the computer acts like a collector between the data acquiring systems and theremote data centres.The computer collects and archives all acquired data and alerts, then it routes them to IDCand NDC.
Every IDC input and output message is authenticated by a board (LUNA), before exitingthe computer and verified after entering. The NDC (National Data Centre) connection is acommon internet link using LAN or a modem. For security reasons, the NDC modemconnection requires a call back from the station computer to send messages and/orproper firewall system to be installed at the station.
The computer time is UTC, based on the GPS module.
The software will be based on some processes exchanging data through a memory-mapped database the “station parameters” and files described in the section ” file system”.
The following paragraphs describe the software supplied for the RMS computer.

A.R.A.M.E. Ref: TL 18095Project Ref.:Issue: 4 Page: 36
Any information contained in this document is property of LABEN S.p.A. andis strictly private and confidential. All rights reserved.
5.5.1. System Controlling
Start / Stop Procedure
The ARAME software application is composed by two components: the kernel and theMan/Machine Interface. The interface between the two components is the stationparameters database. The Microsoft Windows NT® service facility starts the RadionuclideMonitoring System (RMS) service at the computer power on. At its turn the RMS servicestarts the RMS application kernel. This is the default behaviour, no intervention is requiredat system start up; anyway the local operator (see next paragraph) can stop the RMSservice by the service management window, then he can set up the service options(automatic/manual start, disable the service). The Radionuclide Monitoring System MMIstarts automatically at RMS users login within a standard NT login session.
The RMS application notify its start/stop to IDC/NDC by sending the relatedALERT_SYSTEM message.
Before stopping, the RMS application tries to send the current data (spectra, state ofhealth, meteo, alerts) to IDC/NDC.
RMS Users & Groups
Three NT local groups with different access level have been defined : Observer, Operator,Manager.Every RMS user must be defined as member of one of these groups, according to hisaccess rights.The Observer can navigate the RMS Man Machine Interface without performing anyactions.The Operator is fully operative at RMS level but he has a restrict access to the OperativeSystem.The Manager has full access also to the Operative System, and is the only categoryauthorized to a remote logon.User login-logout are recorded onto the station loogbook. The NT login-logout and RMSservice activation are both recorded onto the loogbook.An “inactivity timeout” has been set after 5 minutes: if the user is logged in as Operatoror Manager, when the time elapses, the RMS perform an automatic logout, and a login asobserver.Note that only the Manager privilege permit the shut-down of the system and thestop/restart of NT services.

A.R.A.M.E. Ref: TL 18095Project Ref.:Issue: 4 Page: 37
Any information contained in this document is property of LABEN S.p.A. andis strictly private and confidential. All rights reserved.
5.5.2. Routine/Non Routine Operation
Spectra acquisition
The most important RMS data are the data relevant to the spectra, and to the detectionunit status, that are acquired through the multichannel analyzer interface. Thecommunication is based on a TCP/IP connection protocol, handled by dedicated tasksthat are in charge to:
• power on the detector unit,• start the acquisition of a spectrum,• stop the acquisition of a spectrum,• pause and restart the acquisition of a spectrum• save on a named file the acquired spectrum in SPC format,• read a spectrum in SPC format from a file, convert its data into IMS format and save
the result on a named file,• save on a named file the working parameters of the unit in a known format,• power off the detector unit.
Spectra can be either 4096 channels (70-2000 KeV) or 8192 channels (40-2700 KeV): thechoice is an off-line operation and it cannot be selected by the RMS application. Thedefault is 8192 channels.
Spectra coming from the detector unit will be converted from SPC to IMS. The IMS datawill hold specific information built with offline tools (converters).
There are different kinds of spectra, depending by the working phase of the station,managed by the operator; and by the relevant working mode of the air sampler : automaticor manual.
When the station is in operative condition, and then in automatic mode, the air samplermanage two counting phases in a day: the filter count and the check source count (routineoperations). The RMS application is controlled by the status signals received by the QLCair sampler (open/close lead shield, start change cassette phase and so on), and,depending to these signals, it applies the commands to the detector to start/stop thecounting phase. The check source spectrum is originated by the exposure of the checksource under the detector for about 15 minutes, during the filter change period, while theexposure of the filter generates the spectra during the remaining day time: one full dayspectrum (about 23 ¾ hours) and a partial spectrum every 2 hours (12 partial spectra)after the filter changing operation.The RMS application can generate some other kinds of spectra when the air sampler is inmanual mode: background, blank filter and calibration spectra (non-routine operations).The application receives by the air sampler its working mode (manual) and by the operatorthe current procedure step, so that it applies the commands to the detector to generatespectra. At the end of an operation, the application saves the date of the lastmeasurement, archiving (and sending to IDC) them with the dedicated IMS stamp.

A.R.A.M.E. Ref: TL 18095Project Ref.:Issue: 4 Page: 38
Any information contained in this document is property of LABEN S.p.A. andis strictly private and confidential. All rights reserved.
The non-routine operations (background, blank filter and calibration) cannot be remote(IDC/NDC) commands.
Both the routine and non-routine operations timing are under the control of the air samplerand the operator. A non-routine operation can interrupt the running routine acquisition: theroutine acquisition will continue when the operator sets the air sampler back to theautomatic working mode and the RMS application receives this information by the airsampler.The RMS application prepares a spectrum executing commands. There are two cases.
Operative performance : partial (2 hours), full (24 hours) and Q.C. spectra. Theapplication:
1. starts the acquisition of a daily spectrum (on Cinderella QLC “end of cycle changing ”command)
2. saves into a file, every two hours, the partial spectrum data in SPC format,3. saves into an archive file the translation of the partial SPC spectrum to an IMS
format message.4. send the data to IDC/NDC (where applicable).5. stops the acquisition of the sample spectrum, at the end of the daily acquisition (on
Cinderella QLC “change filter cycle” notification).6. saves the sample full spectrum in SPC format7. saves into an archive file the translation of the full SPC spectrum to an IMS format
message.8. send the data to IDC/NDC (where applicable).9. starts the acquisition of the Q.C. spectrum (on Ciderella QLC “lead shield open”
notification)10. stops the acquisition of the Q.C. spectrum (on Cinderella QLC “end of lead shield
closure” notification)11. Saves the Q.C. spectra in SPC format12. saves into an archive file the translation of the full SPC spectrum to an IMS format
message.13. send the data to IDC/NDC (where applicable).
Background, Blank filter and Calibration spectra. The application:
1. starts the acquisition of a spectrum by operator command on RMS maintenancewindow
2. stops the running acquisition when the spectrum is ready (operator request or pre-setted time),
3. saves into a named file the spectrum data in SPC format,4. saves into an archive file the translation of the SPC spectrum to an IMS format
message,5. send the data to IDC/NDC (where applicable).
The application deletes the archived SPC and IMS spectra older than 60 days, apart fromthe calibration, blank and background spectra.

A.R.A.M.E. Ref: TL 18095Project Ref.:Issue: 4 Page: 39
Any information contained in this document is property of LABEN S.p.A. andis strictly private and confidential. All rights reserved.
The spectra data in IMS format are collected into directories named “<archive>\ims\<datamessage>\”. The IMS spectra data message directories (<data message>) are: blankphdfor unexposed blank filter, calibphd for calibration source, detbkphd for detectorbackground, qcphd for brief count of standard source, sphdf for sample pulse height data-full and sphdp for sample pulse height data-preliminary.Archive IMS spectra data message files are formatted as: “<archive>\ims\<datamessage>\yyyymmddHHMMSS.txt”. The file name holds the UTC date and time that a filewas created, that is year (yyyy), month (mm, 01-12), month day (dd, 01-31), hour (HH, 00-23), minute (MM, 00-59) and second (SS, 00-59).
Meteo and State Of Health data acquisition
The RMS application acquires data from the meteo station and data and states from theexternal devices and relates them to generate the meteorological data and the state ofhealth of the station. The application collects these data every 10 minutes or when astatus changes (collection event), saving them in IMS 2.0 format. Every 2 hours the dataare archived, one file reserved to meteo data and another to SOH (Status Of the Health)data, then they are sent to IDC/NDC and a new collection begins. The 2 hours collectionsrefer to UTC time 00:00:00, so that data are archived and sent at 2, 4, 6 and so on, twelvetimes a day.
Also in this case, the data are stored in files, and the application deletes the archived IMSmeteo and SOH data (files) older than 60 days.
Bar Code reading and check
The RMS application checks the filter sequence within the air sampler. It reads the barcode (SRID) of the filter entering into the air sampler, then it verifies the filter passing fromthe air sampling phases to the cutting/decay phase. Every phase lasts about 24 hours.A plausibility check is performed in order to verify the correctness of the data printed onthe bar code label on the filter (the one’s going in the air sampling phase) respect to thePersonal Computer data.The application stores in a dedicated file the bar code contents, linked with the date ofreading, and generates an event log on a sequence or presence of error.

A.R.A.M.E. Ref: TL 18095Project Ref.:Issue: 4 Page: 40
Any information contained in this document is property of LABEN S.p.A. andis strictly private and confidential. All rights reserved.
Operator Interfacing
Local operator manages the Radionuclide Monitoring System by a operator interfaceapplication. The application has been designed in a very simple and user friendly way,with the graphic interface represented by a main, full screen displayed, window, and withan easy and immediate mask navigation facility . The main features of the operatorinterface are described below:
• Synoptic view of station’s main devices, with related status information;• Main station’s parameters (temperature, humidity, ...) displaying with continuos
updating;• Scrolling view of station’s events (alarms, warnings, ...);• Component windows for single device parameters displaying;• Maintenance window for operator’s step by step procedure activation;• Communication windows for IDC communication line monitoring.
In the next page is reported the layout of the operator interface main window:

A.R.A.M.E. Ref: TL 18095Project Ref.:Issue: 4 Page: 41
Any information contained in this document is property of LABEN S.p.A. andis strictly private and confidential. All rights reserved.

A.R.A.M.E. Ref: TL 18095Project Ref.:Issue: 4 Page: 42
Any information contained in this document is property of LABEN S.p.A. andis strictly private and confidential. All rights reserved.
In the following there is a brief description of each functional area of the operatorinterface window:
TOOL BAR In this window area are displayed the Help activation button,the Maintenance window opening button and three button forfull, partial and check source spectrum plotting.
SYNOPTIC AREA Here are represented, in a schematic graphic way, the maincomponents of the Radionuclide Monitoring Station with therelevant communication links with local Station ComputerSystem.The main components represented are :
• Meteo Station• Detector system• Cinderella (air sampler)• Bar code system (filter equipment)• Power supply• CTBTO link (GCI)• Internal room sensor
The working status of each component (links included) isdisplayed by the drawing colour according with the followingrules:
WHITE = not initialisedGREEN = workingYELLOW = warningRED = failure
Pressing the left mouse button with the cursor over a deviceicon, it will be opened the pop up window, displaying incontinuos all the parameters related, updated.
STATION PARAMETERS In this window area are displayed, in continuos, theenvironment parameters of the Radionuclide Monitoring Stationupdated. This parameters are:
• Average air flow rate• Crystal temperature• Status of Electric cooler• Status of Uninterrupted Power Supply• Status of station tamper sensors• Average Room temperature• Average Room humidity

A.R.A.M.E. Ref: TL 18095Project Ref.:Issue: 4 Page: 43
Any information contained in this document is property of LABEN S.p.A. andis strictly private and confidential. All rights reserved.
As for synoptic area components, the single parameter status isdisplayed by the drawing colour of its value.
EVENTS LOG A dedicated scrolling area of the screen displays all the events(alarm, warning, ...) generated by the Station’s devices, by theroom environment sensors and by the RMS control applicationitself. The colour of each text message represents the gravitylevel of the related event:GREEN = informationYELLOW = warningRED = alarmThe default-working mode is continuos updating (max. 100events).
COMMANDS BUTTONS Through the “Retrieve” command button the operator canswitch to events archive display: in this way is possible todisplay stored events (in files), selecting them by date (monthand year). The command button : “Zoom” activates a zoomeddisplay of the events list. The “Hold” button allows the operatorto freeze/restore, only at operator interface level (screen), thecontinuos updating of events log.It is possible to acknowledge events, by “ACK” button, in theonline list. When acknowledged the event takes the “cian”colour.“EXIT” button perform the output of the RMS window .
STATUS BAR In this area are displayed time and date in UTC format, thename of the operator who is currently logged in the system andthe number of station parameters which are currently in failurestatus.
Mask Navigation
Any of the main component buttons, associated to each device of the RadionuclideMonitoring Station, as displayed in the main window, when selected by the mouse, startthe opening of a sub-window in which are listed the related parameters. For eachparameter is displayed a descriptive text and its current value, printed in different colourdepending on its monitoring status. The colour rules are the same used for displaying thesynoptic view.

A.R.A.M.E. Ref: TL 18095Project Ref.:Issue: 4 Page: 44
Any information contained in this document is property of LABEN S.p.A. andis strictly private and confidential. All rights reserved.
As an example, is reported the component window of the ORTEC detector:
Fig. 5.5.2.1. Screen-shot of the detector sub-window
Through mouse selection of each of the listed parameters, is possible to open dedicatedwindows which allow the operator to see and modify the threshold limits (analogparameters) or alias values (digital parameters).
Referring to the Maintenance window, when opened, it contains informations about thestatus of the system, and the command buttons here listed:
• Operative restart of the system• Save the spectra performed (calibration, blank, background)• Calibration step by step procedure activation• Last calibration spectrum plotting (with the relevant date)• Blank filter step by step procedure activation• Last Blank filter spectrum plotting (with the relevant date)• Background spectrum step by step procedure activation• Last Background spectrum plotting (with the relevant date)• Last filter substitution date storage.

A.R.A.M.E. Ref: TL 18095Project Ref.:Issue: 4 Page: 45
Any information contained in this document is property of LABEN S.p.A. andis strictly private and confidential. All rights reserved.
Step by step procedures guide the operator during the execution of non-routine operationon the system, displaying on the screen proper help windows. Here is reported the screen-shot of this mask:
Fig. 5.5.2.2. Maintenance window, screen shot

A.R.A.M.E. Ref: TL 18095Project Ref.:Issue: 4 Page: 46
Any information contained in this document is property of LABEN S.p.A. andis strictly private and confidential. All rights reserved.
After the execution of one of the step by step procedures, the operator interface processgenerates an event log.
The Communication windows contain information about the communication statusbetween the local station computer and the IDC data collecting centres. This window canbe activated simply pressing the left mouse button with the cursor over the related deviceicon, in the synoptic view.
IDC Communication window contents:
• Status of the link with CTBTO• Last mail correctly received date and time display controls.• Last mail received with error date and time display controls.• Mail receiving error description display control.• Spectra transmission period setting control.• Statistics information
Herebelow is displayed the screen-shot of this window :
Fig.5.5.2.3. Communication window screen-shot

A.R.A.M.E. Ref: TL 18095Project Ref.:Issue: 4 Page: 47
Any information contained in this document is property of LABEN S.p.A. andis strictly private and confidential. All rights reserved.
5.6. DATA ARCHIVE MANAGEMENT
As previously said, all the data, events and so on are archived by the software, in adedicated directory.The main directory : “archive”, contains a series of sub-directory, each one dedicated to akind of information.The sub-directories are :
• Event• Ims\data_messages• Spc\data_messages• Spc\srid
The event sub-directory archives event-files. Each file is relevant to the events logged in amonth at the station, and is the copy of the messages displayed in the “Event log” windowin the RMS window. The files name (is a txt extension) holds the year and the month:yyyymm.
The Ims\data_message are a series of sub-directory, each one relevant to a kind ofinformation relevant to the data acquired. The sub directories are :
• Alert_flow• Alert_system• Alert_temp• Alert_ups• Met• Rmssoh• Blankphd• Calibphd• Detbkphd• Qcphd• Sphdf• Sphdp
The first ones are relevant to alert messages collection and to the meteo and SOHparameters collection. The last six are relevant to the spectra, and will be copied also inthe SPC sub-directory (see below).In each sub-directory the files name are relevant to the UTC data and time that the singlefile was created and precisely : yyyymmddHHMMSS_MessID.txt, where MessID is theglobal counter of IDC messages.Note that, apart from Blankphd, Calibphd and Detbkphd, that are the files relevant to theBlank, Calibration and Background spectra, all the other files are arranged in a 6 monthscircular buffer, that means that after 6 months, the file is overwritten.

A.R.A.M.E. Ref: TL 18095Project Ref.:Issue: 4 Page: 48
Any information contained in this document is property of LABEN S.p.A. andis strictly private and confidential. All rights reserved.
The Spc\data_message are a series of sub-directory, each one relevant to a kind ofspectra acquired. The sub directories are :
• Blankphd• Calibphd• Detbkphd• Qcphd• Sphdf• Sphdp
As previously said, that directories (and the spectra files contained) are a copy of the onesarchived in IMS\data_messages sub-directory.The arrangement and the behaviour of the files in this sub-directory is the same describedIn the previous one.Qcphd is the sub-directory relevant to the QC spectra collected, Sphdf is the sub-directoryrelevant to the sample full spectra collected, while Sphdp is the sub-directory relevant tothe partial spectra collected.
The Spc\srid sub-directory archives filter lists files. Each file is relevant to the list of thefilter processed (read) in a month. The files name (is a txt extension) holds the year andthe month : yyyymm.
5.7 DATA SECURITY
The data security, as understood in this chapter, is relevant to the capability to protect thedata from any kind of manipulation; while for the reliability of the data (spectra), anti-tampering devices have been implemented, as before described.The protection of the data is assured by some features, implemented at Station computerlevel.First of all there is the user log-in account, where hierarchical access levels has beendefined, each one with different operative capability. Each access level (apart from thelowest, that is only as “observer”) is protected by password, and the login is also reportedin the log file.The most important device for the data protection is the digital signature.All the data acquired by the Computer (spectra, SOH, alert and so on), before to be sentto IDC, are converted in IMS format, and then are digitally signed.At the reception of the data, at IDC site, the digital signature is checked in comparisonwith the data acquired, in order to verify that no manipulation happened during thetransmission. Obviously this is a “two way” system : infact also the data or commandssent from IDC to the station are digitally signed, and, at station level, are checked beforebeing executed.Digital signature is implemented by the “LUNA 2” system (by Chrysalis-ITS), that iscomposed by a PCMCA card and a PCI board to be inserted in the Station computer.