Embed Size (px)
Citation preview

Arabic Authorship Attribution: An Extensive Study onTwitter Posts
MALIK H. ALTAKRORI, School of Computer Science, McGill University, CanadaFARKHUND IQBAL, College of Technological Innovation, Zayed University, United Arab EmiratesBENJAMIN C. M. FUNG∗, School of Information Studies, McGill University, CanadaSTEVEN H. H. DING, School of Information Studies, McGill University, CanadaABDALLAH TUBAISHAT, College of Technological Innovation, Zayed University, United Arab Emirates
Law enforcement faces problems in tracing the true identity of offenders in cybercrime investigations. Mostoffenders mask their true identity, impersonate people of high authority, or use identity deception andobfuscation tactics to avoid detection and traceability. To address the problem of anonymity, authorshipanalysis is used to identify individuals by their writing styles without knowing their actual identities. Mostauthorship studies are dedicated to English due to its widespread use over the Internet, but recent cyber-attacks such as the distribution of Stuxnet indicate that Internet crimes are not limited to a certain community,language, culture, ideology, or ethnicity. To effectively investigate cybercrime and to address the problem ofanonymity in online communication, there is a pressing need to study authorship analysis of languages suchas Arabic, Chinese, Turkish, etc. Arabic, the focus of this study, is the fourth most widely used language onthe Internet. This study investigates authorship of Arabic discourse/text, especially tiny text, Twitter posts.We benchmark the performance of a profile-based approach that uses n-grams as features and compare itwith state-of-the-art instance-based classification techniques. Then we adapt an event-visualization tool thatis developed for English to accommodate both Arabic and English languages and visualize the result of theattribution evidence. In addition, we investigate the relative effect of the training set, the length of tweets,and the number of authors on authorship classification accuracy. Finally, we show that diacritics have aninsignificant effect on the attribution process, part-of-speech tags are less effective than character-level andword-level n-grams.
CCS Concepts: • Human-centered computing → Visualization toolkits; • Computing methodolo-gies→ Language resources; Supervised learning by classification; Classification and regression trees;Support vector machines; • Information systems→ Content analysis and feature selection; Information ex-traction; • Networks→ Online social networks; • Applied computing→ Investigation techniques; Evidencecollection, storage and analysis;
Additional Key Words and Phrases: Authorship Attribution, Visualization, Short Text, Social Media, Twitter
∗Corresponding author
Authors’ addresses: Malik H. Altakrori, School of Computer Science, McGill University, 3480 Rue University, Montréal, QC,H3A 2A7, Canada, [email protected]; Farkhund Iqbal, College of Technological Innovation, Zayed University,Abu Dhabi, United Arab Emirates, [email protected]; Benjamin C. M. Fung, School of Information Studies, McGillUniversity, 3661 Peel St, Montréal, QC, H3A 1X1, Canada, [email protected]; Steven H. H. Ding, School of InformationStudies, McGill University, 3661 Peel St, Montréal, QC, H3A 1X1, Canada, [email protected]; Abdallah Tubaishat,College of Technological Innovation, Zayed University, Abu Dhabi, United Arab Emirates, [email protected].
Permission to make digital or hard copies of all or part of this work for personal or classroom use is granted without feeprovided that copies are not made or distributed for profit or commercial advantage and that copies bear this notice and thefull citation on the first page. Copyrights for components of this work owned by others than the author(s) must be honored.Abstracting with credit is permitted. To copy otherwise, or republish, to post on servers or to redistribute to lists, requiresprior specific permission and/or a fee. Request permissions from [email protected].© 0 Copyright held by the owner/author(s). Publication rights licensed to ACM.2375-4699/0/0-ART0 $15.00https://doi.org/
ACM Trans. Asian Low-Resour. Lang. Inf. Process., Vol. 0, No. 0, Article 0. Publication date: 0.

0:2 Altakrori et al.
ACM Reference Format:Malik H. Altakrori, Farkhund Iqbal, Benjamin C. M. Fung, Steven H. H. Ding, and Abdallah Tubaishat. 0.Arabic Authorship Attribution: An Extensive Study on Twitter Posts. ACM Trans. Asian Low-Resour. Lang. Inf.Process. 0, 0, Article 0 ( 0), 52 pages.
1 INTRODUCTIONCriminals are exploiting the anonymous nature of the Internet to covertly commit crimes online.These perpetrators create fake IDs while conducting illegitimate, malicious social media communi-cations or attacking online e-commerce systems such as eBay and Amazon. Authorship analysistechniques have been successful [17, 29] in defending users against such attacks and addressingthe issue of anonymity without sacrificing the privacy of Internet users.
Authorship attribution helps identify the original author of a given anonymous text by extractingand analyzing the author-specific writing style features [65]. Initially, authorship attribution wasused in the field of literature to identify the original authors of novels, plays, or poems [32, 36, 65].Later, its applications have been extended to forensics by investigating the true authors of malicioustexts and/or using the analysis results as evidence in courts of law [14]. Various computationaltechniques have been proposed for different languages and types of text such as Twitter posts,Facebook status, Short Message Service (SMS) messages, or chat conversations.
Fig. 1. Top ten languages used over the Internet according to a study published by Miniwatts MarketingGroup [47].
Compared to the large body of authorship attribution research for popular languages such asEnglish [20, 43, 44] and Chinese [33] [70], only around 10 studies are dedicated to Arabic authorshipanalysis [2, 6, 7, 37, 50, 59]. However, Arabic is the 4th most popular language used over the Internetafter English, Chinese, and Spanish (see Figure 1. It accounts for 4.8% of the total use. The research
ACM Trans. Asian Low-Resour. Lang. Inf. Process., Vol. 0, No. 0, Article 0. Publication date: 0.

Arabic Authorship Attribution: An Extensive Study on Twitter Posts 0:3
literature shows that researchers mostly direct their efforts toward English, with few works beingdone on other languages. This is attributed to the various challenges that face researchers whenthey analyze an Arabic document; techniques developed for English may not be directly applicableto other languages. As noted in Abbasi and Chen [2], Arabic has three special characteristics,namely word length and elongation, inflection, and diacritics. These characteristics prevent thedirect application of English authorship analysis techniques because of their effect on the featureextraction process.Moreover, among these few relevant works on Arabic, none focus on Arabic short text such as
social media posts, chat logs, and emails. Cybercrime investigators must frequently deal with thesekinds of short text. Existing Arabic authorship studies assume that there are plenty of text datafor authorship analysis. Specialized methods have been proposed for novels [37], books [6, 50, 59],articles [7], and the combination of forum messages [2]. However, this may not be the case inreal-life applications. Forensic investigators may have only a limited set of samples to be analyzed,especially for cybercrime investigation. Authorship attribution over short text is more challengingdue to the limited information carried by the text. Even for English, the length of the text samplehas a significant impact on the attribution result. Specialized techniques are needed for the shorttext scenario [29].
Furthermore, little focus was given to visualizing the results beyond providing an accuracy and aconfidence value. For English, only three techniques [3, 9, 35] have been proposed for this purpose.For Arabic, no techniques have been adopted or proposed. Classification techniques that are knownto produce the best results are mostly black-box methods with complicated computations. Asan example, Support Vector Machines (SVM) and Random Forests are known to produce goodaccuracy, yet the results are difficult to interpret or explain. Law enforcement agents use the skillsof an expert witness, such as an authorship attribution expert or a linguistics expert. The role ofthese experts is to help law enforcement officers narrow down the number of potential suspects, orprovide evidence to justify a conclusion in a court of law. In order for experts to perform their roleproperly, they have to find the most plausible author from the candidate authors and show howthey reached their conclusion in a clear and presentable way. To do so, they must use a classificationmodel that provides high accuracy as well as being easy to present and explain, as opposed to usinga model that is vague or complex, even if they have to sacrifice the performance by a bit.In this paper, we address the aforementioned research gap by focusing on the Arabic short
text from the social media platform Twitter1. We customize and apply existing Arabic authorshipattribution techniques on Twitter data. We also adopt an English visualizable attribution techniquebased on n-gram to Arabic. We compare their performance on Twitter posts and report our findings.To our best knowledge, this is the first work reporting the performance of authorship attributionon short Arabic text in general. Moreover, this is the first work adopting a visualizable approachfor Arabic authorship attribution.
1.1 Problem StatementWefirst provide an informal description of the authorship attribution problem on short text, followedby a formal problem definition. Given a set of candidate authors of an anonymous, relatively short,text and a set of sample writings for each one of the candidate authors, an authorship attributionexpert analyzes the anonymous text and the sample writings of each author to capture the writingstyles of the anonymous text as well as the sample writings of each candidate author. Based onthat, the authorship attribution expert identifies the most plausible author of the anonymous textas the author whose writing style has the highest similarity to the writing style captured from the
1www.twitter.com
ACM Trans. Asian Low-Resour. Lang. Inf. Process., Vol. 0, No. 0, Article 0. Publication date: 0.

0:4 Altakrori et al.
anonymous text. As mentioned earlier, this work addresses the authorship attribution problemin Arabic text, specifically, Arabic tweets. However, for brevity, we drop the word “Arabic" from“Arabic writing samples" and “Arabic tweets". Furthermore, we use the terms “a writing sample"and “tweet" interchangeably throughout the paper to refer to the same unit of text.
Formally, let C = {C1, ..., Cn} be the set of candidate authors of an Arabic anonymous text a andWi be a relatively large collection of sample writings that belong to candidate authorCi ∈ C. Finally,let f(a,Wi ) be a function that computes the similarity between the writing styles of the anonymoustext a and each sample writing inWi . The problem of authorship attribution is to identify the mostplausible author Ci from the set of candidate authors C, where f(a,Wi ) > f(a,Wj ) ∀ Ci , Cj ∈ C andCi , Cj .
1.2 ResearchQuestionsThis study adopts and benchmarks the profile-based n-gram approach and the instance-basedapproach to address the problem of authorship attribution in Arabic short text from Twitter.Specifically, we answer the following questions in this paper.(1) How does then-gram approach perform compared to state-of-the-art instance-based classification
techniques under varying attribution scenarios? A typical authorship attribution problem hasthree factors that affect the performance, namely, the number of candidate authors, thenumber of writing samples per candidate author, and the length of the writing samplesand the anonymous text under investigation. We benchmark the state-of-the-art instance-based classification techniques, such as Naïve Bayes (NB), Support Vector Machines (SVM),Decision Trees, and Random Forests (RF), with stylometric features. Then we compare theirperformance with the n-gram approach under varying attribution factors.
(2) Which n-gram level (character, word, or syntactic) is the most helpful in distinguishing theauthors’ writing styles? The use of the n-gram approach in authorship analysis has not beenstudied for Arabic short text. In this paper, we will investigate the performance of the n-gram approach on the characters, word, and syntactic levels. For the syntactic level, we usepart-of-speech (POS) n-grams.
(3) How important are diacritics to the attribution process when the n-gram approach is used?Diacritics in Arabic appear on the character level, and they are optional. The fact that theirpresence with a word could change its meaning is one of the morphological properties thatmake Arabic different from English. We will compare the performance of the attributionprocess using n-grams before and after removing the diacritics from the text.
(4) When using instance-based classification techniques, how important is it to use all three categoriesof stylometric features? There are three categories of stylometric features: lexical, structural,and syntactic. They have been intensively studied for authorship analysis, especially inEnglish. For the sake of completeness, we investigate the importance of each category forthe attribution process in Arabic.
1.3 ContributionThe contribution of this work is summarized as follows:
• Providing the first extensive authorship study on Arabic tweets. To the best of our knowledge,this is the first work that investigates authorship attribution on Arabic short text in generaland Arabic tweets in specific. We conduct a systematic evaluation for various attributiontechniques on Arabic tweets and make the dataset publicly available 2 Not only does this
2Due to Twitter regulations for developers [67], we cannot explicitly share the actual text for each tweet. Instead, a list of
ACM Trans. Asian Low-Resour. Lang. Inf. Process., Vol. 0, No. 0, Article 0. Publication date: 0.

Arabic Authorship Attribution: An Extensive Study on Twitter Posts 0:5
open the door for further investigation of other authorship attribution techniques to be usedfor Arabic, but can also serve as a benchmark of experimental results for future work.
• Providing an interactive system to visualize the attribution process and results. Our work onArabic authorship analysis is a significant extension of [19], which supports only English.One main application of authorship attribution techniques is to use the results and analysis asevidence in the context of criminal investigation; therefore, the interpretability of the resultsis as important as high accuracy. We have adopted the original models that were developedspecifically for English and proposed using a language detection tool to automate selectingbetween Arabic and English; we added Stanford’s part-of-speech tagger for Arabic and wechanged the forms’ orientation to show English or Arabic. With these modifications, the toolis able to visualize the authorship attribution evidence for the Arabic language in an intuitiveand convincing style.
The rest of the paper is organized as follows: Section 2 presents a comprehensive review ofauthorship attribution work on Arabic in general and short English text. Section 3 describes thetwo approaches to perform authorship attribution: an instance-based approach and a profile-basedapproach. In Section 4, we describe our experimental design, followed by the results and discussionin Section 5. Finally, Section 6 concludes the paper.
2 LITERATURE REVIEWThis research targets authorship attribution for short Arabic messages, specifically, Arabic tweets.Although Arabic is widely used over the Internet [59], literature shows that authorship attributionresearch focuses on English, while research on Arabic is scarce. To the best of our knowledge, noneof the available work on Arabic targets short text. The term “short" was formerly used to describeone page or a blog post; currently, the term is used to describe much shorter forms of text, e.g., aFacebook status, a Twitter post, a SMS message, or an Instant chat Message (IM).We start by reviewing the techniques used for authorship attribution on non-Arabic short text
and then review the work done on Arabic text, regardless of the text length. While doing this, wekeep in mind the difference between Arabic and English as detailed in [2]. According to Abbasiand Chen [2], authorship attribution techniques developed for English cannot be directly appliedto Arabic text without modifications since Arabic and English languages have different languageproperties.
2.1 Authorship Attribution on Non-Arabic Short TextAuthorship attribution on non-Arabic short text has addressed different social media, e.g., SMSmessages, chat logs, and Twitter posts. In reviewing the work on these topics, we look at thefeatures and the classification techniques.
Chat Logs. One area in which authorship attribution on short text is investigated is chat conver-sations, such as Internet Relay Chat (IRC) and online chat rooms. Examples of the work done onthese domains are [28] and [38].Inches et al. [28] used word-level n-grams as features and statistical modeling, namely X 2 and
Kullback-Leibler divergence, to compute the similarity between a candidate author and a querytext. They started by generating an author profile for each author, which they did in two steps.The first step is concatenating all the text generated by a single user into one document. The nextstep divides the text into vectors by using “non-letter characters" as tokens, or stop marks. When a
Ids and a Python script to crawl the tweets are provided via http://dmas.lab.mcgill.ca/data/Arabic_Twitter_dataset.zip. Thisseems to be a common practice in the research community [66].
ACM Trans. Asian Low-Resour. Lang. Inf. Process., Vol. 0, No. 0, Article 0. Publication date: 0.

0:6 Altakrori et al.
query text is introduced, a profile is created for it, and its profile is compared to all the authors’profiles to find the most similar one.Layton et al. [38] used three similar techniques, namely Common n-grams (CNG) [33], Source
Code Author Profiles (SCAP) [20], and Re-centered Local Profiles (RLP) [40] to collect character-leveln-grams and create the authors’ profiles. In addition, they applied the Inverse Author Frequency(IAF) to weight the n-grams, which, as they explained in their paper, is merely a trajectory ofthe Inverse Document Frequency (IDF) weighting approach on profiles, as opposed to documents.To compare the distance between different profiles, they used the relative distance [33] for theCNG-generated profiles, the size of the intersection between two profiles for the SCAP-generatedprofiles, and a modified version of the cosine similarity presented in [40].
SMS. Ragel et al. [54] and Ishihara [30] addressed the authorship attribution problem in SMSmessages. The number of authors in Ragel et al. [54] was 20 authors, while Ishihara [30] reached228 authors. In their paper, Ishihara [30] reported using 38,193 messages for all the authors. Thismakes the average number of messages per author around 167 messages. On the other hand, Ragelet al. [54] used 500 messages for each author; hence, the total number of messages in their datasetwas 10,000 SMS messages.
Both Ishihara [30] and Ragel et al. [54] used word n-grams as features and combined the SMSmessages together, in one document, to increase the text size. This is important because SMSmessages, by nature, are limited in size, containing very few words. In terms of classification andvalidation, Ragel et al. [54] divided their dataset into training and validation sets, and then theycreated a profile for each author in both sets. In the following step, they used the Euclidean distanceand the cosine similarity to measure the distance between the profiles in the validation and thetraining sets. They show that grouping 300–400 SMS messages per author increases the uniquenessof an author’s profile, leading to a higher accuracy when an author’s profile is being classified.However, they do not mention the number of words a profile contained when they combined allthese messages, nor the average number of words per message.
In contrast, Ishihara [30] grouped the SMS messages until a certain number of words was reached.For example, if the current total number of words is 197 words, the maximum is 200 and the nextmessage to be added has four words, they would stop at 197. If it had less than four words, thenthey would add this message and check the next one. In terms of validation, they created two setsof messages: one set contained messages from the same author and the other contained messagesfrom different authors. Then, a word n-grams model was built for each set of messages. To measurethe similarity between the different models, they used the Log Likelihood Ratio function. Theresults show that accuracy reaches 80% when 2,200 or more words per set were used. Since theapplication of our work is mainly for digital forensics, we believe that it would not be possible tocollect enough messages from the candidate authors to get this high number of words.
Twitter Posts. Twitter is the most targeted source for short text in the authorship attributionliterature. The number of candidate authors in these studies was on a small scale ranging from 10to 120 authors in [10] and [63], respectively, and on a large scale up to 1,000 authors in [58]. Themost common feature representation approach that was used is the character-level n-grams.Both Cavalcante et al. [12] and Schwartz et al. [58] used character- and word-level n-grams as
features while using a SVM classification model. In both papers, the number of candidate authorsstarted at 50, then increased gradually to 500 in [12], and to 1,000 authors in [58]. A major differencebetween these two papers is that Schwartz et al. [58] proposed the concept of K-signature, whichthey define as “the author’s unique writing style features that appear in at least K% of the author’sTwitter posts".
Layton et al. [39] used the SCAP methodology to address the authorship attribution problem for
ACM Trans. Asian Low-Resour. Lang. Inf. Process., Vol. 0, No. 0, Article 0. Publication date: 0.

Arabic Authorship Attribution: An Extensive Study on Twitter Posts 0:7
Twitter posts. In their paper, they divided the tweets into training and validation tweets. Then, theycombined all the training tweets that belonged to the same author in one document and extractedonly character level n-grams from this document as features. To create a profile for that author,they picked the top L most frequent features in his document and ignored the rest. The tweets inthe validation set were handled in the same way and a profile was created for each author as well.Finally, the validation profile was compared to every author’s profile and the similarity was simplymeasured by counting the number of common n-grams between the test profile and the candidateauthor’s profile, i.e., the intersection between the test profile and the candidate author’s profile.This similarity measure is known as the Simplified Profile Intersection (SPI).
Bhargava et al. [10] and Silva et al. [63] chose a different approach to extract features thanthe common n-grams method. Bhargava et al. [10] proposed four categories of features: lexical,syntactic, Twitter-specific, and “other". Examples of lexical features are the total number of wordsper tweet and the total number of words per sentence. Examples of syntactic features are thenumber of punctuation marks per sentence and the number of uppercase letters. Examples onTwitter-specific features are the ratio of hashtags to words and whether the tweet is a retweet.Finally, examples of features that belonged to the “other" category are the frequency of emoticonsand the number of emoticons per word. As for the classification model, a radial, nonlinear kernelfor SVM was used. Similarly, Silva et al. [63] applied a combination of features that they categorizedinto four groups: quantitative markers, marks of emotion, punctuation, and abbreviations. Twodifferences were observed in these two papers: the first is that Silva et al. [63] used a linear SVMinstead of a nonlinear one. The other difference is that Bhargava et al. [10] experimented withcombining the set of Twitter posts into a number of groups in order to enlarge the text body beforethe feature extraction step. Bhargava et al. [10] showed that grouping a set of 10 tweets togetherachieved better accuracy.
Deep Learning-Based Authorship Attribution Techniques. Deep learning techniques have receiveda lot of attention recently due to their tremendous success in various domains. Particularly, beingend-to-end methods where they do not require manual feature engineering makes them veryfavorable over traditional methods. This is because selecting the right set of features is crucial forachieving high accuracy [22]. However, much of this success is attributed to the availability of atremendous amount of data to train such models. One way to interpret how a Neural Networkworks is that it learns an implicit representation for the data in the hidden layers, and then performthe classification at the output layer based on the learned abstract representation. Given enoughtraining samples, the learned representation is better than the hand crafted features in representingthe problem to the classifier, hence, the better performance [22]. In this section, we review theworks that use deep learning-based methods for authorship attribution of short text.
In a class project, Rhodes [55] explored the direction of authorship attribution using a Convo-lutional Neural Network (CNN). In their experiments, they used 2 hidden layers: an embeddinglayer, and a convolution module (convolution, and pooling) on the character-level with filters ofsizes (3, 4, and 5). The model was applied on a dataset of 8 English books for 6 authors collected byRhodes [55], and 28 English novels written by 14 authors borrowed from the PAN 2012 AuthorshipIdentification competition. The classification was performed on the sentence level rather than onthe document level. Rhodes [55] only reported the number of sentences per author for the PAN2012dataset which ranged from around 7,000 to around 36,000 sentences. Rhodes [55] reported thattheir accuracy on the Books dataset was about 76% and compared it to the probability of pickingthe correct class randomly, which was 16.3%. For the PAN2012, the reported accuracy was 20.52%while the random baseline was 7.14%. The accuracy was not high, and the comparison with therandom baseline is not very meaningful.
ACM Trans. Asian Low-Resour. Lang. Inf. Process., Vol. 0, No. 0, Article 0. Publication date: 0.

0:8 Altakrori et al.
Ruder et al. [57] also used various CNN configurations to address the attribution problem onemails, movie reviews, blog posts, tweets, and Reddit forum posts. Their proposed method wascompared to traditional techniques, such as SCAP [20] and SVM with n-grams at the words’ stemslevel. For experiments on tweets, the authors compared two settings: 10 authors and 50 authorswhere the average number of tweets per author is 229, and the average tweet size in terms of wordsis 19. The best reported results were using a character-level CNN where their model achievedan accuracy of 97.5% and 86.8% for 10 authors and 50 authors, respectively. This result might bebiased because it is unclear if the authors had applied any preprocessing to remove usernamesand hashtags [39], in addition to collecting a dataset of authors who are prolific on twitter, suchas celebrities. Ruder et al. [57] further explained that the network may have learned to classifythe samples using subtle hints, such as usernames, and frequent terms that are used as a form ofbranding.
Ge et al. [21] used a feedforward Neural Network architecture to learn a Language Model insteadof using a Neural Network as a classifier. Essentially, the network learned a representation foreach word based on its context (a window of 4 grams). The language model was evaluated usingperplexity, which measured the model’s surprise in seeing a test sentence. Ge et al. [21] optimizedtheir network to minimize3 the perplexity while training a separate language model per authorto predict a set of words in a test sentence. The author whose language model has the lowestperplexity is the most plausible author of the test sentence. Using this approach, Ge et al. [21]tried to classify transcripts of 16 online courses, hence 16 authors, from the Massive Open OnlineCourses (MOOC) Coursera platform. There are around 8,000 sentences per course, and an averageof 20 words per sentence. This approach achieved 95% accuracy, which according to Ge et al. [21],is comparable with [16] which uses Naiv̈e Bayes for classification. However, the authors noted thatthe task might be too easy due to the availability of a huge training set.
Shrestha et al. [62] used a 3-layer CNN on the character bi-grams level to address the attributionproblem for English tweets, and proposed a technique to visualize the outcome of the attributionprocess. With 50 authors and 1,000 tweets per author, Shrestha et al. [62] reported that theirmethod can achieve an accuracy of 76.1% and compared it with SVM running on n-gram, whichhas an accuracy of 71.2%. It is unclear if the authors had removed hashtags and usernames beforeperforming the attribution process, as per the suggestion in [39]. Additionally, about 30% of theauthors behave as “bots", where they always use the same pattern to tweet. For example, a tweetabout the weather could have the following format: @<<network name>>: Today <<data>>, thehigh temp. is << ## >> and the low is << ## >>. It is unclear whether or not these “bot" authorswere excluded from the experiments. In terms of visualization, Shrestha et al. [62] calculated theSaliency score [41] for each character, and used the color intensity to express its value. Compared toour work, we visualize the similarity on three levels: characters, words and POS, and we provide aninteractive tool where the user can focus on a certain feature, and further investigate the candidateauthors’ profiles.To summarize, using deep learning techniques for authorship attribution may achieve high
accuracy only when a large volume of training data is available. Both Kim [34] and Zhang et al. [69]used Convolutional Neural Networks (CNN) on the word-level and the character-level, respectively,to perform various text classification tasks. Their results showed that training a CNN requires ahuge amount of data. In fact, Zhang et al. [69] noted that using a Logistic Regression classifier withn-gram features achieves a higher accuracy compared to a character-level CNN when the numberof training samples is less than 500,000 samples. If the goal of the attribution process is to use it
3Ge et al. [21] report maximizing the perplexity in their paper. We believe that it is just a typo as they define the perplexityand derive it correctly using probability principles.
ACM Trans. Asian Low-Resour. Lang. Inf. Process., Vol. 0, No. 0, Article 0. Publication date: 0.
Arabic Authorship Attribution: An Extensive Study on Twitter Posts 0:9
for forensics applications, then there are a number of restrictions that should be considered inthe experimental settings. First, the number of training samples per author that is available fortraining should be limited [43]. Second, even though Neural Networks are end-to-end systems,preprocessing should be used to ensure that no subtle hints are provided to the classifier [39, 57].Finally, if the outcome of the attribution process is to be used as evidence in the courts of law, avisualization technique should be provided in order to present the results in a clear and intuitiveway. Perhaps, if the results for a Neural Network and a traditional classifier, such as SVM, aresimilar, one might use SVM which requires less time to train.
2.2 Arabic Authorship AttributionIn reviewing the work on Arabic, we are specifically interested in three elements: the text sourceand its size, the writing style features, and the classification techniques.
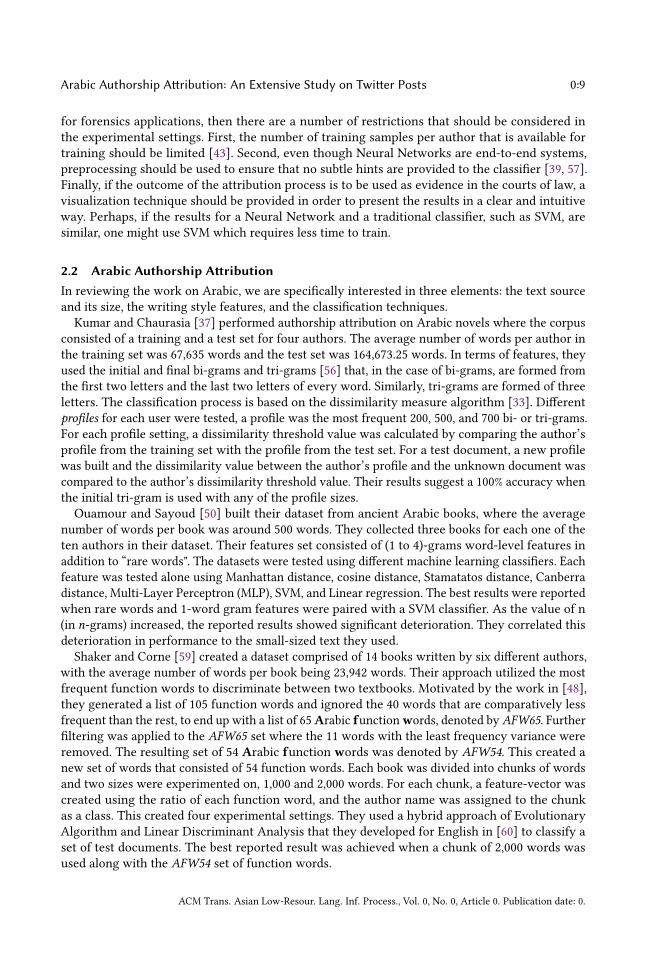
Kumar and Chaurasia [37] performed authorship attribution on Arabic novels where the corpusconsisted of a training and a test set for four authors. The average number of words per author inthe training set was 67,635 words and the test set was 164,673.25 words. In terms of features, theyused the initial and final bi-grams and tri-grams [56] that, in the case of bi-grams, are formed fromthe first two letters and the last two letters of every word. Similarly, tri-grams are formed of threeletters. The classification process is based on the dissimilarity measure algorithm [33]. Differentprofiles for each user were tested, a profile was the most frequent 200, 500, and 700 bi- or tri-grams.For each profile setting, a dissimilarity threshold value was calculated by comparing the author’sprofile from the training set with the profile from the test set. For a test document, a new profilewas built and the dissimilarity value between the author’s profile and the unknown document wascompared to the author’s dissimilarity threshold value. Their results suggest a 100% accuracy whenthe initial tri-gram is used with any of the profile sizes.Ouamour and Sayoud [50] built their dataset from ancient Arabic books, where the average
number of words per book was around 500 words. They collected three books for each one of theten authors in their dataset. Their features set consisted of (1 to 4)-grams word-level features inaddition to “rare words". The datasets were tested using different machine learning classifiers. Eachfeature was tested alone using Manhattan distance, cosine distance, Stamatatos distance, Canberradistance, Multi-Layer Perceptron (MLP), SVM, and Linear regression. The best results were reportedwhen rare words and 1-word gram features were paired with a SVM classifier. As the value of n(in n-grams) increased, the reported results showed significant deterioration. They correlated thisdeterioration in performance to the small-sized text they used.
Shaker and Corne [59] created a dataset comprised of 14 books written by six different authors,with the average number of words per book being 23,942 words. Their approach utilized the mostfrequent function words to discriminate between two textbooks. Motivated by the work in [48],they generated a list of 105 function words and ignored the 40 words that are comparatively lessfrequent than the rest, to end up with a list of 65Arabic functionwords, denoted by AFW65. Furtherfiltering was applied to the AFW65 set where the 11 words with the least frequency variance wereremoved. The resulting set of 54 Arabic function words was denoted by AFW54. This created anew set of words that consisted of 54 function words. Each book was divided into chunks of wordsand two sizes were experimented on, 1,000 and 2,000 words. For each chunk, a feature-vector wascreated using the ratio of each function word, and the author name was assigned to the chunkas a class. This created four experimental settings. They used a hybrid approach of EvolutionaryAlgorithm and Linear Discriminant Analysis that they developed for English in [60] to classify aset of test documents. The best reported result was achieved when a chunk of 2,000 words wasused along with the AFW54 set of function words.
ACM Trans. Asian Low-Resour. Lang. Inf. Process., Vol. 0, No. 0, Article 0. Publication date: 0.

0:10 Altakrori et al.
Alwajeeh et al. [7] built their text corpus from online articles. They manually selected fiveauthors with 100 articles each. Then they manually annotated the articles and extracted the featuresfrom them. The average number of words per article was 470.34 words and features, such as theaverage number of general articles, characters per word, punctuation per article, and unique rootsper article, were extracted. They also investigated the effect of using a Khoja stemmer, whichreturns the original root of the specified word. They used Naïve Bayes and SVM as their methods ofclassification and the reported accuracy almost reached 100%. In their discussion of the results, theyhighlighted the negative effect that the Khoja stemmer introduced. They explained that the reasonbehind this effect is that root stemming causes two different words with different meanings tobecome the same word, which in return leads to information loss and, therefore, bad performance.Abbasi and Chen [2] and Altheneyan and Menai [6] used exactly the same set of features. In
fact, Abbasi and Chen [2] proposed these features and then Altheneyan and Menai [6] adoptedtheir suggestions in their paper. There are 418 features divided as follows: 79 lexical features, 262syntactic features, 62 structural, and 15 content-specific. Altheneyan and Menai [6] tested thesefeatures on a dataset comprised of ten authors and 30 books, with an average number of words perbook ranging between 1,980 to 2,020 words. On the other hand, Abbasi and Chen [2] collected 20web forum messages for each of their 20 authors and the average number of words per message was580.69 words. In both these studies, variations of Naïve Bayes, SVM, and C4.5, a famous decisiontree classifier, were used, and the reported accuracy ranged from 71.93% to 97.43%.
Rabab’ah et al. [53] collected a dataset of 37,445 tweets for 12 users from the top Arab users onTwitter. On average, they collected around 3120 tweets per author. Three sets of features were usedin this study: stylometric features provided by [4], uni-grams, and morphological features extractedusing MADAMIRA tool [51], which is a tool made by combining the functionality of MADA [23]and AMIRA [18] tools for Arabic feature extraction. They used Naïve Bayes, Decision Trees, andSVM for classification and experimented with the sets of features separately and combined. Thebest result was achieved using SVM with all three sets of features. This study was followed by [5]on the same dataset, where Al-Ayyoub et al. [5] investigated the effect of using feature selectiontools such as Principle Component Analysis (PCA) and Information Gain on reducing the runningtime of the classification process.
Al-Ayyoub et al. [4] investigated the authorship problem for news articles. They collected around6,000 articles for 22 authors, where each author has 220 articles on average, and the articles’ lengthsranged between 202 and 565 words. For their work, they considered two sets of features. In the firstset, they compiled a list of stylometric features from [1, 2, 15, 49, 59], while in the other set theyconsidered all the uni-grams that have more than 1000 occurrences in the dataset, then appliedfeature reduction using a correlation-based feature selection technique [24]. The value for a featureis the TF-IDF score. Finally, they used Naïve Bayes, Bayes Networks, and SVM to compare theperformance using each feature set separately. The outcome of this study is that using stylometricfeatures yielded a higher accuracy compared to using uni-grams with TF-IDF scores.As discussed above, all the relevant works either focus on long Arabic text data or use a very
large number of writing samples per author. Given the exploding text generated online, thereis a pressing need to benchmark the performance of existing techniques on Arabic short text.Moreover, none of the relevant works focus on interpretability, which is a critical factor in real-lifeinvestigation scenarios. In this paper, we address the knowledge gap by benchmarking variousinstance-based and n-gram baseline on short text data from Twitter. We also adopt a model thatcan present visualizable attribution results.
ACM Trans. Asian Low-Resour. Lang. Inf. Process., Vol. 0, No. 0, Article 0. Publication date: 0.

Arabic Authorship Attribution: An Extensive Study on Twitter Posts 0:11
2.3 Visualization for Authorship AttributionState-of-the-art attribution techniques that are known to have good accuracy are complex and/orimpossible to visualize. For example, consider a SVM model that maps the input into a newdimension when the input is nonlinearly separable. Such models cannot be visualized beyond3-dimensions, where each dimension represents a feature. Since a typical attribution problem hasmuch more than three attributes, and hence requires more dimensions, it is impossible to visualizethe writing samples of all the authors on a plane and the decision boundary that divides them. Incontrast, a decision tree is easy to present, either as a tree or by converting it into a set of rules.However, decision trees do not perform as well as an SVM or a random forest.
We identified the work of [3, 9, 35] and [19] to be the only work on visualization with authorshipattribution. The problem with [35] is that it produces 3D images, one image per author, to be usedfor author identification; however, these images are difficult to compare holistically. In contrast, [9]visualizes each feature separately and does not aggregate them to find the most plausible author.Instead, it leaves the decision for the user to find the most plausible author. The problem with thisapproach is that it causes the decision to be dependant on the user’s understanding of the visualizedfigures. Finally, Abbasi and Chen [3] produces one graphical representation per feature, but thisrepresentation cannot scale up to a large number of features. Additionally, the authors highlighteda limitation of their approach by saying that its performance is constrained when used for textless than 30–40 words long. This limitation prevents its application to Twitter posts as tweetsare naturally much shorter. Ding et al. [19] provides a visualization technique that overcomes allthese previous points. The algorithm provides the most plausible author and its confidence for thisoutcome, then motivates its findings to help the user understand the outcome.
3 AUTHORSHIP ATTRIBUTIONStamatatos [65] described three approaches to extract the writing style from writing samples. Thefirst approach is instance-based, in which a writing style is extracted from every sample separately.By using this approach the candidate author will have s-styles, where s = number of writing samplesper author. The second approach is profile-based in which all the writing samples for a particularauthor are used to generate one writing style for that author. Note that the profile-based approachis different from authorship profiling, where the task is to infer the characteristics of the authorsuch as the age, gender, education level, etc. The third approach is a hybrid one that starts as aninstance-based one, then the features are aggregated over all the instances to create one profile perauthor.
Figure 2a shows the steps for the attribution process using the instance-based versus the profile-based approach (Figure 2b). In Section 3.1, we explain the steps for the instance-based approachand in Section 3.2 we explain the steps of the profile-based approach.
3.1 Instance-Based Authorship AttributionRefer to Figure 2a. The first step in the attribution process is to collect a set of writing samples foreach one of the candidate authors. This is explained in detail in Section 4.1. Assuming that theset of candidate authors is identified and a collection of writing samples for each one of them iscollected, the next step is to analyze these writing samples to extract the writing-style features. Wediscuss the various types of features in Section 3.1 below.
Extracting Stylometric Features. In this section, we provide a detailed description of the featuresthat we extracted for each one of the writing samples. As mentioned earlier, Abbasi and Chen[2] highlighted that techniques developed for English cannot be directly applied to Arabic due tothe different morphological nature of each language, which directly affects the feature extraction
ACM Trans. Asian Low-Resour. Lang. Inf. Process., Vol. 0, No. 0, Article 0. Publication date: 0.

0:12 Altakrori et al.
(a) Instance-based authorship attribution. (b) Profile-based authorship attribution.
Fig. 2. Instance-based vs. profile-based authorship attribution.
process. In fact, the features list is the only language-dependent element in the authorship attributionprocess, while the choice of the classification model, such as Naïve Bayes, or SVM, is not. This isbecause the feature extraction process uses the features list to convert text to the feature-vectors,which the classifiers use to build a classification model.
In general, an English-based features list can be used as a starting point for creating a newfeatures list for non-English authorship analysis. First, some basic language-specific features haveto be modified in the feature list. For example, the frequencies of alphabets in English have to bereplaced with the frequencies of Arabic letters and the ratio of capital letters in English has to beremoved because Arabic letters have only one case. On the other hand, the use of elongation “�"can be found in Arabic, but not in English. Therefore, it has to be included as a feature for Arabic.Second, the list of features has to be modified when the source of the investigated text changesfrom news articles, for instance, to tweets. This is because some features are meaningful in onesource but not in another. Consider the feature “The greeting line". This feature is only meaningfulin e-mails analysis. Looking for a greeting line in a tweet will not yield any results. Finally, thereare some features that are common and can work for different languages and in different domains,such as “the ratio of space to characters", but the number of such features is low. If the numberof features is low, i.e., the features are not representative, the accuracy of the classification modelwill be very low. After that, choosing a classification model is not an issue because the classifierwill use the feature-vectors the same way whether they were generated for an English text or anon-English text.We adopted a similar structure of Arabic features presented in [2], with two main differences:
(1) we removed all the features that are inapplicable to Twitter posts (e.g., font size and greetings)
ACM Trans. Asian Low-Resour. Lang. Inf. Process., Vol. 0, No. 0, Article 0. Publication date: 0.

Arabic Authorship Attribution: An Extensive Study on Twitter Posts 0:13
and (2) we used a larger set of function words. The following steps show how the features wereextracted. We have three categories of features: lexical, structural, and syntactic.
Lexical Features. We started by counting the number of characters that included diacritics or“Arabic Tashkil", special characters and punctuation and excluded white space characters such asspaces, tabs, and newline. Let M be the number of characters in a tweet whether this characteroccupies a location or not. Examples are alphabets and diacritics. Next, we calculated the ratiosof digits (0–9) toM , spaces toM , tabs toM , and spaces to all characters. Lastly, we generated theratio of every single alphabet toM . Despite the fact that the collected tweets are in Arabic, we alsocalculated the ratio of English alphabets. This was important since we observed some tweets thatincluded both English and Arabic words. Finally, it is important to mention that we consideredthe Alif “ @ " letter and the Alif with Hamza “
@ " letter to be two different letters, as opposed to
Altheneyan and Menai [6], who combined them under the Alif “ @ " letter.The previous set of features was observed on the characters’ level and that is why they are called
character-based features. This next set of features, however, was observed on the words level andis therefore called word-based features. The first word-feature is intuitive, which is the word countW . Before the words were counted, we replaced punctuation and white space characters with asingle space. Special characters and diacritics were kept when the words were counted becausethey are parts of words and will not affect the word counting process. Next, the length of each wordwas used to find the average word’s length. The average word’s length feature was calculated bysumming the lengths of all the words and dividing the sum by the number of all words. In addition,the words’ lengths were used to find the number of short words (1 to 3 characters) and then theratio of short words to the words countW . Below, we present two lists summarizing the character-and the word-based features.
• Character-based features:(1) Character count excluding space characters (M).(2) Ratio of digits toM .(3) Ratio of letters toM .(4) Ratio of spaces toM .(5) Ratio of spaces to total characters.(6) Ratio of tabs toM .(7) Ratio of each alphabet toM (Arabic and English): [a–z] (26 features), [ @–ø
] (28 features)
and { ø ,ø , ð ,
�è , Z ,
�@ , @ , @} (8 features). (Total is 62).
(8) Ratio of each special character toM : <>% |{ } [ ] @ # ˜ + - * / = \ $ ˆ & _ (21 features).• Word-based features:
(1) Word count (W ).(2) Average word length.(3) Ratio of short words [1–3] character toW .
Structural Features. The average sentence length, in terms of characters, was calculated. To do so,newline “\n", period “.", question mark “?" and exclamation mark “!" characters were used to dividea tweet into a set of sentences. This feature is also used to find the average sentence length thesame way the average word’s length was calculated. The last structural feature obtained is the ratioof blank lines to all lines. This can be calculated by looking for two newline characters together,i.e., \n\n. A summary of the previous features is provided below:
• Textual features:
ACM Trans. Asian Low-Resour. Lang. Inf. Process., Vol. 0, No. 0, Article 0. Publication date: 0.

0:14 Altakrori et al.
(1) Sentence count.(2) Average sentence length.(3) Ratio of blank lines to all lines.
• Technical features. Examples of technical features are font size and color, but these kinds offeatures are not applicable to Twitter because users don’t have control of them. All tweetsare published with the same font size, type, and color.
Syntactic Features. The previous features can be called generic or language independent. This isbecause these features can be collected from tweets regardless of the language in which they werewritten. Since we are targeting Arabic tweets, we added a set of Arabic-derived features.
• Diacritics. Arabic scripts have many diacritics and Tashkil “ÉJº ����", where the latter includes
the Harakat “ �HA¿Qk" (vowel marks). Ideally, Tashkil in Modern Standard Arabic is used to
represent missing vowels and consonant length and it helps identify the words’ grammaticaltags in a sentence. For example, the question ?
�Ég. QË@ H. Qå
� áÓ means: whom did the man
hit? (“ áÓ = who/whom", “Ég. QË@ = the man" and “H. Qå� = hit"). However, if the Damma (
�@)
on the word�Ég. QË@ is replaced with a Fatha (
�@), the question will become ?
�Ég. QË@ H. Qå
� áÓ,
meaning: who hit the man? So, the change on Tashkil on the word Ég. QË@ from Damma toFatha changed it from being the subject to become the object. If Tashkil was not provided,then the context can help to understand the statement. However, if no context was provided,the reader will not be able to tell which question is being asked. The following diacritics havebeen observed:
– Hamza: “ ð , @" and stand alone “Z" were converted to “
@" and “ ø" and “ @
" were converted
to “ @ ".
– Tanwin symbols: “H.� ,�H. ,
�AK.". Tanwin always accompanies a letter. It never appears
alone.– Shadda: “ �
H. " the doubling of consonants. It also does not appear alone.
– Madda: “�@" the fusion of two Hamzas into one. “
@Z".
– Harakat: includes Fatha “ �H. ", Kasra “H.� ", Damma “ �
H. " and Sukoon “ �H. ". They always
accompany a letter.• Punctuation. Arabic punctuation is similar to English; the difference is mainly in the directionthat the punctuation faces. For example, while the English question mark “?" faces the left(faces the question), the Arabic question mark faces the other way “?". Below is the set ofpunctuation marks that were observed:
– Arabic Comma ,
– Arabic colon :
– Arabic Semi-colon ;
– Arabic Question mark ?
– Arabic Exclamation mark !
– Arabic Single quote ‘– Arabic End single quote ’
ACM Trans. Asian Low-Resour. Lang. Inf. Process., Vol. 0, No. 0, Article 0. Publication date: 0.

Arabic Authorship Attribution: An Extensive Study on Twitter Posts 0:15
– Arabic Qasheeda �� only used for “decoration"
In addition to Arabic punctuation, English punctuation marks , . ; " ’ and ? were also added tothe punctuation set of features.
• Function words. Function words are a set of words that can be grouped together due to acommon property, for example, names of months or pronouns. Below we list examples ofthese function words, keeping in mind that each word is considered a stand-alone feature:
– Interrogative nouns “ÐAê ®�J�B@ ZAÖÞ� @", e.g., “Õ» ,
J» ,Éë , ú
�æÓ , @
XAÓ".
– Demonstrative nouns “ �èPA ��B @ ZAÖÞ�
@", e.g., “½Ë X , è
Yë , @
Yë".
– Conditional nouns “ Qå��Ë @ ZAÖÞ� @", e.g., “ �ø
@ , AÒ
®J» , AÒ
�JJk ,
à@ ".
– Exceptional nouns “ZA J�J���B@ �H@ðX
@", e.g., “øñ� , Q�
« , B@
".
– Relative pronouns “Èñ�ñÖÏ @ Õæ�B@", e.g., “ú
�GCË@ ,
àA�JÊË @ ,
à@
YÊË @ , ú
�æË @ ,ø
YË@".
– Conjunction pronouns “ ¢ªË@
¬ðQk", e.g., “ÉK. , ð
@ , Õç
�'".
– Prepositions “Qm.Ì'@
¬Qk @", e.g., “úΫ , á« , ú
¯ , úÍ@
, áÓ".
– Indefinite pronouns “Q KAÒ �Ë@", e.g., “ AÒë , ù
ë , Ñë , AÒë ,ñë ,
�I
K @ , A
K @".
– Eljazm pronouns “Ð Qm.Ì'@
¬ðQk", e.g., “B , ÕË ,�à@ ".
– Incomplete verbs “ �é��¯AJË @ ÈAª
¯ B@". This family of verbs contains a sub-family of verbs:
Kada Wa Akhwatoha “ Aî�E@ñ k @ð XA¿", Inna Wa Akhawatoha “ Aî�E@ñ
k @ð
�à@ ", Kana Wa
Akhawatoha “ Aî�E@ñ k @ð
àA¿".
– Common and famous Arabic names, such as:
– Names of Arabic world countries, e.g., “ àXPB@ , �éKXñª�Ë@ ,�H@PAÓB@" and their capitals’
names, e.g., “ àA�Ô« ,
�AKQË @ , úæ.
£ñK.
@".
– Some popular Arabic names4, e.g., “ �èYJJ.« ,àAÒ
�J« , QÔ« , YÒm×" [8].
– Names of Hijri and Gregorian Arabic months, e.g., “ �éJËñk. ,àAJ.ª
�� , ÐQm× ,ñJ
KñK".
– Numeral names and ordinal numbers, e.g., “Èð B@ ,
�èQå��« , Qå
��A«".
– Currency names, e.g., “PBðX , ÑëPX ,PAJKX".
In total, there are 541 different function words, which means 541 additional distinct features. Tosummarize how syntactic Arabic-specific features were collected using the feature extraction tool,the following list is provided:
(1) Occurrence of each diacritic (12 features).(2) Ratio of punctuation toM .(3) Occurrence of each punctuation (14 features).(4) Ratio of function words toW .(5) Occurrence of each function word (541 features).
4http://ArabiNames.com/categories.aspx
ACM Trans. Asian Low-Resour. Lang. Inf. Process., Vol. 0, No. 0, Article 0. Publication date: 0.

0:16 Altakrori et al.
Fig. 3. The maximum, average, and minimum ratio of usage for each feature grouped by the category.
Preprocessing for the Instance-Based Approach. Instance-based authorship attribution is consid-ered a classification problem, in which a model is used to classify an anonymous text after trainingthis model on the writing samples of the candidate authors. To do that, various data mining toolscan be used, such as WEKA [25] or RapidMiner [27]. We used the Java implementation of WEKAto train and validate the classification models.
At this point, all the features were extracted from the tweets and stored in a relational database.To be able to use WEKA we need to extract the features from the database and store them in areadable format that WEKA can read. To prepare a dataset for an experiment, the features foreach writing sample are collected from the database, normalized and associated with the authorof the writing sample as a class label. After the features are collected for all the writing samples,we used WEKA’s “RemoveUseless" filter on these features to exclude all the useless ones in thetraining samples. A feature is deemed useless if, for all the writing samples, it has the same value.For example, if feature FnW_1 has the value 0.5 for all the writing samples, then this feature cannothelp in identifying the author. Note that this filter is applied to a specific training set, i.e., after arandom set of authors and a random set of writing samples are selected and not on the database offeatures. This means that a feature that was deemed useless in one experiment may be usable inanother one and that depends on the set of candidate authors and the selected writing samples foreach author. Because of that, the number of useless features in a specific experiment varies fromone experiment to another.The reason why these useless features appear in the first place is the large number of features
that we use. For example, we collect 541 function word-features. It is very unlikely that a small setof tweets will contain all these function words. (See Table A in Section 4.1 for a list of the top 100highest frequency function words). However, this should not affect the accuracy of the model sincesuch features will not be used to build the classification model. Even if such feature appears laterin the validation instance (i.e., the anonymous tweet), the already built model will not be able touse it. On the other hand, removing these useless features should reduce the time for training andvalidation for a classification model.
Figure 3 shows the maximum, average, and minimum ratio of usage for each feature groupedby the category. A ratio is calculated by counting the number of times a feature was used in anexperiment, divided by 200 experiments5. For example, a ratio of 90% means a feature was used in180 experiments and removed by the RemoveUseless filter in 20 other experiments.
As Figure 3 shows, only function-word features are used less than 60% on average. Word-level
5All the possible settings as per the experimental setup in Section 4.2
ACM Trans. Asian Low-Resour. Lang. Inf. Process., Vol. 0, No. 0, Article 0. Publication date: 0.

Arabic Authorship Attribution: An Extensive Study on Twitter Posts 0:17
lexical features and textual features were used in all experiments with an average ratio of usagebeing 100% and 98.5%, respectively. The minus sign ’-’ was the only character-level feature thatwas not used in any experiment and had a ratio of 0%. For the function-word features, around 26%of them were not used in any experiment. We listed these features in Appendix B.
The Classification Process. Figure 2a illustrates the process of attributing an anonymous tweet toone of the candidate authors using the instance-based approach. As the figure shows, the next stepafter extracting the features is to build the classification model. To do that, we used the 10-foldcross-validation technique and divided the writing samples into training and validation sets. Theresult of this process is a classification model and its accuracy, which is used as a confidence. Ifthe model’s accuracy is low, this means that the model is not able to differentiate between theauthors based on their writing samples. Regardless of how low the accuracy is, the model willalways output a candidate author for the anonymous text. In this case, it is up to the authorshipattribution domain expert to evaluate to decide whether to accept the results or not.
We used four different classification techniques to evaluate the performance of the instance-basedauthorship attribution approach in order to compare it with the performance of the profile-basedapproach. These techniques are Naïve Bayes, Support Vector Machines (SVM), Decision Trees (DT),and Random Forests (RF). The reason for choosing these classification models is this: one mainapplication of authorship attribution techniques is to use their results and analysis as evidence incourts of law. Because of that, the interpretability of the results is as important as high accuracy. Itis crucial that the findings are not only accurate but also intuitive and convincing. For example,SVM and Random Forests are known for high accuracy. However, the resulting models are complexand can only be seen as a black box, as opposed to Naïve Bayes and decision trees, whose resultsare easier to represent. An authorship attribution expert needs to explain a conclusion rather thanmerely present it and using such complex models will not enable an expert to do so. Following is abrief description of each model.(1) Naïve Bayes (NB). A Naïve Bayes classifier applies Bayes rule of conditional probability [68]
to accurately predict the class of a given instance [31]. In terms of computational complexity,a dataset with many attributes would be too exhaustive for the computer resources [26].Therefore, in order to simplify this process, Naïve Bayes assumes that all the attributes areindependent and are of the same weight [46]. Because this is not true in most real-worldscenarios, the term “Naïve" was associated with this classifier.
(2) Support Vector Machines (SVM).We use Chang and Lin [13]’s implementation of SupportVector Machines (SVM). A SVM is a supervised learning [61] algorithm that extends a linearclassification model to solve a multi-class, linear, or nonlinear classification problem wherethe n-attributes are mapped to an n-dimensional plane with n-axes [68]. Such models usevarious optimization techniques [68] to find the Maximum Marginal Hyperplane (MMH)[26] that can separate these instances. This makes SVM models slow and computationallyexpensive [61], but very accurate [68] as they always provide the global solution [26].
(3) Decision Trees (DT).We use WEKA’s implementation of the well-known C4.5 algorithm[52] presented in [68]. Initially, Quinlan introduced the ID3 algorithm that uses InformationGain as an attribute splitter [68]. C4.5 is the result of a number of improvements applied toID3, among them is using the gain ratio instead of only using Information Gain and usingpruning to remove the “unreliable" branches caused by noise, or due to over-fitting [26, 68],as well as dealing with instances with missing values or numerical attributes [68].
(4) Random Forests (RF). RF [11] is a technique that utilizes bagging and randomization, whichare examples of ensemble learners, to produce a classification model that outperforms theseindividual classifiers [68]. While bagging is performed by using decision trees for a number of
ACM Trans. Asian Low-Resour. Lang. Inf. Process., Vol. 0, No. 0, Article 0. Publication date: 0.

0:18 Altakrori et al.
Table 1. Sample n-grams extracted from the text: “it is noticed and appreciated" and the correspondingpart-of-speech tag sequence is “PRP VBZ VBN CC VBN".
Modality n-gram Length ExamplesLexical Word 1-3 ‘It’, ‘it is’, ‘it is noticed’ and ‘is noticed’, etc.
Character Character 1-3 ‘no’, ‘not’, ‘notic’, ‘tice’, ‘notice’, ‘a’, ‘an’ and ‘nd’, etc.Syntactic P-O-S 1-3 ‘PRP VBZ VBN’, ‘CC VBN’ and ‘VBN CC’, etc.
times (instead of using different classifiers), random splitting is utilized when an attribute isto be chosen in each iteration of the tree induction process. This random attribute is selectedfrom the N best attributes instead of the single “best" attribute [11].
3.2 Profile-Based Authorship AttributionIn this section, we discuss the process of performing authorship attribution using the n-gramapproach. First, we analyze the writing samples of each author and extract three sets of n-gramfeatures per author, one on each modality level. We perform the same step for the anonymous tweetand produce three feature sets as well. Second, for each modality level, we use the n-grams of theanonymous tweet as a feature-vector and use the Term Frequency-Inverse Term Frequency (TF-IDF)technique to calculate a score for each feature. This produces three profiles for each author as wellas three profiles for the anonymous tweet, where each profile corresponds to one modality level.Third, a similarity function is used to compare the authors’ profiles to the profile of anonymoustweets, and each author will have three similarity scores, one for each modality level. Fourth, wecalculate three confidence scores, one for each modality level. Each score describes the model’sability to distinguish between the authors’ profiles if only that modality level is used. Neitherthe anonymous tweet nor its profiles/features are used in this step. Fifth, we use the confidencescores that are calculated in the previous step to weight the similarity scores of the authors andcalculate one combined similarity score for each author. Finally, we project the similarity scoresand the confidence values on the anonymous tweet to provide a visual representation of the results.Following, we discuss each step in detail.
Extracting the N-Grams From the Anonymous Tweets and the Sample Tweets. This section describesthe process of extracting the n-gram features from the authors’ writing samples. A gram is a unitof text (i.e., token) based on the modality level and n is the integer number of consecutive tokensthat are considered as one feature. The n-gram approach can be applied on three modality levels:characters, words, and parts-of-speech (POS). For example, 2-grams on the character level meansthat we tokenize a text into a series of characters, then we take every two consecutive charactersas one feature. Table 1 shows a sample sentence and the corresponding n-gram features for eachmodality level.
We used Stanford’s [45] NLP library6 for text segmentation, tokenization, and POS tagging. Notethat the term n-gram is used in the literature to indicate that the number of tokens in a featureis exactly n. For example, the term 3-grams, or tri-grams, means each feature has exactly threetokens. In this work, however, we extract all the grams of lengths 1 to n as shown in Table 1 andfor brevity, we use the term n-gram instead of 1 − n-grams.
Generating the Authors’ Profiles. After extracting the features, we use the TF-IDF technique toscore each feature and create the authors’ profiles. This scoring technique, which is famous forits simplicity, gives a high score for words that appear many times in one piece of text (Term6http://nlp.stanford.edu/
ACM Trans. Asian Low-Resour. Lang. Inf. Process., Vol. 0, No. 0, Article 0. Publication date: 0.

Arabic Authorship Attribution: An Extensive Study on Twitter Posts 0:19
Frequency) while penalizing terms that appear many times in other documents. To understandthe motivation behind this technique, consider the word “the". Due to its usage, the word “the"is likely to appear many times in a document, compared to other terms in that same document.On the other hand, it will also appear frequently in other authors’ documents. Therefore, it willget a low score for being very common, i.e., not unique for a certain author. In contrast, considerthe word “kindly" that might be common in one author’s text while being replaced by the word“please" by another author. If this was the case, then these two terms will have high scores, giventhat they appeared in one author’s text more frequently than for other authors.Equation 1 and Equation 2 show the formulas to calculate the Term Frequency (TF) and the
Inverse Document Frequency (IDF), respectively, whereWi is all the writing samples, i.e., tweets,for candidate author ci , |C | is the size of the set of candidate authors, i.e., the number of candidateauthors, and b is a constant that equals 0.1.
TF (дram,Wi ) =f requency (дram,Wi )
maxGramFrequency (Wi )(1)
IDF (дram) = loд(
|C |b + |AuthorsEverUsed (дram) |
)(2)
To illustrate how these equations are used to generate the profiles of the anonymous tweetand the authors, we provide the following example: let a be an anonymous tweet and a set oftwo candidate authors C , whereW1 andW2 contain all the tweets written by authors c1 and c2,respectively. Let the n-gram features for a,W1, andW2 be extracted as per Section 3.2. For the sakeof this example, assume that we are performing the attribution process on the word-level only andthat the feature-vector based on the anonymous tweet a is [дram1, дram2, дram3].To generate a profile for the anonymous tweet, we only use Equation 1 and we do not use the
writing samples of the candidate authors. Assume that the frequencies for дram1, дram2, and дram3in the anonymous tweet are 1, 2, and 5, then the profile for this anonymous tweet on the word-levelwill be [0.2, 0.4, 1].
To generate a profile for author c1, we compute the frequencies for the same grams:дram1,дram2,and дram3 in the author’s tweets. For example, if we examine all the author’s tweets we find thatдram2 appears 5 times, thenTF (дram2,W1) = 5. Assume thatTF (дram1,W1) = 3 andTF (дram3,W1)= 0, i.e., дram3 does not appear in any of author c1’s tweets. So far, using only Equation 1, thefeature-vector for c1 is [0.6, 1, 0]. Similarly for author c2, we calculate the frequencies for дram1,дram2, and дram3 using Equation 1. Assume that the resulting frequencies for дram1, дram2, andдram3 are 4, 0, and 0. Therefore, the feature-vector for c2 is [1, 0, 0].
Next, we need to calculate the IDF value for each gram, given by Equation 2. Notice that the num-ber of authors is fixed and b is a constant, so we only need to calculate |AuthorsEverUsed (дram) |,i.e., find the number of authors who used that gram in any of their tweets. Gram1 was used byboth authors, so IDF (дram1) = loд(2/(0.1 + 2)) ≈ -0.02. Gram2 was used by only one author, soIDF (дram2) = loд(2/(0.1 + 1)) ≈ 0.26. Finally, дram3 was not used by any author, so IDF (дram3) =loд(2/(0.1 + 0)) ≈ 1.3. Notice that had we not used the constant b, a division by zero would haveoccurred. Therefore, we added the constant b and set its magnitude to be smaller than 1. Finally, wepenalize each TF value with the corresponding IDF value. The resulting feature-vectors for authorc1 and c2 on the word-level are [-0.012, 0.26, 0] and [-0.02, 0, 0], respectively.
We perform the same process to generate the profiles on the remaining modality levels. Aftergenerating three profiles for each author, we calculate the similarity scores as explained in thefollowing section.
ACM Trans. Asian Low-Resour. Lang. Inf. Process., Vol. 0, No. 0, Article 0. Publication date: 0.

0:20 Altakrori et al.
Computing the Similarity Scores per Modality Level. In the previous step, we generated the writing-style profiles for all the authors as well as for the anonymous tweet on all three modality levels,where each profile is a vector.
To measure the similarity between the anonymous tweet and an author’s profile on a certainmodality level, we need to calculate the distance between their vector-profiles. One simple techniqueto calculate this distance is the Cosine Similarity that is shown in Equation 3. From a geometricperspective, the smaller the angle between two vectors, the more similar they are. By simplifyingthe formula of the cosine similarity, the distance ends up being the dot product of the two vectors.
similarity(
#»Si ,
# »Sα
)= proj # »
Sα#»Si× ∥ # »
Sα ∥
=∥ #»Si ∥ × cos (θi ) × ∥ # »
Sα ∥ (3)
=∥ #»Si ∥ ×
#»Si .
# »Sw
∥ #»Si ∥ × ∥ # »
Sα ∥× ∥ # »
Sα ∥
=#»Si .
# »Sw
To understand how the dot product can measure the similarity, consider the following example.Assume that we are comparing an anonymous text a and two documents d1 and d2. Let the feature-vector for a be [1, 1, 1, 1, 1], for d1 be [1, 0, 0, 0, 0], and for d2 be [1, 0, 0, 1, 1], where the value “1"means the feature is observed in that document and a value “0" means it is not. By simply lookingat the vectors we can see that d2 is more similar to a because it contains three observed features,while d1 has only one. We can reach the same conclusion using the dot product of the vectors. Thedistance between a and d1 is #»a .
#»
d1 = (1 x 1) + (1 x 0) + (1 x 0) + (1 x 0) + (1 x 0) = 1. The distancebetween a and d2 is #»a .
#»
d2 = (1 x 1) + (1 x 0) + (1 x 0) + (1 x 1) + (1 x 1) = 3.Using this similarity measure, we compute three similarity scores for each author, one on each
modality level.
Calculating the Confidence per Modality Level. In the previous step, we calculated the similarityscores for each author. In this step, we calculate a confidence value that describes the model’sability to discriminate between the authors’ profiles. To understand the motivation behind thisstep, consider these two cases with the following similarity scores on the same modality level forthree candidate authors. Case1: Sim(C1,a) = 5, Sim(C2,a) = 2, Sim(C3,a) = 1 and Case2: Sim(C1,a)= 5, Sim(C2,a) = 4.7, Sim(C3,a) = 4.2. In both cases C1 has the highest similarity score; however, inCase2 the similarity scores are too close to each other, which means that the authors’ writing stylesare very similar. We quantify the model’s ability to discriminate the authors’ profiles by measuringthe model’s ability to correctly predict the author of each one of the writing samples if they wereused as anonymous tweets. To do that, we divide the authors’ writing samples into 10 folds: 9 foldsto be used as writing samples and one fold to be used as anonymous tweets. Note that this is donefor each modality level separately.For example, consider a problem with five candidate authors, each one with 20 tweets, where
we are calculating the confidence on the character level, i.e., the degree of similarity between theauthors’ profiles if only character-level features are used in this attribution problem. We start bydividing these tweets into 10 folds, 9 for training and 1 for validation, where all the authors arerepresented equally in both sets. In other words, the classes are balanced in both the training andvalidation sets. For example, each author has 18 writing samples to be used to create his/her profileand 2 samples to test the model. Next, we consider each tweet in the validation set as a separateattribution case, i.e., use its features to create a feature-vector, use this vector to generate its profileas well as the candidate authors profiles and calculate similarity scores between the authors’ profiles
ACM Trans. Asian Low-Resour. Lang. Inf. Process., Vol. 0, No. 0, Article 0. Publication date: 0.

Arabic Authorship Attribution: An Extensive Study on Twitter Posts 0:21
and the profile of the validation tweet. Finally, the author with the highest similarity score is themost plausible author.Before we move on to the next validation tweet, we extract the following six features from
the current tweet: (1) the highest similarity score, (2) the lowest similarity score, (3) the averagesimilarity score, (4) the difference between the highest and the second to the highest similarityscores (i.e., the runner-up), (5) the length of the validation tweet (in tokens, on the same modalitylevel), (6) the number of tokens that appears in both the anonymous (i.e., validation) tweet, and thetweets of the author with the highest similarity score. We repeat the same steps for the rest of thetweets in the validation set.After considering all the validation tweets in that validation fold, we calculate an accuracy
score as follows. For each time the algorithm predicted the correct author it receives a score of1, else it receives a 0. For example, if the algorithm correctly predicted the author for 7 out of 10validation tweets, then the accuracy for this fold is 70%. This accuracy is assigned to each tweet inthe validation set, and it is considered as the model’s confidence score for that tweet.We perform this process 10 times, each time considering a new fold for validation. At the end
of this 10-fold process, we will have a feature-vector of length 6 and a confidence value for eachtweet in the set of writing samples of every author, for a specific modality level. To calculate themodel’s confidence score for the original anonymous tweet, we use a linear regression model. Thismodel is trained on the writing samples and the same 6 features are extracted from the anonymoustweet based on the similarity scores of the authors that were measured in Section 3.2. The model isthen used to predict a confidence score for the anonymous tweet on a specific modality level.
In total, three linear models are trained, one for each modality level. The outcomes of this processare three confidence scores, one for each modality level.
Combining the Similarity Scores and Confidence Values to Predict the Actual Author and Computethe Overall Confidence. The final step in predicting the candidate authors is to use the similarityscores that were calculated in Section 3.2 and the confidence values that were calculated in Sec-tion 3.2 to generate a cumulative similarity score per candidate author and an overall confidencevalue for the model. To compute the cumulative score, we normalize each author’s similarity scorein each modality by multiplying it by the corresponding confidence value, then we sum all threescores together. The most plausible author is the one with the maximum combined, normalizedscore. For example, assuming that we have 2 authors: c1 and c2 and that the similarity scores for c1on the lexical, character, and POS level are [3, 1, 5], respectively, while the similarity scores for c2on the lexical, character, and POS level are [2, 4, 2], respectively and the model’s confidence scoreson the lexical, character, and POS level are [0.6, 0.84, 0.5], respectively, then the cumulative scorefor c1 equals (1.8 + 0.84 + 2.5) = 5.14, and the cumulative score for c2 equals (1.2 + 3.36 + 1) = 5.56.Based on the cumulative similarity scores, c2 is the most plausible author.It is important to notice that, although c1 has higher similarity scores on the lexical and POS
levels, c2 has a higher cumulative similarity score. This is because the confidence values are used toweight the similarity scores, where the model gives a higher weight for the modalities in which ithas higher confidence.
To choose the overall confidence of the model, we take the maximum confidence among the setof confidence scores for the modalities whose prediction matches the predicted author. For example,consider the same example from above where the lexical, character, and POS normalized scoresfor c1 are [1.8, 0.84, 2.5] and for c2 are [1.2, 3.36, 1]. If we consider each modality separately, thenthe most plausible authors on the lexical, character, and POS levels are c1, c2, and c1, respectively.Because we only look at the modalities whose prediction matches the predicted author based on
ACM Trans. Asian Low-Resour. Lang. Inf. Process., Vol. 0, No. 0, Article 0. Publication date: 0.

0:22 Altakrori et al.
the cumulative score, we only consider the confidence of the character level modality. In this case,the overall confidence ismax(0.84) = 0.84 or 84%.
Consider the same example from above again, where the lexical, character, and POS normalizedscores for c1 are [1.8, 0.84, 2.5] and for c2 are [1.2, 3.36, 1], only this time assume that c1 is the onewith the highest cumulative similarity score. In this case, the modalities whose prediction matchesthe predicted author are the lexical and the POS modalities. In this case, the overall confidencewould bemax(0.6, 0.5) = 0.6 or 60%.
Visualizing the Result of the Attribution Process. As discussed earlier, the role of an authorshipattribution domain expert in courts of law is to present their findings, i.e., the most plausible authorof the investigated text, and explain how these findings were reached. It is not the expert’s role tomake an accusation or a decision on the case; their role is merely to present the findings to the judgeor the jury members who usually come from various backgrounds. Therefore, the presentationof the results should be clear and easy-to-understand in order to help officers of the law make adecision.
The visualization tool provided by Ding et al. [19] was initially designed for English emails. Weadapted it to work with both Arabic and English, while no modifications were required for it towork with tweets. Specifically, we used Microsoft Translator7 to detect the language used in theanonymous text, and based on the results we changed the POS tagger and the text direction in textboxes. We do not translate POS tags to Arabic for readability issues. This automatic detection oflanguage allows for an easier incorporation of other languages by simply including the POS taggerin the source code and specifying the text direction for the added language.
The approach of using the Hue, Saturation, and Lightness to encode the scores and calculate thevalue per parameter is explained in detail by Ding et al. [19] and will be omitted from this paperfor brevity.Given a set of C candidate authors and an anonymous text, we provide the user with four
outcomes:(1) A tuple of C-scores for each feature. For each feature that was used, on all three modality
levels, a score is provided for each author based on their writing samples. These values arecalculated as explained in Section 3.2, and a sample of the output is provided in Figure 4. Thehighlighted feature is the word “ÉJ.
�¯". This word appears only for author 1, and therefore it
has scores of 0 for the other two authors because its frequency in their writing samples is 0.
Fig. 4. A sample of features’ scores per author. The score for author 1 is the first column from the right.
(2) The authors’ scores projected on the anonymous text. As Figure 5 shows, the whole authors’profiles are projected on the anonymous text to allow for visual comparison between the
7https://msdn.microsoft.com/en-us/library/dd576287.aspx
ACM Trans. Asian Low-Resour. Lang. Inf. Process., Vol. 0, No. 0, Article 0. Publication date: 0.

Arabic Authorship Attribution: An Extensive Study on Twitter Posts 0:23
candidate authors. A sentence in the anonymous text is represented with three lines: theline in the middle shows the sentence as it is and is used to show the word-level n-grams.The HSL for a word is modified to reflect its score for a particular author. The upper linelooks empty; however, it is used to reflect the scores of character-level n-grams. Finally, thelower line contains the corresponding POS tag for each word8 and is used to reflect the scoresof POS-level n-grams. Figure 5 shows the similarity between an anonymous text and threeauthors’ profiles: Author 1, Author 2, and Author 3. The figure suggests that Author 3 ismost plausible author as it shows a high score (represented with a dark highlight) for usingcommas, the word “ÉJ.
�¯" that appears only for Author 3 and does not appear for the other
two authors and the use of full stops.
Fig. 5. The results of the attribution problem for 3 authors and 25 tweets each.
(3) A cumulative features score. As shown in Figure 5, both Author 1 and Author 2 have similaritiesto the anonymous texts, but from the number of similar features and the color intensity, theuser is expected to identify the most plausible author. However, as the number of candidateauthors and the features increase, it is expected that this identification task becomes harder.Figure 6 presents a cumulative feature score for each author that is based on adding the scoreof each individual feature, starting with the feature that appears first in the anonymous text.These features include character- word- and POS-level features. As shown in the figure, allthe scores start and increase by the same level which can be verified using Figure 5. For thefirst few features (until feature 20) the similarity scores are low for all the authors, then (atfeature 55) and as more features are seen, the similarity scores are clearly different. Evenbefore reaching feature 68, it is clear that Author 3 has accumulated the highest similarityscore.
(4) The prediction and the confidence based on each modality level separately. Finally we providethe typical output of an attribution process. Figure 7 shows the prediction from each modalitylevel and its confidence. The overall prediction is chosen based on the highest normalizedscore as explained in Section 3.2, and the overall confidence is the maximum confidence for themodalities whose prediction match the overall prediction. In this example, all the modalitiespredictions match the overall prediction, and the overall confidence is the maximum of allthe confidence values.
8Padding was applied in case a word is shorter than its POS tag to prevent overlapping between tags.
ACM Trans. Asian Low-Resour. Lang. Inf. Process., Vol. 0, No. 0, Article 0. Publication date: 0.

0:24 Altakrori et al.
Fig. 6. A cumulative feature score. The area under the curve represents the difference in authors’ scores.
Fig. 7. The most plausible author and the confidence from each modality level.
4 EXPERIMENTAL DESIGN4.1 DatasetIn this section, we explain the process of collecting tweets from Twitter to create one big datasetof Arabic short texts and the sampling procedure that we followed to create smaller subsets to beused in the experiments.
Data Collection. Twitter is a social website that allows its users to share their status updates ontheir timelines. Each status update, known as a tweet, is limited to 140 characters and is submittedto a user’s timeline. A timeline is a collection of tweets listed in a reverse chronological order, i.e.,the most recent tweet is shown first.We wrote a script to communicate with Twitter and gather tweets. This was important due to
the lack of a public dataset of Arabic short text that we could use in our research. To build ourdataset of tweets, we needed a list of authors for whom the tweets would be collected. In a real-lifescenario, a law enforcement officer is likely to have a set of suspects in question, created usingtheir common investigation techniques. As we don’t have a similar list, we needed to create ourown. As discussed later in the experimental setup, we could collect lots of tweets for some userson Twitter. However, we aimed for a more challenging scenario where the number of tweets in auser’s account is small.We started by retrieving a set of random tweets that are written in Arabic. These tweets were
a mixture of Arabic and non-Arabic tweets such as ‘Farsi’ or Urdu because these languages usevery similar character sets. We extracted only the ‘user’ information from each tweet and ignoredeverything else. We repeated this step multiple times, each time keeping only the user informationuntil we collected a list of around 160 different usernames.
Next, for each username in the created list we retrieved a set of tweets from the user’s timelineand filtered out tweets that contained only a hyperlink or an emoji. We also replaced all theusernames and hashtags in the tweets’ bodies with the ‘@’ symbol and the ‘#’, respectively. Thiswas necessary because (1) these elements are not part of the writer’s style but the style of theoriginal creator of these usernames or hashtags [39] and (2) usernames can reveal an author’s
ACM Trans. Asian Low-Resour. Lang. Inf. Process., Vol. 0, No. 0, Article 0. Publication date: 0.

Arabic Authorship Attribution: An Extensive Study on Twitter Posts 0:25
Table 2. Descriptive statistics for the dataset.
(a) The whole dataset.
# of authors (A) = 155# of tweets (T) = 115,786Average number of tweets ≈ 747per author T/ACreation time span for 01-Feb-2011 tothe collected tweets 01-Oct-2016
(b) Tweets.
Min # of words = 0Max # of words = 37Average number of ≈ 9.6words per tweet% of tweets with less ≈ 56%words than the average
(c) Diacritics.
% of tweets with diacritics ≈ 40%Total number of diacritic = 130,512occurrencesAverage number of diacritic ≈ 1.1occurrences per tweetMost frequent diacritic Hamzat Fateh
@
Least frequent diacritic Madda ∼
(d) Histogram: # of emails vs. # of words. (e) Empirical distribution function.
social network, which can give a strong indication of who the real author is. Our goal was to reach2000 tweets per author, but most of the retrieved authors had much fewer than that. We manuallyinspected every author’s tweets looking for non-Arabic ones. An author whose tweets were not inArabic was removed from the dataset. We stored the authors’ names and their tweets, along withthe tweets’ features. This was important for reducing the running time of the experiments becauseit is likely for a tweet to be used in multiple experiments.After preprocessing the retrieved tweets, 155 Twitter users remained in the list and 115,786
tweets were collected with an average of 747 tweets per user. Table 2 shows some descriptivestatistics of the dataset and Table A in Appendix C shows the top 100 most frequent function words.
Modern Standard Arabic vs. Colloquial Arabic. Upon manual inspection of the nature of thecollected tweets, we noticed that the tweets are written in a mixture of the Modern Standard Arabic(MSA) and colloquial Arabic, with the majority of the tweets being in Modern Standard Arabic.
The effect on the instance-based approach. Being in MSA or colloquial Arabic would not affectthe process of extracting the lexical or the structural features. It would, however, affect some ofthe syntactic features. We have three categories of syntactic features: diacritics, punctuation, andfunction words. Diacritics can appear in both MSA and colloquial Arabic. They are not mandatory
ACM Trans. Asian Low-Resour. Lang. Inf. Process., Vol. 0, No. 0, Article 0. Publication date: 0.

0:26 Altakrori et al.
for writing in MSA and in colloquial Arabic they can be used for text decoration. This indicatesthat writing in MSA or colloquial Arabic will not guarantee, nor will it eliminate the appearance ofdiacritics in a tweet. The same scenario applies for punctuation.In the case of function words, there are two cases: the first one is when a word is the same in
both MSA and colloquial Arabic. Examples of this case are the names of months or currency. In thiscase, the word would be captured by the proposed function-word features. The other case is whena word is only used in colloquial Arabic, such as the ordinal word “ �
IËA�K" (pronounced as talet),
which means: third. In this case, it will not be captured as the function word “ �IËA
�K", (pronounced
as thaleth).
The effect on the profile-based approach. As described earlier, the profile-based approach doesnot look for certain features. Instead, the features are generated from the writing samples. In ourcase, the n-gram features are extracted from the anonymous tweet, and then the same n-gramsare extracted from the writing samples for each candidate author. This makes the profile-basedapproach indifferent of the nature of the language used. In fact, it has an advantage over theinstance-based approach since an instance-based approach is likely to miss typos that appear inthe text unless they are hard-coded as features. In case all the words in the text are collected asfeatures (i.e., collecting word 1-grams) then such typos will be caught if no selection of the top kfeatures was applied or if the typo occurs very frequently in the text.
4.2 Experimental SetupWe ran all our experiments9 on small datasets containing between 2 and 20 authors, each with 25writing samples. Our decision of conducting this study on a small number of candidate authors isjustified by the real-world application of authorship attribution. In most cases, a law enforcementofficer or the plaintiff of a civil case has a small number of candidate authors for a piece ofanonymous text. Although some of these candidate authors may be very prolific on Twitter andhave many writing samples, we aimed for a more challenging scenario where the number of writingsamples per author is small. Our experimental setting simulates real-life scenarios of conductingauthorship attribution. This setting ensures that the reported results are realistic, and the accuracyis not overestimated.
This decision was also justified by the work of Luyckx and Daelemans [44] and Ding et al. [19].Luyckx and Daelemans [44] have worked on students’ essays authorship analysis and highlightedthat the accuracy of the authorship attribution process begins to drop significantly as the numberof authors increases beyond two. Ding et al. [19] have conducted a set of experiments on emailsauthorship analysis to compare the performance of their proposed approach to the performanceof SVM and DT classifiers. They conducted their experiments for 2, 5, 10 and 20 authors and theresults of these experiments agree with the findings of Luyckx and Daelemans [44]. Given that anaverage tweet is much shorter than an email, we limited the number of authors in our experimentsto 20 authors.
Similar to [19], we conducted the experiments on groups of 2, 5, 10, and 20 candidate authors. Foreach group, we sampled 5 mini-datasets (a, b, c, d, and e) containing the same number of authors.Sampling for each mini-dataset was done without replacement, while sampling across datasets wasdone with replacement. For example, for a group of 10 authors in a certain experimental setting, wesampled five mini-datasets (a, b, c, d, and e) where each mini-dataset contains 10 authors. Authorx may appear in any dataset only once (without replacement) but may appear in one or more
9All experiments were conducted on a workstation running Windows 7 (64-bit) on an Intel® Core(™) i7-4700HQ CPU @2.40 GHz (8 CPUs) with 16 GB RAM.
ACM Trans. Asian Low-Resour. Lang. Inf. Process., Vol. 0, No. 0, Article 0. Publication date: 0.

Arabic Authorship Attribution: An Extensive Study on Twitter Posts 0:27
Table 3. Implementations of the classification algorithms and their parameters.
Algorithm Implementation Param. changed from defaultNaïve Bayes *.bayes.NaïveBayes -SVM *.function.LibSVM kernel: Radial BasisDecision Trees *.trees.J48 -Random Forests *.trees.RandomForests -* Available under WEKA.Classifiers
datasets (with replacement). Each experimental setting was repeated 10 times. In each time, the10-fold cross-validation approach was used to divide the dataset into training and validation sets.The goal of such configuration is that we test with various writing styles for the same number ofauthors and, hence, reduce the variance in the reported results. Table 4 in Appendix C shows thatthe difference in performance for the profile-based approach on the mini-datasets at the α = 0.05 issignificant for all the groups of candidate authors (p < 0.01).The results are reported as the average of 50 runs (10-folds are considered 1 run), which is
calculated as the average of the 10 runs for each one of the five mini-dataset (a, b, c, d, and e). Theoutcomes of an experimental setting are four accuracy values for four datasets containing 2, 5, 10,and 20 candidate authors. Each value resembles the percentage of correctly classified tweets usinga certain classifier, i.e., the predicted author for that tweet is the actual author.We used WEKA’s implementation of the classification algorithms in Section 3.1. Table 4 below
shows the implementation of each algorithm and the parameters that were changed from WEKA’sdefault settings. Among the four implementations, LibSVM is the only model that is not availabledirectly in WEKA’s package and had to be included manually.
5 RESULTS AND DISCUSSIONAs described in Section 1.2, the aim of these experiments is to answer four research questions (RQ)focusing on the performance of the n-gram approach. However, due to the lack of research onArabic authorship analysis and for the sake of completeness, we extended our analysis to includethe behavior of the instance-based classification techniques.
5.1 RQ1. How Does the Performance of the N-Gram Approach Compare toState-Of-The-Art Instance-Based Classification Techniques?
To answer this question, we have to study the effect of three Independent Variables (IV) on theDependent Variable (DV), which is the accuracy of the attribution process. These variables are thenumber of candidate authors, the number of tweets per author (i.e., the writing samples), and thetext size for both the writing samples and the anonymous tweet.
Increasing the Number of Candidate Authors. We consider this to be the baseline scenario with25 tweets per candidate author and without specifying a condition on the minimum number ofwords per tweet. We ran this experiment on datasets containing 2, 5, 10, and 20 candidate authorsas per the experimental setup described in Section 4.2. The results of this experiment are shown inFigure 8.Figure 8 shows that the accuracy dropped for all the attribution techniques as the number of
candidate authors increased. An Analysis of Variance (ANOVA) test was conducted at the α = 0.05level to determine the significance of this change, where the two factors are the classification
ACM Trans. Asian Low-Resour. Lang. Inf. Process., Vol. 0, No. 0, Article 0. Publication date: 0.

0:28 Altakrori et al.
Fig. 8. Baseline scenario: instance-based (NB, SVM, DT, and RF) vs. profile-based (n-gram) for 2, 5, 10 and 20authors.
technique and the number of candidate authors in a dataset. The results showed that both indepen-dent variables, increasing the number of authors and using different attribution techniques, hadsignificant effects on the accuracy of the attribution process (DV).
To compare the different numbers of candidate authors we conducted an ANOVA: single factor10and the result showed that there is a significant effect of increasing the number of authors (IV)on the accuracy of the attribution process (DV) at the α = 0.05 level. We conducted post hoccomparisons using the Tukey HSD11 test at the α = 0.05 level to compare the four conditions.The results showed that there was a significant difference in the accuracy when the number ofcandidate authors increased from 2 authors to 5, 10 and 20 authors, as well as from 5 to 20 authors.However, when the number of authors increased from 5 to 10 and from 10 to 20 the differencewas insignificant. The Mean, the Standard Deviation (SD), and the results of the ANOVA test aresummarized in Table 5.As we are interested in the performance of the n-gram approach, we conducted four paired
two-sample t-Tests at the α = 0.05 level. In each test, we compared the accuracy of the n-gramapproach to one of the instance-based classifiers. The results showed that there is an insignificantdifference in the accuracy when the n-gram approach is compared to either SVM or DT. In contrast,the n-gram approach performed significantly worse than NB and RF, respectively. The Mean, SD,and results of the ANOVA test are summarized in Table 6.
Increasing the Number of Tweets per Author. In this experiment, we increased the number oftweets per author from 25 (the baseline) to 125 tweets, in steps of 25. We wanted to see if theincrease in the number of tweets would help the attribution techniques perform better as thenumber of candidate authors increased. We did not increase the number of tweets per authorbeyond 125 to keep the scenario realistic, as suggested in [43]. Figure 9 shows the results of thisexperiment where each set of authors was tested with 25, 50, 75, 100, and 125 tweets per author.We conducted four one-way ANOVA tests, one for each number of candidate author, at the
α = 0.05 level to test whether the increase in the number of tweets per candidate yielded asignificant change in the performance of the attribution process (Mean and SD are provided inTable 7). The outcome of these four ANOVA tests showed that the change in the performance (DV),which was caused by increasing the number of tweets per authors (IV), was significant only for 5candidate authors while being insignificant for 2, 10 and 20 candidate authors.10 Conducted online, using http://astatsa.com/OneWay_Anova_with_TukeyHSD/11 See footnote 10
ACM Trans. Asian Low-Resour. Lang. Inf. Process., Vol. 0, No. 0, Article 0. Publication date: 0.

Arabic Authorship Attribution: An Extensive Study on Twitter Posts 0:29
(a) 2 Authors. (b) 5 Authors.
(c) 10 Authors. (d) 20 Authors.
Fig. 9. Increasing the number of tweets per candidate author (from 25 to 125)
A post hoc Tukey test was conducted on the set of 5 candidate authors to see which increasein tweets per author had a significant effect. The results of this test showed that among the 10possible pairwise comparisons only two were significant: increasing the number of tweets from 25(the baseline) to 125 (the maximum number of tweets) [p = 0.001] and from 75 to 125 [p = 0.02].
Based on these results we noticed that a larger number of additional tweets was needed to havea statistically significant increase in the performance; however, this increase was limited to fiveauthors. As the number of authors increased beyond five, having 125 tweets per author was notsignificant. As mentioned earlier, increasing the number of tweets to more than 125 tweets perauthor is unrealistic [43]. Furthermore, increasing the number of tweets per author will lead to alonger time span that covers these tweets, and, so, they are more likely to cover a larger numberof topics. As new topics emerge constantly in daily life, it is very likely that the authors’ styleshave adapted to these topics; therefore, introducing more tweets could have a negative effect onthe attribution. These findings agree with the work of Bhargava et al. [10].As we are interested in the performance of the n-gram based approach, we conducted four
ANOVA: single Factor t-tests, one for each set of candidate authors, at the α = 0.05 level (The meanand SD are shown in Table 8). All four t-test results showed that the performance of the variousattribution techniques is significantly different.
Using four post hoc Tukey tests, we investigated the significance of the difference in performancebetween the n-gram approach versus other instance-based algorithms. The results of these testsshowed that for all four tests there is no significant difference between using the n-gram approachversus using Naïve Bayes or DT. As for SVM, the n-grams approach performs significantly betteronly when the number of authors is 10 and 20. Finally, the difference between Random Forestsand using n-gram is insignificant for 2 and 5 authors, but when the number of authors increasesto 10 or 20 Random Forests performs significantly better than the n-grams approach. Below is asummary of the post hoc Tukey test results (Table 8).
ACM Trans. Asian Low-Resour. Lang. Inf. Process., Vol. 0, No. 0, Article 0. Publication date: 0.

0:30 Altakrori et al.
Specifying the Minimum Number of Words per Tweet. The goal of this experiment is to comparethe performance of the n-gram approach to that of instance-based algorithms when the size ofthe anonymous text changes, whether for the anonymous text, i.e., the number of words in theanonymous text increases, or for the writing samples of each candidate author.We set the baseline to be 25 tweets per author, with no conditions on the word count for each
tweet. To compare the performance of the different algorithms, we sampled 5 additional datasets inwhich we randomly sampled 25 tweets per author, where the range of word count for the sampledtweets is [1–5], [6–10], [11–15], [16–20], or [21–25] words per tweet. These datasets were sampledfor 2, 5, 10, and 20 authors. The results of this experiment are shown in Figure 10.
(a) 2 Authors (b) 5 Authors
(c) 10 Authors (d) 20 Authors
Fig. 10. Specifying the minimum number of words per tweet
Figures 10 shows that there is an increase in the performance when the size of tweets increases.To test the significance of this increase we run four ANOVA: single Factor t-tests, one for each setof candidate authors, at the α = 0.05 level. The results of these four tests showed that the differenceis insignificant for 2 and 20 authors, while being significant for 5 and 10. Upon further inspectionof the significance of the results for 5 authors using a post hoc Tukey test, we noticed that thedifferences for all the pairwise comparisons were insignificant. This agrees with [64], who explainsthat it is possible to have a significant F-score while having insignificant post hoc test p-values. Incontrast, the post hoc Tukey test for 10 authors shows that the increase in the performance whenthe range of tweets’ length increased from 1-5 to 6-10 or to 11-15 is significant. The detailed resultsare presented in Appendix C in Table 9.To evaluate the performance of using n-grams compared to other classifiers we looked at the
F-scores of four ANOVA: single Factor t-tests the α = 0.05 level. The scores showed that for all fournumber of authors settings, the difference among the classification techniques is significant. Toidentify the significant pairwise comparisons we run four post hoc Tukey tests [detailed results are
ACM Trans. Asian Low-Resour. Lang. Inf. Process., Vol. 0, No. 0, Article 0. Publication date: 0.

Arabic Authorship Attribution: An Extensive Study on Twitter Posts 0:31
in Appendix C, in Table 10]. The results of the Tukey tests showed that, except for Random Forests,using n-grams is either the same (i.e., the difference is insignificant) or better than using the otherclassification techniques. Only Random Forests performed significantly better than n-grams andthat was when the number of authors was 5, 10, and 20. When the number of authors was 2, thedifference between Random Forests and n-grams was insignificant.
Merging Tweets Into Artificial Tweets. In this last attempt to evaluate the performance of theattribution techniques, we try to address the problem of the small text size by merging groups offive tweets into single artificial tweets. Based on that, the 25 tweets per author that were used inSection 5.1 “Increasing the number of tweets per author" experiment are grouped into 5 artificialtweets, where each artificial tweet is created by concatenating the text of the 5 tweets.
The resulting experimental setting is the following: similar to Section 5.1, we use sets of 2, 5, 10,and 20 authors with 5, 10, 15, 20, and 25 artificial tweets in each experiment. These artificial tweetsare generated from 25, 50, 75, 100, and 125 tweets, respectively, the exact same tweets that wereused in Section 5.1. The reason why we used the same tweets is to have one variable in the newexperiment, which is merging the tweets into groups. Had we used a new set of single tweets, thenmerged them for this experiment, that would have generated some bias based on the content of thenew tweets, even if we controlled the text size over the selected tweets. Therefore, we kept thetweet ID for the tweets used in the aforementioned experiments, then used the IDs to group thetweets into artificial tweets.
Similar to previous experiments, we start by looking at the performance of the various attributiontechniques. We use 2, 5, 10, and 20 authors with 5, 10, 15, 20, and 25 artificial tweets per author. Asevery 5 tweets are grouped into one artificial tweet, this is equivalent to 25, 50, 75, 100, and 125tweets per author. The results of these experiments are shown in Figure 11. We report the accuracyof a certain classification technique as the average of its performance for the varying number oftweets per author, i.e., the average performance for 5, 10, 15, 20, and 25 tweets per author.Merging tweets has two effects on the attribution process: first, instance-based classifiers will
have fewer training examples to build a model from. However, these instances are supposedlyricher in text. Second, since we are using k-fold cross-validation, the anonymous tweet will alsocontain richer text. This affects both instance-based and profile-based techniques.
Except for SVM, the figure shows that merging tweets into artificial ones helps classifiers achievebetter results. For SVM, the results showed that using a small number of training samples willnegatively affect the performance. For example, with 2 authors and 5 tweets per author, SVM hadonly 10 instances to train a model.Upon further analysis of the results using Paired Two Sample t-tests at the α = 0.05 level, the
difference was significant for Naïve Bayes, Random Forests, and n-grams. In contrast, the differencefor SVM and DT was insignificant. The detailed results are presented in Table 11 in Appendix C .
We compare the performance of n-grams to other classification techniques using ANOVA t-testat the α = 0.05 level. The results of this t-test show a significant difference between the 5 techniques.Upon using a post hoc Tukey test, the only significant comparison was between SVM and n-grams.The detailed results are presented in Table 12 in Appendix C. In general, our experimental result isin line with the experiments shown in [19] and [44]. As the number of candidate authors increases,the complexity of the classification also increases, which in general leads to decreased accuracy.On the other hand, the performance of the profile-based approach with n-grams is on par withinstance-based models. This indicates that there is no trade-off between accuracy and visualization.
ACM Trans. Asian Low-Resour. Lang. Inf. Process., Vol. 0, No. 0, Article 0. Publication date: 0.

0:32 Altakrori et al.
(a) Naïve Bayes (b) SVM
(c) Decision Trees (d) Random Forests
(e) n-gram
Fig. 11. Merging tweets into groups of five tweets.
5.2 RQ2. Which N-Gram Level (Character, Word, or Part-Of-Speech (POS)) Is the MostHelpful in Distinguishing the Authors’ Writing Styles?
In this section, we answer the second research question: which n-gram level has the highest effecton the attribution process. As mentioned earlier, n-grams are the N consecutive tokens from atokenized text, where the tokenization is on the character-, word-, or POS-level. In all the previousexperiments we used all three levels of modalities, and these modalities were evaluated using alinear regression model to calculate the confidence, as shown in Section 3.2. The modality levelwith the highest confidence was used in predicting the candidate author. In this set of experiments,however, we evaluate each modality level separately for 2, 5, 10, and 20 authors, with 25, 50, 75,100, and 125 tweets per author. The results of these experiments are depicted in Figure 12
Statistical analysis using One-way ANOVA tests at the α = 0.05 level shows a significantdifference among the four modality levels (character, word, POS, or all of levels together). Wefurther analyzed the results using post hoc Tukey tests, and the results showed that there is aninsignificant difference between using either character-level, word-level, or all three levels ofmodalities combined. In contrast, the difference was significant when only POS n-grams were used.
ACM Trans. Asian Low-Resour. Lang. Inf. Process., Vol. 0, No. 0, Article 0. Publication date: 0.

Arabic Authorship Attribution: An Extensive Study on Twitter Posts 0:33
(a) 2 Authors (b) 5 Authors
(c) 10 Authors (d) 20 Authors
Fig. 12. Evaluating each n-gram modality separately.
The results of the ANOVA test and the Tukey tests are provided in Appendix C, Tables 13 and 14,respectively.
Generally, the experimental result is in line with the results reported in [19]. They showed thatlexical modality performs the best for English. However, for Arabic text, we find that charactermodality performs better than lexical modality with respect to the mean value. Statistically, theirdifference is insignificant. We suspect that for Arabic, matching n-grams is harder than English, asArabic tends to merge pronouns with words instead of separating them [42]. For example Englishuses “his book" and “her book", which translates to “ éK. A
�J»" and “ AîE. A
�J»" in Arabic. If we look at
1-grams for these sentences, then we have three grams for English: “his", “her", and “book"; andtwo grams for Arabic: “ éK. A
�J»" and “ AîE. A
�J»". As noticed in Arabic, the word “book" was distributed
over two grams and could be distributed over more grams, depending on the pronouns attached toit. However, using character modalities, specifically, using 4-grams, the word “book" i.e., “H. A
�J»"
will be matched to the same gram in both cases.
5.3 RQ3. How Important Are Diacritics to the Attribution Process When the N-GramApproach Is Used?
The use of diacritics is one of the major morphological properties that make the Arabic languagedifferent from English and this prevents authorship attribution techniques that are developed forEnglish from being used in Arabic. The use of diacritics in Arabic is optional both in ModernStandard Arabic and Colloquial Arabic. In this set of experiments, we aim to see whether removingdiacritics before the attribution process or keeping them would have an effect on the outcome. Asa reminder, 40% of the tweets in our dataset contain diacritics (See Section 4).We use the same experimental setup as the previous experiments: 2, 5, 10, and 20 authors with
25, 50, 75, 100, and 125 tweets per author. We evaluate the diacritics effect on char- and word-level
ACM Trans. Asian Low-Resour. Lang. Inf. Process., Vol. 0, No. 0, Article 0. Publication date: 0.
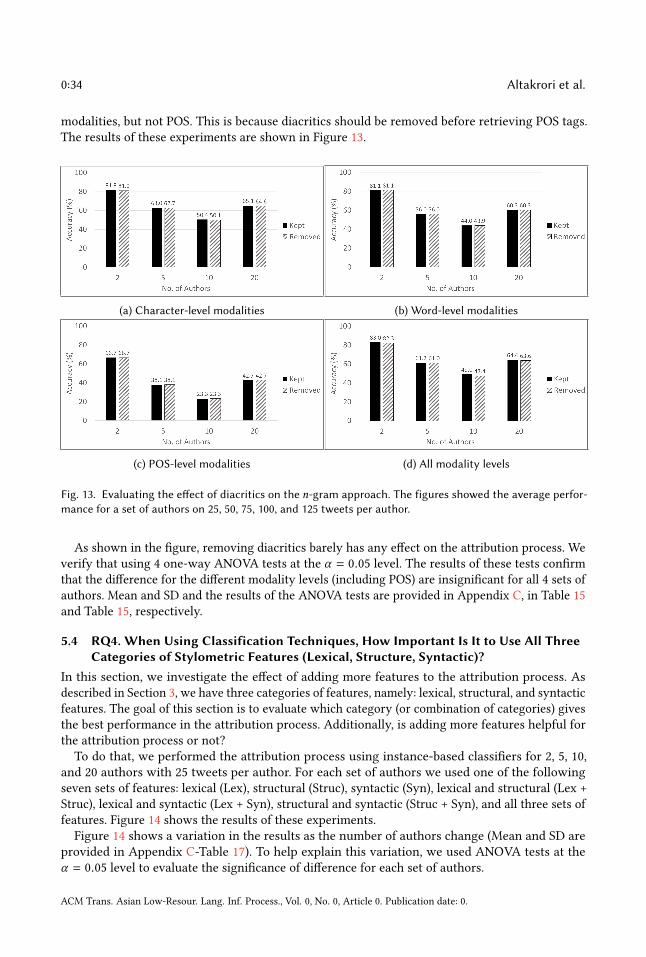
0:34 Altakrori et al.
modalities, but not POS. This is because diacritics should be removed before retrieving POS tags.The results of these experiments are shown in Figure 13.
(a) Character-level modalities (b) Word-level modalities
(c) POS-level modalities (d) All modality levels
Fig. 13. Evaluating the effect of diacritics on the n-gram approach. The figures showed the average perfor-mance for a set of authors on 25, 50, 75, 100, and 125 tweets per author.
As shown in the figure, removing diacritics barely has any effect on the attribution process. Weverify that using 4 one-way ANOVA tests at the α = 0.05 level. The results of these tests confirmthat the difference for the different modality levels (including POS) are insignificant for all 4 sets ofauthors. Mean and SD and the results of the ANOVA tests are provided in Appendix C, in Table 15and Table 15, respectively.
5.4 RQ4. When Using Classification Techniques, How Important Is It to Use All ThreeCategories of Stylometric Features (Lexical, Structure, Syntactic)?
In this section, we investigate the effect of adding more features to the attribution process. Asdescribed in Section 3, we have three categories of features, namely: lexical, structural, and syntacticfeatures. The goal of this section is to evaluate which category (or combination of categories) givesthe best performance in the attribution process. Additionally, is adding more features helpful forthe attribution process or not?To do that, we performed the attribution process using instance-based classifiers for 2, 5, 10,
and 20 authors with 25 tweets per author. For each set of authors we used one of the followingseven sets of features: lexical (Lex), structural (Struc), syntactic (Syn), lexical and structural (Lex +Struc), lexical and syntactic (Lex + Syn), structural and syntactic (Struc + Syn), and all three sets offeatures. Figure 14 shows the results of these experiments.Figure 14 shows a variation in the results as the number of authors change (Mean and SD are
provided in Appendix C-Table 17). To help explain this variation, we used ANOVA tests at theα = 0.05 level to evaluate the significance of difference for each set of authors.
ACM Trans. Asian Low-Resour. Lang. Inf. Process., Vol. 0, No. 0, Article 0. Publication date: 0.

Arabic Authorship Attribution: An Extensive Study on Twitter Posts 0:35
(a) 2 Authors. (b) 5 Authors.
(c) 10 Authors. (d) 20 Authors.
Fig. 14. Evaluating feature categories with instance-based classifiers.
For 2 authors, the difference was statistically insignificant [F (6, 21) = 2.48,p = 0.056]. For 5authors, the ANOVA test showed a statistically significant difference [F (6, 21) = 2.60,p = 0.047],but a post hoc Tukey test showed that the difference is statistically insignificant for all the possiblepairwise evaluations (Results are provided in Appendix C-Table 18). As mentioned earlier, it ispossible to have contradicting results between the ANOVA and the Tukey tests due to the differencein sensitivity for each test, as explained by Simon [64]. These results are in line with literatureon English, which suggests that the problem of authorship attribution is relatively easy when thenumber of authors is small [44]; therefore, a small number of features is enough for a classificationalgorithm to reach its best performance on a small number of authors (in this case, 2 and 5 authors),given enough training samples for each author.
In contrast, an ANOVA test for 10 authors showed a statistically significant difference among theseven sets of features [F (6, 21) = 3.39,p = 0.017]. The results of a post hoc Tukey test (Provided inAppendix C-Table 19) showed that the difference is statistically significant only for the pairwisecomparison between Structural features and using all three categories of features [p = 0.024].This suggests that as the number of authors increased from 5 to 10, the classification algorithmsbenefited from adding more features. As Figure 14.c shows, structural features came in last for 3out of four classifiers. However, using other features was statistically insignificant for all the casesexcept for using all the feature categories together.
Finally and similar to the first case with 2 authors, the difference for 20 authors was statisticallyinsignificant for all seven feature categories. [F (6, 21) = 2.38,p = 0.064]. This indicates that withthis large number of authors, classification algorithms are not able to perform well regardlessof the number of features that are used. Based on the result of this experiment, we believe thatapplying authorship attribution on a large scale, i.e., with a much larger set of candidate authorswill not be possible by using classification techniques. Instead, one should investigate developing
ACM Trans. Asian Low-Resour. Lang. Inf. Process., Vol. 0, No. 0, Article 0. Publication date: 0.

0:36 Altakrori et al.
new techniques for authorship attribution, or propose a new feature representation that can beused with traditional classification techniques.
6 CONCLUSION, LIMITATIONS, AND FUTUREWORKIn this work, we investigated the authorship attribution problem for short Arabic text, specifically,Twitter posts. Extensive work has been done for English short texts. However, due to the morpho-logical nature of the Arabic language, techniques developed for English are not directly applicableto Arabic. Literature on Arabic authorship attribution has focused on longer texts such as books,poems, and blog posts. None of this work tackled shorter forms such as SMS, chat, or social mediaposts that, by nature, are much shorter.We investigated the performance of various classification techniques that are either instance-
based or profile-based techniques. We showed that profile-based approaches, specifically usingn-grams are in line with state-of-the-art techniques. Although the state-of-the-art performed betterin some cases, these models are very complex and cannot be used as evidence in courts of law. Incontrast, profile-based approaches are simpler and their results can be visualized in a more intuitiveway, which gives them an edge to be used in court.
Among the limitations that still face the n-gram attribution approach is the scarcity of text,whether that is in the anonymous text or the writing samples of the authors. The effect can be seenwhen very few features appear in both the anonymous text and the writing samples; therefore, itwill be very hard to compare the visualized writing styles of three or four authors using a tweetwith 3–4 words. Additionally, recent studies showed that current authorship attribution techniquescapture the topic in addition to an author’s writing style. This means that if the anonymous textis about a topic that is not represented in the author’s writing style, then the performance of theattribution techniques will decrease drastically. Using n-grams on various modality levels insteadof only using word-level n-grams partially mitigates the issue of the topic. However, there is a needfor a better representation of an author’s style.This paper aims at laying the foundation for future work in Arabic authorship attribution for
short texts. We hope that this work will open the door for further work on Arabic in order tokeep up with the work on other languages. In addition to investigating new techniques for stylerepresentation, such techniques should utilize the huge development in deep learning, specifically inthe representation learning domain. This is because applying deep learning directly for authorshipattribution will be ineffective, due to the small size of data available for training.
ACM Trans. Asian Low-Resour. Lang. Inf. Process., Vol. 0, No. 0, Article 0. Publication date: 0.

Arabic Authorship Attribution: An Extensive Study on Twitter Posts 0:37
A THE TOP 100 MOST FREQUENT FUNCTION-WORD FEATURES
# FnWord Freq. # FnWord Freq. # FnWord Freq.1. áÓ 21873 34.
J» 1084 67. ��@QªË@ 495
2. ú
¯ 17495 35. A
K @ 1072 68. �
®K 482
3. úΫ 10446 36. ú
�æË@ 1067 69. áÒJË @ 475
4. B 8467 37. áºË 1053 70. h@P 4555. AÓ 7146 38. Q�
« 1050 71. @
XAÓ 422
6. AK 5152 39. ð @ 1020 72. XA« 419
7. É¿ 5000 40. Yg@ð 975 73. àðX 399
8. á« 3792 41. à@
968 74. áKYË @ 390
9. Bð 3762 42. Y�¯ 894 75. ÉK. 380
10. AK @ 3538 43. �
IK @ 881 76. �
I�¯ð 378
11. à @ 3417 44. @
X @
844 77. Ð @ 366
12. ©Ó 3276 45. AÖÏ 799 78. ú�æÓ 362
13. à@ 3176 46. Y
J« 762 79. �
Im��' 352
14. @Yë 2873 47.
�ªK. 755 80. à�B@ 330
15. �éºÓ 2611 48. Q��»
@ 693 81. á�g 318
16. àA¿ 2262 49. ú
G @ 686 82. Ѫ
K 317
17. ñË 2252 50. ��Ë 668 83. AÖß. 31218. ñë 2156 51. áË 665 84. Qå�Ó 31219. YªK. 2130 52. É
�JÓ 663 85. ÈC
g 310
20. �I
K@ 1889 53. ZA�Ó 616 86.
àA�ÓP 306
21. ú�æk 1560 54. Ñë 613 87. �
�ñ¯ 304
22. ÕË 1559 55. @Y» 596 88. Õ
�æK @ 298
23. úÍ@
1454 56. Õç�' 590 89. Èñk 293
24. ÐñK 1449 57. �éKXñª�Ë@ 579 90. PA� 285
25. @X @ 1313 58. ¼A
Jë 573 91. �
IKñºË@ 27326. ÉJ.
�¯ 1305 59. ½Ë
X 570 92. Cë 271
27. ø
YË@ 1292 60. Yg
@ 570 93. ©JÔ
g.
27128. hAJ.� 1218 61. A
Jë 558 94. AÒêÓ 261
29. Éë 1190 62. àAjJ.� 551 95. QÔ« 254
30. úÍ@ 1181 63. Õ» 526 96. ú
GA�K 233
31. á�K. 1172 64. ám�' 521 97. AKPñ� 221
32. ùë 1168 65. ø
@ 510 98. Q¢
�¯ 220
33. èYë 1126 66. Èð
@ 499 99.
�AKQË @ 200
100. áÖÞ� 199
ACM Trans. Asian Low-Resour. Lang. Inf. Process., Vol. 0, No. 0, Article 0. Publication date: 0.

0:38 Altakrori et al.
B FUNCTION-WORD FEATURES WITH ZERO USAGE
# FnWord # FnWord # FnWord # FnWord # FnWord1.
àA�JÊË @ 31. �áºË 61. P@
X�@ 91. ø
XAg 121. �
è @Y«
2. à@
Yë 32.
�Cë 62. ÉKQ
¯ @ 92. Qå
��A« 122. �
IKX
3. àA�KAë 33. Ñk 63. ù
®KAg. 93. Õæ
�J�� 123. áK
A¿
4. ½K@X 34.
àAK
@ 64.
à@ñk. 94. �èQ�Ë 124. á
�K
A¿
5. ½KA�K 35. hQK. 65. �
éJÊKñk. 95. ÕæÊÓ 125. �
���.
6. ½ JËð@ 36. ÈAj
�J�@ 66. AJ.
�� 96.
à@ñK 126. à�A¢�.
7. AK AK @ 37. ½
��ð
@ 67. ø
Q®J¯ 97. ZA
�KC
�K 127. �
é�Ê�K.
8. øAK @
38. ��ËñÊ
g@ 68.
àñKA¿ 98. �
é�JªK. 128. P
�@Y�g
9. øAK @ 39. øQk 69. A
J�K @ 99. A�ª
�K 129. ��ú
k
10. ỠAK @ 40. ��
I. ë 70. ú
æ�K @ 100. ½JË @ðX 130. ¼YKðP
11. á» AK @ 41. ��®£ 71.
àñªK. P@ 101. A�®m�� 131.
�àA
���J���
12. AÒ» AK @ 42.
A��� @ 72. �
é JÒªK. P
@ 102. AªÖÞ� 132.
àA�Ô«
13. AÒ» AK @ 43. Yg @ 73. �
é KAÒªK. P
@ 103. A
K AJ« 133. �ÊK. Q£
14. á��K @ 44. øQ�.
K @ 74. �
é JÒª�
�� 104. �
éJ.£A�¯ 134. Q
K@Qm.
Ì'@
15. AÒ�JK @ 45.
@Y�JK. @ 75.
àñª��� 105. @
�Q��J�
�» 135. AJ
K A�KPñÓ
16. áëAK @ 46. AÒ
��ʿ 76. �
é JÖ�ßC
�K 106.
�½�J
��J.
�Ë 136. ñ
��»ðA
K
17. áëAK @ 47. A��ÜÏ 77.
àñ�KC
�K 107.
�XA�ª�Ó 137. ú
�GñJ. Jk.
18. ÑëAK @ 48. A��Ó @ 78. �
é JÖßAÖ
�ß 108. é
�K� A�ë 138. �
èQ�j.®Ë @
19. AÒëAK @ 49. ú
��G @ 79.
àñKAÖ�ß 109. ú
�G�A�ë 139.
àAÒj. «
20. AÒëAK @ 50. àA��K @
80. ú
GAÖ�ß 110. á
�
��
��KA�ë 140. �
éÒJmÌ'@ �
@P
21. �áë 51. àAK @ 81. �
é JÒJÖ�ß 111. A
JëAë 141. áKñJ
�®Ë @ Ð@
22.��à A¿ 52. ©J.
�K 82. �
é JÒ�Ô
g 112.
à�@Y�ë
23.��à @ 53.
��Qª�K 83. �
é JÒªJ.� 113. ø
Y�
�ë
24.��à@
54. Y«X 84. �é KAÒªJ.� 114. á
�
�K
�Y�ë
25. �HBð 55. qÊK. 85. �
é JÒ�J� 115. A
�JÊ¿
26. AÓX @
56. �éjÊ£ 86. �
é KAÒ
�J� 116. �
IKP
27. A�K @
57. ��Am��@
87.
àñ�J� 117.
àYË
28. Ém.�'. 58.
à@Xñ�PñK. 88. àA�J JÓ 118. A
®K�@
29. Q�g. 59. ��J
¯ñ�KPñK. 89.
JK 119. �
èPA�K
30.�C¿ 60. H. QºKYªÓ 90. áÓA
�K 120. �
èñm��
ACM Trans. Asian Low-Resour. Lang. Inf. Process., Vol. 0, No. 0, Article 0. Publication date: 0.

Arabic Authorship Attribution: An Extensive Study on Twitter Posts 0:39
C STATISTICAL RESULTS
Table 4. Using the ANOVA test to showed that the difference between the datasets a, b, c, d, and e isstatistically significant.
(a) 2 Authors
set Mean SDa 79.17 16.78b 96.67 7.03c 80.00 18.51d 69.17 14.19e 84.17 12.08
P < 0.005
(b) 5 Authors
set Mean SDa 43.67 11.49b 51.67 12.50c 53.33 18.05d 26.67 13.61e 58.33 11.47
P < 0.005(c) 10 Authors
set Mean SDa 18.67 8.71b 46.00 9.79c 43.83 6.94d 40.50 12.15e 40.67 11.89
P < 0.005
(d) 20 Authors
set Mean SDa 39.33 4.44b 34.42 3.97c 27.75 3.75d 35.08 6.13e 32.00 5.35
P < 0.005
ACM Trans. Asian Low-Resour. Lang. Inf. Process., Vol. 0, No. 0, Article 0. Publication date: 0.

0:40 Altakrori et al.
Table 5. Post hoc Tukey HSD test with α = 0.05 to evaluate the effect of increasing the number of authors onthe performance (ANOVA result: [F (3, 12) = 249.57,p < 0.001])
(a) Mean and SD
# of Authors Mean SD2 84.8 4.445 54 7.2110 46.2 9.2820 34 7.38
(b) t-Test results and p-values.
# of Authors Tukey HSD p-valueFrom 2 to 5 p < 0.001From 2 to 10 p < 0.001From 2 to 20 p < 0.001From 5 to 10 p = 0.36From 5 to 20 p = 0.003From 10 to 20 p = 0.07
Table 6. Paired two-sample t-Tests with α = 0.05 to evaluate the significance of the difference in theperformance of n-grams vs. NB, SVM, DT ,and RF [F (4, 12) = 19.37,p < 0.001]
(a) Mean and SD
Attribution Tech. Mean SDn-grams 50.05 21.87NB 59.07 21.62SVM 46.58 24.26DT 54.41 21.34RF 63.34 19.65
(b) t-Test Results and p-value
n-grams vs. t-Test Results
NB t(3) = −3.65, p = 0.04SVM t(3) = 1.23, p = 0.31DT t(3) = −2.78, p = 0.07RF t(3) = −4.49, p = 0.02
ACM Trans. Asian Low-Resour. Lang. Inf. Process., Vol. 0, No. 0, Article 0. Publication date: 0.

Arabic Authorship Attribution: An Extensive Study on Twitter Posts 0:41
Table 7. Mean and SD for 2, 5, 10, and 20 authors with varying number of tweets per author
# of Tweets/ Mean SD ANOVA result P valueAuthor Author
2 25 84.75 4.39 F (4, 20) = 2.79 p = 0.05450 78.00 5.6375 81.20 5.84100 86.15 3.23125 87.33 6.01
5 25 53.94 7.19 F (4, 20) = 6.39 p = 0.05450 63.94 9.6675 60.24 6.10100 63.90 6.39125 76.30 6.08
10 25 45.91 9.20 F (4, 20) = 0.74 p = 0.5750 52.90 8.9175 51.53 8.57100 53.74 9.85125 55.33 10.13
20 25 34.16 7.34 F (4, 20) = 0.64 p = 0.6450 34.92 8.3675 40.41 7.51100 38.52 7.80125 39.78 8.68
ACM Trans. Asian Low-Resour. Lang. Inf. Process., Vol. 0, No. 0, Article 0. Publication date: 0.

0:42 Altakrori et al.
Table 8. ANOVA and Post hoc Tukey tests (with α = 0.05) to evaluate the significance of the difference in theperformance of n-grams vs. NB, SVM, DT, and RF for two (a), five (b), 10 (c), and 20 authors (d)
(a) 2 Authors (ANOVA: [F (4, 20) = 6.20, P = 0.002])
Attribution Technique Mean SD n-grams vs. p-valuen-grams 83.00 2.59NB 85.60 3.36 NB p = 0.86SVM 75.74 5.35 SVM p = 0.09DT 84.60 5.56 DT p = 0.89RF 88.48 3.76 RF p = 0.29
(b) 5 Authors (ANOVA: [F (4, 20) = 3.02, P = 0.04])
Attribution Technique Mean SD n-grams vs. p-valuen-grams 61.18 11.51NB 65.78 7.27 NB p = 0.89SVM 54.56 6.90 SVM p = 0.72DT 63.92 9.36 DT p = 0.89RF 72.88 6.99 RF p = 0.23
(c) 10 Authors (ANOVA: [F (4, 20) = 22.89, P < 0.001])
Attribution Technique Mean SD n-grams vs. p-valuen-grams 49.01 6.79NB 54.34 2.83 NB p = 0.29SVM 38.52 1.77 SVM p = 0.007DT 54.08 4.63 DT p = 0.36RF 63.37 3.72 RF p = 0.001
(d) 20 Authors (ANOVA: [F (4, 20) = 33.94, P < 0.001]
Attribution Technique Mean SD n-grams vs. p-valuen-grams 36.55 2.20NB 39.06 2.06 NB p = 0.67SVM 25.63 3.39 SVM p = 0.001DT 38.94 3.35 DT p = 0.70RF 47.62 3.75 RF p = 0.001
.
ACM Trans. Asian Low-Resour. Lang. Inf. Process., Vol. 0, No. 0, Article 0. Publication date: 0.

Arabic Authorship Attribution: An Extensive Study on Twitter Posts 0:43
Table 9. Mean and SD for 2, 5, 10, and 20 authors with specifying the minimum number of words per tweet
# of Tweets/ Mean SD ANOVA result p-valueAuthors Author F (5, 24)
2 1-5 79.11 2.42 1.87 0.136-10 77.31 6.9011-15 84.25 7.9816-20 85.17 7.7421-25 86.63 5.24No limit 84.75 4.39
5 1-5 51.19 8.13 3.49 0.026-10 54.98 9.8111-15 67.57 7.2216-20 61.07 9.0021-25 68.28 11.46No limit 53.40 6.33
10 1-5 33.15 8.37 3.29 0.026-10 39.60 9.8811-15 52.44 9.1716-20 52.22 10.6021-25 50.34 10.34No limit 45.89 9.17
20 1-5 28.89 7.74 1.15 0.366-10 27.89 7.8311-15 35.08 8.0816-20 38.07 10.6621-25 36.54 9.57No limit 34.28 7.50
.
ACM Trans. Asian Low-Resour. Lang. Inf. Process., Vol. 0, No. 0, Article 0. Publication date: 0.

0:44 Altakrori et al.
Table 10. ANOVA and Post hoc Tukey tests (with α = 0.05) to evaluate the significance of the difference inthe performance of n-grams vs. NB, SVM, DT and RF
(a) 2 Authors (ANOVA: F (4, 25) = 4.84, P = 0.005)
Attribution Technique Mean SD n-grams vs. p-valuen-grams 84.42 6.29NB 85.47 4.33 NB p = 0.90SVM 74.97 6.18 SVM p = 0.04DT 82.33 3.48 DT p = 0.90RF 87.17 5.67 RF p = 0.89
(b) 5 Authors (ANOVA: F (4, 25) = 5.60, P = 0.002)
Attribution Technique Mean SD n-grams vs. p-valuen-grams 55.11 11.71NB 64.03 8.91 NB p = 0.36SVM 49.12 5.39 SVM p = 0.69DT 59.01 6.04 DT p = 0.90RF 69.80 7.60 RF p = 0.04
(c) 10 Authors (ANOVA: F (4, 25) = 7.04, P < 0.001)
Attribution Technique Mean SD n-grams vs. p-valuen-grams 39.79 11.00NB 52.20 9.92 NB p = 0.10SVM 33.77 5.71 SVM p = 0.71DT 46.01 5.34 DT p = 0.67RF 56.25 8.40 RF p = 0.02
(d) 20 Authors (ANOVA: F (4, 25) = 15.57, P < 0.001)
Attribution Technique Mean SD n-grams vs. p-valuen-grams 31.02 7.60NB 38.92 6.75 NB p = 0.09SVM 21.30 1.95 SVM p = 0.02DT 33.61 2.21 DT p = 0.90RF 42.42 3.98 RF p = 0.01
.
ACM Trans. Asian Low-Resour. Lang. Inf. Process., Vol. 0, No. 0, Article 0. Publication date: 0.

Arabic Authorship Attribution: An Extensive Study on Twitter Posts 0:45
Table 11. Paired two-sample t-Tests with α = 0.05 to evaluate the significance of the difference in theperformance of NB, SVM, DT, RF, and n-grams when groups of 5 tweets are merged into one artificial tweet
Classification Technique Tweets Mean SD t-test p-valueNB Single 61.22 19.60 -3.93 p = 0.03
Merged 76.86 12.22
SVM Single 48.61 21.61 1.94 p = 0.15Merged 40.89 14.02
DT Single 60.38 19.14 -2.65 p =0.08Merged 65.38 17.55
RF Single 68.09 17.13 -4.32 p = 0.02Merged 80.23 12.18
n-gram Single 57.43 19.79 -6.66 p = 0.006Merged 77.07 14.23
Table 12. Post hoc Tukey HSD test with α = 0.05 to evaluate the effect of merging groups of 5 tweets intoone artificial tweet on the performance (ANOVA result: [F (4, 15) = 5.30,p = 0.007])
Attribution Technique Mean SD n-grams vs. p-valuen-gram 77.07 14.23NB 76.86 12.22 NB p = 0.90SVM 40.89 14.02 SVM p = 0.02DT 65.38 17.55 DT p = 0.74RF 80.24 12.18 RF p = 0.90
.
ACM Trans. Asian Low-Resour. Lang. Inf. Process., Vol. 0, No. 0, Article 0. Publication date: 0.

0:46 Altakrori et al.
Table 13. ANOVA t-Test with α = 0.05 to evaluate the different n-grams modalities
(a) Mean and SD
# of Modality Mean SDAuthors
2 All 83.0 2.6Char 81.8 4.0Word 81.1 2.0POS 66.7 2.9
5 All 61.2 11.5Char 63.0 10.9Word 56.0 8.7POS 38.1 7.9
10 All 49.0 6.8Char 50.4 8.4Word 44.0 6.3POS 23.3 3.0
20 All 36.5 2.2Char 36.9 2.6Word 34.0 2.6POS 14.9 0.3
(b) ANOVA results and P values
# of ANOVA results P valueAuthors F (3, 16)
2 33.49 p < 0.0015 6.64 p = 0.00410 19.30 p < 0.00120 149.58 p < 0.001
.
ACM Trans. Asian Low-Resour. Lang. Inf. Process., Vol. 0, No. 0, Article 0. Publication date: 0.

Arabic Authorship Attribution: An Extensive Study on Twitter Posts 0:47
Table 14. Post hoc Tukey test (with α = 0.05) to evaluate the significance of the difference in using characterlevel, word level, POS level or all modalities combined
(a) 2 Authors
Modality vs. p-valueCharacter
Word p = 0.90POS p = 0.001All three levels p = 0.89
WordPOS p = 0.001All three levels p = 0.71
POSAll three levels p = 0.001
(b) 5 Authors
Modality vs. p-valueCharacter
Word p = 0.67POS p = 0.005All three levels p = 0.89
WordPOS p = 0.048All three levels p = 0.83
POSAll three levels p = 0.009
(c) 10 Authors
Modality vs. p-valueCharacter
Word p = 0.41POS p = 0.001All three levels p = 0.89
WordPOS p = 0.001All three levels p = 0.6
POSAll three levels p = 0.001
(d) 20 Authors
Modality vs. p-valueCharacter
Word p = 0.12POS p = 0.001All three levels p = 0.89
WordPOS p = 0.001All three levels p = 0.2
POSAll three levels p = 0.001
.
ACM Trans. Asian Low-Resour. Lang. Inf. Process., Vol. 0, No. 0, Article 0. Publication date: 0.

0:48 Altakrori et al.
Table 15. Mean and SD for using Diacrticis with different n-gram modalities
(a) Diacritics are kept: Mean and SD
# Authors Modality Mean SD2 Char 81.8 4.0
Word 81.1 2.0POS 66.7 2.9All 83.0 2.6
5 Char 63.0 10.9Word 56.0 8.7POS 38.1 7.9All 61.2 11.5
10 Char 50.4 8.4Word 44.0 6.3POS 23.3 3.0All 49.0 6.8
20 Char 36.9 2.6Word 34.0 1.7POS 14.9 0.3All 36.5 2.2
(b) Diacritics are removed: Mean and SD
# Authors Modality Mean SD2 Char 81.6 4.6
Word 81.1 2.3POS 66.7 2.9All 82.3 3.2
5 Char 62.7 10.6Word 56.0 8.9POS 38.1 7.9All 61.0 11.4
10 Char 50.1 8.2Word 43.9 6.1POS 23.3 3.0All 47.4 9.1
20 Char 36.3 2.5Word 33.8 1.7POS 14.9 0.3All 34.2 3.4
Table 16. ANOVA t-Test with α = 0.05 to evaluate the effect of using Diacrticis with different n-grammodalities
(a) ANOVA results and p-values
# Authors ANOVA resultsF(5, 24)
2 0.31, p = 0.895 0.47, p = 0.7910 0.75, p = 0.5920 1.75, p = 0.16
.
ACM Trans. Asian Low-Resour. Lang. Inf. Process., Vol. 0, No. 0, Article 0. Publication date: 0.

Arabic Authorship Attribution: An Extensive Study on Twitter Posts 0:49
Table 17. Mean and SD for using different categories of features.
Authors Features Mean SD Authors Features Mean SD2 Lexical 83.02 7.32 10 Lexical 41.49 10.07
Structural 74.03 3.09 Structural 24.56 2.1Syntactic 81.07 4.06 Syntactic 30.86 10.3Lex + Struc 84.87 6.27 Lex + Struc 44.39 8.64Lex + Syn 85.3 6.23 Lex + Syn 43.79 10.87Struc + Syn 85.66 4.4 Struc + Syn 38.06 7.86All three 85.68 4.91 All three 47 8.91
5 Lexical 50.23 6.52 20 Lexical 27.81 8.5Structural 42.48 1.6 Structural 17.3 1.23Syntactic 43.19 8.76 Syntactic 21.99 7.26Lex + Struc 52.61 4.51 Lex + Struc 30.74 7.07Lex + Syn 52.55 8.02 Lex + Syn 31.71 10.45Struc + Syn 50.68 4.41 Struc + Syn 28.96 7.56All three 55.82 6.53 All three 34.55 8.79
Table 18. 5 Authors: Post hoc Tukey test to evaluate different categories of features.
(a) ANOVA results and P values
Pair p-value Pair p-valueLexical vs Structural 0.572 Syntactic vs Lex + Struc 0.361Lexical vs Syntactic 0.659 Syntactic vs Lex + Syn 0.369Lexical vs Lex + Struc 0.90 Syntactic vs Struc + Syn 0.603Lexical vs Lex + Syn 0.90 Syntactic vs All three 0.104Lexical vs Struc + Syn 0.90 Lex + Struc vs Lex + Syn 0.90Lexical vs All three 0.837 Lex + Struc vs Struc + Syn 0.90Structural vs Syntactic 0.90 Lex + Struc vs All three 0.90Structural vs Lex + Struc 0.283 Lex + Syn vs Struc + Syn 0.90Structural vs Lex + Syn 0.29 Lex + Syn vs All three 0.90Structural vs Struc + Syn 0.515 Struc + Syn vs All three 0.894Structural vs All three 0.076
Table 19. 10 Authors: Post hoc Tukey test to evaluate different categories of features.
(a) ANOVA results and p-values
# Authors ANOVA results2 F (5, 24) = 0.31, p = 0.895 F (5, 24) = 0.47, p = 0.7910 F (5, 24) = 0.75, p = 0.5920 F (5, 24) = 1.75, p = 0.16
.
ACM Trans. Asian Low-Resour. Lang. Inf. Process., Vol. 0, No. 0, Article 0. Publication date: 0.

0:50 Altakrori et al.
ACKNOWLEDGMENTSThe paper is partially supported by the Canada Research Chairs (CRC) Program (950-230623),the Natural Sciences and Engineering Research Council of Canada (NSERC) Discovery Grants(RGPIN-2018-03872), and the Zayed University Research Incentive Fund (RIF) (R14025 and R13059).
REFERENCES[1] Ahmed Abbasi and Hsinchun Chen. 2005a. Applying Authorship Analysis to Arabic Web Content. Intelligence and
Security Informatics (2005), 75–93.[2] Ahmed Abbasi and Hsinchun Chen. 2005b. Applying Authorship Analysis to Extremist-Group Web Forum Messages.
Intelligent Systems, IEEE 20, 5 (2005), 67–75.[3] Ahmed Abbasi and Hsinchun Chen. 2006. Visualizing Authorship for Identification. In International Conference on
Intelligence and Security Informatics. Springer, 60–71.[4] Mahmoud Al-Ayyoub, Ahmed Alwajeeh, and Ismail Hmeidi. 2017a. An Extensive Study of Authorship Authentication
of Arabic Articles. International Journal of Web Information Systems 13, 1 (2017), 85–104. DOI:http://dx.doi.org/10.1108/IJWIS-03-2016-0011
[5] Mahmoud Al-Ayyoub, Yaser Jararweh, Abdullateef Rabab’ah, and Monther Aldwairi. 2017b. Feature Extraction andSelection for Arabic Tweets Authorship Authentication. Journal of Ambient Intelligence and Humanized Computing 8,3 (01 Jun 2017), 383–393. https://doi.org/10.1007/s12652-017-0452-1
[6] Alaa Saleh Altheneyan and Mohamed El Bachir Menai. 2014. Naïve Bayes Classifiers for Authorship Attribution ofArabic Texts. Journal of King Saud University-Computer and Information Sciences 26, 4 (2014), 473–484.
[7] Ahmed Alwajeeh, Mahmoud Al-Ayyoub, and Ismail Hmeidi. 2014. On Authorship Authentication of Arabic Articles.In Proc. of the 5th International Conference on Information and Communication Systems (ICICS). IEEE, 1–6.
[8] ArabiNames.com. 2015. Arabi Names. (2015). http://arabinames.com/categories.aspx[9] Victor Benjamin, Wingyan Chung, Ahmed Abbasi, Joshua Chuang, Catherine A Larson, and Hsinchun Chen. 2014.
Evaluating Text Visualization for Authorship Analysis. Security Informatics 3, 1 (2014), 10.[10] Mudit Bhargava, Pulkit Mehndiratta, and Krishna Asawa. 2013. Stylometric Analysis for Authorship Attribution on
Twitter. In Big Data Analytics. Springer, 37–47.[11] Leo Breiman. 2001. Random Forests. Machine learning 45, 1 (2001), 5–32.[12] Thiago Cavalcante, Anderson Rocha, and Ariadne Carvalho. 2014. Large-Scale Micro-Blog Authorship Attribution:
Beyond Simple Feature Engineering. In Progress in Pattern Recognition, Image Analysis, Computer Vision, and Applications.Springer, 399–407.
[13] Chih-Chung Chang and Chih-Jen Lin. 2011. LIBSVM: A Library for Support Vector Machines. ACM Transactions onIntelligent Systems and Technology (TIST) 2, 3 (2011), 27.
[14] Carole E Chaski. 2005. Who’s at the Keyboard? Authorship Attribution in Digital Evidence Investigations. InternationalJournal of Digital Evidence 4, 1 (2005), 1–13.
[15] Na Cheng, Rajarathnam Chandramouli, and KP Subbalakshmi. 2011. Author gender identification from text. DigitalInvestigation 8, 1 (2011), 78–88.
[16] Rosa María Coyotl-Morales, Luis Villaseñor-Pineda, Manuel Montes-y Gómez, and Paolo Rosso. 2006. AuthorshipAttribution Using Word Sequences. In Progress in Pattern Recognition, Image Analysis and Applications. Springer,844–853.
[17] Olivier de Vel, Alison Anderson, Malcolm Corney, and George Mohay. 2001. Mining E-Mail Content for AuthorIdentification Forensics. ACM Sigmod Record 30, 4 (2001), 55–64.
[18] Mona Diab, Kadri Hacioglu, and Daniel Jurafsky. 2007. Automated Methods for Processing Arabic Text: FromTokenization to Base Phrase Chunking. Arabic Computational Morphology: Knowledge-Based and Empirical Methods.(2007).
[19] Steven H. H. Ding, Benjamin C. M. Fung, and Mourad Debbabi. 2015. A Visualizable Evidence-Driven Approach forAuthorship Attribution. ACM Trans. Inf. Syst. Secur. 17, 3, Article 12 (March 2015), 30 pages. DOI:http://dx.doi.org/10.1145/2699910
[20] Georgia Frantzeskou, Efstathios Stamatatos, Stefanos Gritzalis, Carole E Chaski, and Blake Stephen Howald. 2007.Identifying Authorship by Byte-Level N-Grams: The Source Code Author Profile (SCAP) Method. International Journalof Digital Evidence 6, 1 (2007), 1–18.
[21] Zhenhao Ge, Yufang Sun, and Mark JT Smith. 2016. Authorship Attribution Using a Neural Network Language Model..In AAAI. 4212–4213.
[22] Ian Goodfellow, Yoshua Bengio, Aaron Courville, and Yoshua Bengio. 2016. Deep learning. Vol. 1. MIT press Cambridge.[23] Nizar Habash and Owen Rambow. 2005. Arabic Tokenization, Morphological Analysis, and Part-Of-Speech Tagging in
One Fell Swoop. In Proc. of the Conference of American Association for Computational Linguistics. 578–580.
ACM Trans. Asian Low-Resour. Lang. Inf. Process., Vol. 0, No. 0, Article 0. Publication date: 0.

Arabic Authorship Attribution: An Extensive Study on Twitter Posts 0:51
[24] MA Hall. 1998. Correlation-Based Feature Subset Selection for Machine Learning. Thesis submitted in partial fulfillmentof the requirements of the degree of Doctor of Philosophy at the University of Waikato (1998).
[25] Mark Hall, Eibe Frank, Geoffrey Holmes, Bernhard Pfahringer, Peter Reutemann, and Ian H Witten. 2009. The WEKAData Mining Software: An Update. ACM SIGKDD explorations newsletter 11, 1 (2009), 10–18.
[26] Jiawei Han and Micheline Kamber. 2001. Data Mining: Concepts and Techniques. San Francisco, CA, itd: MorganKaufmann 5 (2001).
[27] Markus Hofmann and Ralf Klinkenberg. 2013. RapidMiner: Data Mining Use Cases and Business Analytics Applications.Chapman & Hall/CRC.
[28] Giacomo Inches, Morgan Harvey, and Fabio Crestani. 2013. Finding Participants in a Chat: Authorship Attribution forConversational Documents. In Proc. of the International Conference on Social Computing (SocialCom). IEEE, 272–279.
[29] Farkhund Iqbal, Rachid Hadjidj, Benjamin C. M. Fung, and Mourad Debbabi. 2008. A Novel Approach of MiningWrite-Prints for Authorship Attribution in E-Mail Forensics. Digital Investigation 5 (2008), S42–S51.
[30] Shunichi Ishihara. 2011. A Forensic Authorship Classification in Sms Messages: A Likelihood Ratio Based ApproachUsing N-Gram. In Proc. of the Australasian Language Technology Association Workshop 2011. 47–56.
[31] George H John and Pat Langley. 1995. Estimating Continuous Distributions in Bayesian Classifiers. In Proc. of theEleventh conference on Uncertainty in artificial intelligence. Morgan Kaufmann Publishers Inc., 338–345.
[32] Patrick Juola. 2006. Authorship Attribution. Found. Trends Inf. Retr. 1, 3 (Dec. 2006), 233–334. DOI:http://dx.doi.org/10.1561/1500000005
[33] Vlado Kešelj, Fuchun Peng, Nick Cercone, and Calvin Thomas. 2003. N-Gram-Based Author Profiles for AuthorshipAttribution. In Proc. of the Conference Pacific Association for Computational Linguistics, PACLING, Vol. 3. 255–264.
[34] Yoon Kim. 2014. Convolutional Neural Networks for Sentence Classification. In Proc. of the 2014 Conference onEmpirical Methods in Natural Language Processing (EMNLP), Alessandro Moschitti, Bo Pang, and Walter Daelemans(Eds.). Association for Computational Linguistics, Doha, Qatar, 1746–1751.
[35] Bradley Kjell, W Addison Woods, and Ophir Frieder. 1994. Discrimination of Authorship Using Visualization. Informa-tion Processing & Management 30, 1 (1994), 141–150.
[36] Moshe Koppel, Jonathan Schler, and Shlomo Argamon. 2009. Computational Methods in Authorship Attribution.Journal of the American Society for information Science and Technology 60, 1 (2009), 9–26.
[37] Sushil Kumar and Mousmi A Chaurasia. 2012. Assessment on Stylometry for Multilingual Manuscript. Assessment 2, 9(2012), 01–06.
[38] Robert Layton, Stephen McCombie, and Paul Watters. 2012. Authorship Attribution of Irc Messages Using InverseAuthor Frequency. In Proc. of the Third Cybercrime and Trustworthy Computing Workshop (CTC). IEEE, 7–13.
[39] Robert Layton, Paul Watters, and Richard Dazeley. 2010. Authorship Attribution for Twitter in 140 Characters or Less.In Proc. of the Second Cybercrime and Trustworthy Computing Workshop. IEEE, 1–8.
[40] Robert Layton, Paul Watters, and Richard Dazeley. 2012. Recentred Local Profiles for Authorship Attribution. NaturalLanguage Engineering 18, 03 (7 2012), 293–312. Issue 03. DOI:http://dx.doi.org/10.1017/S1351324911000180
[41] Jiwei Li, Xinlei Chen, Eduard Hovy, and Dan Jurafsky. 2015. Visualizing and understanding neural models in NLP.arXiv preprint arXiv:1506.01066 (2015).
[42] Mark Liberman. 2008. Ask Language Log: Comparing the Vocabularies of Different Languages. Online. (March 2008).http://itre.cis.upenn.edu/~myl/languagelog/archives/005514.html
[43] Kim Luyckx and Walter Daelemans. 2008. Authorship Attribution and Verification With Many Authors and LimitedData. In Proc. of the 22nd International Conference on Computational Linguistics-Volume 1. Association for ComputationalLinguistics, 513–520.
[44] Kim Luyckx and Walter Daelemans. 2011. The Effect of Author Set Size and Data Size in Authorship Attribution.Literary and linguistic Computing 26, 1 (2011), 35–55.
[45] Christopher D Manning, Mihai Surdeanu, John Bauer, Jenny Rose Finkel, Steven Bethard, and David McClosky. 2014.The Stanford CoreNLP Natural Language Processing Toolkit. In ACL (System Demonstrations). 55–60.
[46] Andrew McCallum and Kamal Nigam. 1998. A Comparison of Event Models for Naive Bayes Text Classification. InProc. of the AAAI Workshop on Learning for Text Categorization, Vol. 752. Citeseer, 41–48.
[47] Miniwatts Marketing Group. 2013. InternetWorld Users by Language. (December 2013). http://www.internetworldstats.com/stats7.htm
[48] Frederick Mosteller and David Wallace. 1964. Inference and Disputed Authorship: The Federalist. (1964).[49] Ahmed Fawzi Otoom, Emad E Abdullah, Shifaa Jaafer, Aseel Hamdallh, and Dana Amer. 2014. Towards Author
Identification of Arabic Text Articles. In Proc. of the 5th Internation Conference on Information and CommunicationSystems (ICICS). IEEE, 1–4.
[50] Siham Ouamour and Halim Sayoud. 2013. Authorship Attribution of Short Historical Arabic Texts Based on LexicalFeatures. In Proc. of the International Conference on Cyber-Enabled Distributed Computing and Knowledge Discovery(CyberC). IEEE, 144–147.
ACM Trans. Asian Low-Resour. Lang. Inf. Process., Vol. 0, No. 0, Article 0. Publication date: 0.

0:52 Altakrori et al.
[51] Arfath Pasha, Mohamed Al-Badrashiny, Mona T Diab, Ahmed El Kholy, Ramy Eskander, Nizar Habash, Manoj Pooleery,Owen Rambow, and Ryan Roth. 2014. MADAMIRA: A Fast, Comprehensive Tool for Morphological Analysis andDisambiguation of Arabic.. In LREC, Vol. 14. 1094–1101.
[52] John Ross Quinlan. 1993. C4.5: Programs for Machine Learning. The Morgan Kaufmann Series in Machine Learning,San Mateo, CA: Morgan Kaufmann,| c1993 1 (1993).
[53] Abdullateef Rabab’ah, Mahmoud Al-Ayyoub, Yaser Jararweh, and Monther Aldwairi. 2016. Authorship Attribution ofArabic Tweets. Proc. of the IEEE/ACS 13th International Conference of Computer Systems and Applications (AICCSA)(2016), 1–6.
[54] Roshan Ragel, Pramod Herath, and Upul Senanayake. 2013. Authorship Detection of SMS Messages Using Unigrams.In Proc. of the 8th International Conference on Industrial and Information Systems (ICIIS). IEEE, 387–392.
[55] Dylan Rhodes. 2015. Author Attribution With CNNs. Avaiable online: https://www. semanticscholar. org/paper/Author-Attribution-with-Cnn-s-Rhodes/0a904f9d6b47dfc574f681f4d3b41bd840871b6f/pdf (accessed on 22 August 2016) (2015).
[56] David C Rubin. 1978. Word-Initial and Word-Final Ngram Frequencies. Journal of Literacy Research 10, 2 (1978),171–183.
[57] Sebastian Ruder, Parsa Ghaffari, and John G Breslin. 2016. Character-Level and Multi-Channel Convolutional NeuralNetworks for Large-Scale Authorship Attribution. arXiv preprint arXiv:1609.06686 (2016).
[58] Roy Schwartz, Oren Tsur, Ari Rappoport, and Moshe Koppel. 2013. Authorship Attribution of Micro-Messages. In Proc.of the Conference on Empirical Methods on Natural Language Processing (EMNLP). 1880–1891.
[59] Kareem Shaker and David Corne. 2010. Authorship Attribution in Arabic Using a Hybrid of Evolutionary Searchand Linear Discriminant Analysis. In Proc. of The Computational Intelligence (UKCI) Workshop. IEEE, UK, 1–6. DOI:http://dx.doi.org/10.1109/UKCI.2010.5625580
[60] Kareem Shaker, David Corne, and Richard Everson. 2007. Investigating Hybrids of Evolutionary Search and LinearDiscriminant Analysis for Authorship Attribution. In Proc. of the IEEE Congress on Evolutionary Computation (CEC).IEEE, 2071–2077.
[61] Armin Shmilovici. 2005. Support Vector Machines. Springer US, Book section 12, 257–276. DOI:http://dx.doi.org/10.1007/0-387-25465-X_12
[62] Prasha Shrestha, Sebastian Sierra, Fabio A González, Paolo Rosso, Manuel Montes-y Gómez, and Thamar Solorio. 2017.Convolutional Neural Networks for Authorship Attribution of Short Texts. Proc. of the 15th Conference of the EuropeanChapter of the Association for Computational Linguistics (EACL) (2017), 669.
[63] Rui Sousa Silva, Gustavo Laboreiro, Luís Sarmento, Tim Grant, Eugénio Oliveira, and Belinda Maia. 2011. ‘twaznme!!!;(’Automatic Authorship Analysis of Micro-Blogging Messages. In Natural Language Processing and InformationSystems. Springer, 161–168.
[64] Steve Simon. 2005. When the F Test Is Significant, but Tukey Is Not. (2005). http://www.pmean.com/05/TukeyTest.html[65] Efstathios Stamatatos. 2009. A Survey of Modern Authorship Attribution Methods. Journal of the American Society for
information Science and Technology 60, 3 (2009), 538–556.[66] Nick Taylor. 2015. Twitter and Open Data in Academia. (09 2015). https://twittercommunity.com/t/
twitter-and-open-data-in-academia/51934[67] Twitter. 2017. Developer Agreement and Policy. (2017). https://dev.twitter.com/overview/terms/agreement-and-policy[68] Ian HWitten and Eibe Frank. 2005. Data Mining: Practical Machine Learning Tools and Techniques (third ed ed.). Morgan
Kaufmann.[69] Xiang Zhang, Junbo Zhao, and Yann LeCun. 2015. Character-level convolutional networks for text classification. In
Advances in neural information processing systems. 649–657.[70] Rong Zheng, Jiexun Li, Hsinchun Chen, and Zan Huang. 2006. A Framework for Authorship Identification of Online
Messages: Writing-Style Features and Classification Techniques. Journal of the American society for information scienceand technology 57, 3 (2006), 378–393.
Received March 2017; revised March 2018; accepted June 2018
ACM Trans. Asian Low-Resour. Lang. Inf. Process., Vol. 0, No. 0, Article 0. Publication date: 0.