Embed Size (px)
Citation preview

M. A. EL- Borie and A. Hamdy Arab J. Nucl. Sci. Appl, Vol 51, 1, 152-167 (2018)
152
A Correlative Study between Heliospheric Current Sheet Tilts,
Cosmic Ray Intensities and Solar Activity Parameters
M. A. EL- Borie1 and A. Hamdy2 (1) Physics Department, Faculty of Science, Alexandria University, Egypt
(2) Physics Department, Faculty of Science, Cairo University, Egypt
Received: 15/5/2017 Accepted: 16/7/2017
ABSTRACT
The correlations between the tilt angle (TA) of heliospheric current sheet
(HCS) and the cosmic ray intensity (CRI), strength (B) of the interplanetary
magnetic field (IMF), sunspot number (SSN), solar plasma speed (SWS) and density
( n ) have been studied before and after the reversal of IMF polarities. High
sensitivity of the CRI of different rigidities to changes in the TA of HCS is observed
during the qA < 0 epoch (when the IMF toward the Sun) as compared to the qA > 0
epoch (when IMF away from the Sun). The results of the present study are
consistent with the drift model of cosmic rays, showing that the spectra of drift
particles were harder after the reversal of IMF polarity state in (1999/2000).
The reversal of IMF polarity state from (qA > 0 state to qA < 0 state) has a
great effect on the rigidity-tilts dependence. The modulation of the lower energy
particles of (median rigidity Rm < 22 GV) is more pronounced throughout qA < 0
epoch than that of qA > 0 epoch. The rate of sensitivity/modulation of CRIs to the
HCS tilts is higher throughout the minimum solar activity years as compared to the
maximum solar activity period.
Keywords: Cosmic rays – Interplanetary magnetic field – Solar Activity – Solar wind –
Heliospheric current sheet
INTRODUCTION
The TA of the HCS plays a dominant role in the modulation of galactic cosmic rays.
The highly inverse correlation between the cosmic ray intensities and the HCS tilts was more
pronounced during the qA < 0 epochs as compared to the qA > 0 epochs (1 - 6).
In contrast, there is a highly positive correlation between the sunspot numbers and the tilts of
HCS (6 - 8). The polarity state of the solar magnetic field reverses at the solar maximum activity, nearly
every (11- year). The strength of the interplanetary magnetic field (IMF) and the sunspot number are
highly correlated (9). The behavior of the TA of HCS exhibits roughly the same variations over all
solar activity cycles in accord with idea of the cyclic behavior. This behavior depends only on the
phase of the solar activity cycle (SAC), not on its strength. Moreover the ascending and maximum
phases of the HCS TA cycle are shorter and faster than that during the descending phase (10 , 11).
The solar wind speed increases with distance from the HCS. When the HCS is inclined and the
spacecraft which are in the ecliptic plane spends a greater fraction of time away from the neutral sheet,
and then experiences higher solar wind speeds, this leads to observing the correlation between the
The Egyptian
Society of Nuclear
Sciences and
Applications
ISSN 1110-0451 (ESNSA) Web site: esnsa-eg.com
Arab Journal of Nuclear Sciences and Applications
Vol 51, 1, (152-167) 2018
M. A. EL- Borie and A. Hamdy Arab J. Nucl. Sci. Appl, Vol 51, 1, 152-167 (2018)
153
solar wind speed and the TA of HCS (12). During the time of minimum solar activity, the lines of solar
magnetic field are mostly of an open type and generate a fast solar wind. Therefore, the fast solar wind
is always associated with small proton density (13). On the other hand, during the period of maximum
solar activity, closed lines of solar magnetic field and slow solar wind dominate. Therefore, the slow
solar wind is associated with relatively high proton density (14, 15).
On the other hand, the solar minimum of solar activity cycle 23 (2006 - 2009) has been
unusually long and deep, in comparison with the previous three solar minima. The recent solar
minimum has the smallest sunspot number, as well as the lowest and the least dense solar wind and the
weakest IMF (16). Furthermore, high cosmic ray intensities were resulted from the reduction in IMF
rather than from the reduction in the TA of HCS in 2009 during the recent solar minimum (17).
The aim of the present work is to study the relationship between the TA of HCS and the CRIs,
as well as some solar parameters: (B of the IMF, SSN, SWS and n) for different geomagnetic epochs:
1981-1988 (qA < 0), 1991-1998 (qA > 0) and 2001-2008 (qA < 0).
The sensitivity of CRI of different median rigidities (Rm: 16 GV - 33 GV) to changes in the TA
has been studied before and after the reversals of IMF polarity state during three considered epochs.
DATA RESOURCES
The 27-day measurements of solar/interplanetary parameters: sunspot number (RZ), solar wind
speed (SWS) , solar wind plasma density (n) and strength (B) of IMF have been obtained from the
Omni-web data explorer via <omniweb.gsfc.nassa.gov/from/dx1.htm>. The measurements of the
heliospheric current sheet tilts have been obtained via the website <Wso.stanford.edu/tilts.html>. In
addition, the 27-day counts of the CRIs with different median rigidities have been obtained via
<http://cr0.izmiran.rssi.ru/common/links.htm>.
The details of the cosmic ray stations are displayed in Table (1).
Table (1): Details of the selected NM stations ; cut-off (Ro) and median (Rm) rigidities, geographical
locations and the altitude from the sea level
Stations Of
Cosmic Rays
Rigidity Geographical Details
Alt.
(m)
Ro
(GV)
Rm
(GV)
Lat.
(deg.)
Long.
(deg.)
Apatity 0.57 16 67.55 33.33 177
Kiel 2.36 18 54.3 10.1 54
Hermanus 4.44 20 -34.43 19.23 26
Rome 6.32 22 41.9 12.52 60
Tbilisi 6.73 23 41.43 44.48 510
Potchefstroom 6.98 25 -26.7 27.09 1351
Tsumeb 9.12 27 -19.2 17.58 1240
Huancayo /
Haleakala
12.91 33 20.72
-12.03
-156.25
-75.33
3040
3400
M. A. EL- Borie and A. Hamdy Arab J. Nucl. Sci. Appl, Vol 51, 1, 152-167 (2018)
154
RESULTS AND DISCUSSION
1- Correlation between HCS Tilts and some solar parameters
According to the cosmic ray drift theory, when the polarity state of the heliospher is (qA > 0),
charged particles are drifted inward from the polar regions to the equatorial plane and out along the
heliospheric current sheet HCS. So charged particles are less affected by the drifts associated with the
changes in the TA of HCS. On the other side, when the polarity state of the heliospher is (qA < 0), the
charged particles reach the inner heliosphere by drifting in along the sheet with a maximum intensity.
The intensity of the particles decreases with distance away from the sheet leading to cosmic ray
maxima. Therefore, the charged particles are more affected by the drifts associated with the changes
in the TA of HCS (18). It is well now know that, during the positive polarity state of solar magnetic
field (qA > 0), the IMF directs away from the Sun’s north (above the HCS) toward the Sun’s south
(below the HCS). In contrast, the IMF directs away from the Sun’s south below the HCS toward the
Sun’s north above the HCS During the negative polarity state of solar magnetic field (qA < 0) (19).
Near the solar maximum activity, the polarity state of the heliosphere is reversed when the HCS
tilts become greater than 70o (closer to 90o). The charged particles can encounter the fields in polar
regions of both positive and negative polarities. So, the charged particles drift sometimes inward and
sometimes outward and there is no response to changes in the tilt angle of HCS (20). Therefore, these
years have omitted from the present study because there is no regular pattern can describe the
complex structure of HCS around the years of IMF polarity reversal.
The relative sunspot number (Rz) is an index of solar activity of the entire visible disk of the
Sun. It is computed by equation (I). Where G is the number of sunspot groups on the solar disk, S is
the total number of individual spots in all the sunspot groups and K is the variable scaling factor
(usually < 1) which accounts for observing conditions (21). On the other hand, there is a highly negative
correlation between SSN and CRI (22).
Rz = K (10 G + S) (I)
The solar wind (SW) is divided into two components, slow and fast solar wind. A slow solar
wind is originated from a region around the Sun's equatorial belt and its velocity is about (400
km/sec). In addition, a fast solar wind is originated from coronal holes which are funnel-like regions of
open field lines in the sun's magnetic field and the range of its velocity is about (750 - 1800 km/sec) (23). The fast solar wind is always associated with small plasma density while the slow solar wind is
associated with relatively high plasma density (13 - 15). On the other hand, the dynamic pressure (P) of
the solar wind is a function of solar wind speed (v) in km/sec and its density (n) in particles/cm3 (24).
The dynamic pressure of the solar wind is about (1 - 6) nPa , and can be computed by the equation (II).
P = 1.6726 × 10 - 6
nv2 (II)
The linear correlations between tilt angle (TA) of the HCS and sunspot number (Rz), strength
(B) of the interplanetary magnetic field (IMF), solar wind speed (SWS) and density (n) are displayed
in Figures (1, 2, 3 and 4), respectively. This analysis is applied to three considered periods; 1981-
1988 (qA < 0), 1991-1998 (qA > 0) and 2001-2008 (qA < 0) and the correlation coefficient ( r ) is
added calculated for each epoch.
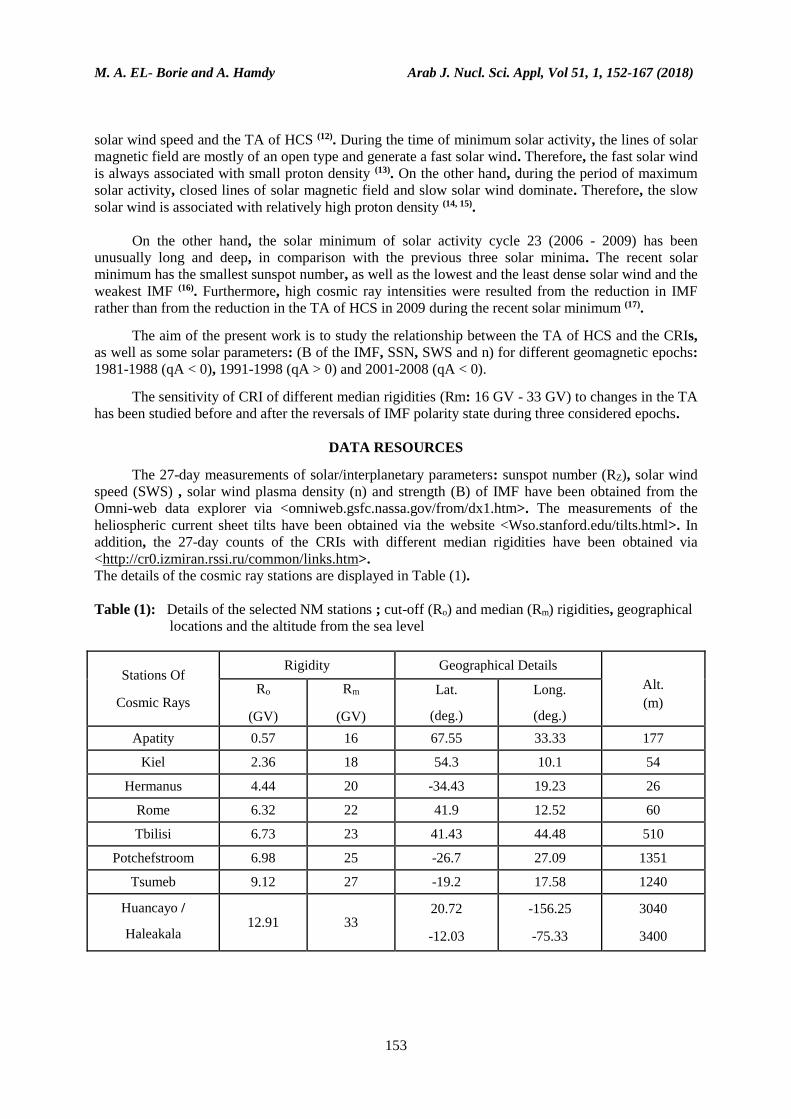
Figure (1) shows a highly positive correlation between the TA of HCS and the sunspot number
(SSN). The correlation coefficients are (87.1% , 85.6% and 77.8%) during three periods; 1981-1988
(qA < 0),1991-1998 (qA > 0) and 2001-2008 (qA < 0), respectively. Therefore, the correlation between
the TA of HCS and the SSN is nearly independent on the IMF polarity state. The slope of fitted line
(i.e. the sensitivity of Rz to the TA of HCS) throughout the period 2001-2008 ( 4.1791) is greater
than that of other periods. Therefore, the correlation between the TA of HCS and the SSN became
more pronounced in period 2001-2008.
M. A. EL- Borie and A. Hamdy Arab J. Nucl. Sci. Appl, Vol 51, 1, 152-167 (2018)
155
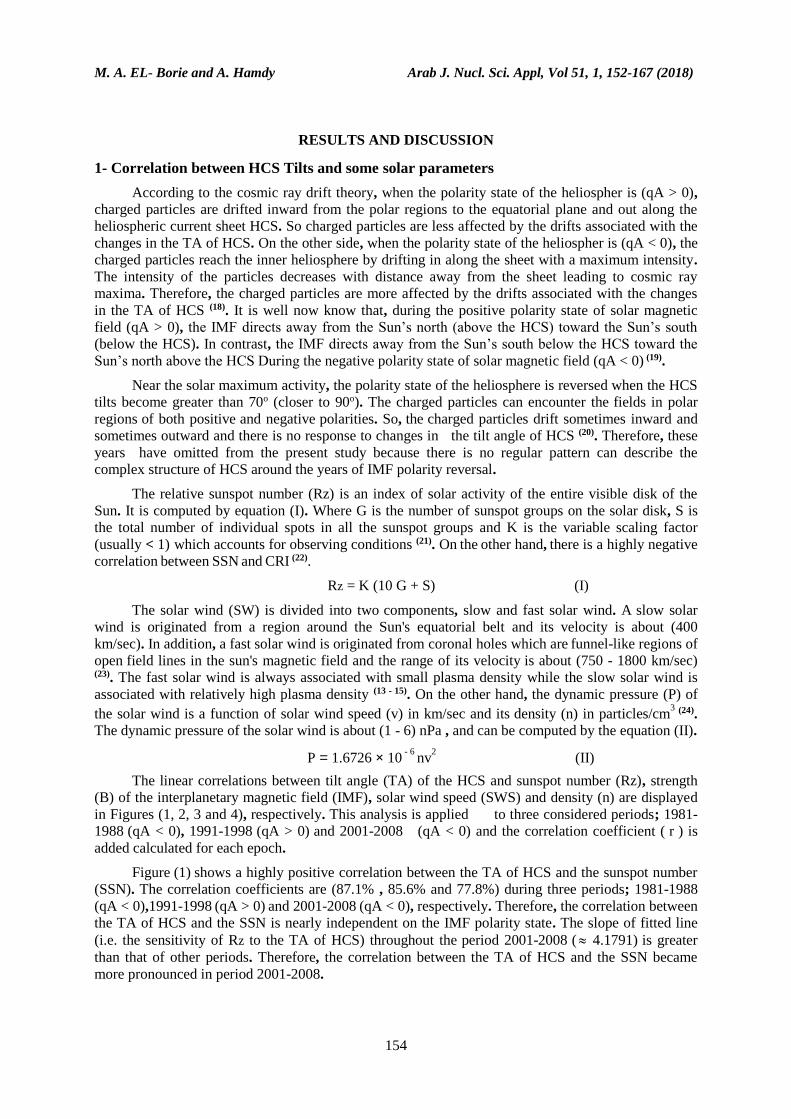
The weak correlation between the TA of HCS and the strength (B) of IMF is presented in Figure
(2). The correlation coefficients have fairly small values (- 24.6 % , 11.3 % and 25.7 %) during three
periods; 1981-1988 (qA < 0), 1991-1998 (qA > 0) and 2001-2008 (qA < 0), respectively. Therefore,
the correlation between the TA of HCS and the strength of IMF is greater in the qA < 0 epochs as
compared to the qA > 0 epochs and depends on the IMF polarity state.
Fig. (1): The TA of HCS versus the sunspot number throughout three IMF polarity epochs; 1981-
1988 (qA < 0) , 1991-1998 (qA > 0) and 2001-2008 (qA < 0). Carrington rotation
numbers (CNs) are noted for each epoch
1981 - 1988 ( qA < 0 ) , CNs : 1704 - 1810
y = 3.6882 x - 41.833
r = 0.871
0
50
100
150
200
250
300
0 10 20 30 40 50 60 70
TA of HCS ( Degree )
Su
nsp
ot
Nu
mb
er
1991 - 1998 ( qA > 0 ) , CNs : 1838 - 1944
y = 3.7176 x - 45.764
r = 0.856
0
50
100
150
200
250
300
0 10 20 30 40 50 60 70
TA of HCS ( Degree )
Su
nsp
ot
Nu
mb
er
2001 - 2008 ( qA < 0 ) , CNs : 1972 - 2078
y = 4.1791 x - 113.93
r = 0.778
0
50
100
150
200
250
300
0 10 20 30 40 50 60 70
TA of HCS ( Degree )
Su
nsp
ot
Nu
mb
er
M. A. EL- Borie and A. Hamdy Arab J. Nucl. Sci. Appl, Vol 51, 1, 152-167 (2018)
156
Fig. (2): The TA of HCS versus the strength (B) of the IMF throughout three IMF polarity epochs;
1981-1988 (qA < 0) , 1991-1998 (qA > 0) and 2001-2008 (qA < 0). Carrington rotation
numbers (CNs) are noted for each epoch
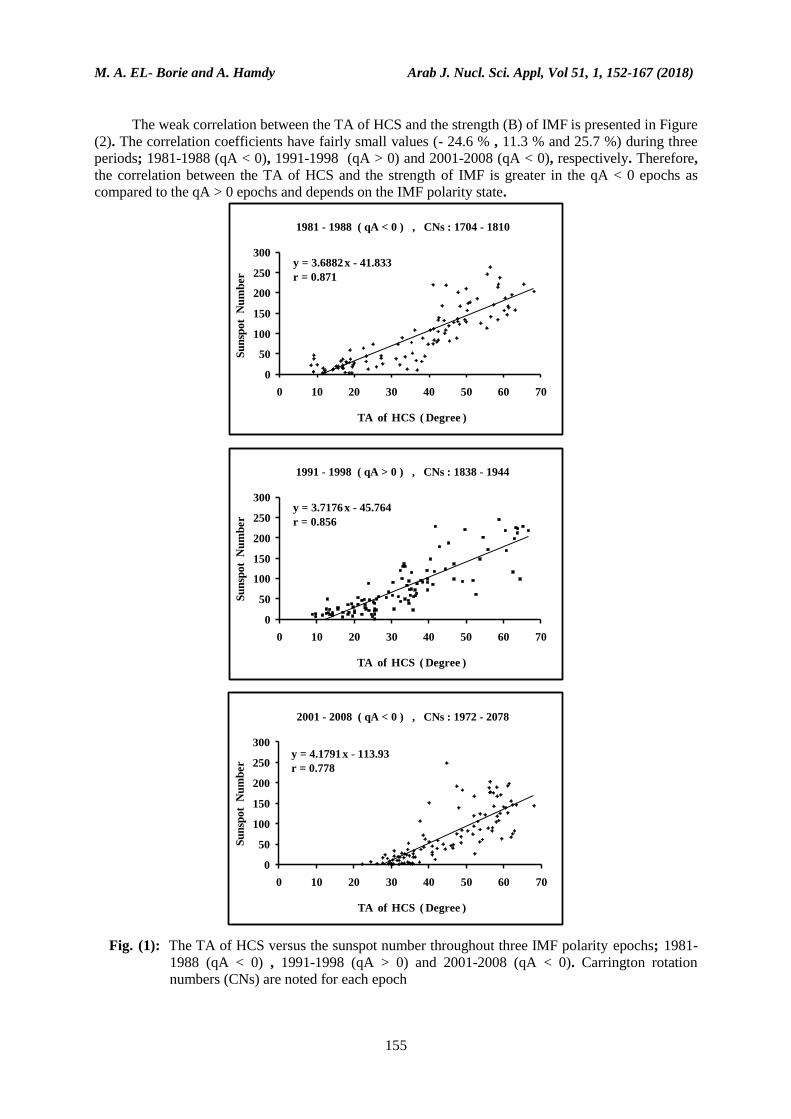
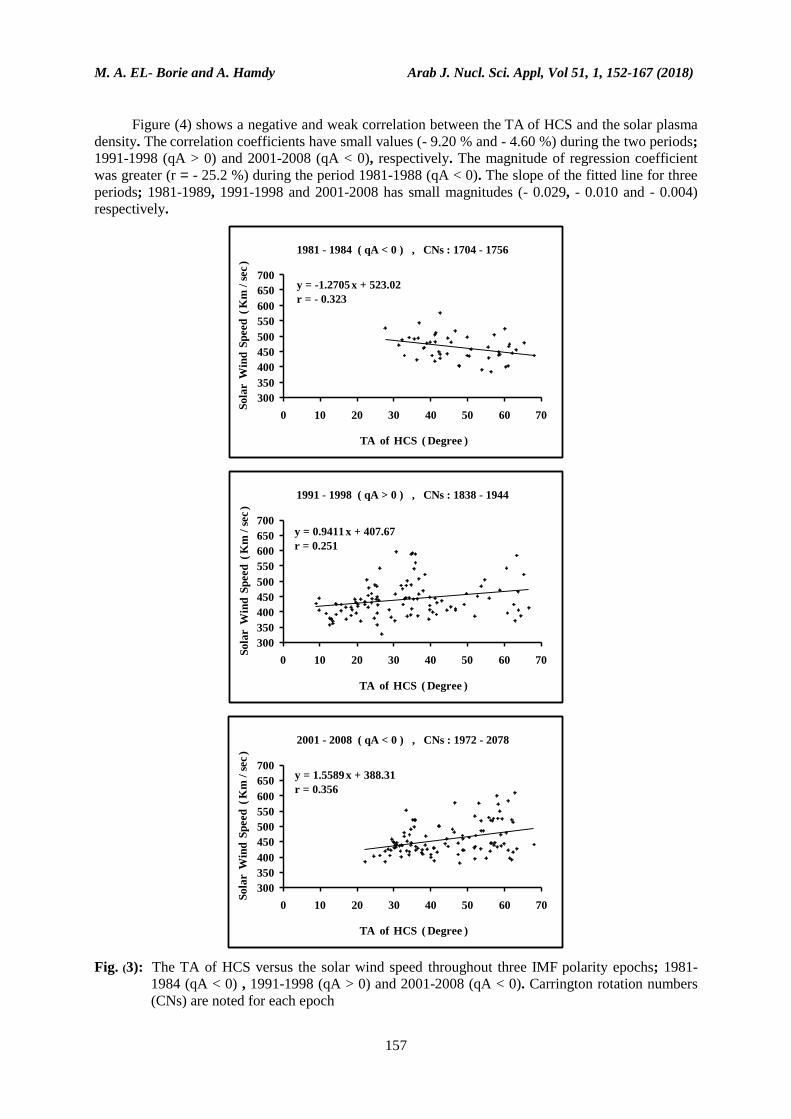
Figure (3) displays a moderate correlation between the TA of HCS and the SWS. Moreover, the
regression coefficients were positives (25.1% and 35.6%) during the two periods; 1991-1998 (qA > 0)
and 2001-2008 (qA < 0), respectively, as well as a negative one (- 32.3 %) in the period 1981-1984
(qA < 0). The slope for the period 2001-2008 ( 1.56) was greater than other periods. Therefore, the
correlation between the TA of HCS and the SWS depends on the IMF polarity state. The SWS
decreased from ( 520 km/sec) to ( 420 km/sec) throughout the descending phase of SAC 21 (1981
- 1984). In addition, the TA of HCS increased from 30o to 60o during the same period (7).
1981 - 1988 ( qA < 0 ) , CNs : 1704 - 1810
y = - 0.0109 x + 1.7693
r = - 0.246
0
1
2
3
4
5
0 10 20 30 40 50 60 70
TA of HCS ( Degree )
B (
n T
)
1991 - 1998 ( qA > 0 ) , CNs : 1838 - 1944
y = 0.0053 x + 1.1014
r = 0.113
0
1
2
3
4
5
0 10 20 30 40 50 60 70
TA of HCS ( Degree )
B (
n T
)
2001 - 2008 ( qA < 0 ) , CNs : 1972 - 2078
y = 0.0098 x + 0.0659
r = 0.257
0
1
2
3
4
5
0 10 20 30 40 50 60 70
TA of HCS ( Degree )
B (
n T
)
M. A. EL- Borie and A. Hamdy Arab J. Nucl. Sci. Appl, Vol 51, 1, 152-167 (2018)
157
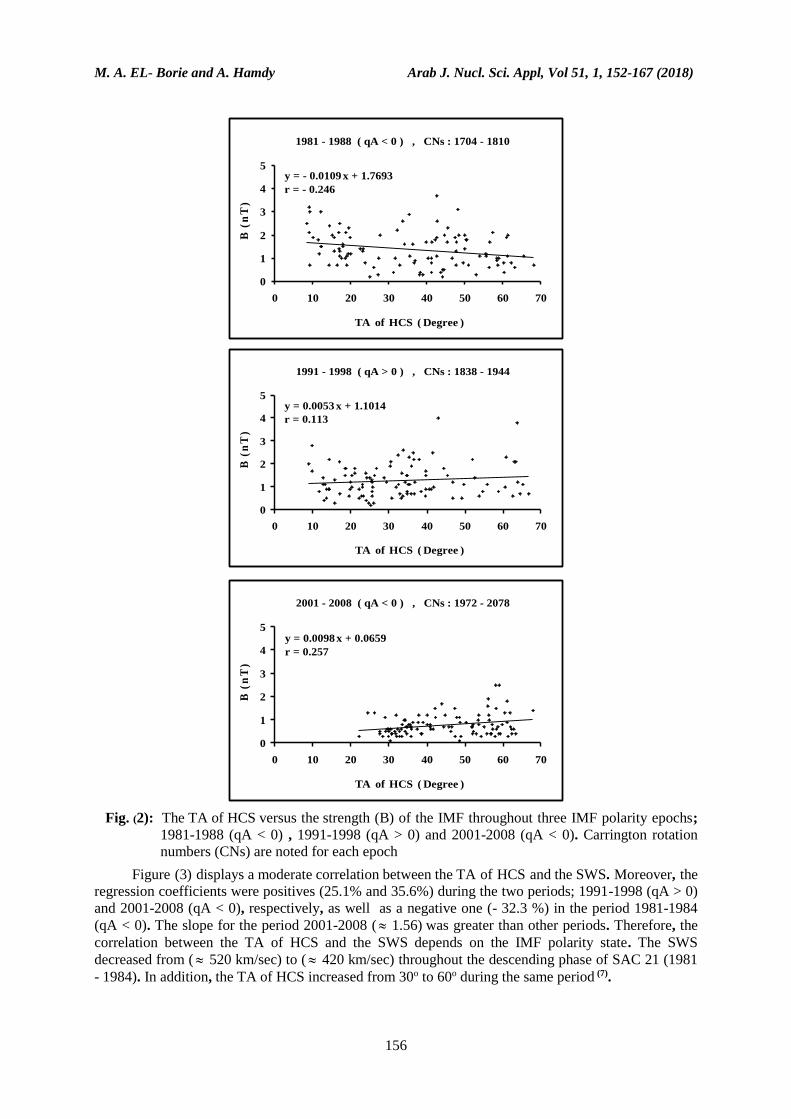
Figure (4) shows a negative and weak correlation between the TA of HCS and the solar plasma
density. The correlation coefficients have small values (- 9.20 % and - 4.60 %) during the two periods;
1991-1998 (qA > 0) and 2001-2008 (qA < 0), respectively. The magnitude of regression coefficient
was greater (r = - 25.2 %) during the period 1981-1988 (qA < 0). The slope of the fitted line for three
periods; 1981-1989, 1991-1998 and 2001-2008 has small magnitudes (- 0.029, - 0.010 and - 0.004)
respectively.
Fig. (3): The TA of HCS versus the solar wind speed throughout three IMF polarity epochs; 1981-
1984 (qA < 0) , 1991-1998 (qA > 0) and 2001-2008 (qA < 0). Carrington rotation numbers
(CNs) are noted for each epoch
1981 - 1984 ( qA < 0 ) , CNs : 1704 - 1756
y = -1.2705 x + 523.02
r = - 0.323
300
350
400
450
500
550
600
650
700
0 10 20 30 40 50 60 70
TA of HCS ( Degree )
So
lar W
ind
Sp
eed
( K
m /
sec
)
1991 - 1998 ( qA > 0 ) , CNs : 1838 - 1944
y = 0.9411 x + 407.67
r = 0.251
300
350
400
450
500
550
600
650
700
0 10 20 30 40 50 60 70
TA of HCS ( Degree )
So
lar W
ind
Sp
eed
( K
m /
sec
)
2001 - 2008 ( qA < 0 ) , CNs : 1972 - 2078
y = 1.5589 x + 388.31
r = 0.356
300
350
400
450
500
550
600
650
700
0 10 20 30 40 50 60 70
TA of HCS ( Degree )
Sola
r W
ind
Sp
eed
( K
m /
sec
)

M. A. EL- Borie and A. Hamdy Arab J. Nucl. Sci. Appl, Vol 51, 1, 152-167 (2018)
158
Fig.(4) The TA of HCS versus the proton density throughout three IMF polarity epochs; 1981-1988
(qA < 0) , 1991-1998 (qA > 0) and 2001-2008 (qA < 0). Carrington rotation numbers (CNs) are noted
for each epoch
1981 - 1988 ( qA < 0 ) , CNs : 1704 - 1810
y = - 0.0295 x + 9.3795
r = - 0.252
0
2
4
6
8
10
12
0 10 20 30 40 50 60 70
TA of HCS ( Degree )
Pro
ton
Den
sity
( c
m -3
)
1991 - 1998 ( qA > 0 ) , CNs : 1838 - 1944
y = - 0.0102 x + 8.7769
r = - 0.092
0
2
4
6
8
10
12
0 10 20 30 40 50 60 70
TA of HCS ( Degree )
Pro
ton
Den
sity
( c
m -3
)
2001 - 2008 ( qA > 0 ) , CNs : 1972 - 2078
y = -0.004 x + 6.0488
r = 0.046
0
2
4
6
8
10
12
0 10 20 30 40 50 60 70
TA of HCS ( Degree )
Proto
n D
en
sity
( c
m -3
)

M. A. EL- Borie and A. Hamdy Arab J. Nucl. Sci. Appl, Vol 51, 1, 152-167 (2018)
159
2 - Correlation between HCS Tilts and CRIs with different rigidities
In this part, the regression analysis between the HCS tilts and cosmic ray intensities CRIs of
different median rigidities (Rm : 16 - 33 GV) has been studied. Scatter plots for the HCS tilts versus
the CRIs have been done. Top plots (4a and 4b) display the sensitivity correlation of the CRIs detected
at Apatity, Hermanus, Tsumeb and Potchefstroom with HCS inclinations for the period 1981-1988 (qA
< 0). The middle plots show the correlation for the period 1991-1998 (qA > 0), while the bottom plots
indicate the correlation for the period 2001-2008 (qA < 0). On the other hand, the slope of straight
line of the best-fit obtained from the regression analysis is considered as a measure for the sensitivity of
CRIs to the observed changes in the HCS tilts. The anatomized periods, Carrington rotation numbers
(CNs), the regression coefficient (r) and the sensitivity ( a ) of CRIs to changes in HCS tilts are noted
in each plot. The average value of r was found to be( - 0.86 and - 0.89) for the two periods 1981-
1988 and 2001-2008, respectively, however in the period 1991-1998, the average value was found to
be(r - 0.76) .
Table (2): The correlations between CRIs of different median rigidities (Rm) with the tilt angles of the
warped HCS throughout the three periods of different IMF polarity states: 1981-1988 (qA
< 0), 1991-1998 (qA > 0) and 2001-2008 (qA < 0), respectively
NM Stations
Median
rigidities
Rm (GV)
Correlation between CRI and TA of HCS
1981- 1988
qA < 0
1991 - 1998
qA > 0
2001 - 2008
qA < 0
Apatity 16 - 0.88 - 0.72 - 0.91
Kiel 18 - 0.88 - 0.87 - 0.91
Hermanus 20 - 0.82 - 0.78 - 0.90
Rome 22 - 0.86 - 0.77 - 0.90
Tbilisi 23 - 0.82 - 0.73 - 0.80
Potchefstroom 25 - 0.88 - 0.74 - 0.91
Tsumeb 27 - 0.85 - 0.74 - 0.91
Huancayo / Haleakala 33 - 0.85 - 0.74 - 0.87

M. A. EL- Borie and A. Hamdy Arab J. Nucl. Sci. Appl, Vol 51, 1, 152-167 (2018)
160
Fig.( 4.a): Scatter plots and best fit lines, between HCS tilts and GCRIs detected at Hermanus NM in
(left panels) and Apatity NM in (right panels) throughout the three periods of the different
IMF polarity states: 1981-1988 (qA < 0), 1991-1998 (qA > 0) and 2001-2008 (qA < 0),
respectively
y = -9.2012x + 4539.9
3500
3750
4000
4250
4500
4750
5000
0 10 20 30 40 50 60 70
TA of HCS ( Degree )
CR
I
( C
ou
nts
/ h
r /
10
0 )
r = - 0.82
a = - 0.203 % / deg
Hermanus NM 1981 - 1988 (CNs: 1704 - 1810)
Ro = 4.44 GV qA < 0
y = -21.371x + 8019.9
6000
6500
7000
7500
8000
8500
9000
0 10 20 30 40 50 60 70
TA of HCS ( Degree )
CR
I
( C
ou
nts
/ h
r /
12
8 )
r = - 0.88
a = - 0.266 % / deg
Apatity NM 1981 - 1988 (CNs: 1704 - 1810)
Ro = 0.57 GV qA < 0
y = -9.4679x + 4565.3
3500
3750
4000
4250
4500
4750
5000
0 10 20 30 40 50 60 70
TA of HCS ( Degree )
CR
I
( C
ou
nts
/ h
r /
10
0 )
r = - 0.78
a = - 0.207 % / deg
Hermanus NM 1991 - 1998 (CNs: 1838 - 1944)
Ro = 4.44 GV qA > 0
y = -23.742x + 8217.1
6000
6500
7000
7500
8000
8500
9000
0 10 20 30 40 50 60 70
TA of HCS ( Degree )
CR
I
( C
ou
nts
/ h
r /
12
8 )
r = - 0.75
a = - 0.289 % / deg
Apatity NM 1991 - 1998 (CNs: 1838 - 1944)
Ro = 0.57 GV qA > 0
y = -14.756x + 4883.6
R2 = 0.82
3500
3750
4000
4250
4500
4750
5000
0 10 20 30 40 50 60 70
TA of HCS ( Degree )
CR
I
( C
ou
nts
/ h
r /
10
0 )
r = - 0.90
a = - 0.302 % / deg
Hermanus NM 2001 - 2008 (CNs: 1972 - 2078)
Ro = 4.44 GV qA < 0
y = -35.317x + 8948.1
6000
6500
7000
7500
8000
8500
9000
0 10 20 30 40 50 60 70
TA of HCS ( Degree )
CR
I
( C
ou
nts
/ h
r /
12
8 )
r = - 0.91
a = - 0.395 % / deg
Apatity NM 2001 - 2008 (CNs: 1972 - 2078)
Ro = 0.57 GV qA < 0

M. A. EL- Borie and A. Hamdy Arab J. Nucl. Sci. Appl, Vol 51, 1, 152-167 (2018)
161
`
Fig. (4b): Scatter plots and best fit lines, between HCS tilts and CRIs detected at Tsumeb NM in (left
panels) and Potchefstroom NM in (right panels) throughout three periods of the different
IMF polarity states: 1981-1988 (qA < 0), 1991-1998 (qA > 0) and 2001-2008 (qA < 0),
respectively. Carrington rotation numbers (CNs) are noted for each epoch
y = -17.599x + 12254
10000
10500
11000
11500
12000
12500
13000
0 10 20 30 40 50 60 70
TA of HCS ( Degree )
CR
I (
Co
un
ts /
hr
/ 1
00
)
r = - 0.85
a = - 0.151 % / deg
Tsumeb NM 1981 - 1988 (CNs: 1704 - 1810)
Ro = 9.12 GV qA < 0
y = -3.5416x + 2119.4
1700
1800
1900
2000
2100
2200
0 10 20 30 40 50 60 70
TA of HCS ( Degree )
CR
I
( C
ou
nts
/ h
r /
10
0 )
r = - 0.88
a = - 0.167 % / deg
Potch NM 1981 - 1988 (CNs: 1704 - 1810)
Ro = 6.98 GV qA < 0
y = -15.568x + 12160
10000
10500
11000
11500
12000
12500
13000
0 10 20 30 40 50 60 70
TA of HCS ( Degree )
CR
I (
Co
un
ts /
hr
/ 1
00
)
r = - 0.74
a = - 0.128 % / deg
Tsumeb NM 1991 - 1998 (CNs: 1838 - 1944)
Ro = 9.12 GV qA > 0
y = -3.4141x + 2118
1600
1700
1800
1900
2000
2100
2200
0 10 20 30 40 50 60 70
TA of HCS ( Degree )
CR
I (
Co
un
ts /
hr
/ 1
00
)
r = - 0.74
a = - 0.161 % / deg
Potch NM 1991 - 1998 (CNs: 1838 - 1944)
Ro = 6.98 GV qA > 0
y = -24.424x + 12762
10000
10500
11000
11500
12000
12500
13000
0 10 20 30 40 50 60 70
TA of HCS ( Degree )
CR
I (
Co
un
ts /
hr
/ 1
00
)
r = - 0.91
a = - 0.191 % / deg
Tsumeb NM 2001 - 2008 (CNs: 1972 - 2078)
Ro = 9.12 GV qA < 0
y = -5.5053x + 2256.4
1600
1700
1800
1900
2000
2100
2200
0 10 20 30 40 50 60 70
TA of HCS ( Degree )
CR
I (
Co
un
ts /
hr
/ 1
00
)
r = - 0.91
a = - 0.244 % / deg
Potch NM 2001 - 2008 (CNs: 1972 - 2078)
Ro = 6.98 GV qA < 0

M. A. EL- Borie and A. Hamdy Arab J. Nucl. Sci. Appl, Vol 51, 1, 152-167 (2018)
162
3 - Particle Rigidities - HCS Tilts dependence during different IMF polarities (qA > 0 and
qA < 0)
High sensitivity of CRI to changes in the TA of HCS is observed during qA < 0 epochs as
compared to qA > 0 epochs (18). This sensitivity is rigidity-dependent and follows the power-type law.
The slope of the regression line is a measure of the sensitivity of CRIs to changes in the HCS tilts.
Table (3) shows the sensitivities CRIs of different median rigidities (Rm) to the HCS inclinations. The
value of Rm ranges from 16 GV for Apatity to 33 GV for Huancayo / Haleakala NMs.
Table (3): The sensitivities (% / deg) of CRIs of different median rigidities (Rm) to the tilt angles of
HCS throughout the three periods of different IMF polarity states: 1981-1988 (qA < 0),
1991-1998 (qA > 0) and 2001-2008 (qA < 0), respectively
Figure (5) displays the sensitivity of CRIs to the HCS tilt angles (TA 70°) versus the
median response rigidities (Rm). Plots show the power fit for the measurements during three considered
epochs gave ( R-1.00 , R-1.36 and R-1.49 ), respectively. The present results are in consistence with the drift
model of cosmic rays and indicated the spectra of particles drift were harder after the reversals of the
IMF polarity state in 1999/2000 than that before the reversal. Therefore, the reversal of IMF polarity
state from (qA > 0) to (qA < 0) has a great effect on the rigidity-tilts dependence.
a = 4.04 R
-
1.00
0.0
0.1
0.2
0.3
0.4
14 16 18 20 22 24 26 28 30 32 34
Median Rigidity ( GV )
Slo
pe
Of
Reg
ress
ion
Lin
e (
% /
deg
)
1981 - 1988 (qA < 0) , CNs : 1704 -1704 )
NM Stations
Median
rigidities
Rm (GV)
Sensitivities of CRIs to HCS Tilts (% / deg)
1981- 1988
qA < 0
1991 - 1998
qA > 0
2001 - 2008
qA < 0
Apatity 16 - 0.266 - 0.289 - 0.395
Kiel 18 - 0.242 - 0.253 - 0.343
Hermanus 20 - 0.203 - 0.207 - 0.302
Rome 22 - 0.153 - 0.179 - 0.216
Tbilisi 23 - 0.185 - 0.175 - 0.175
Potchefstroom 25 - 0.167 - 0.161 - 0.244
Tsumeb 27 - 0.144 - 0.127 - 0.191
Huancayo / Haleakala 33 - 0.134 - 0.114 - 0.131

M. A. EL- Borie and A. Hamdy Arab J. Nucl. Sci. Appl, Vol 51, 1, 152-167 (2018)
163
Fig. (5): The sensitivities of CRIs with different Rm to HCS tilts throughout the three periods of
different IMF polarity states: 1981-1988 (qA < 0), 1991-1998 (qA > 0) and 2001-2008 (qA <
0), respectively
The sensitivity of CRs to the HCS tilts increased for particles of low energy and the rate of
increasing is more effective in qA < 0 epoch. This confirms that the modulation for lower energy
particles (Rm < 22 GV) is more pronounced during qA < 0 epoch than that of qA > 0.
To study the variations of energy spectrum of CRIs caused by the change in HCS tilts, the tilts
of HCS have been divided into three groups based on the computed HCS tilts (the mean ). Group I
(low tilt angles; 0° < TA ≤ 30°), group II (medium tilts; 30° < TA ≤ 50°) and group III (high tilts; 50°
< TA ≤ 70°). Group I is consistent with the years of minimum solar activity, group II is in agreement
with the times of ascending and descending phases of the solar activity cycles, and group III refers to
the time near solar maximum activity. Figures (6) & (7) display the sensitivities of CRIs to the HCS
tilts versus the median particle rigidities for different IMF polarity epochs; 1991-1998 (qA > 0) and
2001-2008 (qA < 0). Top, middle and bottom panels of Figure (6) refer to (0° < TA ≤ 30°), (30° < TA
≤ 50°) and (50° < TA ≤ 70°), respectively. The obtained results indicate the following notes:
1) The top panel of Figure (6) shows that the power fit for periods of minimum solar activities during
qA > 0 and qA < 0 indicated R-1.81 and R-0.74, respectively. The rate of sensitivities of CRIs to the
HCS tilts for group I during qA > 0 minimum solar years 1991-1994 (CNs: 1884-1931) was higher
than that during qA < 0 minimum solar years 2007-2008 (CNs: 2052-2078). The spectrum
variation became softer after the reversal of IMF polarity state in 1999/2000.
a = 12.28 R
-
1.36
0.0
0.1
0.2
0.3
0.4
14 16 18 20 22 24 26 28 30 32 34
Median Rigidity ( GV )
Slo
pe
Of
Reg
ress
ion
Lin
e (
% /
deg
)
1991 - 1998 (qA > 0) , CNs : 1838 - 1944
a = 24.08 R
-
1.49
0.0
0.1
0.2
0.3
0.4
0.5
14 16 18 20 22 24 26 28 30 32 34
Median Rigidity ( GV )
Slo
pe
Of
Reg
ress
ion
Lin
e (
% /
deg
)
2001 - 2008 (qA < 0) , CNs : 1972 - 2078

M. A. EL- Borie and A. Hamdy Arab J. Nucl. Sci. Appl, Vol 51, 1, 152-167 (2018)
164
2) The middle panel of Figure (6) shows that during the ascending and descending years of solar
activity, the rigidity changes for qA > 0 and qA < 0 epochs giving R-1.43 and R-1.55, respectively.
The rate of sensitivities of CRIs to HCS tilts for group II during the qA > 0 epoch was a little
smaller than that during the qA < 0 epoch. The spectrum variation became a little harder after the
reversal of IMF polarity state in 1999/2000.
3) The bottom panel of Figure (6) displays the periods of high solar activity, the power fit for qA > 0
and qA < 0 gave R-1.12 and R-0.21, respectively. These results confirm that there are variances in
energy spectrum for group III between qA > 0 and qA < 0 epochs.
Fig. (6): The sensitivities of CRIs with different Rm to HCS tilts throughout IMF polarity states;
1981-1988 (qA < 0) and 1991-1998 (qA > 0). The top, middle and bottom panels refer to (0°
< TA ≤ 30°), (30° < TA ≤ 50°) and (50° < TA ≤ 70°), respectively
a = 17.78 R -1.81
a = 1.80 R -0.74
0.0
0.1
0.2
0.3
0.4
0.5
15 16 17 18 19 20 21 22 23 24 25 26 27 28Slo
pe
Of
Reg
ress
ion
Lin
e (
% /
deg
)
Median Rigidity ( GV )
1991-1998 (qA > 0) 2001-2008 (qA < 0) , 0 < TA ≤ 30
2001-2008 (qA < 0)
1991-1998 (qA > 0)
a = 12.25 R -1.43
a = 40.22 R -1.55
0.0
0.1
0.2
0.3
0.4
0.5
0.6
0.7
15 16 17 18 19 20 21 22 23 24 25 26 27 28Slop
e O
f R
egre
ssio
n L
ine
( %
/ de
g )
Median Rigidity ( GV )
1991-1998 (qA > 0) 2001-2008 (qA < 0) , 30 < TA ≤ 50
2001-2008 (qA < 0)
1991-1998 (qA > 0)
a = 0.24 R -0.21
a = 9.15 R -1.12
0.0
0.1
0.2
0.3
0.4
0.5
0.6
15 16 17 18 19 20 21 22 23 24 25 26 27 28Slop
e O
f R
egre
ssio
n L
ine
( %
/ de
g )
Median Rigidity ( GV )
1991-1998 (qA > 0) 2001-2008 (qA < 0) , 50 < TA ≤ 70
2001-2008 (qA < 0)
1991-1998 (qA > 0)
M. A. EL- Borie and A. Hamdy Arab J. Nucl. Sci. Appl, Vol 51, 1, 152-167 (2018)
165
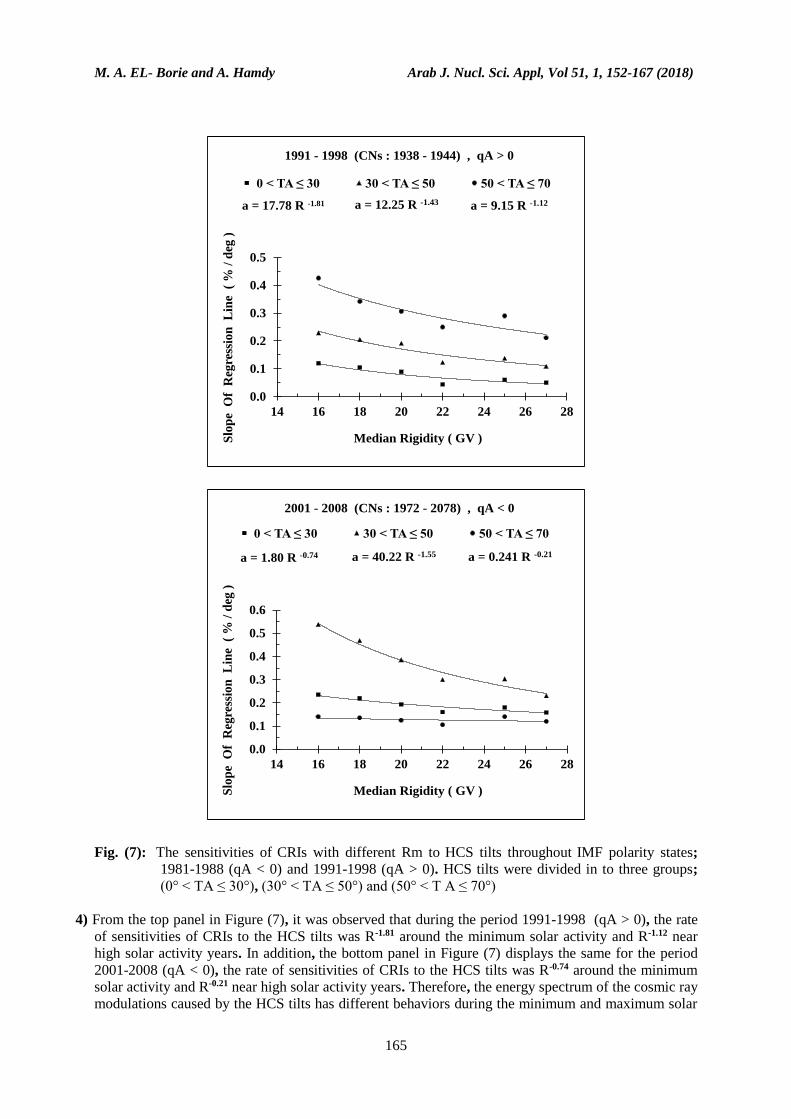
Fig. (7): The sensitivities of CRIs with different Rm to HCS tilts throughout IMF polarity states;
1981-1988 (qA < 0) and 1991-1998 (qA > 0). HCS tilts were divided in to three groups;
(0° < TA ≤ 30°), (30° < TA ≤ 50°) and (50° < T A ≤ 70°)
4) From the top panel in Figure (7), it was observed that during the period 1991-1998 (qA > 0), the rate
of sensitivities of CRIs to the HCS tilts was R-1.81 around the minimum solar activity and R-1.12 near
high solar activity years. In addition, the bottom panel in Figure (7) displays the same for the period
2001-2008 (qA < 0), the rate of sensitivities of CRIs to the HCS tilts was R-0.74 around the minimum
solar activity and R-0.21 near high solar activity years. Therefore, the energy spectrum of the cosmic ray
modulations caused by the HCS tilts has different behaviors during the minimum and maximum solar
a = 17.78 R -1.81 a = 12.25 R -1.43 a = 9.15 R -1.12
0.0
0.1
0.2
0.3
0.4
0.5
14 16 18 20 22 24 26 28
Slo
pe
Of
Reg
ress
ion
L
ine
( %
/ d
eg )
Median Rigidity ( GV )
0 < TA ≤ 30 30 < TA ≤ 50 50 < TA ≤ 70
1991 - 1998 (CNs : 1938 - 1944) , qA > 0
a = 1.80 R -0.74 a = 40.22 R -1.55 a = 0.241 R -0.21
0.0
0.1
0.2
0.3
0.4
0.5
0.6
14 16 18 20 22 24 26 28
Slo
pe
Of
Reg
ress
ion
L
ine
( %
/ d
eg )
Median Rigidity ( GV )
0 < TA ≤ 30 30 < TA ≤ 50 50 < TA ≤ 70
2001- 2008 ( CNs: 1972 - 2078) , qA < 02001 - 2008 (CNs : 1972 - 2078) , qA < 0
M. A. EL- Borie and A. Hamdy Arab J. Nucl. Sci. Appl, Vol 51, 1, 152-167 (2018)
166
activity periods. The rate of sensitivity/modulation of CRIs to the HCS tilts is higher throughout the
minimum solar activity years as compared to the maximum solar activity period.
CONCLUSIONS
It is well known that the polarity state of interplanetary magnetic field (IMF) changes during the
maximum phase of the solar activity cycle. We have omitted these years from our study because there
is no regular pattern can describe the complex structure of HCS around the years of IMF polarity
reversal.
In the present work, the linear correlations between tilt angle (TA) of the HCS and cosmic ray
intensity (CRI), strength (B) of the IMF, sunspot number (SSN), solar plasma speed (SWS) and
density (n) have been studied before and after the reversals of IMF polarity state. The sensitivities of
CRIs (Rm : 16 - 33 GV) to the tilts of HCS have been studied throughout three geomagnetic epochs:
1981-1988 (qA < 0) , 1991-1998 (qA > 0) and 2001-2008 (qA < 0). The obtained results display the
following:
1) The strength of IMF is much stronger during the minimum period of solar activity cycle than that
during the maximum period. The correlation between the TA of HCS and the strength of IMF is
greater during the qA < 0 epochs than that of the qA > 0 epochs.
2) There is a highly positive correlation between the TA of HCS and the sunspot number and it is
independent on the polarity state of the IMF. In addition, the TA of HCS changes systematically
over the solar activity cycles.
3) A moderate correlation between the TA of HCS and the solar wind speed (SWS) is observed while
a weak and negative correlation between the TA of HCS and solar plasma density (n) is noted
during the qA < 0 and qA > 0 epochs.
4) There is a highly negative correlation between the inclinations of HCS and the CRIs. The negative
correlation between the CRIs and the HCS tilts is more pronounced during the qA < 0 epochs as
compared to the qA > 0 epochs.
5) The sensitivity of CRI to changes in the TA of HCS is rigidity-dependent which follows the power-
type law. The power fitted of sensitivities throughout the three periods 1981-1988 , 1991-1998 and
2001-2008 gave R-1.01 , R-1.39and R-1.62, respectively.
6) The spectra of particles drift are harder after the reversal of IMF polarity state than before. In
addition, the modulation for lower energy particles is more pronounced during qA < 0 epochs than
that during qA > 0 epochs.
7) The rate of sensitivity/modulation of CRIs to the HCS inclinations is higher throughout the
minimum solar activity years as compared to the maximum solar activity period.
ACKNOWLEDGMENTS
The authors would like to thank Prof. Abdelallah Abdelsalam , Physics Department - Faculty of
Science - Cairo University, for his continuous support, suggestions, comments and discussions
throughout the present work.
REFERENCES
(1) J. R. Jokipi and J. Kota, ApJ. 265, 573 (1983).
(2) M.A. El-Borie, Astroparticle phys. 16, 169-180 (2001).
(3) M. Gupta et. al., Indian J.of Radio and Space Phy. 35, 387-395 (2006).
(4) Badruddin, M. Singh and Y. P Singh, Astron. Astrophys. 466, 697-704 (2007).

M. A. EL- Borie and A. Hamdy Arab J. Nucl. Sci. Appl, Vol 51, 1, 152-167 (2018)
167
(5) E. Paouris et. al., Solar Phys. 280, 255- 271 (2012)
(6) O. P. M. Aslam and Badruddin, Solar Phys. 279, 269-288 (2012)
(7) M.A. El-Borie, Astroparticle Phys. 10, 165-174 (1999)
(8) M. Gupta, S. R. Narang, V. K. Mishra, A. P. Mishra, IGETMAS 2, 104-115 (2014)
(9) H.S. Ahluwalia, Adv. Space Res. 52, 2112-2118 (2013).
(10) E.W. Cliver, A.G. Ling, Astrophys.J. Lett. 551, L189-L192 (2001).
(11) E. Asvestari and I.G. Usoskin, J. Space Weather Space Clim. 6, A15 (2016).
(12) N. Saito and D. B. Swinson, J. Geophys. Res. 91, 4536 (1986).
(13) K.A. Kovalenko, Planet Space Sci. 36, 1343-1358 (1988).
(14) J. T. Steinberg and A. Lazarus, Geophys Res., Lett. 23, 1183-1186 (1996)
(15) N. A. Lotova et. al., Solar Phys. 205, 149-163 (2002)
(16) L. K. Jian, C. T. Russell and J. G Luhmann, Solar Phys. 274, 321-344 (2011).
(17) E. W.Cliver, I. G. Richardson and A. G. Ling, Space Sci. Rev. 176, 3-19 (2011).
(18) J. R. Jokipi and Kota J., ApJ. 265, 573 (1983).
(19) M. S. Potgieter, R. A. Burger, S. E. S Ferreira, Space Sci. Rev. 97, 295 (2001).
(20) M. Zhang, Adv. Space. Res. 32, 603 (2003)
(21) A. Kilcik et. al., Astrophysical J., 731, 30 (2011).
(22) U. Pandey et. al., Advances in Physics Theories and Applications 22, 10 (2013).
(23) U. Feldman and E.Landi, J. Geophys. Res. 110A 7, A07109.1-A07109.12 (2005).
(24) M.A. El-Borie, E. Shafik, A. A. Abdel-Halim and S. Y. El-Monier., IJRRAS, 6, 296-301
(2011).