Embed Size (px)
Citation preview
Audited annual report
BSI-MultinvestInvestment Company with variable Capital under Luxembourg Law(Société d’Investissement à Capital Variable, SICAV)
R.C.S. Luxembourg N° B 74 740
BSI-Multinvest – Absoluta DailyBSI-Multinvest – Alternative UCITSBSI-Multinvest – Asian StocksBSI-Multinvest – Bonds CHF*BSI-Multinvest – Bonds EUR**BSI-Multinvest – Bonds USD***BSI-Multinvest – Cash CHFBSI-Multinvest – Cash EURBSI-Multinvest – Cash USDBSI-Multinvest – Emerging Markets Bonds BSI-Multinvest – Global Credit BondBSI-Multinvest – Global Dynamic BondsBSI-Multinvest – Global ThemesBSI-Multinvest – Short Term Bonds CHFBSI-Multinvest – Short Term Bonds EURBSI-Multinvest – Short Term Bonds USDBSI-Multinvest – Strategy Balanced (CHF)BSI-Multinvest – Strategy Balanced (EUR)BSI-Multinvest – Strategy Income (CHF)BSI-Multinvest – Strategy Income (EUR)BSI-Multinvest – Swiss StocksBSI-Multinvest – US Stocks* formerly BSI-Multinvest – Long Term Bonds CHF** formerly BSI-Multinvest – Long Term Bonds EUR*** formerly BSI-Multinvest – Long Term Bonds USD
AS OF 31.12.2013

1
Audited annual report as of 31 December 2013
Table of contents Page ISIN
Management and Administration 2Features of the Company 4Independent auditor’s report 6
BSI-Multinvest 7BSI-Multinvest – Absoluta Daily 9 A/ LU0585206831 A (CHF hedged)/ LU0585207052 A (USD hedged)/ LU0585207219 L (USD hedged)/ LU0811552834BSI-Multinvest – Alternative UCITS 14 A/ LU0527840770BSI-Multinvest – Asian Stocks 18 A/ LU0117786821 I/ LU0184285475 A (EUR hedged)/ LU0585204034 A (CHF hedged)/ LU0585204208BSI-Multinvest – Bonds CHF* 27 A/ LU0585205783BSI-Multinvest – Bonds EUR** 33 A/ LU0585205197BSI-Multinvest – Bonds USD*** 38 A/ LU0585205510BSI-Multinvest – Cash CHF 43 A/ LU0585204893BSI-Multinvest – Cash EUR 49 A/ LU0585204463BSI-Multinvest – Cash USD 53 A/ LU0585204547BSI-Multinvest – Emerging Markets Bonds 59 A/ LU0978652567 A (EUR hedged)/ LU0978652997BSI-Multinvest – Global Credit Bond 64 A/ LU0879655545 A (CHF hedged)/ LU0879656436 A (USD hedged)/ LU0879657327BSI-Multinvest – Global Dynamic Bonds 73 A/ LU0585205940 A (CHF hedged)/ LU0585206328 A (USD hedged)/ LU0585206674BSI-Multinvest – Global Themes 82 A/ LU0528983660 A (EUR hedged)/ LU0694240408 A (CHF hedged)/ LU0694240580BSI-Multinvest – Short Term Bonds CHF 86 A/ LU0148516585BSI-Multinvest – Short Term Bonds EUR 92 A/ LU0148517047BSI-Multinvest – Short Term Bonds USD 98 A/ LU0148517476BSI-Multinvest – Strategy Balanced (CHF) 104 A/ LU0394160690BSI-Multinvest – Strategy Balanced (EUR) 110 A/ LU0394160260 A (USD hedged)/ LU0978652724BSI-Multinvest – Strategy Income (CHF) 116 A/ LU0394159767BSI-Multinvest – Strategy Income (EUR) 122 A/ LU0394160005BSI-Multinvest – Swiss Stocks 128 A/ LU0153576656 I/ LU0585235699BSI-Multinvest – US Stocks 133 A/ LU0153576730
Notes to the Financial Statements 137Global Exposure (unaudited) 146
* formerly BSI-Multinvest – Long Term Bonds CHF** formerly BSI-Multinvest – Long Term Bonds EUR*** formerly BSI-Multinvest – Long Term Bonds USD
Sales restrictions
UNITED STATES OF AMERICA – The shares have not been registered under the provisions of the United States Securities Act of 1933; they may not therefore either be offered for sale or sold in anyway in the United States of America or in any of its territories or possessions; nor may they be offered for sale or sold to nationals of the United States of America or for their benefit.
Internet address
www.bsibank.com
2
Management and Administration
Registered Office33A, avenue J.F. Kennedy,L-1855 LuxembourgR.C.S. Luxembourg N° B 74 740
Board of DirectorsStefano Ambrogi, ChairmanSenior Vice President, BSI AG,Lugano, Switzerland
Andrea Fincato, MemberFirst Vice President, BSI AG, Lugano, Switzerland
Carlo Cavazzoni, MemberSenior Vice President, Generali Investments Italy,Milan, Italy
Nicola Battalora, Member (until 6 May 2013)Senior Executive Vice President, BSI S.A.Lugano, Switzerland
Pierre-Antoine Boulat, MemberChief Executive Officer, UBS Fund Services(Luxembourg) SA, Luxembourg
Simona Bortolazzi, Member (since 6 May 2013)Vice President, BSI Europe SA,Luxembourg
Portfolio ManagerBSI-Multinvest – Absoluta DailyBSI-Multinvest – Asian StocksBSI-Multinvest – Bonds CHF*BSI-Multinvest – Bonds EUR**BSI-Multinvest – Bonds USD***BSI-Multinvest – Cash CHFBSI-Multinvest – Cash EURBSI-Multinvest – Cash USDBSI-Multinvest – Emerging Markets Bonds BSI-Multinvest – Global Credit BondBSI-Multinvest – Global Dynamic BondsBSI-Multinvest – Global ThemesBSI-Multinvest – Short Term Bonds CHFBSI-Multinvest – Short Term Bonds EURBSI-Multinvest – Short Term Bonds USDBSI-Multinvest – Strategy Balanced (CHF)BSI-Multinvest – Strategy Balanced (EUR)BSI-Multinvest – Strategy Income (CHF)* formerly BSI-Multinvest – Long Term Bonds CHF** formerly BSI-Multinvest – Long Term Bonds EUR*** formerly BSI-Multinvest – Long Term Bonds USD
BSI-Multinvest – Strategy Income (EUR)BSI-Multinvest – Swiss StocksBSI-Multinvest – US StocksBSI AG, Via Magatti 2, CH-6901 Lugano
BSI-Multinvest – Alternative UCITSThalìa SA, Via Trevano 2a, CH-6900 Lugano
Custodian Bank and Paying agentUBS (Luxembourg) S.A.,33A, avenue J.F. Kennedy,L-1855 Luxembourg
Domiciliation, Administrative and Transfer AgentUBS Fund Services (Luxembourg) S.A.,33A, avenue J.F. Kennedy,L-1855 Luxembourg
Independent Auditor of the CompanyErnst & Young S.A.,7, Rue Gabriel Lippmann, Parc d’Activité Syrdall 2,L-5365 Munsbach
Sale in SwitzerlandRepresentative and Paying agentBSI AG,Via Magatti 2, CH-6901 Lugano
All subfunds are registered in Switzerland with the exception of BSI-Multinvest – Global Credit Bondand BSI-Multinvest – Emerging Markets Bonds.
Sale in Singapore** Restricted foreign schemeThe shares of the subfundsBSI-Multinvest – Absoluta DailyBSI-Multinvest – Asian StocksBSI-Multinvest – Bonds CHF*BSI-Multinvest – Bonds EUR**BSI-Multinvest – Bonds USD***BSI-Multinvest – Cash CHFBSI-Multinvest – Cash EURBSI-Multinvest – Cash USDBSI-Multinvest – Emerging Markets BondsBSI-Multinvest – Global Credit BondBSI-Multinvest – Global Dynamic Bonds* formerly BSI-Multinvest – Long Term Bonds CHF** formerly BSI-Multinvest – Long Term Bonds EUR*** formerly BSI-Multinvest – Long Term Bonds USD
Annual Report as of 31 December 2013 BSI-Multinvest
3
BSI-Multinvest – Global ThemesBSI-Multinvest – Short Term Bonds CHFBSI-Multinvest – Short Term Bonds EURBSI-Multinvest – Short Term Bonds USDBSI-Multinvest – Strategy Balanced (EUR)BSI-Multinvest – Strategy Income (CHF)BSI-Multinvest – Strategy Income (EUR)BSI-Multinvest – Swiss StocksBSI-Multinvest – US Stocksmay be sold in this country.
The sales prospectus, the KIID, the articles of association of the Company, the annual and semi-annual reports as well as the port-folio movements of the Company mentioned in this publication are available free of charge from UBS Fund Services (Luxembourg) S.A., 33A, avenue J.F. Kennedy, L-1855 Luxembourg, BSI AG, and at Via Magatti 2, CH-6901 Lugano.
Annual Report as of 31 December 2013 BSI-Multinvest
4
Features of the Company
BSI-Multinvest (hereafter “the Company”) is an invest-ment company qualifying as a self-managed “société d’investissement à capital variable, SICAV” which was established for an indefinite period of time on 21 March 2000 in the form of a joint-stock company under Luxembourg law, in accordance with the provisions of the law on Trading Companies of 10 August 1915 including subsequent amendments and addenda, and of Part I of the law 17 December 2010 (the “2010 Law”), as amended.
The articles of association have been published for the first time in the Mémorial C, Recueil Spécial des sociétés et associations (“Mémorial”) dated 4 May 2000. Following an extraordinary general meeting of the shareholders held on 20 July 2012, the articles of asso-ciation of the Company were amended in order to have the Company regulated by Part I of the 2010 Law. Any interested person may inspect and obtain a copy of the coordinated articles of association at the Register of Trade and Companies of Luxembourg in Luxembourg.
In accordance with the articles of association, shares may be issued in various subfunds of the Company’s assets at the Board of Directors’ discretion. Separate portfolios of assets are constituted for each subfund and invested in keeping with the investment objectives of the subfund concerned. The Company has therefore been established as an umbrella fund and allows the investor to choose between different investment objec-tives and to invest accordingly in one or more of the subfunds constituting the Company’s assets.
The share capital corresponds at all times to the aggre-gate value of the net assets of all the subfunds.
The Board of Directors may decide at any time that the Company will issue shares in further subfunds.
As at 31 December 2013 the following subfunds are active:
BSI-Multinvest – Absoluta DailyBSI-Multinvest – Alternative UCITSBSI-Multinvest – Asian StocksBSI-Multinvest – Bonds CHF*BSI-Multinvest – Bonds EUR**BSI-Multinvest – Bonds USD***BSI-Multinvest – Cash CHFBSI-Multinvest – Cash EURBSI-Multinvest – Cash USDBSI-Multinvest – Emerging Markets Bonds * formerly BSI-Multinvest – Long Term Bonds CHF** formerly BSI-Multinvest – Long Term Bonds EUR*** formerly BSI-Multinvest – Long Term Bonds USD
BSI-Multinvest – Global Credit BondBSI-Multinvest – Global Dynamic BondsBSI-Multinvest – Global ThemesBSI-Multinvest – Short Term Bonds CHFBSI-Multinvest – Short Term Bonds EURBSI-Multinvest – Short Term Bonds USDBSI-Multinvest – Strategy Balanced (CHF)BSI-Multinvest – Strategy Balanced (EUR)BSI-Multinvest – Strategy Income (CHF)BSI-Multinvest – Strategy Income (EUR)BSI-Multinvest – Swiss StocksBSI-Multinvest – US Stocks
When launching the above-listed subfunds and new subfunds, the sales prospectus shall be supplemented in the necessary manner with detailed information about the new subfunds.
The Board of Directors reserves the right to issue various classes of shares for each subfund. These may differ from one another, particularly in respect of dividend policy and commission structure.
Currently, the following share classes are offered: – Shares of “Class A” which are capitalizing shares dedicated to retail investors.
– Shares of “Class L” which are capitalizing shares dedicated to retail investors with a minimum subscription amount and holding amount as indicated in the investment objectives and policy of each individual subfund.
– Shares of “Class I” which are capitalizing shares dedicated to institutional investors as defined from time to time by the competent Supervisory Authority in Luxembourg.
– “Hedged” shares of “Class A” hedge the foreign currency exposure of the respective subfunds against their respective reference currency. Under normal circumstances the hedge ratio will be between 90% and 110% of the share classes’ NAV. Changes in underlying securities prices and/or large subscription redemptions in a particular share class can result in a hedge ratio that is momentarily out of the limits defined above.
The financial year of the Company ends on the last day of December.
The annual general meeting of shareholders is held in Luxembourg at the venue indicated in the notice of meeting, on the first Monday in the month of May at 2:00 p.m. If this day is a public or bank holiday in Luxembourg, the annual general meeting of share-holders will be held on the next banking day.
Annual Report as of 31 December 2013 BSI-Multinvest
5
No person is authorized to supply any information other than the information contained in the sales prospectus and in the documents mentioned therein.
The annual and semi-annual reports are available free of charge to shareholders at the registered office of the Company and of the Custodian Bank.
No subscription may be accepted on the basis of the financial reports. Subscriptions are accepted only on the basis of the current sales prospectus accompanied by the latest annual report and the latest semi-annual report if available.
Annual Report as of 31 December 2013 BSI-Multinvest
6
Independent auditor’s report
To the Shareholders of
BSI-Multinvest33A, avenue J.F. Kennedy,L-1855 Luxembourg
We have audited the accompanying financial statements of BSI-Multinvest and of each of its subfunds, which comprise the statement of net assets and the statement of investments in securities and other net assets as at 31 December 2013 and the statement of operations and the statement of changes in net assets for the year then ended and a summary of significant accounting policies and other explanatory notes to the financial statements.
Responsibility of the Board of Directors of the SICAV for the financial statements
The Board of Directors of the SICAV is responsible for the preparation and fair presentation of these financial statements in accordance with Luxembourg legal and regulatory requirements relating to the preparation and presentation of the financial statements and for such internal control as the Board of Directors of the SICAV determines is necessary to enable the preparation and presentation of financial statements that are free from material misstatement, whether due to fraud or error.
Responsibility of the “Réviseur d’entreprises agréé”
Our responsibility is to express an opinion on these financial statements based on our audit. We conducted our audit in accordance with International Standards on Auditing as adopted for Luxembourg by the “Commis-sion de Surveillance du Secteur Financier”. Those stan-dards require that we comply with ethical requirements and plan and perform the audit to obtain reasonable assurance whether the financial statements are free from material misstatement.
An audit involves performing procedures to obtain audit evidence about the amounts and disclosures in the financial statements. The procedures selected depend on the judgement of the “Réviseur d’entreprises agréé”, including the assessment of the risks of material mis-statement of the financial statements, whether due to fraud or error. In making those risk assessments, the “Réviseur d’entreprises agréé” considers internal control
relevant to the entity’s preparation and fair presentation of the financial statements in order to design audit pro-cedures that are appropriate in the circumstances, but not for the purpose of expressing an opinion on the effectiveness of the entity’s internal control.
An audit also includes evaluating the appropriateness of accounting policies used and the reasonableness of accounting estimates made by the Board of Directors of the SICAV, as well as evaluating the overall presen-tation of the financial statements.
We believe that the audit evidence we have obtained is sufficient and appropriate to provide a basis for our audit opinion.
Opinion
In our opinion, the financial statements give a true and fair view of the financial position of BSI-Multinvest and of each of its subfunds as of 31 December 2013, and of the results of their operations and changes in their net assets for the year then ended in accordance with the Luxembourg legal and regulatory requirements relating to the preparation and presentation of the financial statements.
Other matter
Supplementary information included in the annual report has been reviewed in the context of our man-date but has not been subject to specific audit pro-cedures carried out in accordance with the standards described above. Consequently, we express no opinion on such information. However, we have no observation to make concerning such information in the context of the financial statements taken as a whole.
Luxembourg, 8 April 2014
Ernst & YoungSociété AnonymeCabinet de révision agréé
Isabelle Nicks
Annual Report as of 31 December 2013 BSI-Multinvest
7The notes are an integral part of the financial statements.
Annual Report as of 31 December 2013
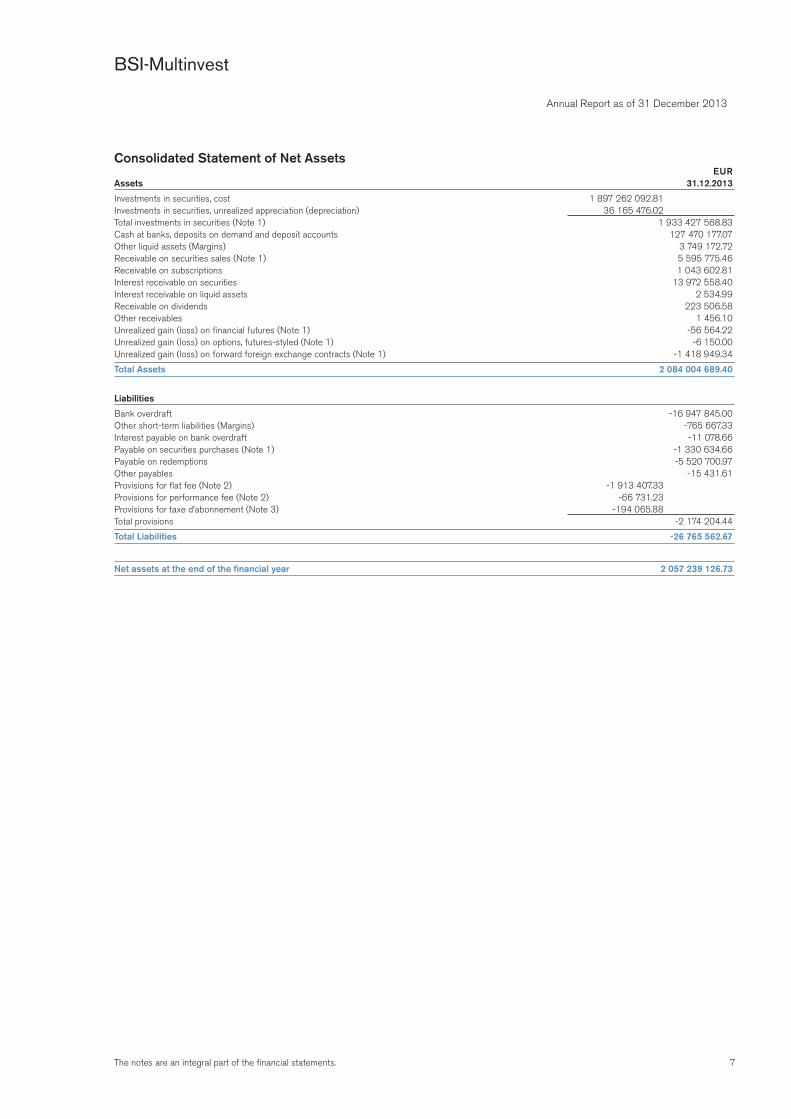
Consolidated Statement of Net Assets EURAssets 31.12.2013
Investments in securities, cost 1 897 262 092.81Investments in securities, unrealized appreciation (depreciation) 36 165 476.02Total investments in securities (Note 1) 1 933 427 568.83Cash at banks, deposits on demand and deposit accounts 127 470 177.07Other liquid assets (Margins) 3 749 172.72Receivable on securities sales (Note 1) 5 595 775.46Receivable on subscriptions 1 043 602.81Interest receivable on securities 13 972 558.40Interest receivable on liquid assets 2 534.99Receivable on dividends 223 506.58Other receivables 1 456.10Unrealized gain (loss) on financial futures (Note 1) -56 564.22Unrealized gain (loss) on options, futures-styled (Note 1) -6 150.00Unrealized gain (loss) on forward foreign exchange contracts (Note 1) -1 418 949.34
Total Assets 2 084 004 689.40
Liabilities
Bank overdraft -16 947 845.00Other short-term liabilities (Margins) -765 667.33Interest payable on bank overdraft -11 078.66Payable on securities purchases (Note 1) -1 330 634.66Payable on redemptions -5 520 700.97Other payables -15 431.61Provisions for flat fee (Note 2) -1 913 407.33Provisions for performance fee (Note 2) -66 731.23Provisions for taxe d’abonnement (Note 3) -194 065.88Total provisions -2 174 204.44
Total Liabilities -26 765 562.67
Net assets at the end of the financial year 2 057 239 126.73
BSI-Multinvest
8 The notes are an integral part of the financial statements.
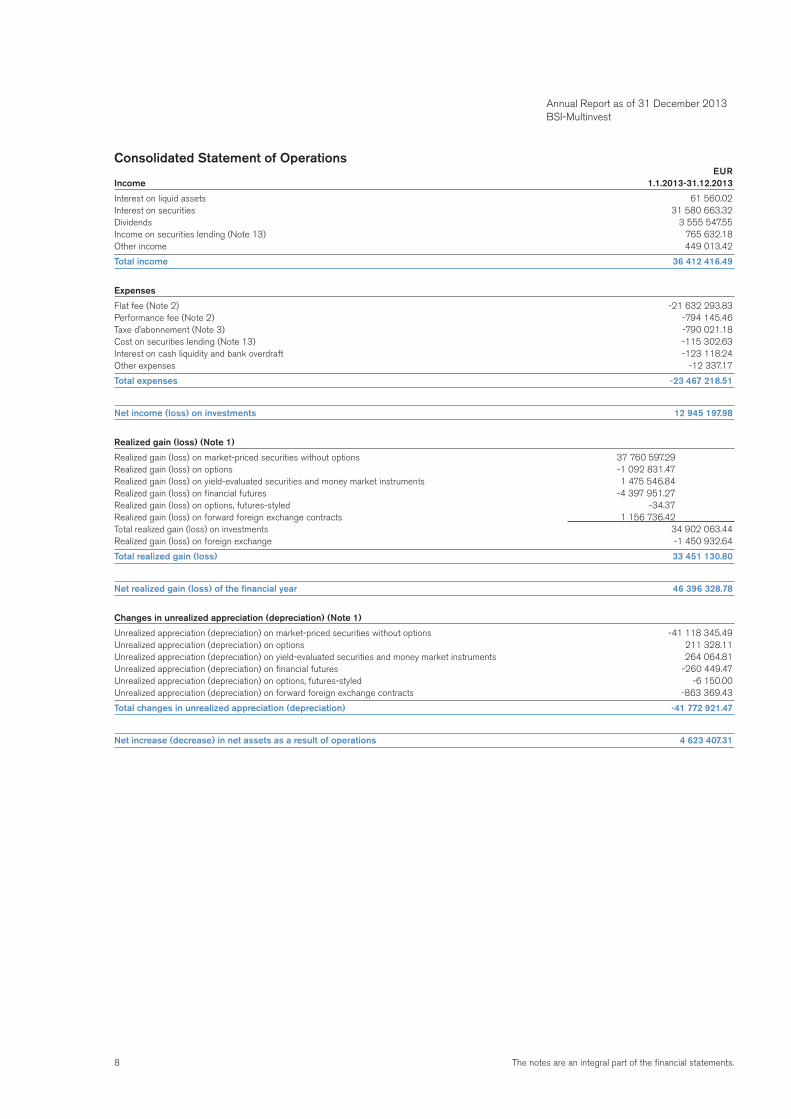
Consolidated Statement of Operations EURIncome 1.1.2013-31.12.2013
Interest on liquid assets 61 560.02Interest on securities 31 580 663.32Dividends 3 555 547.55Income on securities lending (Note 13) 765 632.18Other income 449 013.42
Total income 36 412 416.49
Expenses
Flat fee (Note 2) -21 632 293.83Performance fee (Note 2) -794 145.46Taxe d’abonnement (Note 3) -790 021.18Cost on securities lending (Note 13) -115 302.63Interest on cash liquidity and bank overdraft -123 118.24Other expenses -12 337.17
Total expenses -23 467 218.51
Net income (loss) on investments 12 945 197.98
Realized gain (loss) (Note 1)
Realized gain (loss) on market-priced securities without options 37 760 597.29Realized gain (loss) on options -1 092 831.47Realized gain (loss) on yield-evaluated securities and money market instruments 1 475 546.84Realized gain (loss) on financial futures -4 397 951.27Realized gain (loss) on options, futures-styled -34.37Realized gain (loss) on forward foreign exchange contracts 1 156 736.42Total realized gain (loss) on investments 34 902 063.44Realized gain (loss) on foreign exchange -1 450 932.64
Total realized gain (loss) 33 451 130.80
Net realized gain (loss) of the financial year 46 396 328.78
Changes in unrealized appreciation (depreciation) (Note 1)
Unrealized appreciation (depreciation) on market-priced securities without options -41 118 345.49Unrealized appreciation (depreciation) on options 211 328.11Unrealized appreciation (depreciation) on yield-evaluated securities and money market instruments 264 064.81Unrealized appreciation (depreciation) on financial futures -260 449.47Unrealized appreciation (depreciation) on options, futures-styled -6 150.00Unrealized appreciation (depreciation) on forward foreign exchange contracts -863 369.43
Total changes in unrealized appreciation (depreciation) -41 772 921.47
Net increase (decrease) in net assets as a result of operations 4 623 407.31
Annual Report as of 31 December 2013 BSI-Multinvest
9The notes are an integral part of the financial statements.
Annual Report as of 31 December 2013
BSI-Multinvest – Absoluta Daily
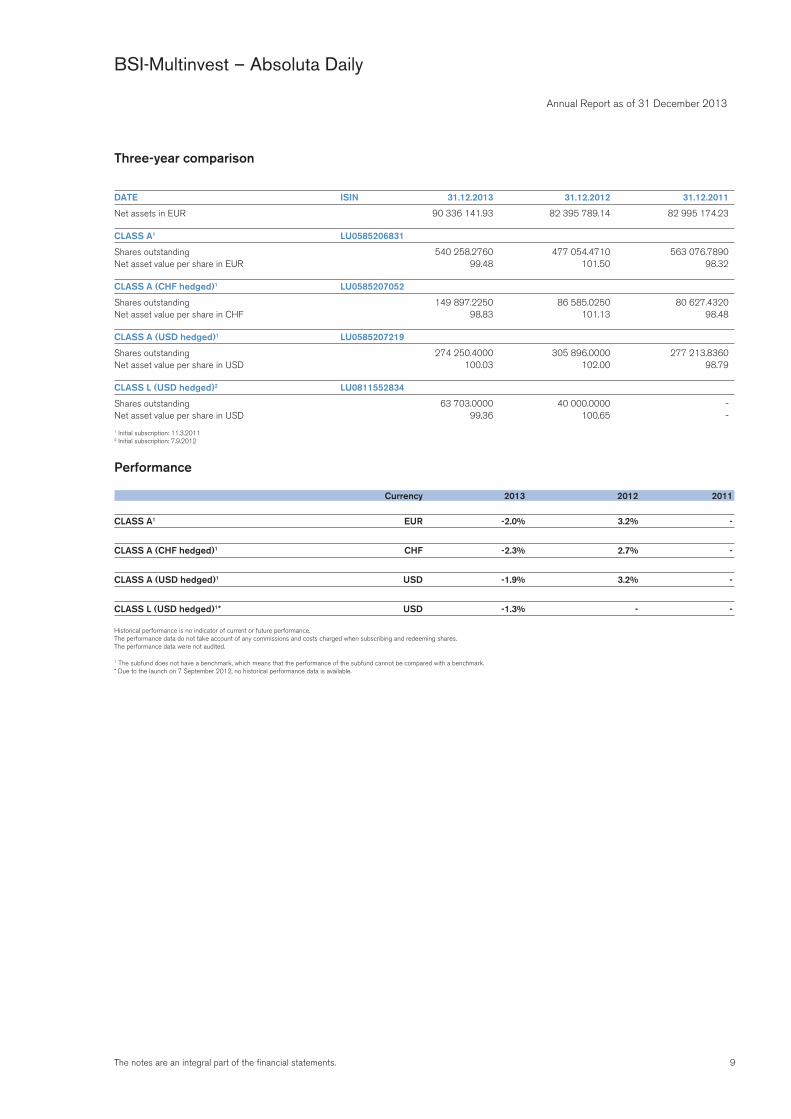
Three-year comparison
DATE ISIN 31.12.2013 31.12.2012 31.12.2011
Net assets in EUR 90 336 141.93 82 395 789.14 82 995 174.23
CLASS A1 LU0585206831
Shares outstanding 540 258.2760 477 054.4710 563 076.7890Net asset value per share in EUR 99.48 101.50 98.32
CLASS A (CHF hedged)1 LU0585207052
Shares outstanding 149 897.2250 86 585.0250 80 627.4320Net asset value per share in CHF 98.83 101.13 98.48
CLASS A (USD hedged)1 LU0585207219
Shares outstanding 274 250.4000 305 896.0000 277 213.8360Net asset value per share in USD 100.03 102.00 98.79
CLASS L (USD hedged)2 LU0811552834
Shares outstanding 63 703.0000 40 000.0000 -Net asset value per share in USD 99.36 100.65 -
1 Initial subscription: 11.3.20112 Initial subscription: 7.9.2012
Performance
Currency 2013 2012 2011
CLASS A1 EUR -2.0% 3.2% -
CLASS A (CHF hedged)1 CHF -2.3% 2.7% -
CLASS A (USD hedged)1 USD -1.9% 3.2% -
CLASS L (USD hedged)1* USD -1.3% - -
Historical performance is no indicator of current or future performance.The performance data do not take account of any commissions and costs charged when subscribing and redeeming shares.The performance data were not audited.
1 The subfund does not have a benchmark, which means that the performance of the subfund cannot be compared with a benchmark.* Due to the launch on 7 September 2012, no historical performance data is available.
10 The notes are an integral part of the financial statements.
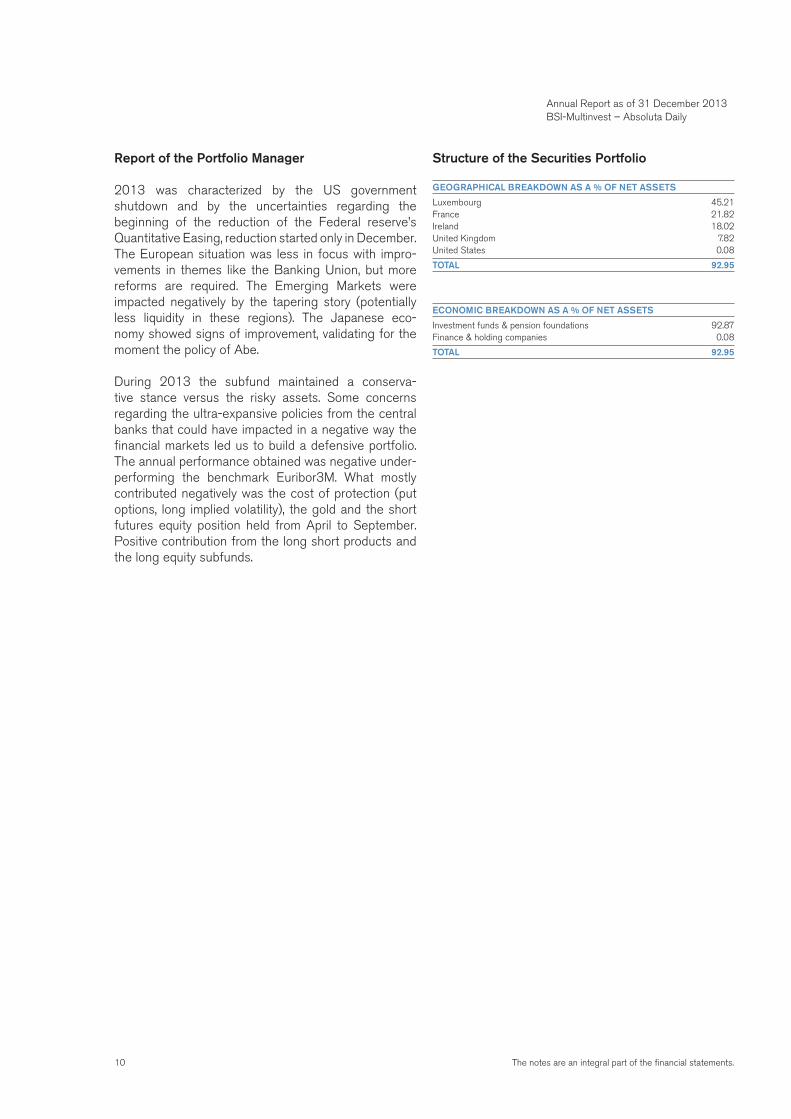
Report of the Portfolio Manager
2013 was characterized by the US government shutdown and by the uncertainties regarding the beginning of the reduction of the Federal reserve’s Quantitative Easing, reduction started only in December. The European situation was less in focus with impro-vements in themes like the Banking Union, but more reforms are required. The Emerging Markets were impacted negatively by the tapering story (potentially less liquidity in these regions). The Japanese eco-nomy showed signs of improvement, validating for the moment the policy of Abe.
During 2013 the subfund maintained a conserva-tive stance versus the risky assets. Some concerns regarding the ultra-expansive policies from the central banks that could have impacted in a negative way the financial markets led us to build a defensive portfolio. The annual performance obtained was negative under-performing the benchmark Euribor3M. What mostly contributed negatively was the cost of protection (put options, long implied volatility), the gold and the short futures equity position held from April to September. Positive contribution from the long short products and the long equity subfunds.
Structure of the Securities Portfolio
GEOGRAPHICAL BREAKDOWN AS A % OF NET ASSETS
Luxembourg 45.21France 21.82Ireland 18.02United Kingdom 7.82United States 0.08
TOTAL 92.95
ECONOMIC BREAKDOWN AS A % OF NET ASSETS
Investment funds & pension foundations 92.87Finance & holding companies 0.08
TOTAL 92.95
Annual Report as of 31 December 2013 BSI-Multinvest – Absoluta Daily
11The notes are an integral part of the financial statements.
Annual Report as of 31 December 2013 BSI-Multinvest – Absoluta Daily
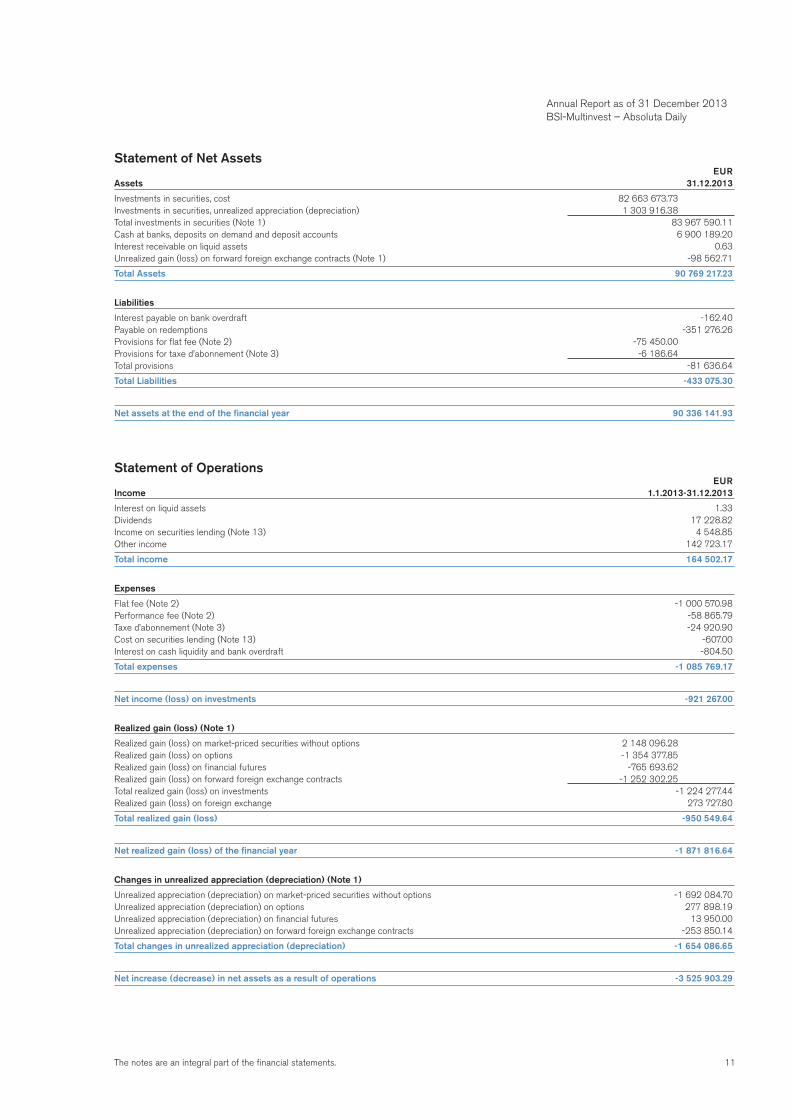
Statement of Net Assets EURAssets 31.12.2013
Investments in securities, cost 82 663 673.73Investments in securities, unrealized appreciation (depreciation) 1 303 916.38Total investments in securities (Note 1) 83 967 590.11Cash at banks, deposits on demand and deposit accounts 6 900 189.20Interest receivable on liquid assets 0.63Unrealized gain (loss) on forward foreign exchange contracts (Note 1) -98 562.71
Total Assets 90 769 217.23
Liabilities
Interest payable on bank overdraft -162.40Payable on redemptions -351 276.26Provisions for flat fee (Note 2) -75 450.00Provisions for taxe d’abonnement (Note 3) -6 186.64Total provisions -81 636.64
Total Liabilities -433 075.30
Net assets at the end of the financial year 90 336 141.93
Statement of Operations EURIncome 1.1.2013-31.12.2013
Interest on liquid assets 1.33Dividends 17 228.82Income on securities lending (Note 13) 4 548.85Other income 142 723.17
Total income 164 502.17
Expenses
Flat fee (Note 2) -1 000 570.98Performance fee (Note 2) -58 865.79Taxe d’abonnement (Note 3) -24 920.90Cost on securities lending (Note 13) -607.00Interest on cash liquidity and bank overdraft -804.50
Total expenses -1 085 769.17
Net income (loss) on investments -921 267.00
Realized gain (loss) (Note 1)
Realized gain (loss) on market-priced securities without options 2 148 096.28Realized gain (loss) on options -1 354 377.85Realized gain (loss) on financial futures -765 693.62Realized gain (loss) on forward foreign exchange contracts -1 252 302.25Total realized gain (loss) on investments -1 224 277.44Realized gain (loss) on foreign exchange 273 727.80
Total realized gain (loss) -950 549.64
Net realized gain (loss) of the financial year -1 871 816.64
Changes in unrealized appreciation (depreciation) (Note 1)
Unrealized appreciation (depreciation) on market-priced securities without options -1 692 084.70Unrealized appreciation (depreciation) on options 277 898.19Unrealized appreciation (depreciation) on financial futures 13 950.00Unrealized appreciation (depreciation) on forward foreign exchange contracts -253 850.14
Total changes in unrealized appreciation (depreciation) -1 654 086.65
Net increase (decrease) in net assets as a result of operations -3 525 903.29
12 The notes are an integral part of the financial statements.
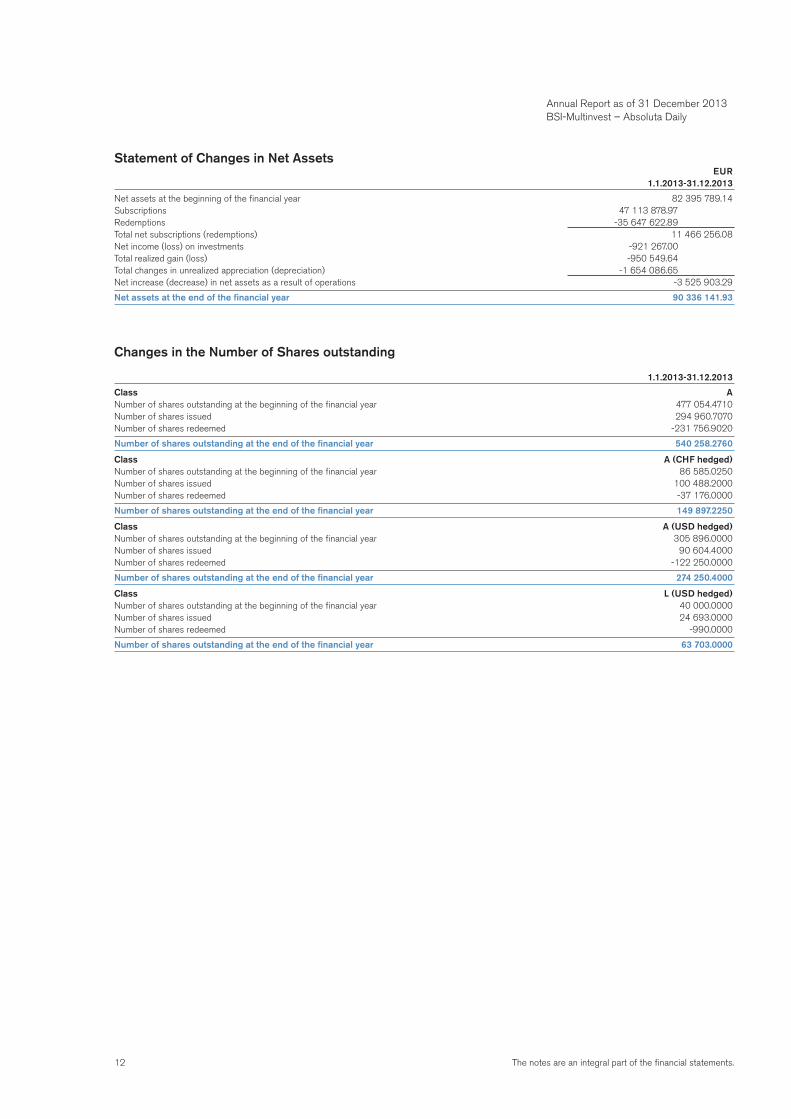
Statement of Changes in Net Assets EUR 1.1.2013-31.12.2013
Net assets at the beginning of the financial year 82 395 789.14Subscriptions 47 113 878.97Redemptions -35 647 622.89Total net subscriptions (redemptions) 11 466 256.08Net income (loss) on investments -921 267.00Total realized gain (loss) -950 549.64Total changes in unrealized appreciation (depreciation) -1 654 086.65Net increase (decrease) in net assets as a result of operations -3 525 903.29
Net assets at the end of the financial year 90 336 141.93
Changes in the Number of Shares outstanding
1.1.2013-31.12.2013
Class ANumber of shares outstanding at the beginning of the financial year 477 054.4710Number of shares issued 294 960.7070Number of shares redeemed -231 756.9020
Number of shares outstanding at the end of the financial year 540 258.2760
Class A (CHF hedged)Number of shares outstanding at the beginning of the financial year 86 585.0250Number of shares issued 100 488.2000Number of shares redeemed -37 176.0000
Number of shares outstanding at the end of the financial year 149 897.2250
Class A (USD hedged)Number of shares outstanding at the beginning of the financial year 305 896.0000Number of shares issued 90 604.4000Number of shares redeemed -122 250.0000
Number of shares outstanding at the end of the financial year 274 250.4000
Class L (USD hedged)Number of shares outstanding at the beginning of the financial year 40 000.0000Number of shares issued 24 693.0000Number of shares redeemed -990.0000
Number of shares outstanding at the end of the financial year 63 703.0000
Annual Report as of 31 December 2013 BSI-Multinvest – Absoluta Daily
13The notes are an integral part of the financial statements.
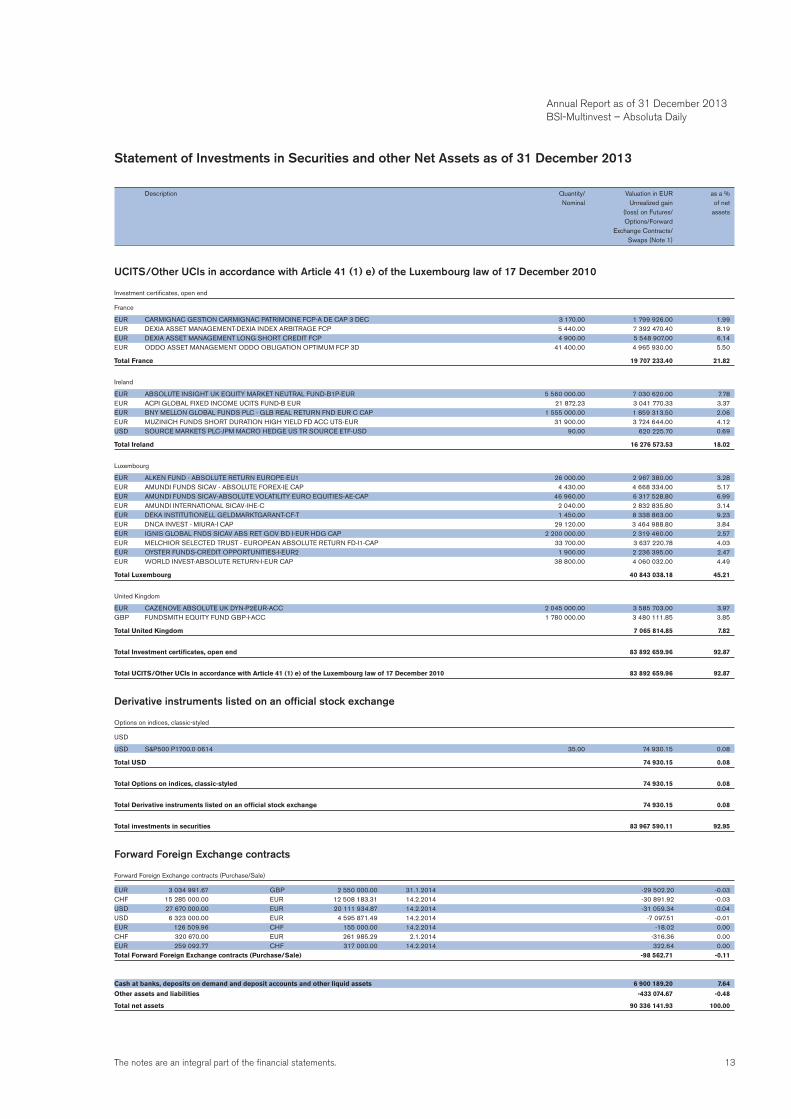
Statement of Investments in Securities and other Net Assets as of 31 December 2013
Description Quantity/ Valuation in EUR as a % Nominal Unrealized gain of net (loss) on Futures/ assets Options/Forward Exchange Contracts/ Swaps (Note 1)
UCITS/Other UCIs in accordance with Article 41 (1) e) of the Luxembourg law of 17 December 2010
Investment certificates, open end
France
EUR CARMIGNAC GESTION CARMIGNAC PATRIMOINE FCP-A DE CAP 3 DEC 3 170.00 1 799 926.00 1.99EUR DEXIA ASSET MANAGEMENT-DEXIA INDEX ARBITRAGE FCP 5 440.00 7 392 470.40 8.19EUR DEXIA ASSET MANAGEMENT LONG SHORT CREDIT FCP 4 900.00 5 548 907.00 6.14EUR ODDO ASSET MANAGEMENT ODDO OBLIGATION OPTIMUM FCP 3D 41 400.00 4 965 930.00 5.50
Total France 19 707 233.40 21.82
Ireland
EUR ABSOLUTE INSIGHT UK EQUITY MARKET NEUTRAL FUND-B1P-EUR 5 560 000.00 7 030 620.00 7.78EUR ACPI GLOBAL FIXED INCOME UCITS FUND-B EUR 21 872.23 3 041 770.33 3.37EUR BNY MELLON GLOBAL FUNDS PLC - GLB REAL RETURN FND EUR C CAP 1 555 000.00 1 859 313.50 2.06EUR MUZINICH FUNDS SHORT DURATION HIGH YIELD FD ACC UTS-EUR 31 900.00 3 724 644.00 4.12USD SOURCE MARKETS PLC-JPM MACRO HEDGE US TR SOURCE ETF-USD 90.00 620 225.70 0.69
Total Ireland 16 276 573.53 18.02
Luxembourg
EUR ALKEN FUND - ABSOLUTE RETURN EUROPE-EU1 26 000.00 2 967 380.00 3.28EUR AMUNDI FUNDS SICAV - ABSOLUTE FOREX-IE CAP 4 430.00 4 668 334.00 5.17EUR AMUNDI FUNDS SICAV-ABSOLUTE VOLATILITY EURO EQUITIES-AE-CAP 46 960.00 6 317 528.80 6.99EUR AMUNDI INTERNATIONAL SICAV-IHE-C 2 040.00 2 832 835.80 3.14EUR DEKA INSTITUTIONELL GELDMARKTGARANT-CF-T 1 450.00 8 338 863.00 9.23EUR DNCA INVEST - MIURA-I CAP 29 120.00 3 464 988.80 3.84EUR IGNIS GLOBAL FNDS SICAV ABS RET GOV BD I-EUR HDG CAP 2 200 000.00 2 319 460.00 2.57EUR MELCHIOR SELECTED TRUST - EUROPEAN ABSOLUTE RETURN FD-I1-CAP 33 700.00 3 637 220.78 4.03EUR OYSTER FUNDS-CREDIT OPPORTUNITIES-I-EUR2 1 900.00 2 236 395.00 2.47EUR WORLD INVEST-ABSOLUTE RETURN-I-EUR CAP 38 800.00 4 060 032.00 4.49
Total Luxembourg 40 843 038.18 45.21
United Kingdom
EUR CAZENOVE ABSOLUTE UK DYN-P2EUR-ACC 2 045 000.00 3 585 703.00 3.97GBP FUNDSMITH EQUITY FUND GBP-I-ACC 1 780 000.00 3 480 111.85 3.85
Total United Kingdom 7 065 814.85 7.82
Total Investment certificates, open end 83 892 659.96 92.87
Total UCITS/Other UCIs in accordance with Article 41 (1) e) of the Luxembourg law of 17 December 2010 83 892 659.96 92.87
Derivative instruments listed on an official stock exchange
Options on indices, classic-styled
USD
USD S&P500 P1700.0 0614 35.00 74 930.15 0.08
Total USD 74 930.15 0.08
Total Options on indices, classic-styled 74 930.15 0.08
Total Derivative instruments listed on an official stock exchange 74 930.15 0.08
Total investments in securities 83 967 590.11 92.95
Forward Foreign Exchange contracts
Forward Foreign Exchange contracts (Purchase/Sale)
EUR 3 034 991.67 GBP 2 550 000.00 31.1.2014 -29 502.20 -0.03CHF 15 285 000.00 EUR 12 508 183.31 14.2.2014 -30 891.92 -0.03USD 27 670 000.00 EUR 20 111 934.87 14.2.2014 -31 059.34 -0.04USD 6 323 000.00 EUR 4 595 871.49 14.2.2014 -7 097.51 -0.01EUR 126 509.96 CHF 155 000.00 14.2.2014 -18.02 0.00CHF 320 670.00 EUR 261 985.29 2.1.2014 -316.36 0.00EUR 259 092.77 CHF 317 000.00 14.2.2014 322.64 0.00Total Forward Foreign Exchange contracts (Purchase/Sale) -98 562.71 -0.11
Cash at banks, deposits on demand and deposit accounts and other liquid assets 6 900 189.20 7.64
Other assets and liabilities -433 074.67 -0.48
Total net assets 90 336 141.93 100.00
Annual Report as of 31 December 2013 BSI-Multinvest – Absoluta Daily
14 The notes are an integral part of the financial statements.
Annual Report as of 31 December 2013
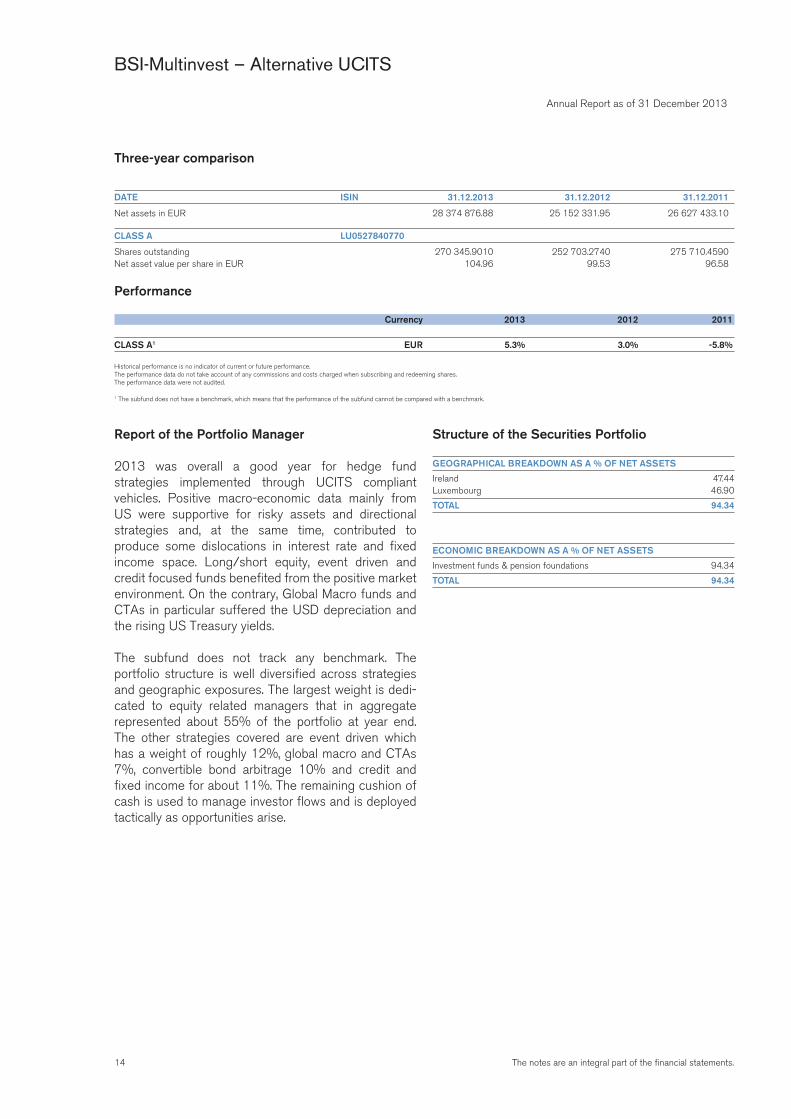
BSI-Multinvest – Alternative UCITS
Three-year comparison
DATE ISIN 31.12.2013 31.12.2012 31.12.2011
Net assets in EUR 28 374 876.88 25 152 331.95 26 627 433.10
CLASS A LU0527840770
Shares outstanding 270 345.9010 252 703.2740 275 710.4590Net asset value per share in EUR 104.96 99.53 96.58
Performance
Currency 2013 2012 2011
CLASS A1 EUR 5.3% 3.0% -5.8%
Historical performance is no indicator of current or future performance.The performance data do not take account of any commissions and costs charged when subscribing and redeeming shares.The performance data were not audited.
1 The subfund does not have a benchmark, which means that the performance of the subfund cannot be compared with a benchmark.
Report of the Portfolio Manager
2013 was overall a good year for hedge fund strategies implemented through UCITS compliant vehicles. Positive macro-economic data mainly from US were supportive for risky assets and directional strategies and, at the same time, contributed to produce some dislocations in interest rate and fixed income space. Long/short equity, event driven and credit focused funds benefited from the positive market environment. On the contrary, Global Macro funds and CTAs in particular suffered the USD depreciation and the rising US Treasury yields.
The subfund does not track any benchmark. The portfolio structure is well diversified across strategies and geographic exposures. The largest weight is dedi-cated to equity related managers that in aggregate represented about 55% of the portfolio at year end. The other strategies covered are event driven which has a weight of roughly 12%, global macro and CTAs 7%, convertible bond arbitrage 10% and credit and fixed income for about 11%. The remaining cushion of cash is used to manage investor flows and is deployed tactically as opportunities arise.
Structure of the Securities Portfolio
GEOGRAPHICAL BREAKDOWN AS A % OF NET ASSETS
Ireland 47.44Luxembourg 46.90
TOTAL 94.34
ECONOMIC BREAKDOWN AS A % OF NET ASSETS
Investment funds & pension foundations 94.34
TOTAL 94.34
15The notes are an integral part of the financial statements.
Statement of Net Assets EURAssets 31.12.2013
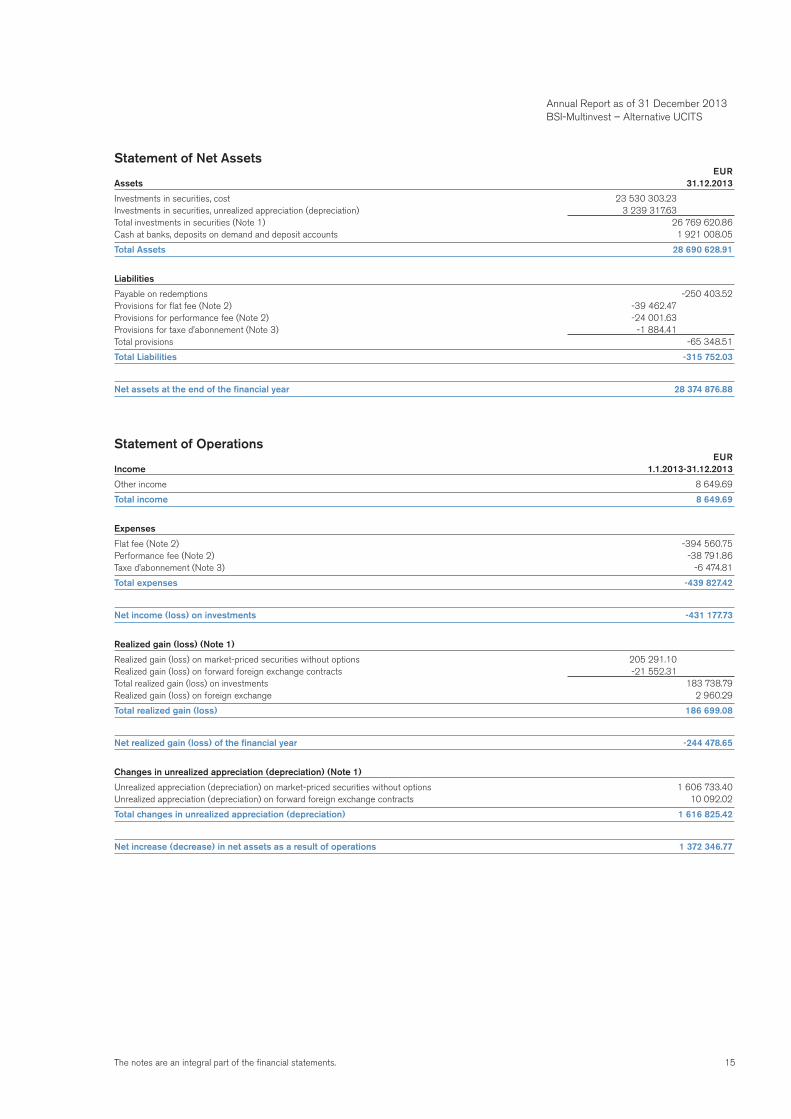
Investments in securities, cost 23 530 303.23Investments in securities, unrealized appreciation (depreciation) 3 239 317.63Total investments in securities (Note 1) 26 769 620.86Cash at banks, deposits on demand and deposit accounts 1 921 008.05
Total Assets 28 690 628.91
Liabilities
Payable on redemptions -250 403.52Provisions for flat fee (Note 2) -39 462.47Provisions for performance fee (Note 2) -24 001.63Provisions for taxe d’abonnement (Note 3) -1 884.41Total provisions -65 348.51
Total Liabilities -315 752.03
Net assets at the end of the financial year 28 374 876.88
Statement of Operations EURIncome 1.1.2013-31.12.2013
Other income 8 649.69
Total income 8 649.69
Expenses
Flat fee (Note 2) -394 560.75Performance fee (Note 2) -38 791.86Taxe d’abonnement (Note 3) -6 474.81
Total expenses -439 827.42
Net income (loss) on investments -431 177.73
Realized gain (loss) (Note 1)
Realized gain (loss) on market-priced securities without options 205 291.10Realized gain (loss) on forward foreign exchange contracts -21 552.31Total realized gain (loss) on investments 183 738.79Realized gain (loss) on foreign exchange 2 960.29
Total realized gain (loss) 186 699.08
Net realized gain (loss) of the financial year -244 478.65
Changes in unrealized appreciation (depreciation) (Note 1)
Unrealized appreciation (depreciation) on market-priced securities without options 1 606 733.40Unrealized appreciation (depreciation) on forward foreign exchange contracts 10 092.02
Total changes in unrealized appreciation (depreciation) 1 616 825.42
Net increase (decrease) in net assets as a result of operations 1 372 346.77
Annual Report as of 31 December 2013 BSI-Multinvest – Alternative UCITS
16 The notes are an integral part of the financial statements.
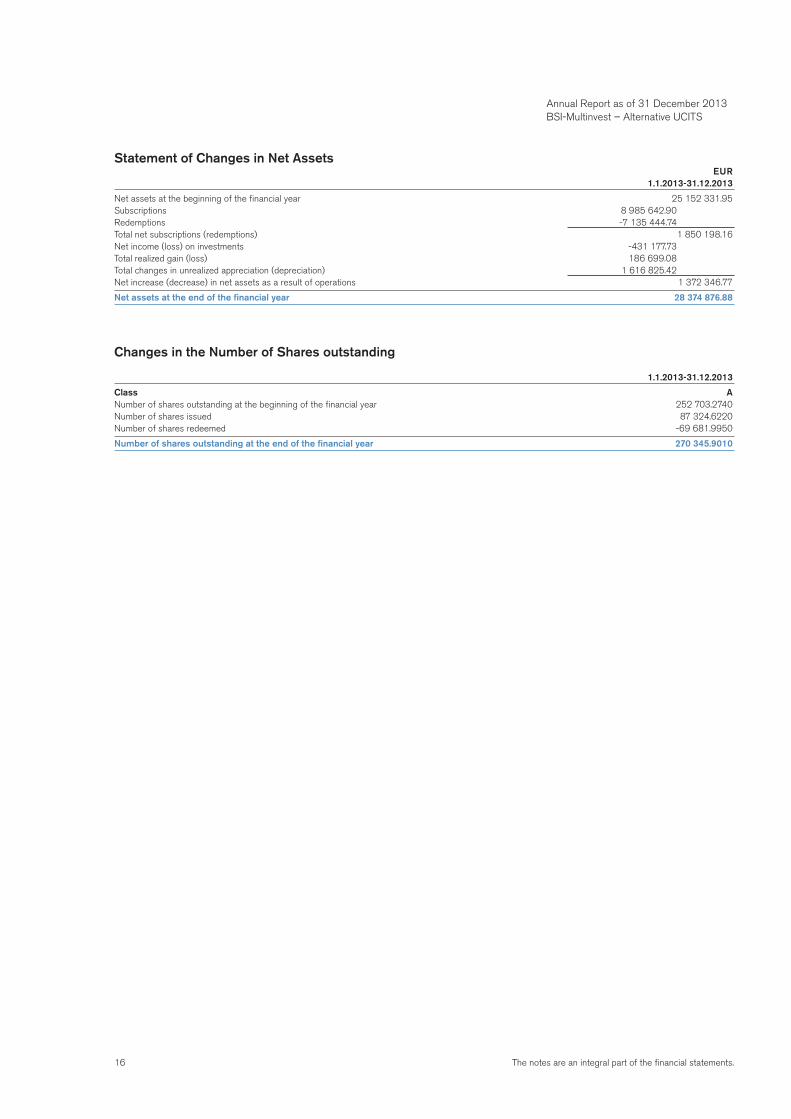
Statement of Changes in Net Assets EUR 1.1.2013-31.12.2013
Net assets at the beginning of the financial year 25 152 331.95Subscriptions 8 985 642.90Redemptions -7 135 444.74Total net subscriptions (redemptions) 1 850 198.16Net income (loss) on investments -431 177.73Total realized gain (loss) 186 699.08Total changes in unrealized appreciation (depreciation) 1 616 825.42Net increase (decrease) in net assets as a result of operations 1 372 346.77
Net assets at the end of the financial year 28 374 876.88
Changes in the Number of Shares outstanding
1.1.2013-31.12.2013
Class ANumber of shares outstanding at the beginning of the financial year 252 703.2740Number of shares issued 87 324.6220Number of shares redeemed -69 681.9950
Number of shares outstanding at the end of the financial year 270 345.9010
Annual Report as of 31 December 2013 BSI-Multinvest – Alternative UCITS
17The notes are an integral part of the financial statements.
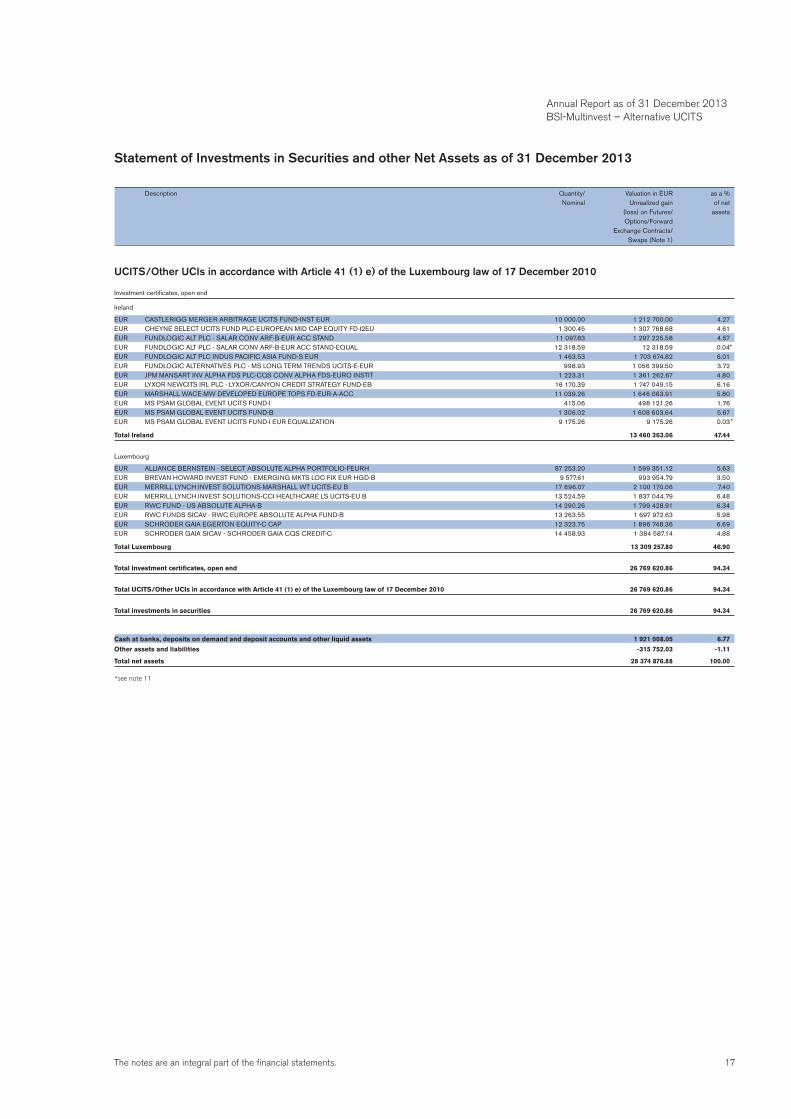
Statement of Investments in Securities and other Net Assets as of 31 December 2013
Description Quantity/ Valuation in EUR as a % Nominal Unrealized gain of net (loss) on Futures/ assets Options/Forward Exchange Contracts/ Swaps (Note 1)
UCITS/Other UCIs in accordance with Article 41 (1) e) of the Luxembourg law of 17 December 2010
Investment certificates, open end
Ireland
EUR CASTLERIGG MERGER ARBITRAGE UCITS FUND-INST EUR 10 000.00 1 212 700.00 4.27EUR CHEYNE SELECT UCITS FUND PLC-EUROPEAN MID CAP EQUITY FD-I2EU 1 300.45 1 307 768.68 4.61EUR FUNDLOGIC ALT PLC - SALAR CONV ARF-B-EUR ACC STAND 11 097.83 1 297 225.58 4.57EUR FUNDLOGIC ALT PLC - SALAR CONV ARF-B-EUR ACC STAND-EQUAL 12 318.59 12 318.59 0.04EUR FUNDLOGIC ALT PLC INDUS PACIFIC ASIA FUND-S EUR 1 463.53 1 703 674.82 6.01EUR FUNDLOGIC ALTERNATIVES PLC - MS LONG TERM TRENDS UCITS-E-EUR 998.93 1 056 399.50 3.72EUR JPM MANSART INV ALPHA FDS PLC-CQS CONV ALPHA FDS-EURO INSTIT 1 223.31 1 361 262.67 4.80EUR LYXOR NEWCITS IRL PLC - LYXOR/CANYON CREDIT STRATEGY FUND-EB 16 170.39 1 747 049.15 6.16EUR MARSHALL WACE-MW DEVELOPED EUROPE TOPS FD-EUR-A-ACC 11 039.26 1 646 063.91 5.80EUR MS PSAM GLOBAL EVENT UCITS FUND-I 415.06 498 121.26 1.76EUR MS PSAM GLOBAL EVENT UCITS FUND-B 1 306.02 1 608 603.64 5.67EUR MS PSAM GLOBAL EVENT UCITS FUND-I EUR EQUALIZATION 9 175.26 9 175.26 0.03
Total Ireland 13 460 363.06 47.44
Luxembourg
EUR ALLIANCE BERNSTEIN - SELECT ABSOLUTE ALPHA PORTFOLIO-FEURH 87 253.20 1 599 351.12 5.63EUR BREVAN HOWARD INVEST FUND - EMERGING MKTS LOC FIX EUR HGD-B 9 577.61 993 954.79 3.50EUR MERRILL LYNCH INVEST SOLUTIONS-MARSHALL WT UCITS-EU B 17 696.07 2 100 170.06 7.40EUR MERRILL LYNCH INVEST SOLUTIONS-CCI HEALTHCARE LS UCITS-EU B 13 524.59 1 837 044.79 6.48EUR RWC FUND - US ABSOLUTE ALPHA-B 14 290.26 1 799 428.91 6.34EUR RWC FUNDS SICAV - RWC EUROPE ABSOLUTE ALPHA FUND-B 13 263.55 1 697 972.63 5.98EUR SCHRODER GAIA EGERTON EQUITY-C CAP 12 323.75 1 896 748.36 6.69EUR SCHRODER GAIA SICAV - SCHRODER GAIA CQS CREDIT-C 14 458.93 1 384 587.14 4.88
Total Luxembourg 13 309 257.80 46.90
Total Investment certificates, open end 26 769 620.86 94.34
Total UCITS/Other UCIs in accordance with Article 41 (1) e) of the Luxembourg law of 17 December 2010 26 769 620.86 94.34
Total investments in securities 26 769 620.86 94.34
Cash at banks, deposits on demand and deposit accounts and other liquid assets 1 921 008.05 6.77
Other assets and liabilities -315 752.03 -1.11
Total net assets 28 374 876.88 100.00
*see note 11
*
*
Annual Report as of 31 December 2013 BSI-Multinvest – Alternative UCITS
18 The notes are an integral part of the financial statements.
Annual Report as of 31 December 2013
BSI-Multinvest – Asian Stocks
Three-year comparison
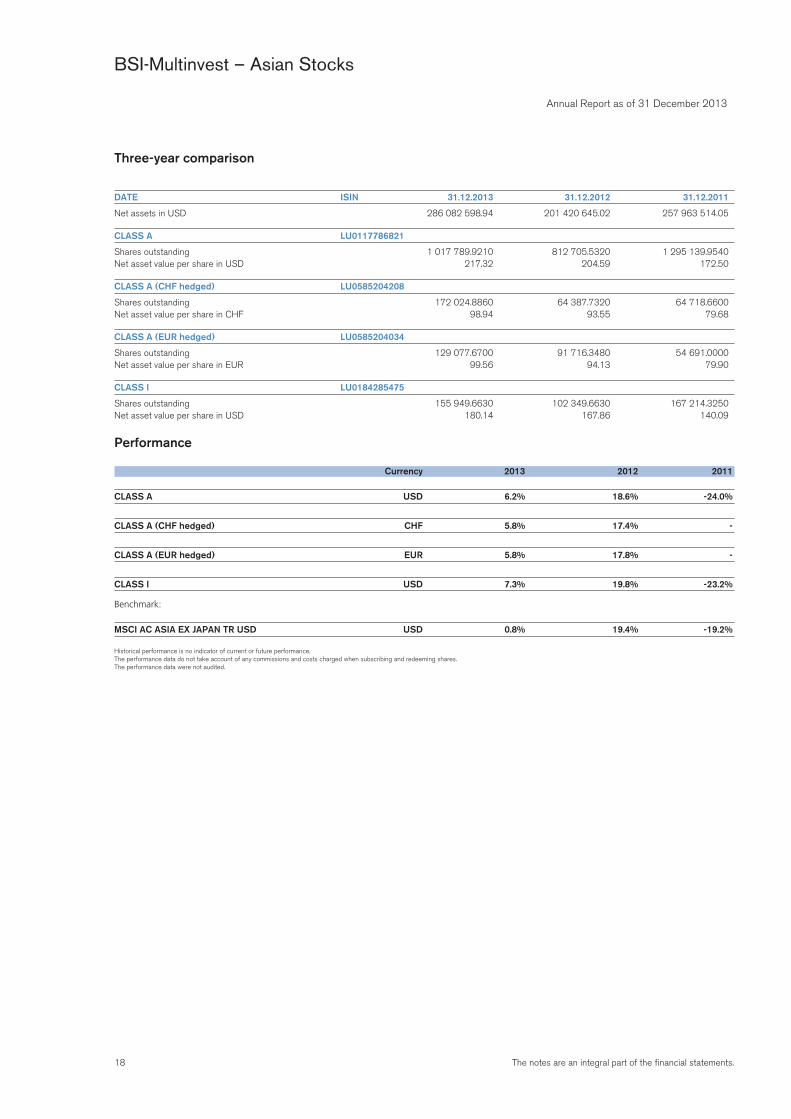
DATE ISIN 31.12.2013 31.12.2012 31.12.2011
Net assets in USD 286 082 598.94 201 420 645.02 257 963 514.05
CLASS A LU0117786821
Shares outstanding 1 017 789.9210 812 705.5320 1 295 139.9540Net asset value per share in USD 217.32 204.59 172.50
CLASS A (CHF hedged) LU0585204208
Shares outstanding 172 024.8860 64 387.7320 64 718.6600Net asset value per share in CHF 98.94 93.55 79.68
CLASS A (EUR hedged) LU0585204034
Shares outstanding 129 077.6700 91 716.3480 54 691.0000Net asset value per share in EUR 99.56 94.13 79.90
CLASS I LU0184285475
Shares outstanding 155 949.6630 102 349.6630 167 214.3250Net asset value per share in USD 180.14 167.86 140.09
Performance
Currency 2013 2012 2011
CLASS A USD 6.2% 18.6% -24.0%
CLASS A (CHF hedged) CHF 5.8% 17.4% -
CLASS A (EUR hedged) EUR 5.8% 17.8% -
CLASS I USD 7.3% 19.8% -23.2%
Benchmark:
MSCI AC ASIA EX JAPAN TR USD USD 0.8% 19.4% -19.2%
Historical performance is no indicator of current or future performance.The performance data do not take account of any commissions and costs charged when subscribing and redeeming shares.The performance data were not audited.
19The notes are an integral part of the financial statements.
Annual Report as of 31 December 2013 BSI-Multinvest – Asian Stocks
Report of the Portfolio Manager
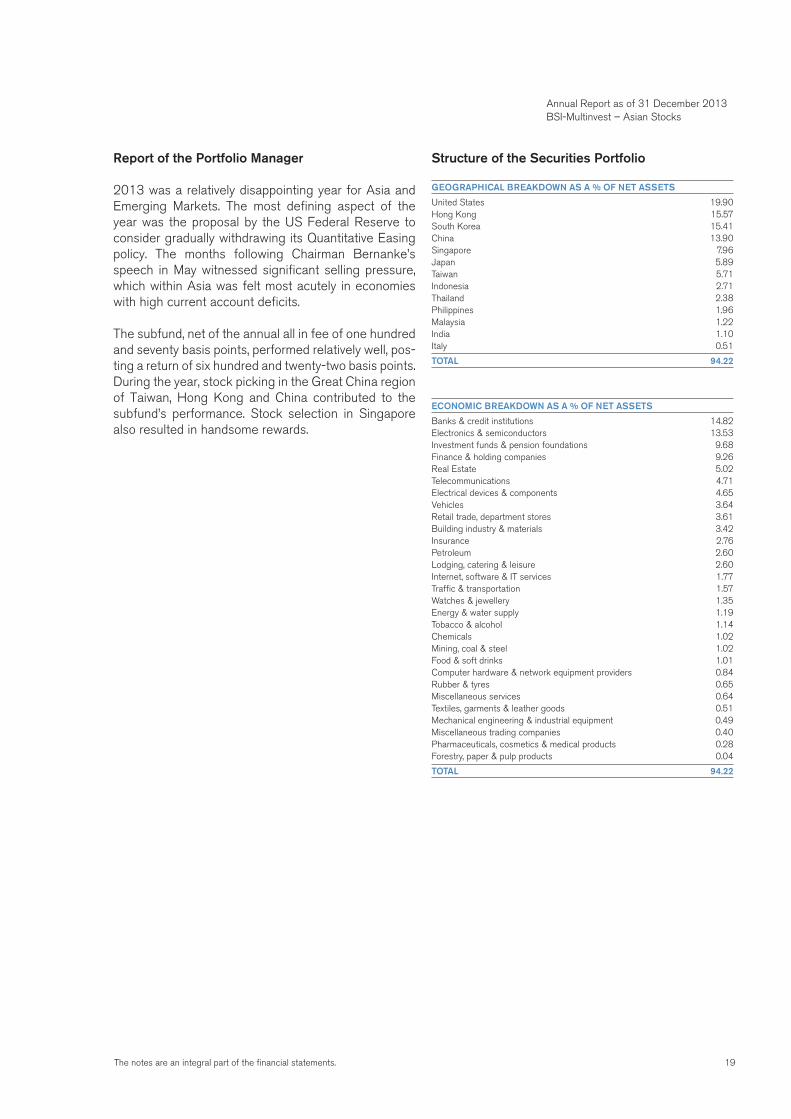
2013 was a relatively disappointing year for Asia and Emerging Markets. The most defining aspect of the year was the proposal by the US Federal Reserve to consider gradually withdrawing its Quantitative Easing policy. The months following Chairman Bernanke’s speech in May witnessed significant selling pressure, which within Asia was felt most acutely in economies with high current account deficits.
The subfund, net of the annual all in fee of one hundred and seventy basis points, performed relatively well, pos-ting a return of six hundred and twenty-two basis points. During the year, stock picking in the Great China region of Taiwan, Hong Kong and China contributed to the subfund’s performance. Stock selection in Singapore also resulted in handsome rewards.
Structure of the Securities Portfolio
GEOGRAPHICAL BREAKDOWN AS A % OF NET ASSETS
United States 19.90Hong Kong 15.57South Korea 15.41China 13.90Singapore 7.96Japan 5.89Taiwan 5.71Indonesia 2.71Thailand 2.38Philippines 1.96Malaysia 1.22India 1.10Italy 0.51
TOTAL 94.22
ECONOMIC BREAKDOWN AS A % OF NET ASSETS
Banks & credit institutions 14.82Electronics & semiconductors 13.53Investment funds & pension foundations 9.68Finance & holding companies 9.26Real Estate 5.02Telecommunications 4.71Electrical devices & components 4.65Vehicles 3.64Retail trade, department stores 3.61Building industry & materials 3.42Insurance 2.76Petroleum 2.60Lodging, catering & leisure 2.60Internet, software & IT services 1.77Traffic & transportation 1.57Watches & jewellery 1.35Energy & water supply 1.19Tobacco & alcohol 1.14Chemicals 1.02Mining, coal & steel 1.02Food & soft drinks 1.01Computer hardware & network equipment providers 0.84Rubber & tyres 0.65Miscellaneous services 0.64Textiles, garments & leather goods 0.51Mechanical engineering & industrial equipment 0.49Miscellaneous trading companies 0.40Pharmaceuticals, cosmetics & medical products 0.28Forestry, paper & pulp products 0.04
TOTAL 94.22
20 The notes are an integral part of the financial statements.
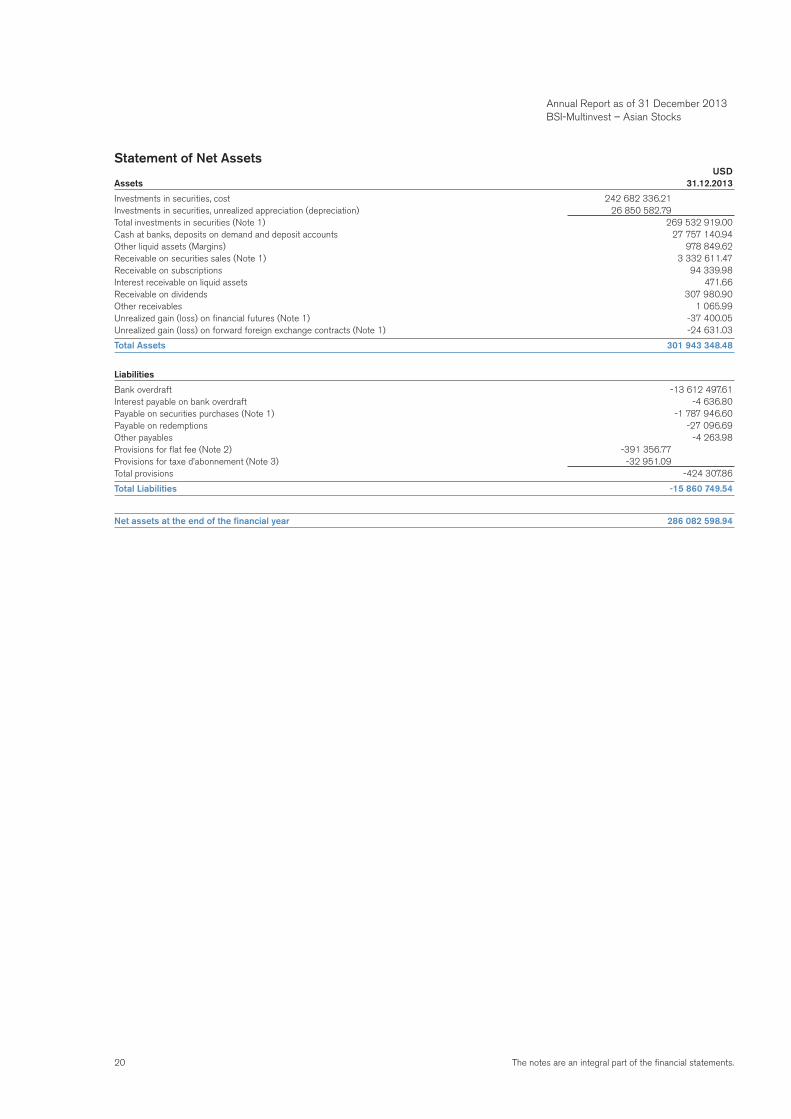
Statement of Net Assets USDAssets 31.12.2013
Investments in securities, cost 242 682 336.21Investments in securities, unrealized appreciation (depreciation) 26 850 582.79Total investments in securities (Note 1) 269 532 919.00Cash at banks, deposits on demand and deposit accounts 27 757 140.94Other liquid assets (Margins) 978 849.62Receivable on securities sales (Note 1) 3 332 611.47Receivable on subscriptions 94 339.98Interest receivable on liquid assets 471.66Receivable on dividends 307 980.90Other receivables 1 065.99Unrealized gain (loss) on financial futures (Note 1) -37 400.05Unrealized gain (loss) on forward foreign exchange contracts (Note 1) -24 631.03
Total Assets 301 943 348.48
Liabilities
Bank overdraft -13 612 497.61Interest payable on bank overdraft -4 636.80Payable on securities purchases (Note 1) -1 787 946.60Payable on redemptions -27 096.69Other payables -4 263.98Provisions for flat fee (Note 2) -391 356.77Provisions for taxe d’abonnement (Note 3) -32 951.09Total provisions -424 307.86
Total Liabilities -15 860 749.54
Net assets at the end of the financial year 286 082 598.94
Annual Report as of 31 December 2013 BSI-Multinvest – Asian Stocks
21The notes are an integral part of the financial statements.
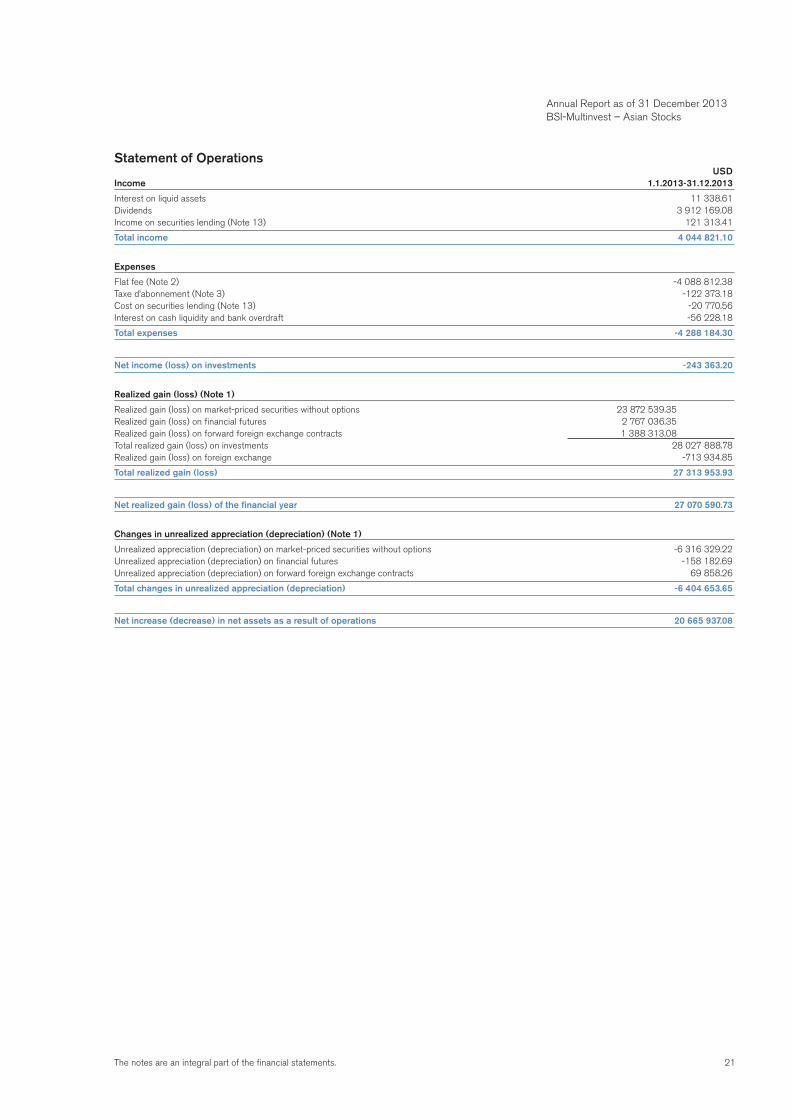
Statement of Operations USDIncome 1.1.2013-31.12.2013
Interest on liquid assets 11 338.61Dividends 3 912 169.08Income on securities lending (Note 13) 121 313.41
Total income 4 044 821.10
Expenses
Flat fee (Note 2) -4 088 812.38Taxe d’abonnement (Note 3) -122 373.18Cost on securities lending (Note 13) -20 770.56Interest on cash liquidity and bank overdraft -56 228.18
Total expenses -4 288 184.30
Net income (loss) on investments -243 363.20
Realized gain (loss) (Note 1)
Realized gain (loss) on market-priced securities without options 23 872 539.35Realized gain (loss) on financial futures 2 767 036.35Realized gain (loss) on forward foreign exchange contracts 1 388 313.08Total realized gain (loss) on investments 28 027 888.78Realized gain (loss) on foreign exchange -713 934.85
Total realized gain (loss) 27 313 953.93
Net realized gain (loss) of the financial year 27 070 590.73
Changes in unrealized appreciation (depreciation) (Note 1)
Unrealized appreciation (depreciation) on market-priced securities without options -6 316 329.22Unrealized appreciation (depreciation) on financial futures -158 182.69Unrealized appreciation (depreciation) on forward foreign exchange contracts 69 858.26
Total changes in unrealized appreciation (depreciation) -6 404 653.65
Net increase (decrease) in net assets as a result of operations 20 665 937.08
Annual Report as of 31 December 2013 BSI-Multinvest – Asian Stocks
22 The notes are an integral part of the financial statements.
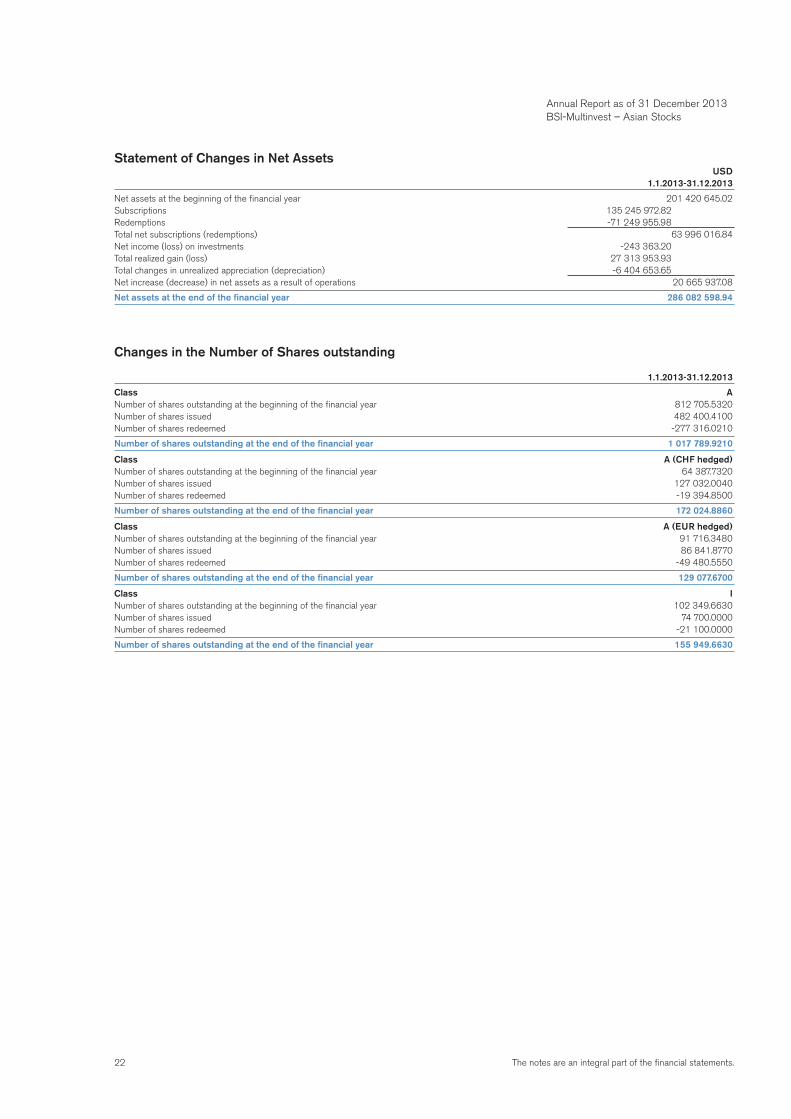
Statement of Changes in Net Assets USD 1.1.2013-31.12.2013
Net assets at the beginning of the financial year 201 420 645.02Subscriptions 135 245 972.82Redemptions -71 249 955.98Total net subscriptions (redemptions) 63 996 016.84Net income (loss) on investments -243 363.20Total realized gain (loss) 27 313 953.93Total changes in unrealized appreciation (depreciation) -6 404 653.65Net increase (decrease) in net assets as a result of operations 20 665 937.08
Net assets at the end of the financial year 286 082 598.94
Changes in the Number of Shares outstanding
1.1.2013-31.12.2013
Class ANumber of shares outstanding at the beginning of the financial year 812 705.5320Number of shares issued 482 400.4100Number of shares redeemed -277 316.0210
Number of shares outstanding at the end of the financial year 1 017 789.9210
Class A (CHF hedged)Number of shares outstanding at the beginning of the financial year 64 387.7320Number of shares issued 127 032.0040Number of shares redeemed -19 394.8500
Number of shares outstanding at the end of the financial year 172 024.8860
Class A (EUR hedged)Number of shares outstanding at the beginning of the financial year 91 716.3480Number of shares issued 86 841.8770Number of shares redeemed -49 480.5550
Number of shares outstanding at the end of the financial year 129 077.6700
Class INumber of shares outstanding at the beginning of the financial year 102 349.6630Number of shares issued 74 700.0000Number of shares redeemed -21 100.0000
Number of shares outstanding at the end of the financial year 155 949.6630
Annual Report as of 31 December 2013 BSI-Multinvest – Asian Stocks
23The notes are an integral part of the financial statements.
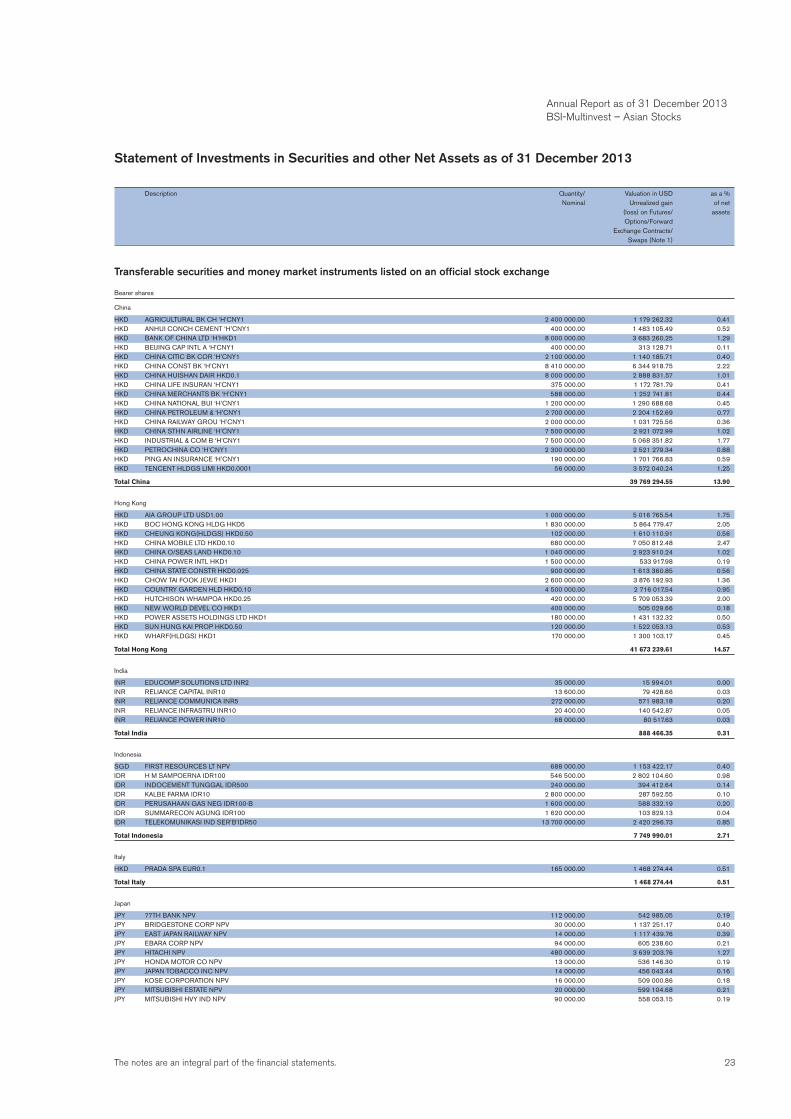
Statement of Investments in Securities and other Net Assets as of 31 December 2013
Description Quantity/ Valuation in USD as a % Nominal Unrealized gain of net (loss) on Futures/ assets Options/Forward Exchange Contracts/ Swaps (Note 1)
Transferable securities and money market instruments listed on an official stock exchange
Bearer shares
China
HKD AGRICULTURAL BK CH ‘H’CNY1 2 400 000.00 1 179 262.32 0.41HKD ANHUI CONCH CEMENT ‘H’CNY1 400 000.00 1 483 105.49 0.52HKD BANK OF CHINA LTD ‘H’HKD1 8 000 000.00 3 683 260.25 1.29HKD BEIJING CAP INTL A ‘H’CNY1 400 000.00 313 128.71 0.11HKD CHINA CITIC BK COR ‘H’CNY1 2 100 000.00 1 140 185.71 0.40HKD CHINA CONST BK ‘H’CNY1 8 410 000.00 6 344 918.75 2.22HKD CHINA HUISHAN DAIR HKD0.1 8 000 000.00 2 888 831.57 1.01HKD CHINA LIFE INSURAN ‘H’CNY1 375 000.00 1 172 781.79 0.41HKD CHINA MERCHANTS BK ‘H’CNY1 588 000.00 1 252 741.81 0.44HKD CHINA NATIONAL BUI ‘H’CNY1 1 200 000.00 1 290 688.68 0.45HKD CHINA PETROLEUM & ‘H’CNY1 2 700 000.00 2 204 152.69 0.77HKD CHINA RAILWAY GROU ‘H’CNY1 2 000 000.00 1 031 725.56 0.36HKD CHINA STHN AIRLINE ‘H’CNY1 7 500 000.00 2 921 072.99 1.02HKD INDUSTRIAL & COM B ‘H’CNY1 7 500 000.00 5 068 351.82 1.77HKD PETROCHINA CO ‘H’CNY1 2 300 000.00 2 521 279.34 0.88HKD PING AN INSURANCE ‘H’CNY1 190 000.00 1 701 766.83 0.59HKD TENCENT HLDGS LIMI HKD0.0001 56 000.00 3 572 040.24 1.25
Total China 39 769 294.55 13.90
Hong Kong
HKD AIA GROUP LTD USD1.00 1 000 000.00 5 016 765.54 1.75HKD BOC HONG KONG HLDG HKD5 1 830 000.00 5 864 779.47 2.05HKD CHEUNG KONG(HLDGS) HKD0.50 102 000.00 1 610 110.91 0.56HKD CHINA MOBILE LTD HKD0.10 680 000.00 7 050 812.48 2.47HKD CHINA O/SEAS LAND HKD0.10 1 040 000.00 2 923 910.24 1.02HKD CHINA POWER INTL HKD1 1 500 000.00 533 917.98 0.19HKD CHINA STATE CONSTR HKD0.025 900 000.00 1 613 360.85 0.56HKD CHOW TAI FOOK JEWE HKD1 2 600 000.00 3 876 192.93 1.36HKD COUNTRY GARDEN HLD HKD0.10 4 500 000.00 2 716 017.54 0.95HKD HUTCHISON WHAMPOA HKD0.25 420 000.00 5 709 053.39 2.00HKD NEW WORLD DEVEL CO HKD1 400 000.00 505 029.66 0.18HKD POWER ASSETS HOLDINGS LTD HKD1 180 000.00 1 431 132.32 0.50HKD SUN HUNG KAI PROP HKD0.50 120 000.00 1 522 053.13 0.53HKD WHARF(HLDGS) HKD1 170 000.00 1 300 103.17 0.45
Total Hong Kong 41 673 239.61 14.57
India
INR EDUCOMP SOLUTIONS LTD INR2 35 000.00 15 994.01 0.00INR RELIANCE CAPITAL INR10 13 600.00 79 428.66 0.03INR RELIANCE COMMUNICA INR5 272 000.00 571 983.18 0.20INR RELIANCE INFRASTRU INR10 20 400.00 140 542.87 0.05INR RELIANCE POWER INR10 68 000.00 80 517.63 0.03
Total India 888 466.35 0.31
Indonesia
SGD FIRST RESOURCES LT NPV 688 000.00 1 153 422.17 0.40IDR H M SAMPOERNA IDR100 546 500.00 2 802 104.60 0.98IDR INDOCEMENT TUNGGAL IDR500 240 000.00 394 412.64 0.14IDR KALBE FARMA IDR10 2 800 000.00 287 592.55 0.10IDR PERUSAHAAN GAS NEG IDR100-B 1 600 000.00 588 332.19 0.20IDR SUMMARECON AGUNG IDR100 1 620 000.00 103 829.13 0.04IDR TELEKOMUNIKASI IND SER’B’IDR50 13 700 000.00 2 420 296.73 0.85
Total Indonesia 7 749 990.01 2.71
Italy
HKD PRADA SPA EUR0.1 165 000.00 1 468 274.44 0.51
Total Italy 1 468 274.44 0.51
Japan
JPY 77TH BANK NPV 112 000.00 542 985.05 0.19JPY BRIDGESTONE CORP NPV 30 000.00 1 137 251.17 0.40JPY EAST JAPAN RAILWAY NPV 14 000.00 1 117 439.76 0.39JPY EBARA CORP NPV 94 000.00 605 238.60 0.21JPY HITACHI NPV 480 000.00 3 639 203.76 1.27JPY HONDA MOTOR CO NPV 13 000.00 536 146.30 0.19JPY JAPAN TOBACCO INC NPV 14 000.00 456 043.44 0.16JPY KOSE CORPORATION NPV 16 000.00 509 000.86 0.18JPY MITSUBISHI ESTATE NPV 20 000.00 599 104.68 0.21JPY MITSUBISHI HVY IND NPV 90 000.00 558 053.15 0.19
Annual Report as of 31 December 2013 BSI-Multinvest – Asian Stocks
24 The notes are an integral part of the financial statements.
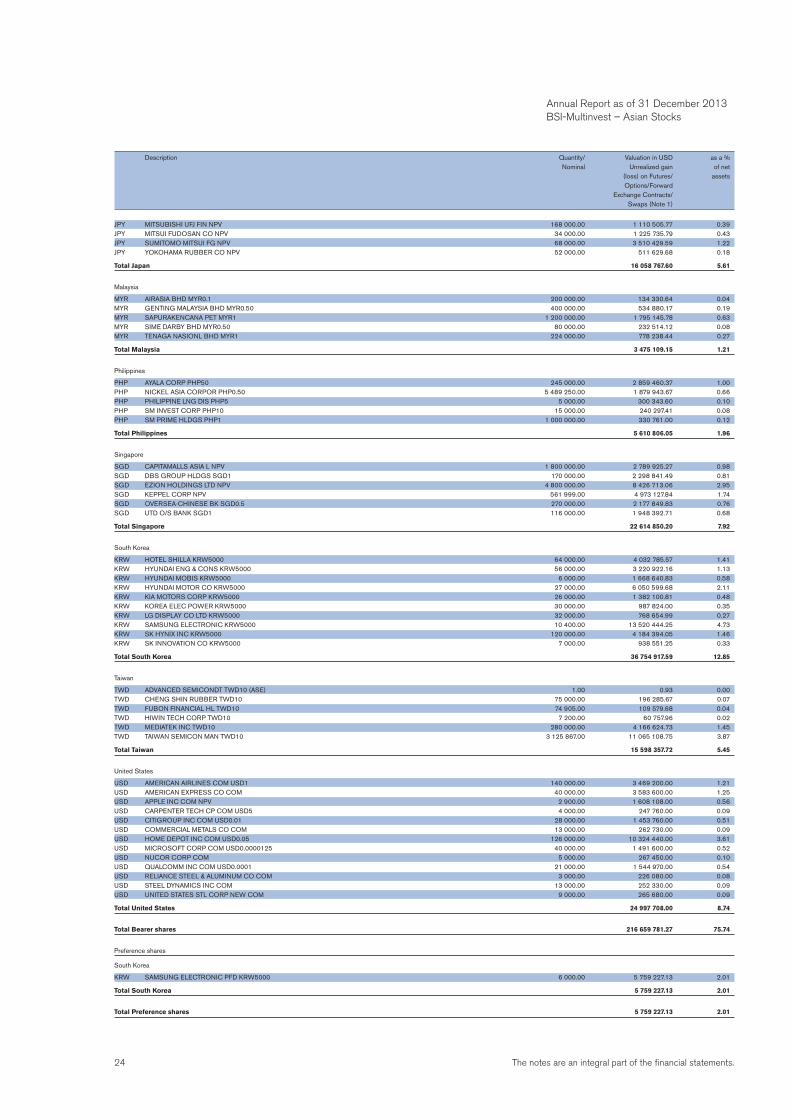
JPY MITSUBISHI UFJ FIN NPV 168 000.00 1 110 505.77 0.39JPY MITSUI FUDOSAN CO NPV 34 000.00 1 225 735.79 0.43JPY SUMITOMO MITSUI FG NPV 68 000.00 3 510 429.59 1.22JPY YOKOHAMA RUBBER CO NPV 52 000.00 511 629.68 0.18
Total Japan 16 058 767.60 5.61
Malaysia
MYR AIRASIA BHD MYR0.1 200 000.00 134 330.64 0.04MYR GENTING MALAYSIA BHD MYR0.50 400 000.00 534 880.17 0.19MYR SAPURAKENCANA PET MYR1 1 200 000.00 1 795 145.78 0.63MYR SIME DARBY BHD MYR0.50 80 000.00 232 514.12 0.08MYR TENAGA NASIONL BHD MYR1 224 000.00 778 238.44 0.27
Total Malaysia 3 475 109.15 1.21
Philippines
PHP AYALA CORP PHP50 245 000.00 2 859 460.37 1.00PHP NICKEL ASIA CORPOR PHP0.50 5 489 250.00 1 879 943.67 0.66PHP PHILIPPINE LNG DIS PHP5 5 000.00 300 343.60 0.10PHP SM INVEST CORP PHP10 15 000.00 240 297.41 0.08PHP SM PRIME HLDGS PHP1 1 000 000.00 330 761.00 0.12
Total Philippines 5 610 806.05 1.96
Singapore
SGD CAPITAMALLS ASIA L NPV 1 800 000.00 2 789 925.27 0.98SGD DBS GROUP HLDGS SGD1 170 000.00 2 298 841.49 0.81SGD EZION HOLDINGS LTD NPV 4 800 000.00 8 426 713.06 2.95SGD KEPPEL CORP NPV 561 999.00 4 973 127.84 1.74SGD OVERSEA-CHINESE BK SGD0.5 270 000.00 2 177 849.83 0.76SGD UTD O/S BANK SGD1 116 000.00 1 948 392.71 0.68
Total Singapore 22 614 850.20 7.92
South Korea
KRW HOTEL SHILLA KRW5000 64 000.00 4 032 785.57 1.41KRW HYUNDAI ENG & CONS KRW5000 56 000.00 3 220 922.16 1.13KRW HYUNDAI MOBIS KRW5000 6 000.00 1 668 640.83 0.58KRW HYUNDAI MOTOR CO KRW5000 27 000.00 6 050 599.68 2.11KRW KIA MOTORS CORP KRW5000 26 000.00 1 382 100.81 0.48KRW KOREA ELEC POWER KRW5000 30 000.00 987 824.00 0.35KRW LG DISPLAY CO LTD KRW5000 32 000.00 768 654.99 0.27KRW SAMSUNG ELECTRONIC KRW5000 10 400.00 13 520 444.25 4.73KRW SK HYNIX INC KRW5000 120 000.00 4 184 394.05 1.46KRW SK INNOVATION CO KRW5000 7 000.00 938 551.25 0.33
Total South Korea 36 754 917.59 12.85
Taiwan
TWD ADVANCED SEMICONDT TWD10 (ASE) 1.00 0.93 0.00TWD CHENG SHIN RUBBER TWD10 75 000.00 196 285.67 0.07TWD FUBON FINANCIAL HL TWD10 74 905.00 109 579.68 0.04TWD HIWIN TECH CORP TWD10 7 200.00 60 757.96 0.02TWD MEDIATEK INC TWD10 280 000.00 4 166 624.73 1.45TWD TAIWAN SEMICON MAN TWD10 3 125 867.00 11 065 108.75 3.87
Total Taiwan 15 598 357.72 5.45
United States
USD AMERICAN AIRLINES COM USD1 140 000.00 3 469 200.00 1.21USD AMERICAN EXPRESS CO COM 40 000.00 3 583 600.00 1.25USD APPLE INC COM NPV 2 900.00 1 608 108.00 0.56USD CARPENTER TECH CP COM USD5 4 000.00 247 760.00 0.09USD CITIGROUP INC COM USD0.01 28 000.00 1 453 760.00 0.51USD COMMERCIAL METALS CO COM 13 000.00 262 730.00 0.09USD HOME DEPOT INC COM USD0.05 126 000.00 10 324 440.00 3.61USD MICROSOFT CORP COM USD0.0000125 40 000.00 1 491 600.00 0.52USD NUCOR CORP COM 5 000.00 267 450.00 0.10USD QUALCOMM INC COM USD0.0001 21 000.00 1 544 970.00 0.54USD RELIANCE STEEL & ALUMINUM CO COM 3 000.00 226 080.00 0.08USD STEEL DYNAMICS INC COM 13 000.00 252 330.00 0.09USD UNITED STATES STL CORP NEW COM 9 000.00 265 680.00 0.09
Total United States 24 997 708.00 8.74
Total Bearer shares 216 659 781.27 75.74
Preference shares
South Korea
KRW SAMSUNG ELECTRONIC PFD KRW5000 6 000.00 5 759 227.13 2.01
Total South Korea 5 759 227.13 2.01
Total Preference shares 5 759 227.13 2.01
Description Quantity/ Valuation in USD as a % Nominal Unrealized gain of net (loss) on Futures/ assets Options/Forward Exchange Contracts/ Swaps (Note 1)
Annual Report as of 31 December 2013 BSI-Multinvest – Asian Stocks
25The notes are an integral part of the financial statements.
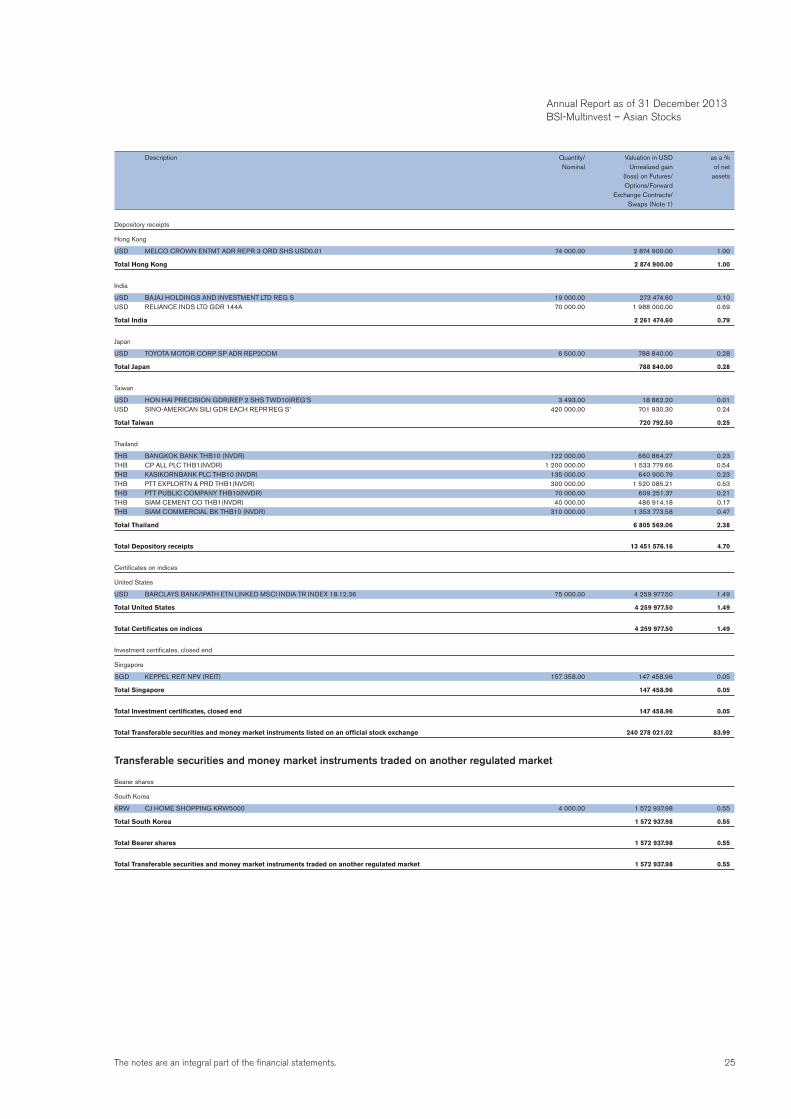
Depository receipts
Hong Kong
USD MELCO CROWN ENTMT ADR REPR 3 ORD SHS USD0.01 74 000.00 2 874 900.00 1.00
Total Hong Kong 2 874 900.00 1.00
India
USD BAJAJ HOLDINGS AND INVESTMENT LTD REG S 19 000.00 273 474.60 0.10USD RELIANCE INDS LTD GDR 144A 70 000.00 1 988 000.00 0.69
Total India 2 261 474.60 0.79
Japan
USD TOYOTA MOTOR CORP SP ADR REP2COM 6 500.00 788 840.00 0.28
Total Japan 788 840.00 0.28
Taiwan
USD HON HAI PRECISION GDR(REP 2 SHS TWD10)REG’S 3 493.00 18 862.20 0.01USD SINO-AMERICAN SILI GDR EACH REPR’REG S’ 420 000.00 701 930.30 0.24
Total Taiwan 720 792.50 0.25
Thailand
THB BANGKOK BANK THB10 (NVDR) 122 000.00 660 864.27 0.23THB CP ALL PLC THB1(NVDR) 1 200 000.00 1 533 779.66 0.54THB KASIKORNBANK PLC THB10 (NVDR) 135 000.00 640 900.79 0.23THB PTT EXPLORTN & PRD THB1(NVDR) 300 000.00 1 520 085.21 0.53THB PTT PUBLIC COMPANY THB10(NVDR) 70 000.00 609 251.37 0.21THB SIAM CEMENT CO THB1(NVDR) 40 000.00 486 914.18 0.17THB SIAM COMMERCIAL BK THB10 (NVDR) 310 000.00 1 353 773.58 0.47
Total Thailand 6 805 569.06 2.38
Total Depository receipts 13 451 576.16 4.70
Certificates on indices
United States
USD BARCLAYS BANK/IPATH ETN LINKED MSCI INDIA TR INDEX 18.12.36 75 000.00 4 259 977.50 1.49
Total United States 4 259 977.50 1.49
Total Certificates on indices 4 259 977.50 1.49
Investment certificates, closed end
Singapore
SGD KEPPEL REIT NPV (REIT) 157 358.00 147 458.96 0.05
Total Singapore 147 458.96 0.05
Total Investment certificates, closed end 147 458.96 0.05
Total Transferable securities and money market instruments listed on an official stock exchange 240 278 021.02 83.99
Transferable securities and money market instruments traded on another regulated market
Bearer shares
South Korea
KRW CJ HOME SHOPPING KRW5000 4 000.00 1 572 937.98 0.55
Total South Korea 1 572 937.98 0.55
Total Bearer shares 1 572 937.98 0.55
Total Transferable securities and money market instruments traded on another regulated market 1 572 937.98 0.55
Annual Report as of 31 December 2013 BSI-Multinvest – Asian Stocks
Description Quantity/ Valuation in USD as a % Nominal Unrealized gain of net (loss) on Futures/ assets Options/Forward Exchange Contracts/ Swaps (Note 1)
26 The notes are an integral part of the financial statements.
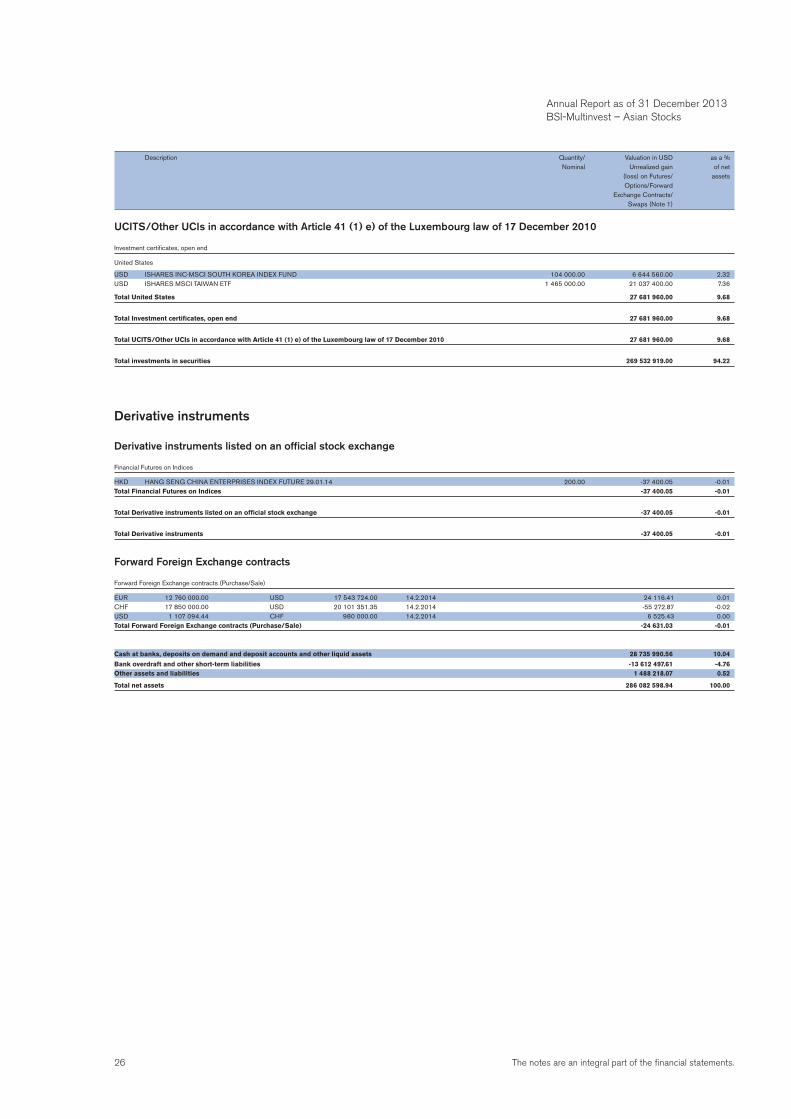
UCITS/Other UCIs in accordance with Article 41 (1) e) of the Luxembourg law of 17 December 2010
Investment certificates, open end
United States
USD ISHARES INC-MSCI SOUTH KOREA INDEX FUND 104 000.00 6 644 560.00 2.32USD ISHARES MSCI TAIWAN ETF 1 465 000.00 21 037 400.00 7.36
Total United States 27 681 960.00 9.68
Total Investment certificates, open end 27 681 960.00 9.68
Total UCITS/Other UCIs in accordance with Article 41 (1) e) of the Luxembourg law of 17 December 2010 27 681 960.00 9.68
Total investments in securities 269 532 919.00 94.22
Derivative instruments
Derivative instruments listed on an official stock exchange
Financial Futures on Indices
HKD HANG SENG CHINA ENTERPRISES INDEX FUTURE 29.01.14 200.00 -37 400.05 -0.01Total Financial Futures on Indices -37 400.05 -0.01
Total Derivative instruments listed on an official stock exchange -37 400.05 -0.01
Total Derivative instruments -37 400.05 -0.01
Forward Foreign Exchange contracts
Forward Foreign Exchange contracts (Purchase/Sale)
EUR 12 760 000.00 USD 17 543 724.00 14.2.2014 24 116.41 0.01CHF 17 850 000.00 USD 20 101 351.35 14.2.2014 -55 272.87 -0.02USD 1 107 094.44 CHF 980 000.00 14.2.2014 6 525.43 0.00Total Forward Foreign Exchange contracts (Purchase/Sale) -24 631.03 -0.01
Cash at banks, deposits on demand and deposit accounts and other liquid assets 28 735 990.56 10.04
Bank overdraft and other short-term liabilities -13 612 497.61 -4.76Other assets and liabilities 1 488 218.07 0.52
Total net assets 286 082 598.94 100.00
Description Quantity/ Valuation in USD as a % Nominal Unrealized gain of net (loss) on Futures/ assets Options/Forward Exchange Contracts/ Swaps (Note 1)
Annual Report as of 31 December 2013 BSI-Multinvest – Asian Stocks
27The notes are an integral part of the financial statements.
Annual Report as of 31 December 2013
BSI-Multinvest – Bonds CHF
Three-year comparison
DATE ISIN 31.12.2013 31.12.2012 31.12.2011
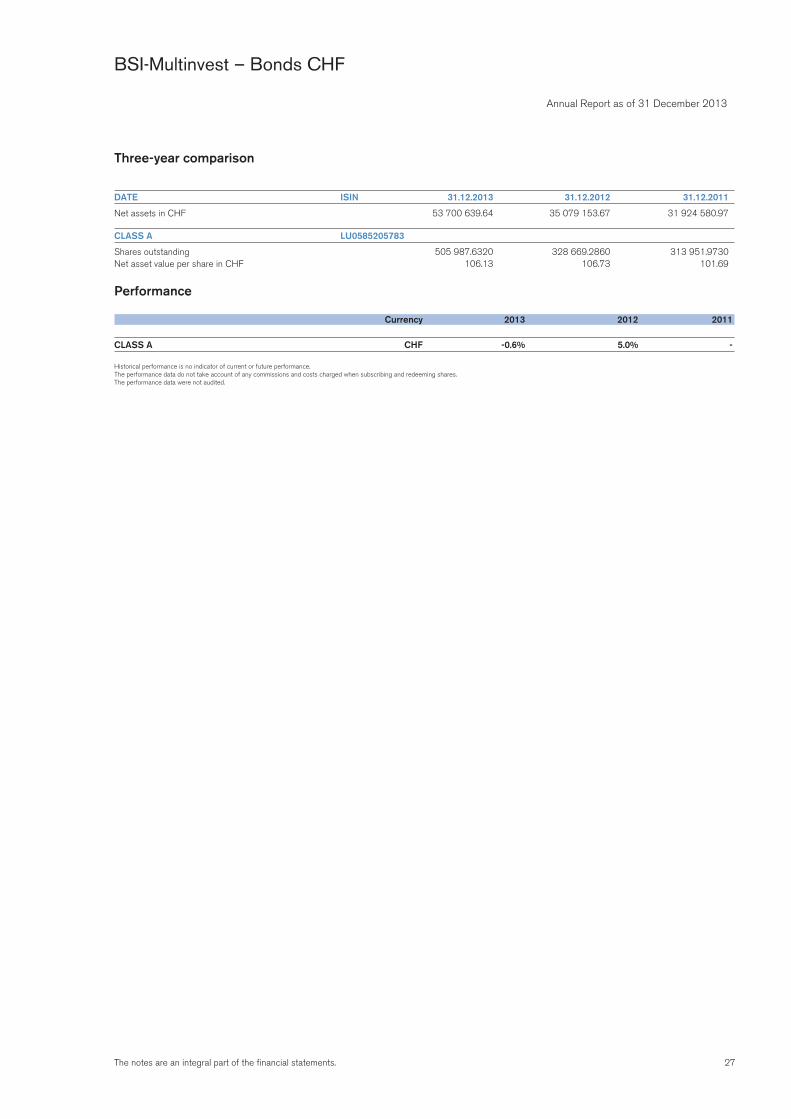
Net assets in CHF 53 700 639.64 35 079 153.67 31 924 580.97
CLASS A LU0585205783
Shares outstanding 505 987.6320 328 669.2860 313 951.9730Net asset value per share in CHF 106.13 106.73 101.69
Performance
Currency 2013 2012 2011
CLASS A CHF -0.6% 5.0% -
Historical performance is no indicator of current or future performance.The performance data do not take account of any commissions and costs charged when subscribing and redeeming shares.The performance data were not audited.
28 The notes are an integral part of the financial statements.
Annual Report as of 31 December 2013 BSI-Multinvest – Bonds CHF
Report of the Portfolio Manager
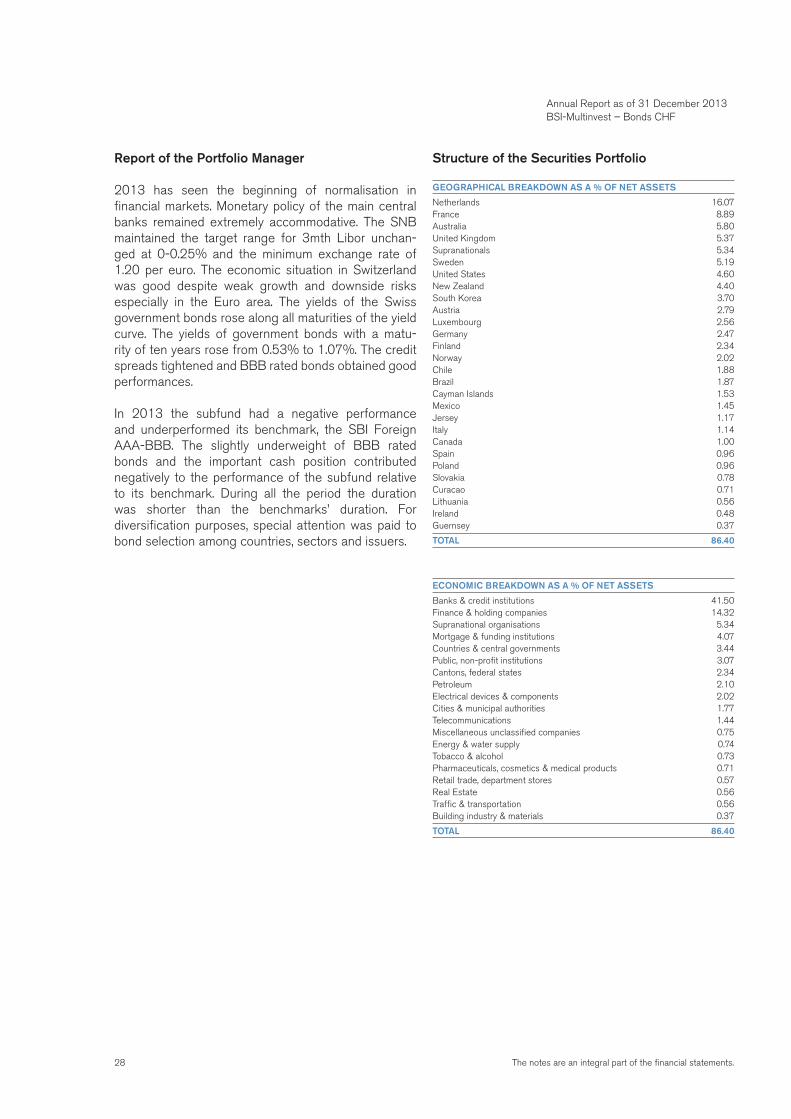
2013 has seen the beginning of normalisation in financial markets. Monetary policy of the main central banks remained extremely accommodative. The SNB maintained the target range for 3mth Libor unchan-ged at 0-0.25% and the minimum exchange rate of 1.20 per euro. The economic situation in Switzerland was good despite weak growth and downside risks especially in the Euro area. The yields of the Swiss government bonds rose along all maturities of the yield curve. The yields of government bonds with a matu-rity of ten years rose from 0.53% to 1.07%. The credit spreads tightened and BBB rated bonds obtained good performances.
In 2013 the subfund had a negative performance and underperformed its benchmark, the SBI Foreign AAA-BBB. The slightly underweight of BBB rated bonds and the important cash position contributed negatively to the performance of the subfund relative to its benchmark. During all the period the duration was shorter than the benchmarks’ duration. For diversification purposes, special attention was paid to bond selection among countries, sectors and issuers.
Structure of the Securities Portfolio
GEOGRAPHICAL BREAKDOWN AS A % OF NET ASSETS
Netherlands 16.07France 8.89Australia 5.80United Kingdom 5.37Supranationals 5.34Sweden 5.19United States 4.60New Zealand 4.40South Korea 3.70Austria 2.79Luxembourg 2.56Germany 2.47Finland 2.34Norway 2.02Chile 1.88Brazil 1.87Cayman Islands 1.53Mexico 1.45Jersey 1.17Italy 1.14Canada 1.00Spain 0.96Poland 0.96Slovakia 0.78Curacao 0.71Lithuania 0.56Ireland 0.48Guernsey 0.37
TOTAL 86.40
ECONOMIC BREAKDOWN AS A % OF NET ASSETS
Banks & credit institutions 41.50Finance & holding companies 14.32Supranational organisations 5.34Mortgage & funding institutions 4.07Countries & central governments 3.44Public, non-profit institutions 3.07Cantons, federal states 2.34Petroleum 2.10Electrical devices & components 2.02Cities & municipal authorities 1.77Telecommunications 1.44Miscellaneous unclassified companies 0.75Energy & water supply 0.74Tobacco & alcohol 0.73Pharmaceuticals, cosmetics & medical products 0.71Retail trade, department stores 0.57Real Estate 0.56Traffic & transportation 0.56Building industry & materials 0.37
TOTAL 86.40
29The notes are an integral part of the financial statements.
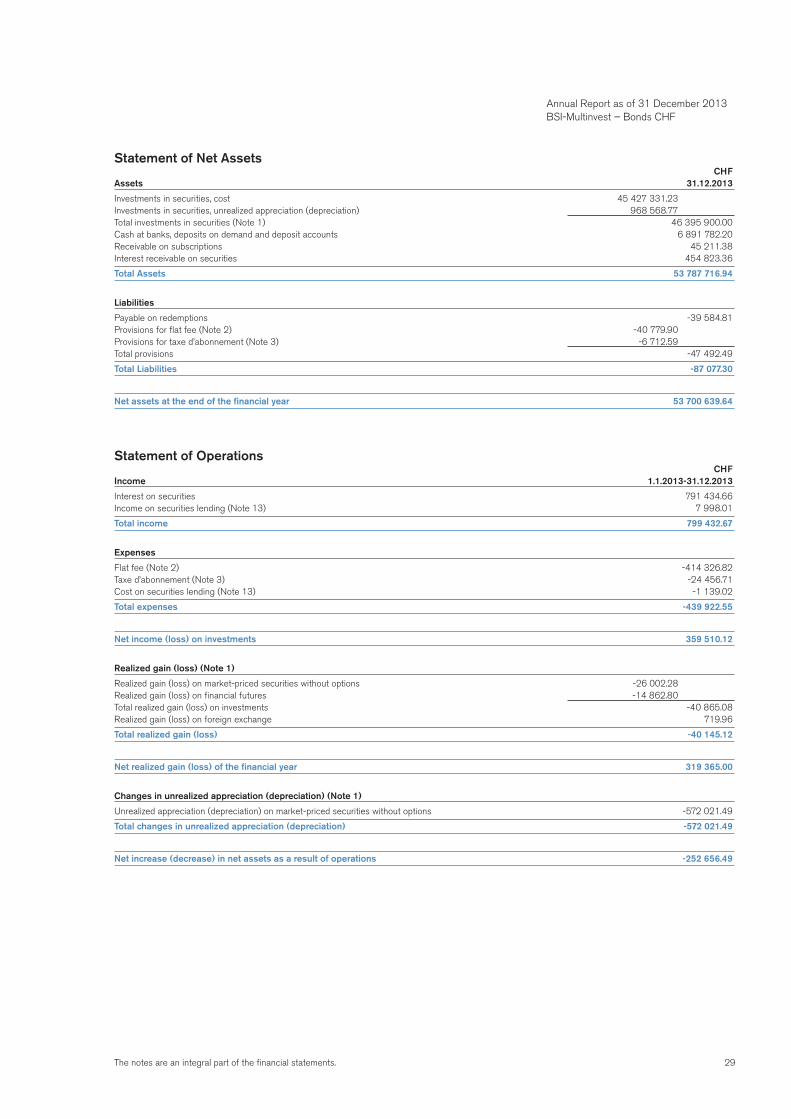
Statement of Net Assets CHFAssets 31.12.2013
Investments in securities, cost 45 427 331.23Investments in securities, unrealized appreciation (depreciation) 968 568.77Total investments in securities (Note 1) 46 395 900.00Cash at banks, deposits on demand and deposit accounts 6 891 782.20Receivable on subscriptions 45 211.38Interest receivable on securities 454 823.36
Total Assets 53 787 716.94
Liabilities
Payable on redemptions -39 584.81Provisions for flat fee (Note 2) -40 779.90Provisions for taxe d’abonnement (Note 3) -6 712.59Total provisions -47 492.49
Total Liabilities -87 077.30
Net assets at the end of the financial year 53 700 639.64
Statement of Operations CHFIncome 1.1.2013-31.12.2013
Interest on securities 791 434.66Income on securities lending (Note 13) 7 998.01
Total income 799 432.67
Expenses
Flat fee (Note 2) -414 326.82Taxe d’abonnement (Note 3) -24 456.71Cost on securities lending (Note 13) -1 139.02
Total expenses -439 922.55
Net income (loss) on investments 359 510.12
Realized gain (loss) (Note 1)
Realized gain (loss) on market-priced securities without options -26 002.28Realized gain (loss) on financial futures -14 862.80Total realized gain (loss) on investments -40 865.08Realized gain (loss) on foreign exchange 719.96
Total realized gain (loss) -40 145.12
Net realized gain (loss) of the financial year 319 365.00
Changes in unrealized appreciation (depreciation) (Note 1)
Unrealized appreciation (depreciation) on market-priced securities without options -572 021.49
Total changes in unrealized appreciation (depreciation) -572 021.49
Net increase (decrease) in net assets as a result of operations -252 656.49
Annual Report as of 31 December 2013 BSI-Multinvest – Bonds CHF
30 The notes are an integral part of the financial statements.
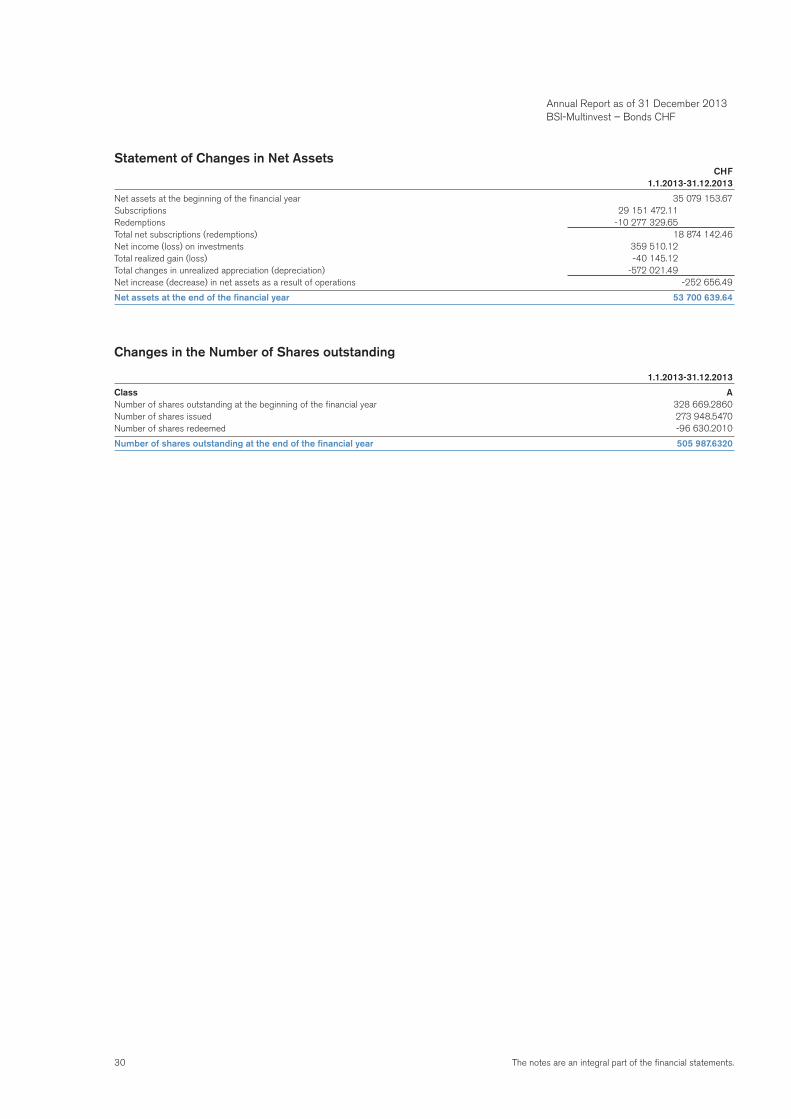
Statement of Changes in Net Assets CHF 1.1.2013-31.12.2013
Net assets at the beginning of the financial year 35 079 153.67Subscriptions 29 151 472.11Redemptions -10 277 329.65Total net subscriptions (redemptions) 18 874 142.46Net income (loss) on investments 359 510.12Total realized gain (loss) -40 145.12Total changes in unrealized appreciation (depreciation) -572 021.49Net increase (decrease) in net assets as a result of operations -252 656.49
Net assets at the end of the financial year 53 700 639.64
Changes in the Number of Shares outstanding
1.1.2013-31.12.2013
Class ANumber of shares outstanding at the beginning of the financial year 328 669.2860Number of shares issued 273 948.5470Number of shares redeemed -96 630.2010
Number of shares outstanding at the end of the financial year 505 987.6320
Annual Report as of 31 December 2013 BSI-Multinvest – Bonds CHF
31The notes are an integral part of the financial statements.
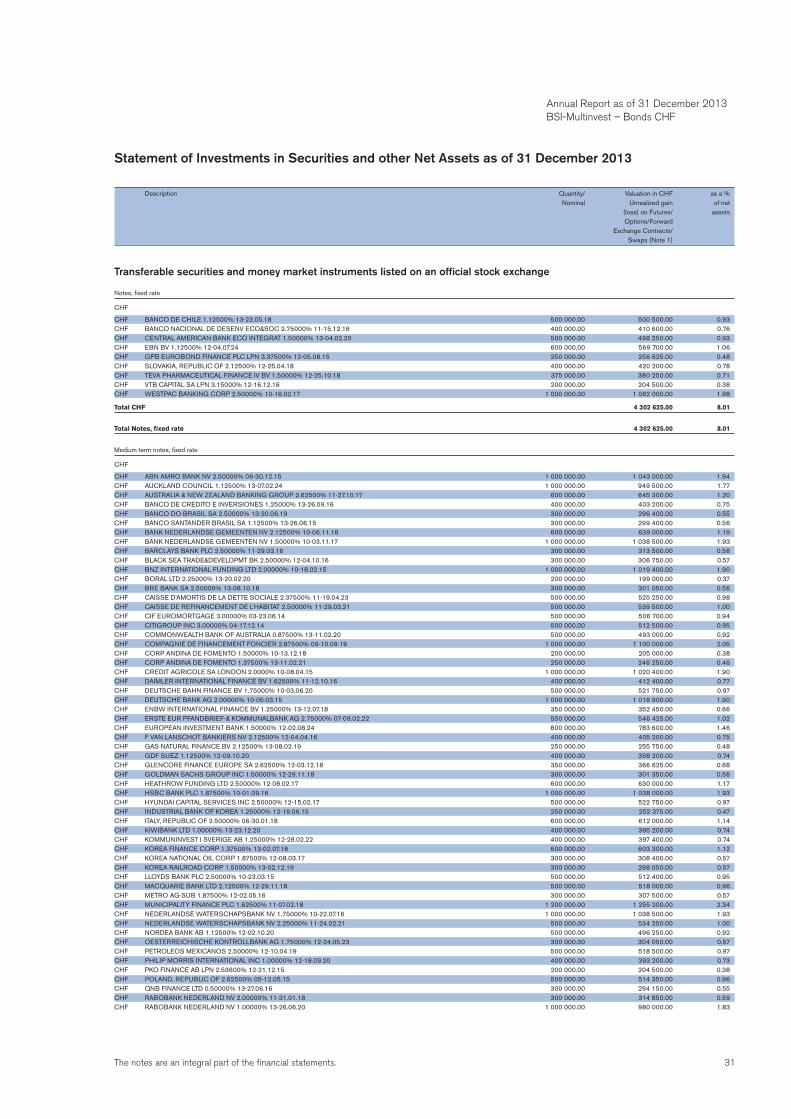
Statement of Investments in Securities and other Net Assets as of 31 December 2013
Description Quantity/ Valuation in CHF as a % Nominal Unrealized gain of net (loss) on Futures/ assets Options/Forward Exchange Contracts/ Swaps (Note 1)
Transferable securities and money market instruments listed on an official stock exchange
Notes, fixed rate
CHF
CHF BANCO DE CHILE 1.12500% 13-23.05.18 500 000.00 500 500.00 0.93CHF BANCO NACIONAL DE DESENV ECO&SOC 2.75000% 11-15.12.16 400 000.00 410 600.00 0.76CHF CENTRAL AMERICAN BANK ECO INTEGRAT 1.50000% 13-04.02.20 500 000.00 498 250.00 0.93CHF EBN BV 1.12500% 12-04.07.24 600 000.00 569 700.00 1.06CHF GPB EUROBOND FINANCE PLC LPN 3.37500% 12-05.08.15 250 000.00 256 625.00 0.48CHF SLOVAKIA, REPUBLIC OF 2.12500% 12-25.04.18 400 000.00 420 200.00 0.78CHF TEVA PHARMACEUTICAL FINANCE IV BV 1.50000% 12-25.10.18 375 000.00 380 250.00 0.71CHF VTB CAPITAL SA LPN 3.15000% 12-16.12.16 200 000.00 204 500.00 0.38CHF WESTPAC BANKING CORP 2.50000% 10-16.02.17 1 000 000.00 1 062 000.00 1.98
Total CHF 4 302 625.00 8.01
Total Notes, fixed rate 4 302 625.00 8.01
Medium term notes, fixed rate
CHF
CHF ABN AMRO BANK NV 2.50000% 06-30.12.15 1 000 000.00 1 043 000.00 1.94CHF AUCKLAND COUNCIL 1.12500% 13-07.02.24 1 000 000.00 949 500.00 1.77CHF AUSTRALIA & NEW ZEALAND BANKING GROUP 2.62500% 11-27.10.17 600 000.00 645 300.00 1.20CHF BANCO DE CREDITO E INVERSIONES 1.25000% 13-26.09.16 400 000.00 403 200.00 0.75CHF BANCO DO BRASIL SA 2.50000% 13-20.06.19 300 000.00 296 400.00 0.55CHF BANCO SANTANDER BRASIL SA 1.12500% 13-26.06.15 300 000.00 299 400.00 0.56CHF BANK NEDERLANDSE GEMEENTEN NV 2.12500% 10-06.11.18 600 000.00 639 000.00 1.19CHF BANK NEDERLANDSE GEMEENTEN NV 1.50000% 10-03.11.17 1 000 000.00 1 038 500.00 1.93CHF BARCLAYS BANK PLC 2.50000% 11-29.03.16 300 000.00 313 500.00 0.58CHF BLACK SEA TRADE&DEVELOPMT BK 2.50000% 12-04.10.16 300 000.00 306 750.00 0.57CHF BNZ INTERNATIONAL FUNDING LTD 2.00000% 10-18.02.15 1 000 000.00 1 019 400.00 1.90CHF BORAL LTD 2.25000% 13-20.02.20 200 000.00 199 000.00 0.37CHF BRE BANK SA 2.50000% 13-08.10.18 300 000.00 301 050.00 0.56CHF CAISSE D’AMORTIS DE LA DETTE SOCIALE 2.37500% 11-19.04.23 500 000.00 525 250.00 0.98CHF CAISSE DE REFINANCEMENT DE L’HABITAT 2.50000% 11-29.03.21 500 000.00 539 500.00 1.00CHF CIF EUROMORTGAGE 3.00000% 03-23.06.14 500 000.00 506 700.00 0.94CHF CITIGROUP INC 3.00000% 04-17.12.14 500 000.00 512 500.00 0.95CHF COMMONWEALTH BANK OF AUSTRALIA 0.87500% 13-11.02.20 500 000.00 493 000.00 0.92CHF COMPAGNIE DE FINANCEMENT FONCIER 2.87500% 09-10.09.19 1 000 000.00 1 100 000.00 2.05CHF CORP ANDINA DE FOMENTO 1.50000% 10-13.12.18 200 000.00 205 000.00 0.38CHF CORP ANDINA DE FOMENTO 1.37500% 13-11.02.21 250 000.00 246 250.00 0.46CHF CREDIT AGRICOLE SA LONDON 2.0000% 10-08.04.15 1 000 000.00 1 020 400.00 1.90CHF DAIMLER INTERNATIONAL FINANCE BV 1.62500% 11-12.10.16 400 000.00 412 400.00 0.77CHF DEUTSCHE BAHN FINANCE BV 1.75000% 10-03.06.20 500 000.00 521 750.00 0.97CHF DEUTSCHE BANK AG 2.00000% 10-05.03.15 1 000 000.00 1 018 900.00 1.90CHF ENBW INTERNATIONAL FINANCE BV 1.25000% 13-12.07.18 350 000.00 352 450.00 0.66CHF ERSTE EUR PFANDBRIEF-& KOMMUNALBANK AG 2.75000% 07-09.02.22 550 000.00 546 425.00 1.02CHF EUROPEAN INVESTMENT BANK 1.50000% 12-02.08.24 800 000.00 783 600.00 1.46CHF F VAN LANSCHOT BANKIERS NV 2.12500% 12-04.04.16 400 000.00 405 200.00 0.75CHF GAS NATURAL FINANCE BV 2.12500% 13-08.02.19 250 000.00 255 750.00 0.48CHF GDF SUEZ 1.12500% 12-09.10.20 400 000.00 398 200.00 0.74CHF GLENCORE FINANCE EUROPE SA 2.62500% 12-03.12.18 350 000.00 366 625.00 0.68CHF GOLDMAN SACHS GROUP INC 1.50000% 12-29.11.18 300 000.00 301 350.00 0.56CHF HEATHROW FUNDING LTD 2.50000% 12-08.02.17 600 000.00 630 000.00 1.17CHF HSBC BANK PLC 1.87500% 10-01.09.16 1 000 000.00 1 038 000.00 1.93CHF HYUNDAI CAPITAL SERVICES INC 2.50000% 12-15.02.17 500 000.00 522 750.00 0.97CHF INDUSTRIAL BANK OF KOREA 1.25000% 12-19.06.15 250 000.00 252 375.00 0.47CHF ITALY, REPUBLIC OF 2.50000% 06-30.01.18 600 000.00 612 000.00 1.14CHF KIWIBANK LTD 1.00000% 13-23.12.20 400 000.00 395 200.00 0.74CHF KOMMUNINVEST I SVERIGE AB 1.25000% 12-28.02.22 400 000.00 397 400.00 0.74CHF KOREA FINANCE CORP 1.37500% 13-02.07.18 600 000.00 603 300.00 1.12CHF KOREA NATIONAL OIL CORP 1.87500% 12-08.03.17 300 000.00 308 400.00 0.57CHF KOREA RAILROAD CORP 1.50000% 13-02.12.19 300 000.00 298 050.00 0.57CHF LLOYDS BANK PLC 2.50000% 10-23.03.15 500 000.00 512 400.00 0.95CHF MACQUARIE BANK LTD 2.12500% 12-29.11.18 500 000.00 518 000.00 0.96CHF METRO AG-SUB 1.87500% 12-02.05.16 300 000.00 307 500.00 0.57CHF MUNICIPALITY FINANCE PLC 1.62500% 11-07.02.18 1 200 000.00 1 255 200.00 2.34CHF NEDERLANDSE WATERSCHAPSBANK NV 1.75000% 10-22.07.16 1 000 000.00 1 038 500.00 1.93CHF NEDERLANDSE WATERSCHAPSBANK NV 2.25000% 11-24.02.21 500 000.00 534 250.00 1.00CHF NORDEA BANK AB 1.12500% 12-02.10.20 500 000.00 496 250.00 0.92CHF OESTERREICHISCHE KONTROLLBANK AG 1.75000% 12-24.05.23 300 000.00 304 050.00 0.57CHF PETROLEOS MEXICANOS 2.50000% 12-10.04.19 500 000.00 518 500.00 0.97CHF PHILIP MORRIS INTERNATIONAL INC 1.00000% 12-18.09.20 400 000.00 393 200.00 0.73CHF PKO FINANCE AB LPN 2.53600% 12-21.12.15 200 000.00 204 500.00 0.38CHF POLAND, REPUBLIC OF 2.62500% 05-12.05.15 500 000.00 514 350.00 0.96CHF QNB FINANCE LTD 0.50000% 13-27.06.16 300 000.00 294 150.00 0.55CHF RABOBANK NEDERLAND NV 2.00000% 11-31.01.18 300 000.00 314 850.00 0.59CHF RABOBANK NEDERLAND NV 1.00000% 13-26.06.20 1 000 000.00 980 000.00 1.83
Annual Report as of 31 December 2013 BSI-Multinvest – Bonds CHF
32 The notes are an integral part of the financial statements.
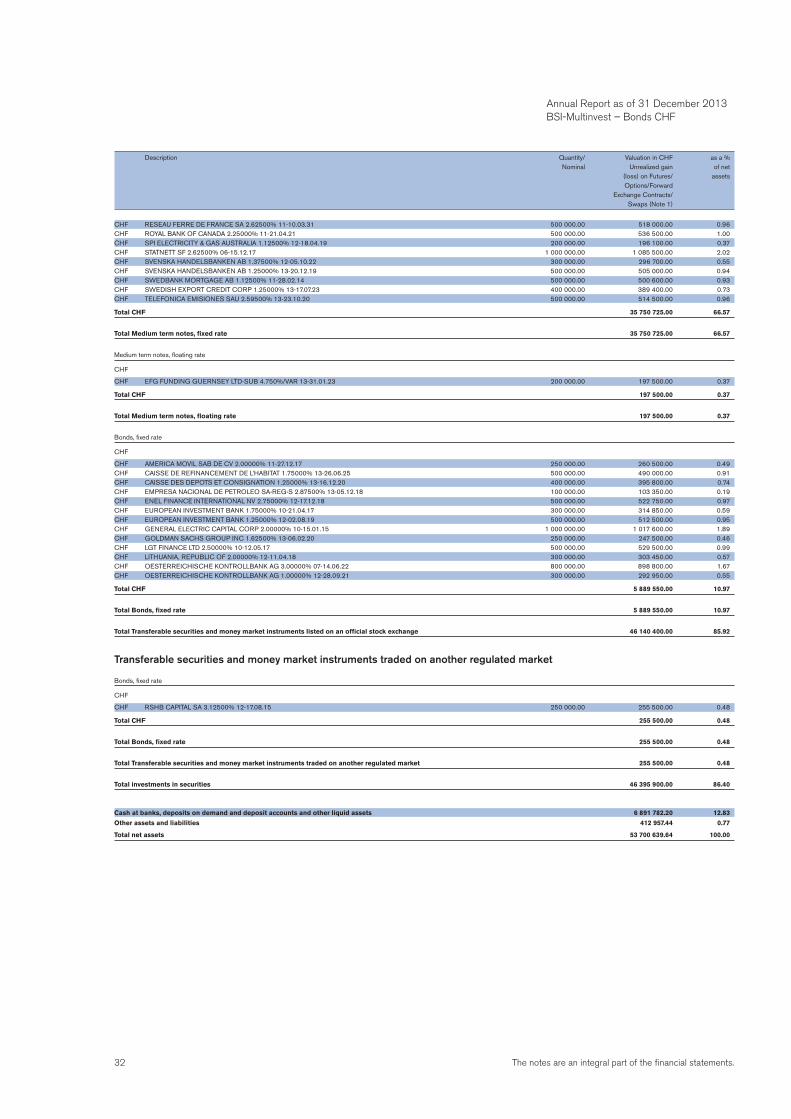
CHF RESEAU FERRE DE FRANCE SA 2.62500% 11-10.03.31 500 000.00 518 000.00 0.96CHF ROYAL BANK OF CANADA 2.25000% 11-21.04.21 500 000.00 536 500.00 1.00CHF SPI ELECTRICITY & GAS AUSTRALIA 1.12500% 12-18.04.19 200 000.00 196 100.00 0.37CHF STATNETT SF 2.62500% 06-15.12.17 1 000 000.00 1 085 500.00 2.02CHF SVENSKA HANDELSBANKEN AB 1.37500% 12-05.10.22 300 000.00 296 700.00 0.55CHF SVENSKA HANDELSBANKEN AB 1.25000% 13-20.12.19 500 000.00 505 000.00 0.94CHF SWEDBANK MORTGAGE AB 1.12500% 11-28.02.14 500 000.00 500 600.00 0.93CHF SWEDISH EXPORT CREDIT CORP 1.25000% 13-17.07.23 400 000.00 389 400.00 0.73CHF TELEFONICA EMISIONES SAU 2.59500% 13-23.10.20 500 000.00 514 500.00 0.96
Total CHF 35 750 725.00 66.57
Total Medium term notes, fixed rate 35 750 725.00 66.57
Medium term notes, floating rate
CHF
CHF EFG FUNDING GUERNSEY LTD-SUB 4.750%/VAR 13-31.01.23 200 000.00 197 500.00 0.37
Total CHF 197 500.00 0.37
Total Medium term notes, floating rate 197 500.00 0.37
Bonds, fixed rate
CHF
CHF AMERICA MOVIL SAB DE CV 2.00000% 11-27.12.17 250 000.00 260 500.00 0.49CHF CAISSE DE REFINANCEMENT DE L’HABITAT 1.75000% 13-26.06.25 500 000.00 490 000.00 0.91CHF CAISSE DES DEPOTS ET CONSIGNATION 1.25000% 13-16.12.20 400 000.00 395 800.00 0.74CHF EMPRESA NACIONAL DE PETROLEO SA-REG-S 2.87500% 13-05.12.18 100 000.00 103 350.00 0.19CHF ENEL FINANCE INTERNATIONAL NV 2.75000% 12-17.12.18 500 000.00 522 750.00 0.97CHF EUROPEAN INVESTMENT BANK 1.75000% 10-21.04.17 300 000.00 314 850.00 0.59CHF EUROPEAN INVESTMENT BANK 1.25000% 12-02.08.19 500 000.00 512 500.00 0.95CHF GENERAL ELECTRIC CAPITAL CORP 2.00000% 10-15.01.15 1 000 000.00 1 017 600.00 1.89CHF GOLDMAN SACHS GROUP INC 1.62500% 13-06.02.20 250 000.00 247 500.00 0.46CHF LGT FINANCE LTD 2.50000% 10-12.05.17 500 000.00 529 500.00 0.99CHF LITHUANIA, REPUBLIC OF 2.00000% 12-11.04.18 300 000.00 303 450.00 0.57CHF OESTERREICHISCHE KONTROLLBANK AG 3.00000% 07-14.06.22 800 000.00 898 800.00 1.67CHF OESTERREICHISCHE KONTROLLBANK AG 1.00000% 12-28.09.21 300 000.00 292 950.00 0.55
Total CHF 5 889 550.00 10.97
Total Bonds, fixed rate 5 889 550.00 10.97
Total Transferable securities and money market instruments listed on an official stock exchange 46 140 400.00 85.92
Transferable securities and money market instruments traded on another regulated market
Bonds, fixed rate
CHF
CHF RSHB CAPITAL SA 3.12500% 12-17.08.15 250 000.00 255 500.00 0.48
Total CHF 255 500.00 0.48
Total Bonds, fixed rate 255 500.00 0.48
Total Transferable securities and money market instruments traded on another regulated market 255 500.00 0.48
Total investments in securities 46 395 900.00 86.40
Cash at banks, deposits on demand and deposit accounts and other liquid assets 6 891 782.20 12.83
Other assets and liabilities 412 957.44 0.77
Total net assets 53 700 639.64 100.00
Description Quantity/ Valuation in CHF as a % Nominal Unrealized gain of net (loss) on Futures/ assets Options/Forward Exchange Contracts/ Swaps (Note 1)
Annual Report as of 31 December 2013 BSI-Multinvest – Bonds CHF
33The notes are an integral part of the financial statements.
Annual Report as of 31 December 2013
BSI-Multinvest – Bonds EUR
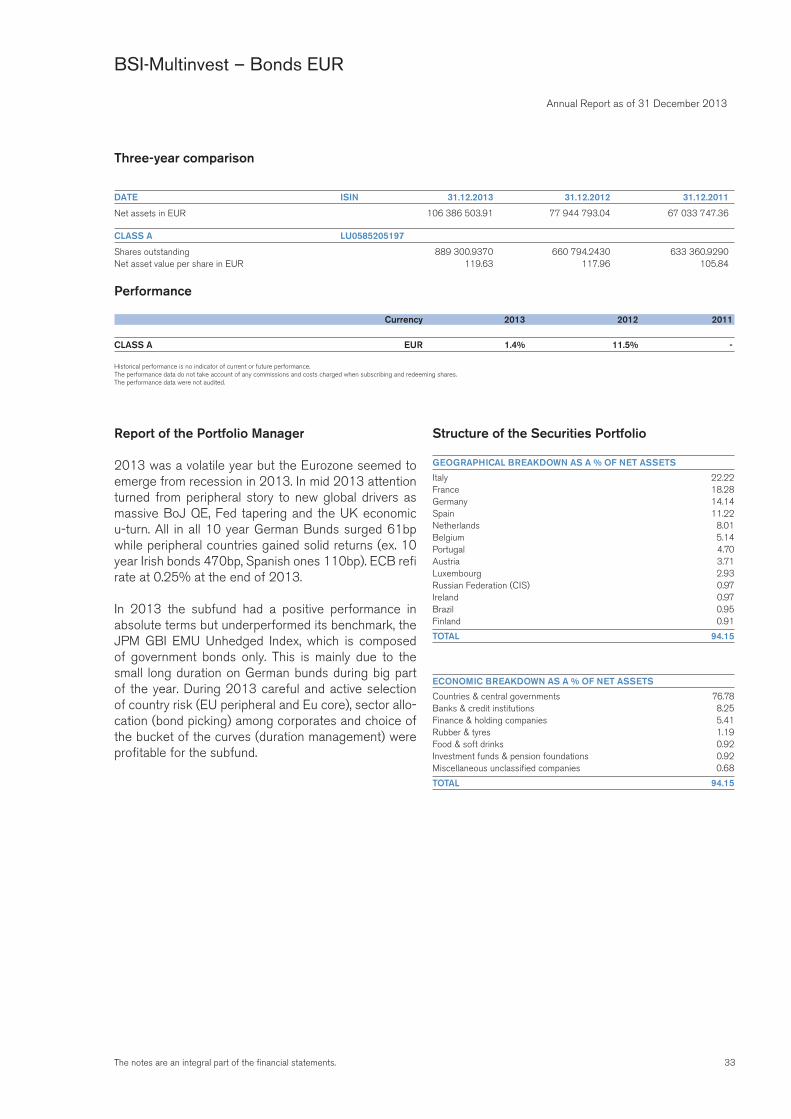
Three-year comparison
DATE ISIN 31.12.2013 31.12.2012 31.12.2011
Net assets in EUR 106 386 503.91 77 944 793.04 67 033 747.36
CLASS A LU0585205197
Shares outstanding 889 300.9370 660 794.2430 633 360.9290Net asset value per share in EUR 119.63 117.96 105.84
Performance
Currency 2013 2012 2011
CLASS A EUR 1.4% 11.5% -
Historical performance is no indicator of current or future performance.The performance data do not take account of any commissions and costs charged when subscribing and redeeming shares.The performance data were not audited.
Report of the Portfolio Manager
2013 was a volatile year but the Eurozone seemed to emerge from recession in 2013. In mid 2013 attention turned from peripheral story to new global drivers as massive BoJ QE, Fed tapering and the UK economic u-turn. All in all 10 year German Bunds surged 61bp while peripheral countries gained solid returns (ex. 10 year Irish bonds 470bp, Spanish ones 110bp). ECB refi rate at 0.25% at the end of 2013.
In 2013 the subfund had a positive performance in absolute terms but underperformed its benchmark, the JPM GBI EMU Unhedged Index, which is composed of government bonds only. This is mainly due to the small long duration on German bunds during big part of the year. During 2013 careful and active selection of country risk (EU peripheral and Eu core), sector allo-cation (bond picking) among corporates and choice of the bucket of the curves (duration management) were profitable for the subfund.
Structure of the Securities Portfolio
GEOGRAPHICAL BREAKDOWN AS A % OF NET ASSETS
Italy 22.22France 18.28Germany 14.14Spain 11.22Netherlands 8.01Belgium 5.14Portugal 4.70Austria 3.71Luxembourg 2.93Russian Federation (CIS) 0.97Ireland 0.97Brazil 0.95Finland 0.91
TOTAL 94.15
ECONOMIC BREAKDOWN AS A % OF NET ASSETS
Countries & central governments 76.78Banks & credit institutions 8.25Finance & holding companies 5.41Rubber & tyres 1.19Food & soft drinks 0.92Investment funds & pension foundations 0.92Miscellaneous unclassified companies 0.68
TOTAL 94.15
34 The notes are an integral part of the financial statements.
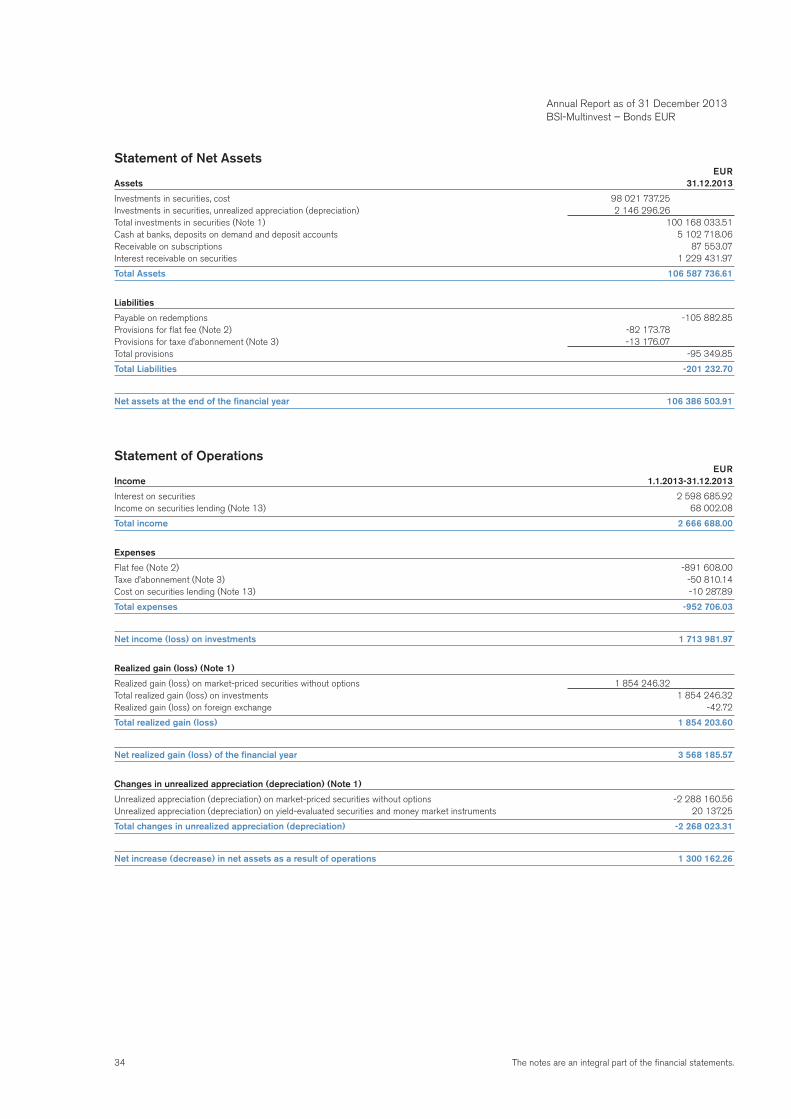
Statement of Net Assets EURAssets 31.12.2013
Investments in securities, cost 98 021 737.25Investments in securities, unrealized appreciation (depreciation) 2 146 296.26Total investments in securities (Note 1) 100 168 033.51Cash at banks, deposits on demand and deposit accounts 5 102 718.06Receivable on subscriptions 87 553.07Interest receivable on securities 1 229 431.97
Total Assets 106 587 736.61
Liabilities
Payable on redemptions -105 882.85Provisions for flat fee (Note 2) -82 173.78Provisions for taxe d’abonnement (Note 3) -13 176.07Total provisions -95 349.85
Total Liabilities -201 232.70
Net assets at the end of the financial year 106 386 503.91
Statement of Operations EURIncome 1.1.2013-31.12.2013
Interest on securities 2 598 685.92Income on securities lending (Note 13) 68 002.08
Total income 2 666 688.00
Expenses
Flat fee (Note 2) -891 608.00Taxe d’abonnement (Note 3) -50 810.14Cost on securities lending (Note 13) -10 287.89
Total expenses -952 706.03
Net income (loss) on investments 1 713 981.97
Realized gain (loss) (Note 1)
Realized gain (loss) on market-priced securities without options 1 854 246.32Total realized gain (loss) on investments 1 854 246.32Realized gain (loss) on foreign exchange -42.72
Total realized gain (loss) 1 854 203.60
Net realized gain (loss) of the financial year 3 568 185.57
Changes in unrealized appreciation (depreciation) (Note 1)
Unrealized appreciation (depreciation) on market-priced securities without options -2 288 160.56Unrealized appreciation (depreciation) on yield-evaluated securities and money market instruments 20 137.25
Total changes in unrealized appreciation (depreciation) -2 268 023.31
Net increase (decrease) in net assets as a result of operations 1 300 162.26
Annual Report as of 31 December 2013 BSI-Multinvest – Bonds EUR
35The notes are an integral part of the financial statements.
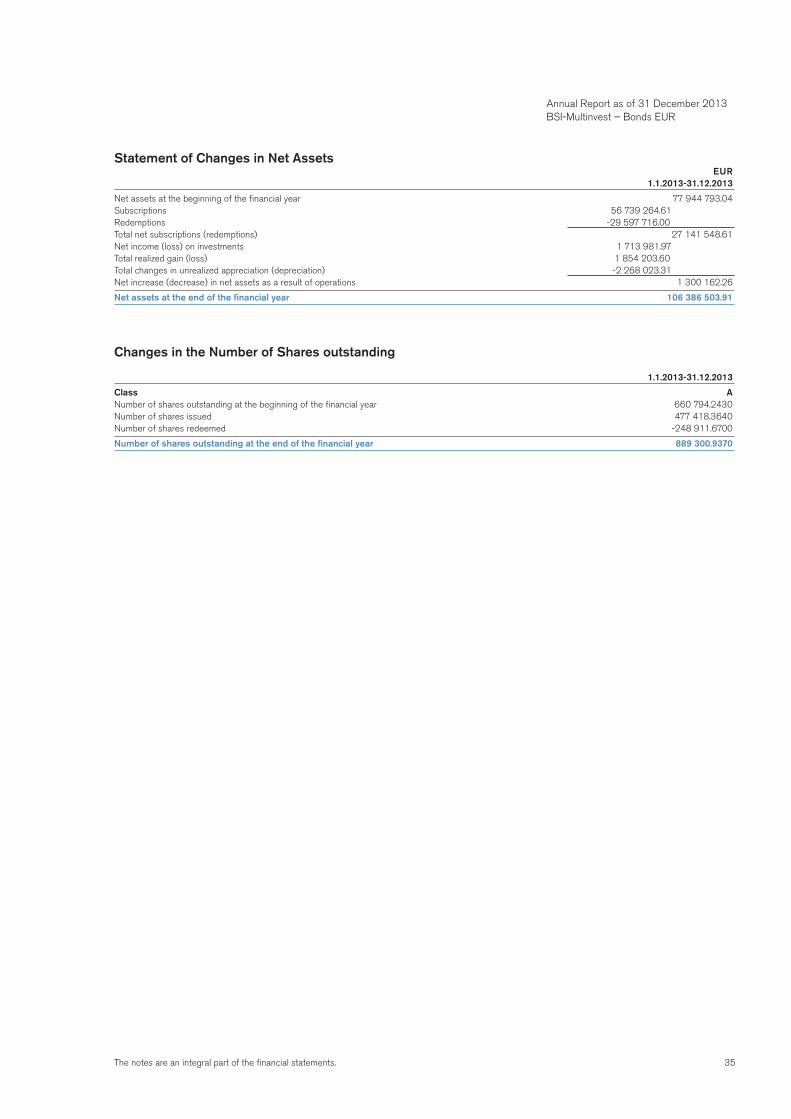
Statement of Changes in Net Assets EUR 1.1.2013-31.12.2013
Net assets at the beginning of the financial year 77 944 793.04Subscriptions 56 739 264.61Redemptions -29 597 716.00Total net subscriptions (redemptions) 27 141 548.61Net income (loss) on investments 1 713 981.97Total realized gain (loss) 1 854 203.60Total changes in unrealized appreciation (depreciation) -2 268 023.31Net increase (decrease) in net assets as a result of operations 1 300 162.26
Net assets at the end of the financial year 106 386 503.91
Changes in the Number of Shares outstanding
1.1.2013-31.12.2013
Class ANumber of shares outstanding at the beginning of the financial year 660 794.2430Number of shares issued 477 418.3640Number of shares redeemed -248 911.6700
Number of shares outstanding at the end of the financial year 889 300.9370
Annual Report as of 31 December 2013 BSI-Multinvest – Bonds EUR
36 The notes are an integral part of the financial statements.
Statement of Investments in Securities and other Net Assets as of 31 December 2013
Description Quantity/ Valuation in EUR as a % Nominal Unrealized gain of net (loss) on Futures/ assets Options/Forward Exchange Contracts/ Swaps (Note 1)
Transferable securities and money market instruments listed on an official stock exchange
Notes, fixed rate
EUR
EUR BELGIUM, KINGDOM OF-REG-S 4.00000% 12-28.03.32 500 000.00 549 125.00 0.51EUR BELGIUM, KINGDOM OF-REG-S 1.25000% 13-22.06.18 2 000 000.00 2 000 700.01 1.88
Total EUR 2 549 825.01 2.39
Total Notes, fixed rate 2 549 825.01 2.39
Medium term notes, fixed rate
EUR
EUR AUSTRIA, REPUBLIC OF-REG-S-144A 3.50000% 05-15.09.21 1 000 000.00 1 115 600.00 1.05EUR BANCO DO BRASIL SA-REG-S 3.75000% 13-25.07.18 1 000 000.00 1 011 760.00 0.95EUR BMW FINANCE NV 3.25000% 12-14.01.19 1 400 000.00 1 503 726.00 1.41EUR COCA-COLA HBC FINANCE BV 2.37500% 13-18.06.20 1 100 000.00 1 088 758.00 1.02EUR CONTINENTAL AG-REG-S 3.00000% 13-16.07.18 1 200 000.00 1 262 532.00 1.19EUR DANONE 1.37500% 13-10.06.19 1 000 000.00 978 130.00 0.92EUR FIAT FINANCE & TRADE LTD SA-REG-S 7.00000% 12-23.03.17 1 000 000.00 1 093 000.00 1.03EUR GAZ CAPITAL SA/GAZPROM LPN-REG-S 3.75500% 12-15.03.17 1 000 000.00 1 042 780.00 0.98EUR KREDITANSTALT FUER WIEDERAUFBAU 2.50000% 12-17.01.22 3 000 000.00 3 149 100.00 2.96EUR KREDITANSTALT FUER WIEDERAUFBAU 2.12500% 13-15.08.23 2 000 000.00 2 002 740.00 1.88EUR SANTANDER INTERNATIONAL DEBT SA-REG-S 4.62500% 12-21.03.16 1 500 000.00 1 600 275.00 1.51EUR VIER GAS TRANSPORT GMBH-REG-S 2.00000% 13-12.06.20 750 000.00 738 472.50 0.69EUR VOLKSWAGEN INTERNATIONAL FIN NV 1.87500% 12-15.05.17 1 000 000.00 1 023 910.00 0.96
Total EUR 17 610 783.50 16.55
Total Medium term notes, fixed rate 17 610 783.50 16.55
Bonds, fixed rate
EUR
EUR AUSTRIA, REPUBLIC OF-REG-S 1.75000% 13-20.10.23 2 000 000.00 1 908 900.00 1.79EUR AUSTRIA, REPUBLIC OF 2.40000% 13-23.05.34 1 000 000.00 924 550.00 0.87EUR BELGIUM, KINGDOM OF-REG-S 2.25000% 13-22.06.23 3 000 000.00 2 923 200.00 2.75EUR CREDIT AGRICOLE SA LONDON 1.87500% 12-18.10.17 1 000 000.00 1 015 910.00 0.96EUR FINLAND, REPUBLIC OF 1.62500% 12-15.09.22 1 000 000.00 967 600.00 0.91EUR FRANCE, REPUBLIC OF OAT 2.50000% 10-25.10.20 4 000 000.00 4 204 600.00 3.95EUR FRANCE, REPUBLIC OF OAT 2.25000% 12-25.10.22 1 000 000.00 1 001 200.00 0.94EUR FRANCE, REPUBLIC OF-OAT 4.00000% 06-25.10.38 1 000 000.00 1 112 350.00 1.05EUR FRANCE, REPUBLIC OF-OAT 2.75000% 12-25.10.27 3 000 000.00 2 937 000.00 2.76EUR FRANCE, REPUBLIC OF-OAT-REG-S 3.25000% 12-25.05.45 1 500 000.00 1 440 075.00 1.35EUR FRANCE, REPUBLIC OF-OAT 1.75000% 13-25.05.23 4 000 000.00 3 795 200.00 3.57EUR FRANCE, REPUBLIC OF-OAT 1.00000% 13-25.11.18 3 000 000.00 2 968 800.00 2.79EUR GERMANY, REPUBLIC OF 1.50000% 13-15.05.23 2 000 000.00 1 932 300.00 1.82EUR GERMANY, REPUBLIC OF 2.00000% 11-04.01.22 3 000 000.00 3 088 950.00 2.90EUR GERMANY, REPUBLIC OF 2.50000% 12-04.07.44 2 000 000.00 1 893 600.00 1.78EUR GERMANY, REPUBLIC OF 1.50000% 12-04.09.22 1 000 000.00 980 200.00 0.92EUR IRELAND, REPUBLIC OF-REG-S 3.90000% 13-20.03.23 1 000 000.00 1 029 900.00 0.97EUR ITALY, REPUBLIC OF 3.75000% 06-01.08.21 3 000 000.00 3 067 950.00 2.88EUR ITALY, REPUBLIC OF BTP 3.00000% 10-15.06.15 2 000 000.00 2 050 800.00 1.93EUR ITALY, REPUBLIC OF BTP 3.75000% 10-01.03.21 3 000 000.00 3 070 350.00 2.89EUR ITALY, REPUBLIC OF BTP 4.50000% 13-01.05.23 3 000 000.00 3 137 100.00 2.95EUR ITALY, REPUBLIC OF-BTP 5.00000% 09-01.09.40 1 500 000.00 1 540 650.00 1.45EUR ITALY, REPUBLIC OF-BTP 5.00000% 11-01.03.22 3 000 000.00 3 279 000.00 3.08EUR ITALY, REPUBLIC OF-BTP 2.25000% 13-15.05.16 3 500 000.00 3 553 200.00 3.34EUR ITALY, REPUBLIC OF-BTP 4.75000% 13-01.09.44 1 000 000.00 988 950.00 0.93EUR NETHERLANDS, KINGDOM OF THE 2.25000% 12-15.07.22 2 000 000.00 2 035 000.00 1.91EUR NETHERLANDS, KINGDOM OF THE 2.50000% 12-15.01.33 1 000 000.00 950 450.00 0.89EUR NETHERLANDS, KINGDOM OF THE-144A-REG-S 1.75000% 13-15.07.23 2 000 000.00 1 917 700.00 1.80EUR PORTUGAL, REPUBLIC OF-OT 3.35000% 05-15.10.15 2 000 000.00 2 000 700.00 1.88EUR PORTUGAL, REPUBLIC OF-OT 4.20000% 06-15.10.16 1 000 000.00 1 003 200.00 0.94EUR PORTUGAL, REPUBLIC OF-OT 4.35000% 07-16.10.17 1 000 000.00 988 450.00 0.93EUR PORTUGAL, REPUBLIC OF 3.6000% 09-15.10.14 1 000 000.00 1 008 500.00 0.95EUR RUSSIA, FEDERATION OF-REG-S 3.62500% 13-16.09.20 1 000 000.00 1 030 480.00 0.97EUR SPAIN, KINGDOM OF 3.00000% 10-30.04.15 1 000 000.00 1 022 450.00 0.96EUR SPAIN, KINGDOM OF 3.30000% 13-30.07.16 1 000 000.00 1 033 750.00 0.97EUR SPAIN, KINGDOM OF 4.70000% 09-30.07.41 1 000 000.00 960 950.00 0.90EUR SPAIN, KINGDOM OF 4.00000% 10-30.04.20 3 000 000.00 3 113 850.00 2.93EUR SPAIN, KINGDOM OF 4.65000% 10-30.07.25 1 000 000.00 1 026 000.00 0.97EUR SPAIN, KINGDOM OF 4.85000% 10-31.10.20 1 000 000.00 1 082 650.00 1.02EUR SPAIN, KINGDOM OF 4.50000% 12-31.01.18 1 000 000.00 1 075 850.00 1.01EUR SPAIN, KINGDOM OF-144A-REG-S 4.40000% 13-31.10.23 1 000 000.00 1 019 600.00 0.96
Total EUR 76 081 915.00 71.52
Total Bonds, fixed rate 76 081 915.00 71.52
Annual Report as of 31 December 2013 BSI-Multinvest – Bonds EUR
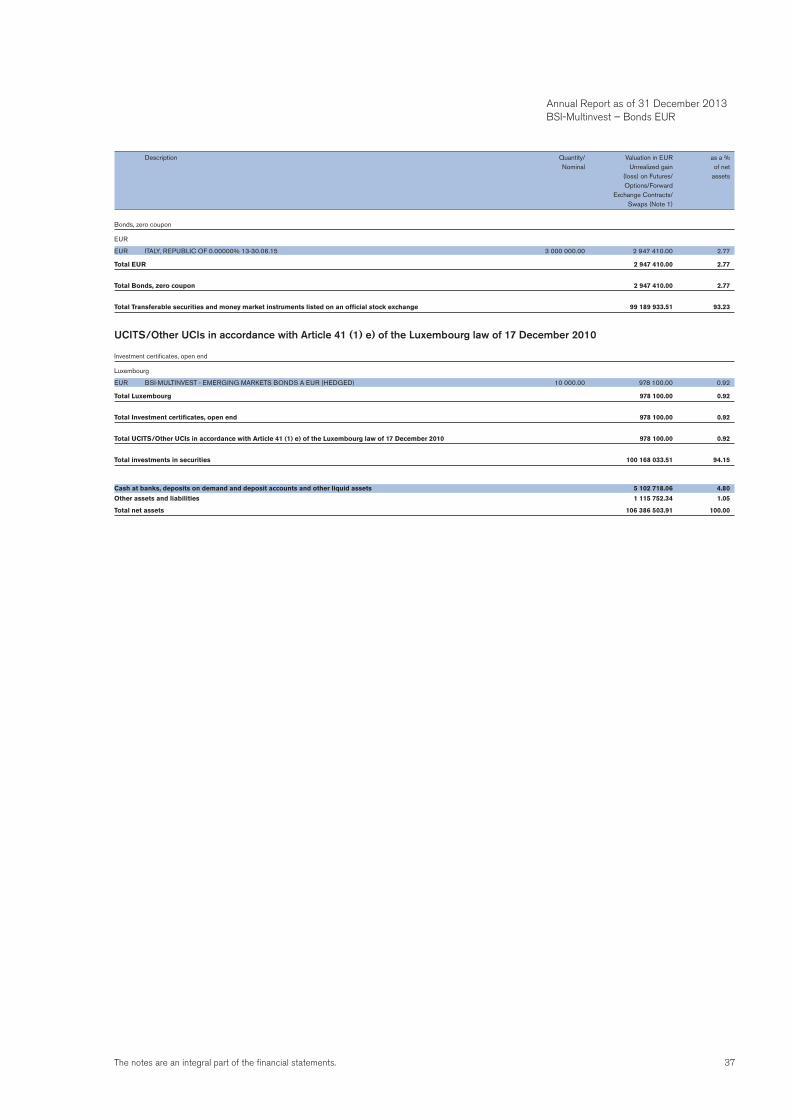
37The notes are an integral part of the financial statements.
Bonds, zero coupon
EUR
EUR ITALY, REPUBLIC OF 0.00000% 13-30.06.15 3 000 000.00 2 947 410.00 2.77
Total EUR 2 947 410.00 2.77
Total Bonds, zero coupon 2 947 410.00 2.77
Total Transferable securities and money market instruments listed on an official stock exchange 99 189 933.51 93.23
UCITS/Other UCIs in accordance with Article 41 (1) e) of the Luxembourg law of 17 December 2010
Investment certificates, open end
Luxembourg
EUR BSI-MULTINVEST - EMERGING MARKETS BONDS A EUR (HEDGED) 10 000.00 978 100.00 0.92
Total Luxembourg 978 100.00 0.92
Total Investment certificates, open end 978 100.00 0.92
Total UCITS/Other UCIs in accordance with Article 41 (1) e) of the Luxembourg law of 17 December 2010 978 100.00 0.92
Total investments in securities 100 168 033.51 94.15
Cash at banks, deposits on demand and deposit accounts and other liquid assets 5 102 718.06 4.80
Other assets and liabilities 1 115 752.34 1.05
Total net assets 106 386 503.91 100.00
Description Quantity/ Valuation in EUR as a % Nominal Unrealized gain of net (loss) on Futures/ assets Options/Forward Exchange Contracts/ Swaps (Note 1)
Annual Report as of 31 December 2013 BSI-Multinvest – Bonds EUR
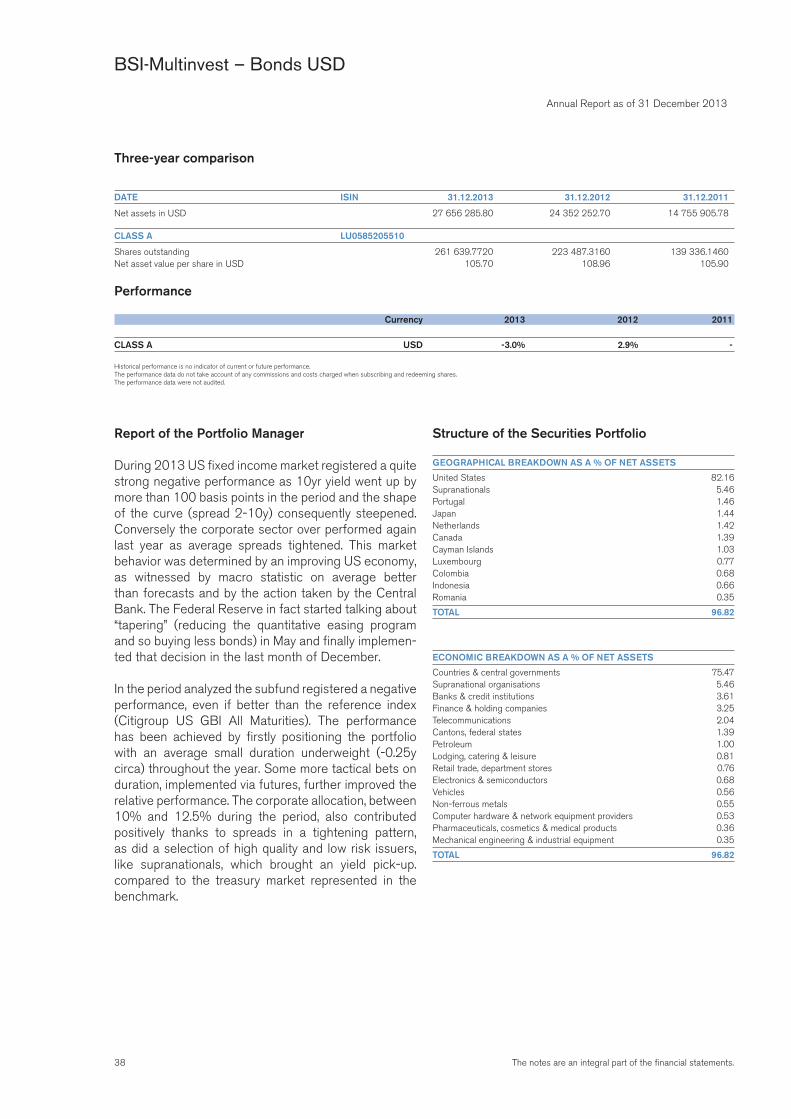
38 The notes are an integral part of the financial statements.
Annual Report as of 31 December 2013
BSI-Multinvest – Bonds USD
Three-year comparison
DATE ISIN 31.12.2013 31.12.2012 31.12.2011
Net assets in USD 27 656 285.80 24 352 252.70 14 755 905.78
CLASS A LU0585205510
Shares outstanding 261 639.7720 223 487.3160 139 336.1460Net asset value per share in USD 105.70 108.96 105.90
Performance
Currency 2013 2012 2011
CLASS A USD -3.0% 2.9% -
Historical performance is no indicator of current or future performance.The performance data do not take account of any commissions and costs charged when subscribing and redeeming shares.The performance data were not audited.
Report of the Portfolio Manager
During 2013 US fixed income market registered a quite strong negative performance as 10yr yield went up by more than 100 basis points in the period and the shape of the curve (spread 2-10y) consequently steepened. Conversely the corporate sector over performed again last year as average spreads tightened. This market behavior was determined by an improving US economy, as witnessed by macro statistic on average better than forecasts and by the action taken by the Central Bank. The Federal Reserve in fact started talking about “tapering” (reducing the quantitative easing program and so buying less bonds) in May and finally implemen-ted that decision in the last month of December.
In the period analyzed the subfund registered a negative performance, even if better than the reference index (Citigroup US GBI All Maturities). The performance has been achieved by firstly positioning the portfolio with an average small duration underweight (-0.25y circa) throughout the year. Some more tactical bets on duration, implemented via futures, further improved the relative performance. The corporate allocation, between 10% and 12.5% during the period, also contributed positively thanks to spreads in a tightening pattern, as did a selection of high quality and low risk issuers, like supranationals, which brought an yield pick-up.compared to the treasury market represented in the benchmark.
Structure of the Securities Portfolio
GEOGRAPHICAL BREAKDOWN AS A % OF NET ASSETS
United States 82.16Supranationals 5.46Portugal 1.46Japan 1.44Netherlands 1.42Canada 1.39Cayman Islands 1.03Luxembourg 0.77Colombia 0.68Indonesia 0.66Romania 0.35
TOTAL 96.82
ECONOMIC BREAKDOWN AS A % OF NET ASSETS
Countries & central governments 75.47Supranational organisations 5.46Banks & credit institutions 3.61Finance & holding companies 3.25Telecommunications 2.04Cantons, federal states 1.39Petroleum 1.00Lodging, catering & leisure 0.81Retail trade, department stores 0.76Electronics & semiconductors 0.68Vehicles 0.56Non-ferrous metals 0.55Computer hardware & network equipment providers 0.53Pharmaceuticals, cosmetics & medical products 0.36Mechanical engineering & industrial equipment 0.35
TOTAL 96.82
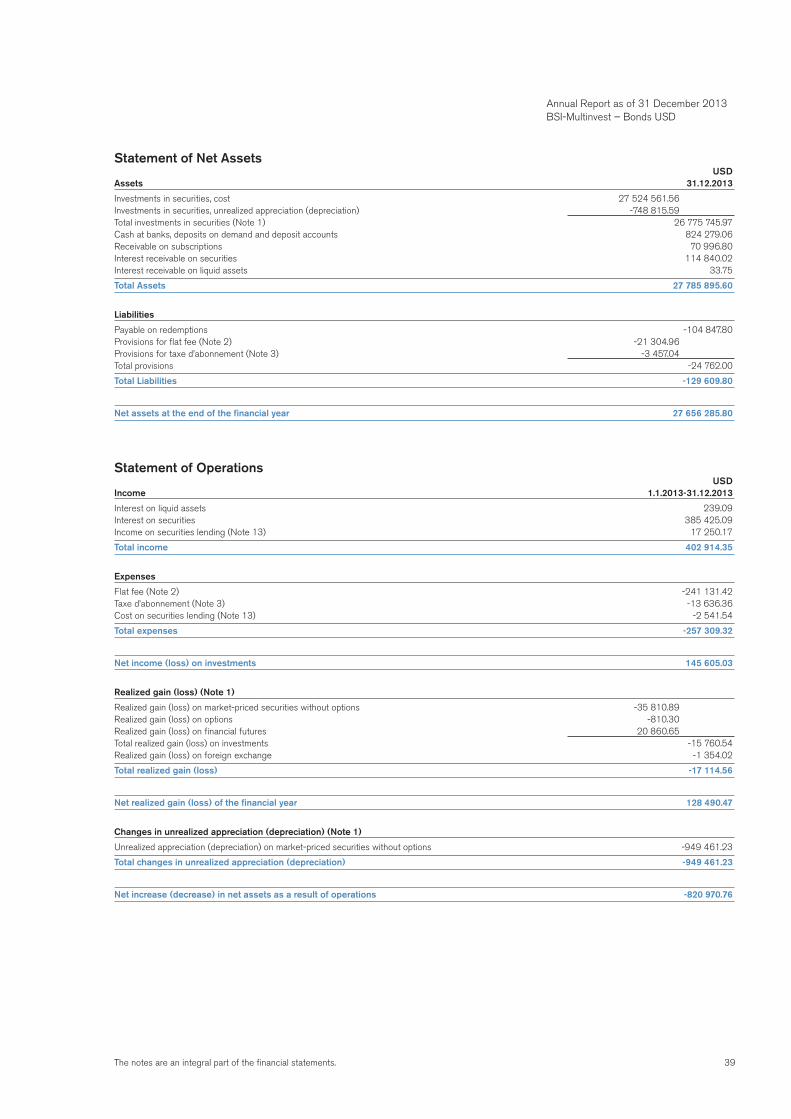
39The notes are an integral part of the financial statements.
Statement of Net Assets USDAssets 31.12.2013
Investments in securities, cost 27 524 561.56Investments in securities, unrealized appreciation (depreciation) -748 815.59Total investments in securities (Note 1) 26 775 745.97Cash at banks, deposits on demand and deposit accounts 824 279.06Receivable on subscriptions 70 996.80Interest receivable on securities 114 840.02Interest receivable on liquid assets 33.75
Total Assets 27 785 895.60
Liabilities
Payable on redemptions -104 847.80Provisions for flat fee (Note 2) -21 304.96Provisions for taxe d’abonnement (Note 3) -3 457.04Total provisions -24 762.00
Total Liabilities -129 609.80
Net assets at the end of the financial year 27 656 285.80
Statement of Operations USDIncome 1.1.2013-31.12.2013
Interest on liquid assets 239.09Interest on securities 385 425.09Income on securities lending (Note 13) 17 250.17
Total income 402 914.35
Expenses
Flat fee (Note 2) -241 131.42Taxe d’abonnement (Note 3) -13 636.36Cost on securities lending (Note 13) -2 541.54
Total expenses -257 309.32
Net income (loss) on investments 145 605.03
Realized gain (loss) (Note 1)
Realized gain (loss) on market-priced securities without options -35 810.89Realized gain (loss) on options -810.30Realized gain (loss) on financial futures 20 860.65Total realized gain (loss) on investments -15 760.54Realized gain (loss) on foreign exchange -1 354.02
Total realized gain (loss) -17 114.56
Net realized gain (loss) of the financial year 128 490.47
Changes in unrealized appreciation (depreciation) (Note 1)
Unrealized appreciation (depreciation) on market-priced securities without options -949 461.23
Total changes in unrealized appreciation (depreciation) -949 461.23
Net increase (decrease) in net assets as a result of operations -820 970.76
Annual Report as of 31 December 2013 BSI-Multinvest – Bonds USD
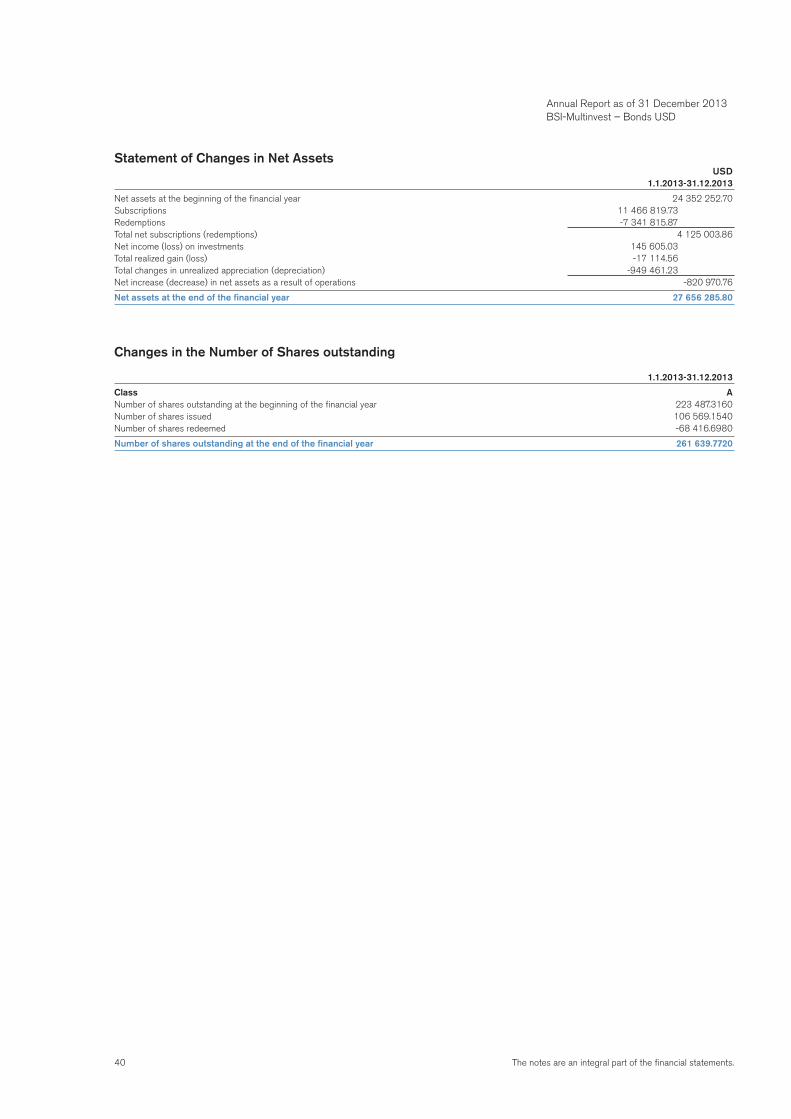
40 The notes are an integral part of the financial statements.
Statement of Changes in Net Assets USD 1.1.2013-31.12.2013
Net assets at the beginning of the financial year 24 352 252.70Subscriptions 11 466 819.73Redemptions -7 341 815.87Total net subscriptions (redemptions) 4 125 003.86Net income (loss) on investments 145 605.03Total realized gain (loss) -17 114.56Total changes in unrealized appreciation (depreciation) -949 461.23Net increase (decrease) in net assets as a result of operations -820 970.76
Net assets at the end of the financial year 27 656 285.80
Changes in the Number of Shares outstanding
1.1.2013-31.12.2013
Class ANumber of shares outstanding at the beginning of the financial year 223 487.3160Number of shares issued 106 569.1540Number of shares redeemed -68 416.6980
Number of shares outstanding at the end of the financial year 261 639.7720
Annual Report as of 31 December 2013 BSI-Multinvest – Bonds USD
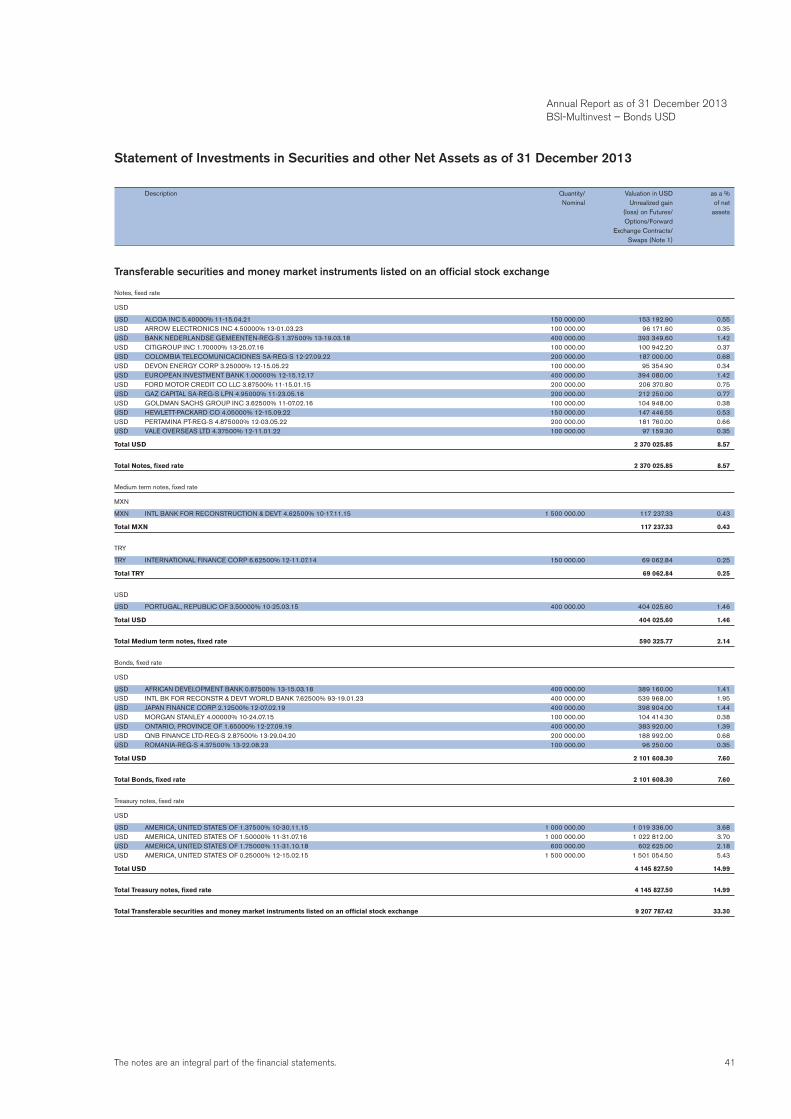
41The notes are an integral part of the financial statements.
Statement of Investments in Securities and other Net Assets as of 31 December 2013
Description Quantity/ Valuation in USD as a % Nominal Unrealized gain of net (loss) on Futures/ assets Options/Forward Exchange Contracts/ Swaps (Note 1)
Transferable securities and money market instruments listed on an official stock exchange
Notes, fixed rate
USD
USD ALCOA INC 5.40000% 11-15.04.21 150 000.00 153 192.90 0.55USD ARROW ELECTRONICS INC 4.50000% 13-01.03.23 100 000.00 96 171.60 0.35USD BANK NEDERLANDSE GEMEENTEN-REG-S 1.37500% 13-19.03.18 400 000.00 393 349.60 1.42USD CITIGROUP INC 1.70000% 13-25.07.16 100 000.00 100 942.20 0.37USD COLOMBIA TELECOMUNICACIONES SA-REG-S 12-27.09.22 200 000.00 187 000.00 0.68USD DEVON ENERGY CORP 3.25000% 12-15.05.22 100 000.00 95 354.90 0.34USD EUROPEAN INVESTMENT BANK 1.00000% 12-15.12.17 400 000.00 394 080.00 1.42USD FORD MOTOR CREDIT CO LLC 3.87500% 11-15.01.15 200 000.00 206 370.80 0.75USD GAZ CAPITAL SA-REG-S LPN 4.95000% 11-23.05.16 200 000.00 212 250.00 0.77USD GOLDMAN SACHS GROUP INC 3.62500% 11-07.02.16 100 000.00 104 948.00 0.38USD HEWLETT-PACKARD CO 4.05000% 12-15.09.22 150 000.00 147 446.55 0.53USD PERTAMINA PT-REG-S 4.875000% 12-03.05.22 200 000.00 181 760.00 0.66USD VALE OVERSEAS LTD 4.37500% 12-11.01.22 100 000.00 97 159.30 0.35
Total USD 2 370 025.85 8.57
Total Notes, fixed rate 2 370 025.85 8.57
Medium term notes, fixed rate
MXN
MXN INTL BANK FOR RECONSTRUCTION & DEVT 4.62500% 10-17.11.15 1 500 000.00 117 237.33 0.43
Total MXN 117 237.33 0.43
TRY
TRY INTERNATIONAL FINANCE CORP 6.62500% 12-11.07.14 150 000.00 69 062.84 0.25
Total TRY 69 062.84 0.25
USD
USD PORTUGAL, REPUBLIC OF 3.50000% 10-25.03.15 400 000.00 404 025.60 1.46
Total USD 404 025.60 1.46
Total Medium term notes, fixed rate 590 325.77 2.14
Bonds, fixed rate
USD
USD AFRICAN DEVELOPMENT BANK 0.87500% 13-15.03.18 400 000.00 389 160.00 1.41USD INTL BK FOR RECONSTR & DEVT WORLD BANK 7.62500% 93-19.01.23 400 000.00 539 968.00 1.95USD JAPAN FINANCE CORP 2.12500% 12-07.02.19 400 000.00 398 904.00 1.44USD MORGAN STANLEY 4.00000% 10-24.07.15 100 000.00 104 414.30 0.38USD ONTARIO, PROVINCE OF 1.65000% 12-27.09.19 400 000.00 383 920.00 1.39USD QNB FINANCE LTD-REG-S 2.87500% 13-29.04.20 200 000.00 188 992.00 0.68USD ROMANIA-REG-S 4.37500% 13-22.08.23 100 000.00 96 250.00 0.35
Total USD 2 101 608.30 7.60
Total Bonds, fixed rate 2 101 608.30 7.60
Treasury notes, fixed rate
USD
USD AMERICA, UNITED STATES OF 1.37500% 10-30.11.15 1 000 000.00 1 019 336.00 3.68USD AMERICA, UNITED STATES OF 1.50000% 11-31.07.16 1 000 000.00 1 022 812.00 3.70USD AMERICA, UNITED STATES OF 1.75000% 11-31.10.18 600 000.00 602 625.00 2.18USD AMERICA, UNITED STATES OF 0.25000% 12-15.02.15 1 500 000.00 1 501 054.50 5.43
Total USD 4 145 827.50 14.99
Total Treasury notes, fixed rate 4 145 827.50 14.99
Total Transferable securities and money market instruments listed on an official stock exchange 9 207 787.42 33.30
Annual Report as of 31 December 2013 BSI-Multinvest – Bonds USD
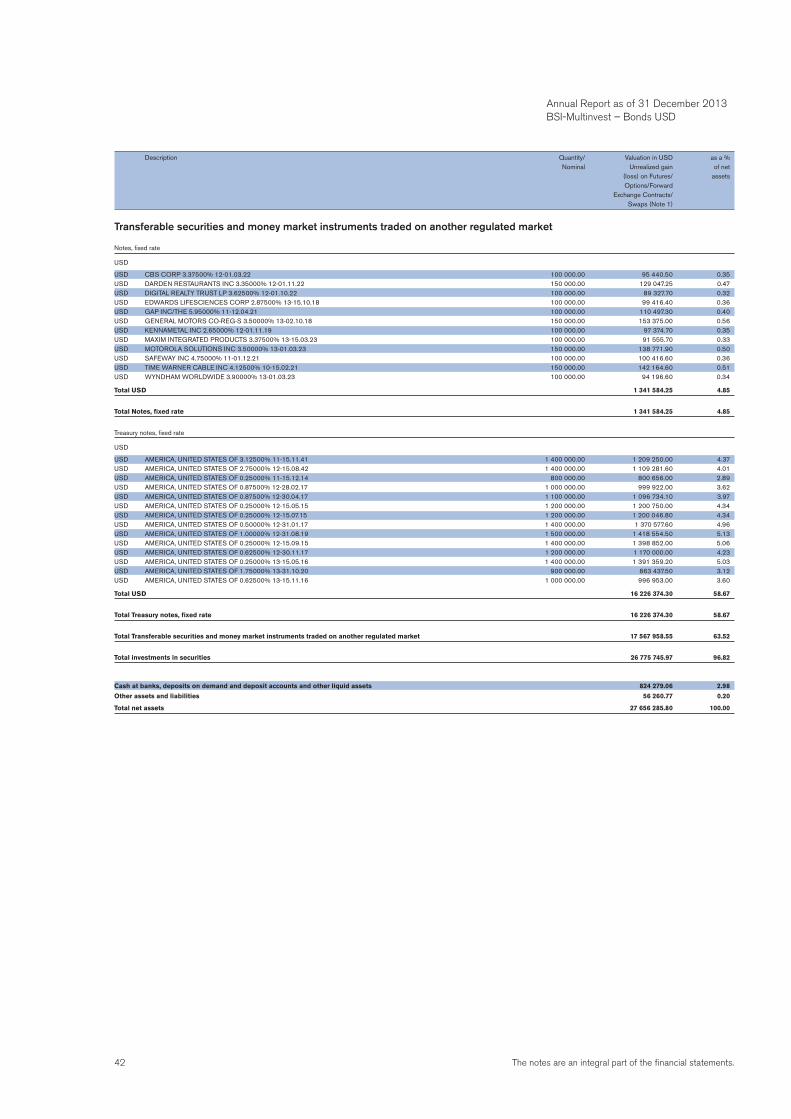
42 The notes are an integral part of the financial statements.
Annual Report as of 31 December 2013 BSI-Multinvest – Bonds USD
Transferable securities and money market instruments traded on another regulated market
Notes, fixed rate
USD
USD CBS CORP 3.37500% 12-01.03.22 100 000.00 95 440.50 0.35USD DARDEN RESTAURANTS INC 3.35000% 12-01.11.22 150 000.00 129 047.25 0.47USD DIGITAL REALTY TRUST LP 3.62500% 12-01.10.22 100 000.00 89 327.70 0.32USD EDWARDS LIFESCIENCES CORP 2.87500% 13-15.10.18 100 000.00 99 416.40 0.36USD GAP INC/THE 5.95000% 11-12.04.21 100 000.00 110 497.30 0.40USD GENERAL MOTORS CO-REG-S 3.50000% 13-02.10.18 150 000.00 153 375.00 0.56USD KENNAMETAL INC 2.65000% 12-01.11.19 100 000.00 97 374.70 0.35USD MAXIM INTEGRATED PRODUCTS 3.37500% 13-15.03.23 100 000.00 91 555.70 0.33USD MOTOROLA SOLUTIONS INC 3.50000% 13-01.03.23 150 000.00 138 771.90 0.50USD SAFEWAY INC 4.75000% 11-01.12.21 100 000.00 100 416.60 0.36USD TIME WARNER CABLE INC 4.12500% 10-15.02.21 150 000.00 142 164.60 0.51USD WYNDHAM WORLDWIDE 3.90000% 13-01.03.23 100 000.00 94 196.60 0.34
Total USD 1 341 584.25 4.85
Total Notes, fixed rate 1 341 584.25 4.85
Treasury notes, fixed rate
USD
USD AMERICA, UNITED STATES OF 3.12500% 11-15.11.41 1 400 000.00 1 209 250.00 4.37USD AMERICA, UNITED STATES OF 2.75000% 12-15.08.42 1 400 000.00 1 109 281.60 4.01USD AMERICA, UNITED STATES OF 0.25000% 11-15.12.14 800 000.00 800 656.00 2.89USD AMERICA, UNITED STATES OF 0.87500% 12-28.02.17 1 000 000.00 999 922.00 3.62USD AMERICA, UNITED STATES OF 0.87500% 12-30.04.17 1 100 000.00 1 096 734.10 3.97USD AMERICA, UNITED STATES OF 0.25000% 12-15.05.15 1 200 000.00 1 200 750.00 4.34USD AMERICA, UNITED STATES OF 0.25000% 12-15.07.15 1 200 000.00 1 200 046.80 4.34USD AMERICA, UNITED STATES OF 0.50000% 12-31.01.17 1 400 000.00 1 370 577.60 4.96USD AMERICA, UNITED STATES OF 1.00000% 12-31.08.19 1 500 000.00 1 418 554.50 5.13USD AMERICA, UNITED STATES OF 0.25000% 12-15.09.15 1 400 000.00 1 398 852.00 5.06USD AMERICA, UNITED STATES OF 0.62500% 12-30.11.17 1 200 000.00 1 170 000.00 4.23USD AMERICA, UNITED STATES OF 0.25000% 13-15.05.16 1 400 000.00 1 391 359.20 5.03USD AMERICA, UNITED STATES OF 1.75000% 13-31.10.20 900 000.00 863 437.50 3.12USD AMERICA, UNITED STATES OF 0.62500% 13-15.11.16 1 000 000.00 996 953.00 3.60
Total USD 16 226 374.30 58.67
Total Treasury notes, fixed rate 16 226 374.30 58.67
Total Transferable securities and money market instruments traded on another regulated market 17 567 958.55 63.52
Total investments in securities 26 775 745.97 96.82
Cash at banks, deposits on demand and deposit accounts and other liquid assets 824 279.06 2.98
Other assets and liabilities 56 260.77 0.20
Total net assets 27 656 285.80 100.00
Description Quantity/ Valuation in USD as a % Nominal Unrealized gain of net (loss) on Futures/ assets Options/Forward Exchange Contracts/ Swaps (Note 1)
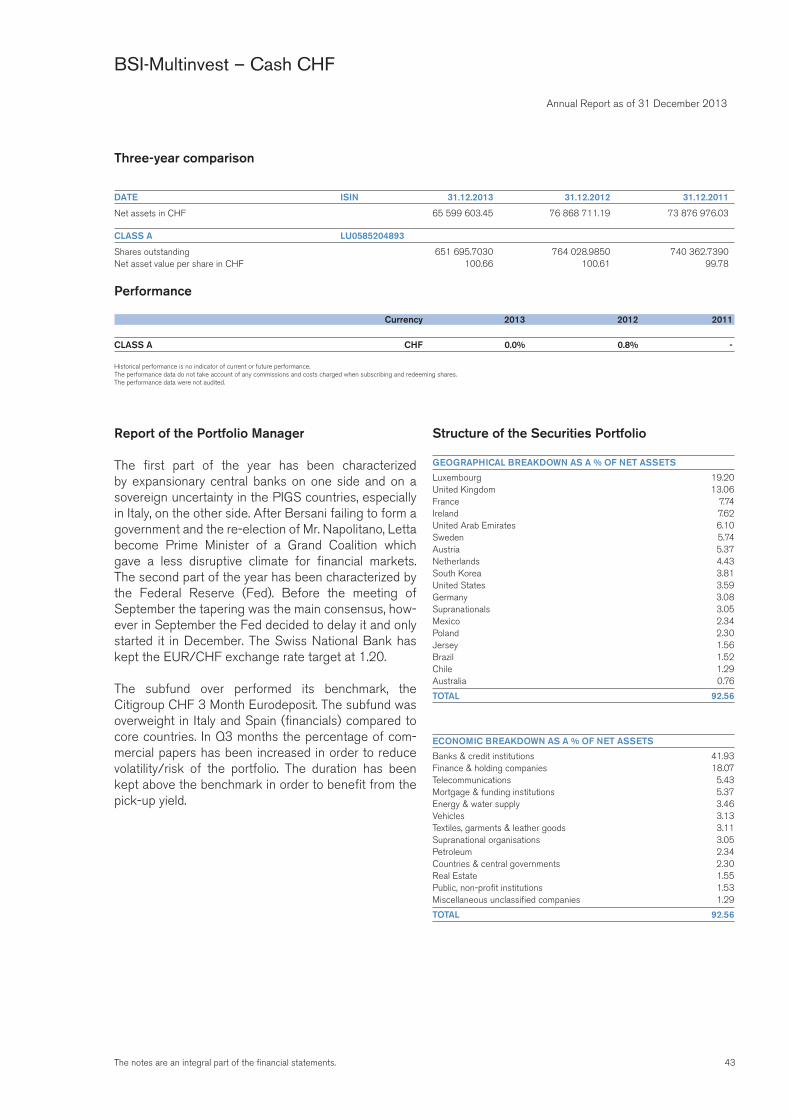
43The notes are an integral part of the financial statements.
Annual Report as of 31 December 2013
BSI-Multinvest – Cash CHF
Three-year comparison
DATE ISIN 31.12.2013 31.12.2012 31.12.2011
Net assets in CHF 65 599 603.45 76 868 711.19 73 876 976.03
CLASS A LU0585204893
Shares outstanding 651 695.7030 764 028.9850 740 362.7390Net asset value per share in CHF 100.66 100.61 99.78
Performance
Currency 2013 2012 2011
CLASS A CHF 0.0% 0.8% -
Historical performance is no indicator of current or future performance.The performance data do not take account of any commissions and costs charged when subscribing and redeeming shares.The performance data were not audited.
Report of the Portfolio Manager
The first part of the year has been characterized by expansionary central banks on one side and on a sovereign uncertainty in the PIGS countries, especially in Italy, on the other side. After Bersani failing to form a government and the re-election of Mr. Napolitano, Letta become Prime Minister of a Grand Coalition which gave a less disruptive climate for financial markets. The second part of the year has been characterized by the Federal Reserve (Fed). Before the meeting of September the tapering was the main consensus, how-ever in September the Fed decided to delay it and only started it in December. The Swiss National Bank has kept the EUR/CHF exchange rate target at 1.20.
The subfund over performed its benchmark, the Citigroup CHF 3 Month Eurodeposit. The subfund was overweight in Italy and Spain (financials) compared to core countries. In Q3 months the percentage of com-mercial papers has been increased in order to reduce volatility/risk of the portfolio. The duration has been kept above the benchmark in order to benefit from the pick-up yield.
Structure of the Securities Portfolio
GEOGRAPHICAL BREAKDOWN AS A % OF NET ASSETS
Luxembourg 19.20United Kingdom 13.06France 7.74Ireland 7.62United Arab Emirates 6.10Sweden 5.74Austria 5.37Netherlands 4.43South Korea 3.81United States 3.59Germany 3.08Supranationals 3.05Mexico 2.34Poland 2.30Jersey 1.56Brazil 1.52Chile 1.29Australia 0.76
TOTAL 92.56
ECONOMIC BREAKDOWN AS A % OF NET ASSETS
Banks & credit institutions 41.93Finance & holding companies 18.07Telecommunications 5.43Mortgage & funding institutions 5.37Energy & water supply 3.46Vehicles 3.13Textiles, garments & leather goods 3.11Supranational organisations 3.05Petroleum 2.34Countries & central governments 2.30Real Estate 1.55Public, non-profit institutions 1.53Miscellaneous unclassified companies 1.29
TOTAL 92.56
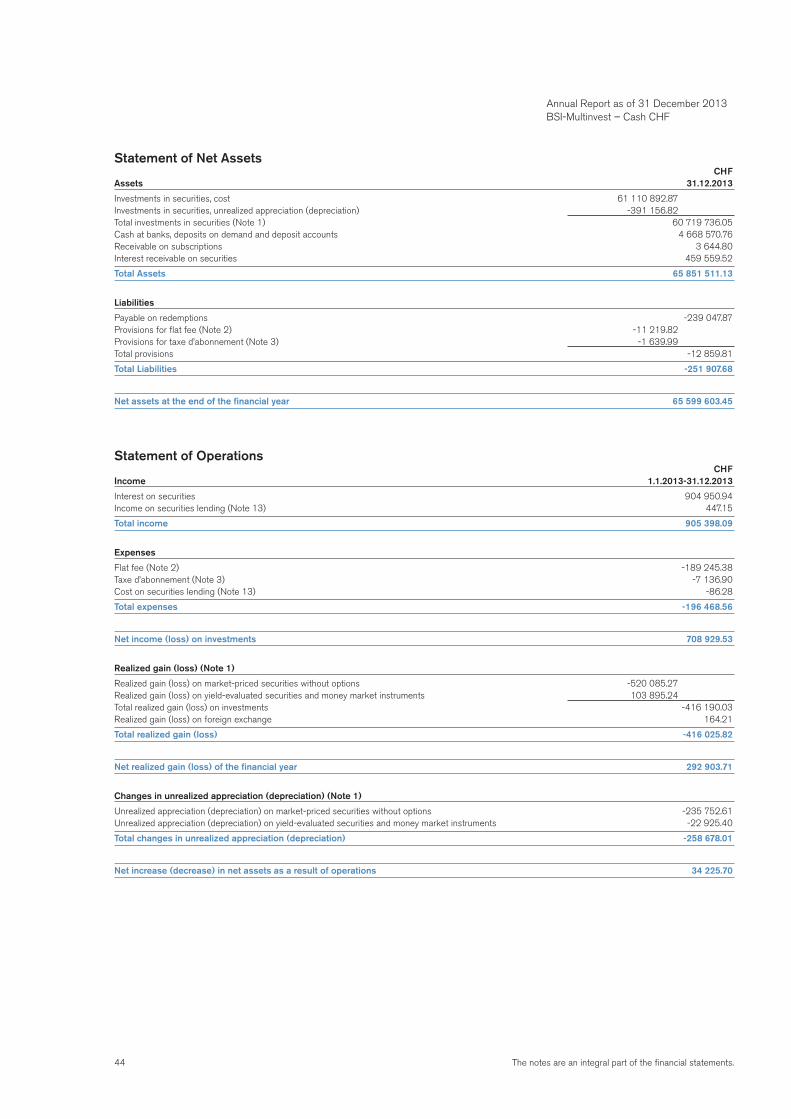
44 The notes are an integral part of the financial statements.
Statement of Net Assets CHFAssets 31.12.2013
Investments in securities, cost 61 110 892.87Investments in securities, unrealized appreciation (depreciation) -391 156.82Total investments in securities (Note 1) 60 719 736.05Cash at banks, deposits on demand and deposit accounts 4 668 570.76Receivable on subscriptions 3 644.80Interest receivable on securities 459 559.52
Total Assets 65 851 511.13
Liabilities
Payable on redemptions -239 047.87Provisions for flat fee (Note 2) -11 219.82Provisions for taxe d’abonnement (Note 3) -1 639.99Total provisions -12 859.81
Total Liabilities -251 907.68
Net assets at the end of the financial year 65 599 603.45
Statement of Operations CHFIncome 1.1.2013-31.12.2013
Interest on securities 904 950.94Income on securities lending (Note 13) 447.15
Total income 905 398.09
Expenses
Flat fee (Note 2) -189 245.38Taxe d’abonnement (Note 3) -7 136.90Cost on securities lending (Note 13) -86.28
Total expenses -196 468.56
Net income (loss) on investments 708 929.53
Realized gain (loss) (Note 1)
Realized gain (loss) on market-priced securities without options -520 085.27Realized gain (loss) on yield-evaluated securities and money market instruments 103 895.24Total realized gain (loss) on investments -416 190.03Realized gain (loss) on foreign exchange 164.21
Total realized gain (loss) -416 025.82
Net realized gain (loss) of the financial year 292 903.71
Changes in unrealized appreciation (depreciation) (Note 1)
Unrealized appreciation (depreciation) on market-priced securities without options -235 752.61Unrealized appreciation (depreciation) on yield-evaluated securities and money market instruments -22 925.40
Total changes in unrealized appreciation (depreciation) -258 678.01
Net increase (decrease) in net assets as a result of operations 34 225.70
Annual Report as of 31 December 2013 BSI-Multinvest – Cash CHF

45The notes are an integral part of the financial statements.
Statement of Changes in Net Assets CHF 1.1.2013-31.12.2013
Net assets at the beginning of the financial year 76 868 711.19Subscriptions 16 744 558.72Redemptions -28 047 892.16Total net subscriptions (redemptions) -11 303 333.44Net income (loss) on investments 708 929.53Total realized gain (loss) -416 025.82Total changes in unrealized appreciation (depreciation) -258 678.01Net increase (decrease) in net assets as a result of operations 34 225.70
Net assets at the end of the financial year 65 599 603.45
Changes in the Number of Shares outstanding
1.1.2013-31.12.2013
Class ANumber of shares outstanding at the beginning of the financial year 764 028.9850Number of shares issued 166 431.7750Number of shares redeemed -278 765.0570
Number of shares outstanding at the end of the financial year 651 695.7030
Annual Report as of 31 December 2013 BSI-Multinvest – Cash CHF
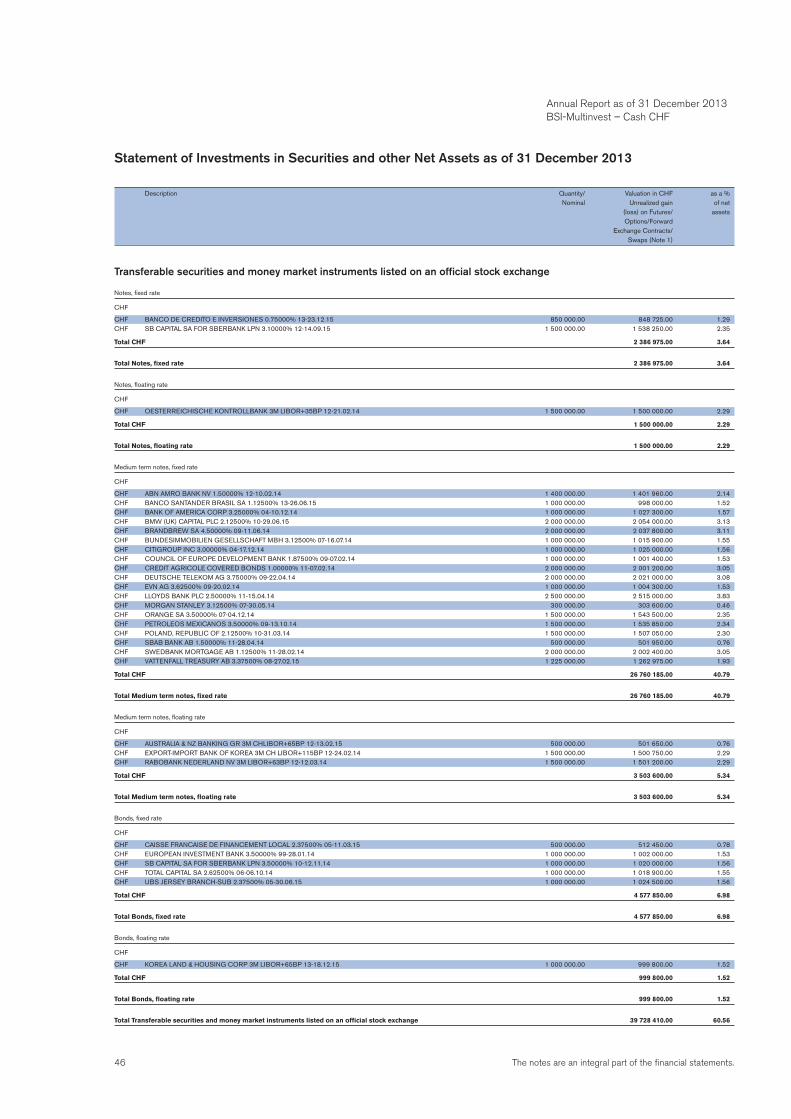
46 The notes are an integral part of the financial statements.
Statement of Investments in Securities and other Net Assets as of 31 December 2013
Description Quantity/ Valuation in CHF as a % Nominal Unrealized gain of net (loss) on Futures/ assets Options/Forward Exchange Contracts/ Swaps (Note 1)
Transferable securities and money market instruments listed on an official stock exchange
Notes, fixed rate
CHF
CHF BANCO DE CREDITO E INVERSIONES 0.75000% 13-23.12.15 850 000.00 848 725.00 1.29CHF SB CAPITAL SA FOR SBERBANK LPN 3.10000% 12-14.09.15 1 500 000.00 1 538 250.00 2.35
Total CHF 2 386 975.00 3.64
Total Notes, fixed rate 2 386 975.00 3.64
Notes, floating rate
CHF
CHF OESTERREICHISCHE KONTROLLBANK 3M LIBOR+35BP 12-21.02.14 1 500 000.00 1 500 000.00 2.29
Total CHF 1 500 000.00 2.29
Total Notes, floating rate 1 500 000.00 2.29
Medium term notes, fixed rate
CHF
CHF ABN AMRO BANK NV 1.50000% 12-10.02.14 1 400 000.00 1 401 960.00 2.14CHF BANCO SANTANDER BRASIL SA 1.12500% 13-26.06.15 1 000 000.00 998 000.00 1.52CHF BANK OF AMERICA CORP 3.25000% 04-10.12.14 1 000 000.00 1 027 300.00 1.57CHF BMW (UK) CAPITAL PLC 2.12500% 10-29.06.15 2 000 000.00 2 054 000.00 3.13CHF BRANDBREW SA 4.50000% 09-11.06.14 2 000 000.00 2 037 800.00 3.11CHF BUNDESIMMOBILIEN GESELLSCHAFT MBH 3.12500% 07-16.07.14 1 000 000.00 1 015 900.00 1.55CHF CITIGROUP INC 3.00000% 04-17.12.14 1 000 000.00 1 025 000.00 1.56CHF COUNCIL OF EUROPE DEVELOPMENT BANK 1.87500% 09-07.02.14 1 000 000.00 1 001 400.00 1.53CHF CREDIT AGRICOLE COVERED BONDS 1.00000% 11-07.02.14 2 000 000.00 2 001 200.00 3.05CHF DEUTSCHE TELEKOM AG 3.75000% 09-22.04.14 2 000 000.00 2 021 000.00 3.08CHF EVN AG 3.62500% 09-20.02.14 1 000 000.00 1 004 300.00 1.53CHF LLOYDS BANK PLC 2.50000% 11-15.04.14 2 500 000.00 2 515 000.00 3.83CHF MORGAN STANLEY 3.12500% 07-30.05.14 300 000.00 303 600.00 0.46CHF ORANGE SA 3.50000% 07-04.12.14 1 500 000.00 1 543 500.00 2.35CHF PETROLEOS MEXICANOS 3.50000% 09-13.10.14 1 500 000.00 1 535 850.00 2.34CHF POLAND, REPUBLIC OF 2.12500% 10-31.03.14 1 500 000.00 1 507 050.00 2.30CHF SBAB BANK AB 1.50000% 11-28.04.14 500 000.00 501 950.00 0.76CHF SWEDBANK MORTGAGE AB 1.12500% 11-28.02.14 2 000 000.00 2 002 400.00 3.05CHF VATTENFALL TREASURY AB 3.37500% 08-27.02.15 1 225 000.00 1 262 975.00 1.93
Total CHF 26 760 185.00 40.79
Total Medium term notes, fixed rate 26 760 185.00 40.79
Medium term notes, floating rate
CHF
CHF AUSTRALIA & NZ BANKING GR 3M CHLIBOR+65BP 12-13.02.15 500 000.00 501 650.00 0.76CHF EXPORT-IMPORT BANK OF KOREA 3M CH LIBOR+115BP 12-24.02.14 1 500 000.00 1 500 750.00 2.29CHF RABOBANK NEDERLAND NV 3M LIBOR+63BP 12-12.03.14 1 500 000.00 1 501 200.00 2.29
Total CHF 3 503 600.00 5.34
Total Medium term notes, floating rate 3 503 600.00 5.34
Bonds, fixed rate
CHF
CHF CAISSE FRANCAISE DE FINANCEMENT LOCAL 2.37500% 05-11.03.15 500 000.00 512 450.00 0.78CHF EUROPEAN INVESTMENT BANK 3.50000% 99-28.01.14 1 000 000.00 1 002 000.00 1.53CHF SB CAPITAL SA FOR SBERBANK LPN 3.50000% 10-12.11.14 1 000 000.00 1 020 000.00 1.56CHF TOTAL CAPITAL SA 2.62500% 06-06.10.14 1 000 000.00 1 018 900.00 1.55CHF UBS JERSEY BRANCH-SUB 2.37500% 05-30.06.15 1 000 000.00 1 024 500.00 1.56
Total CHF 4 577 850.00 6.98
Total Bonds, fixed rate 4 577 850.00 6.98
Bonds, floating rate
CHF
CHF KOREA LAND & HOUSING CORP 3M LIBOR+65BP 13-18.12.15 1 000 000.00 999 800.00 1.52
Total CHF 999 800.00 1.52
Total Bonds, floating rate 999 800.00 1.52
Total Transferable securities and money market instruments listed on an official stock exchange 39 728 410.00 60.56
Annual Report as of 31 December 2013 BSI-Multinvest – Cash CHF
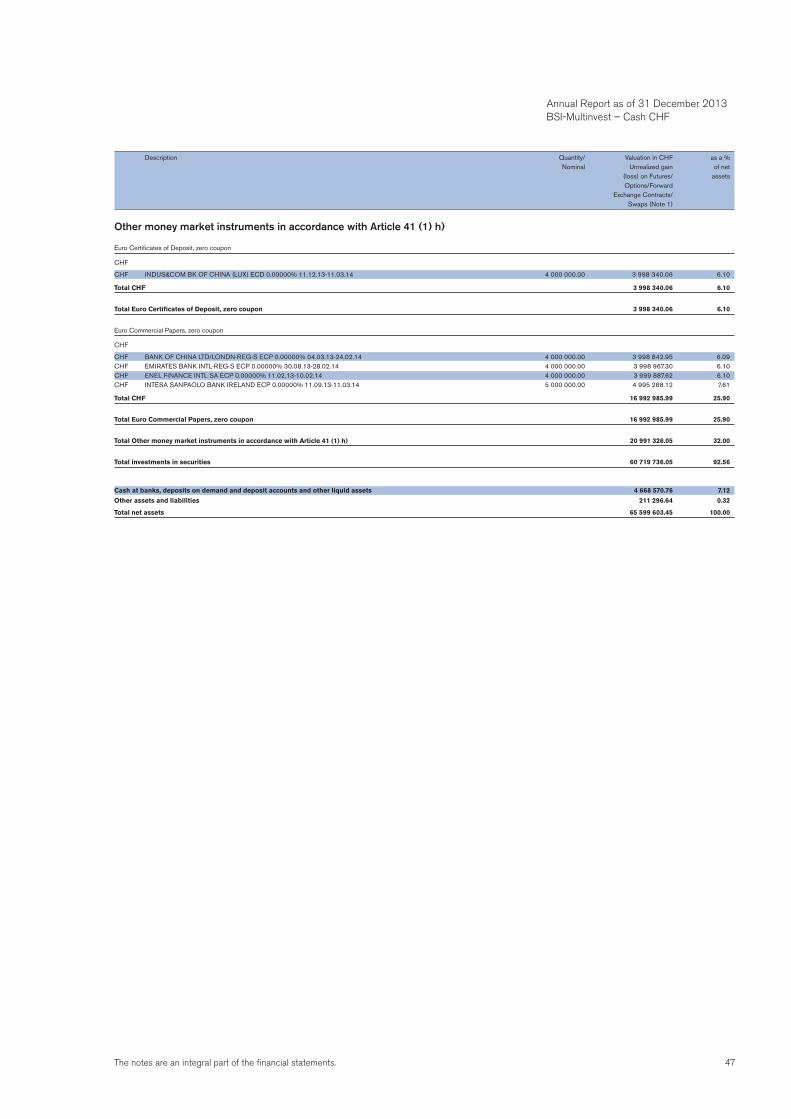
47The notes are an integral part of the financial statements.
Annual Report as of 31 December 2013 BSI-Multinvest – Cash CHF
Other money market instruments in accordance with Article 41 (1) h)
Euro Certificates of Deposit, zero coupon
CHF
CHF INDUS&COM BK OF CHINA (LUX) ECD 0.00000% 11.12.13-11.03.14 4 000 000.00 3 998 340.06 6.10
Total CHF 3 998 340.06 6.10
Total Euro Certificates of Deposit, zero coupon 3 998 340.06 6.10
Euro Commercial Papers, zero coupon
CHF
CHF BANK OF CHINA LTD/LONDN-REG-S ECP 0.00000% 04.03.13-24.02.14 4 000 000.00 3 998 842.95 6.09CHF EMIRATES BANK INTL-REG-S ECP 0.00000% 30.08.13-28.02.14 4 000 000.00 3 998 967.30 6.10CHF ENEL FINANCE INTL SA ECP 0.00000% 11.02.13-10.02.14 4 000 000.00 3 999 887.62 6.10CHF INTESA SANPAOLO BANK IRELAND ECP 0.00000% 11.09.13-11.03.14 5 000 000.00 4 995 288.12 7.61
Total CHF 16 992 985.99 25.90
Total Euro Commercial Papers, zero coupon 16 992 985.99 25.90
Total Other money market instruments in accordance with Article 41 (1) h) 20 991 326.05 32.00
Total investments in securities 60 719 736.05 92.56
Cash at banks, deposits on demand and deposit accounts and other liquid assets 4 668 570.76 7.12
Other assets and liabilities 211 296.64 0.32
Total net assets 65 599 603.45 100.00
Description Quantity/ Valuation in CHF as a % Nominal Unrealized gain of net (loss) on Futures/ assets Options/Forward Exchange Contracts/ Swaps (Note 1)
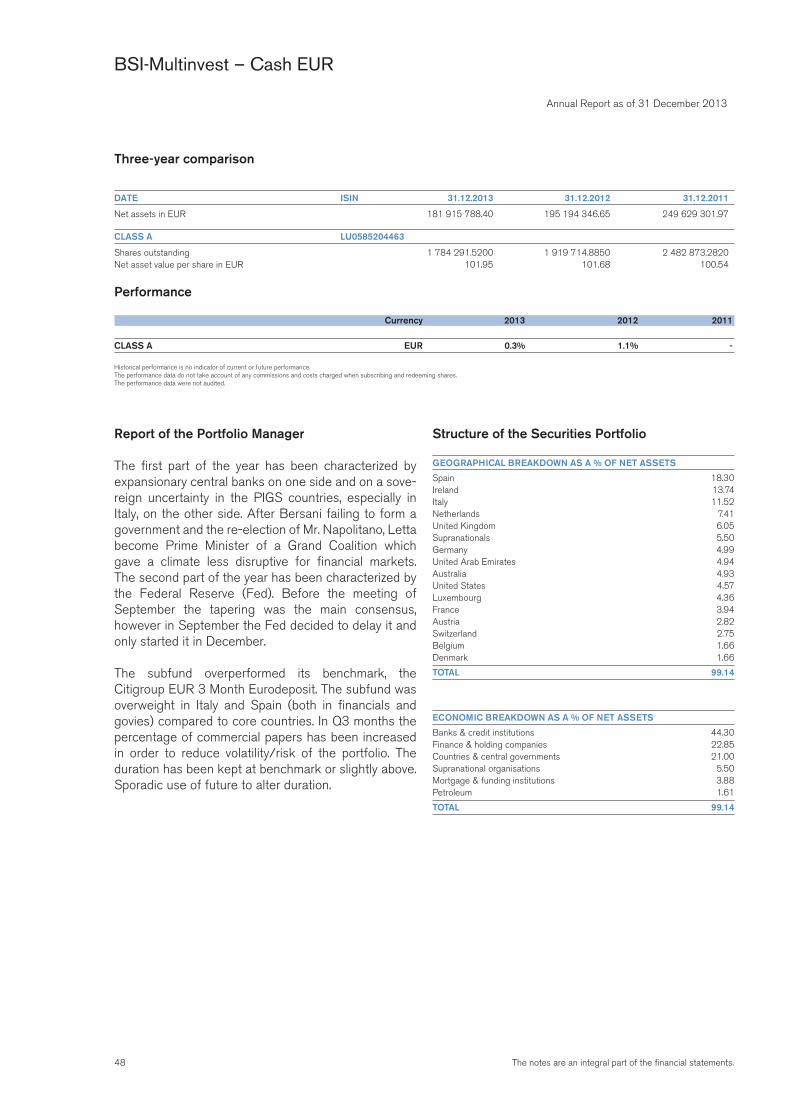
48 The notes are an integral part of the financial statements.
Annual Report as of 31 December 2013
BSI-Multinvest – Cash EUR
Three-year comparison
DATE ISIN 31.12.2013 31.12.2012 31.12.2011
Net assets in EUR 181 915 788.40 195 194 346.65 249 629 301.97
CLASS A LU0585204463
Shares outstanding 1 784 291.5200 1 919 714.8850 2 482 873.2820Net asset value per share in EUR 101.95 101.68 100.54
Performance
Currency 2013 2012 2011
CLASS A EUR 0.3% 1.1% -
Historical performance is no indicator of current or future performance.The performance data do not take account of any commissions and costs charged when subscribing and redeeming shares.The performance data were not audited.
Report of the Portfolio Manager
The first part of the year has been characterized by expansionary central banks on one side and on a sove-reign uncertainty in the PIGS countries, especially in Italy, on the other side. After Bersani failing to form a government and the re-election of Mr. Napolitano, Letta become Prime Minister of a Grand Coalition which gave a climate less disruptive for financial markets. The second part of the year has been characterized by the Federal Reserve (Fed). Before the meeting of September the tapering was the main consensus, however in September the Fed decided to delay it and only started it in December.
The subfund overperformed its benchmark, the Citigroup EUR 3 Month Eurodeposit. The subfund was overweight in Italy and Spain (both in financials and govies) compared to core countries. In Q3 months the percentage of commercial papers has been increased in order to reduce volatility/risk of the portfolio. The duration has been kept at benchmark or slightly above. Sporadic use of future to alter duration.
Structure of the Securities Portfolio
GEOGRAPHICAL BREAKDOWN AS A % OF NET ASSETS
Spain 18.30Ireland 13.74Italy 11.52Netherlands 7.41United Kingdom 6.05Supranationals 5.50Germany 4.99United Arab Emirates 4.94Australia 4.93United States 4.57Luxembourg 4.36France 3.94Austria 2.82Switzerland 2.75Belgium 1.66Denmark 1.66
TOTAL 99.14
ECONOMIC BREAKDOWN AS A % OF NET ASSETS
Banks & credit institutions 44.30Finance & holding companies 22.85Countries & central governments 21.00Supranational organisations 5.50Mortgage & funding institutions 3.88Petroleum 1.61
TOTAL 99.14
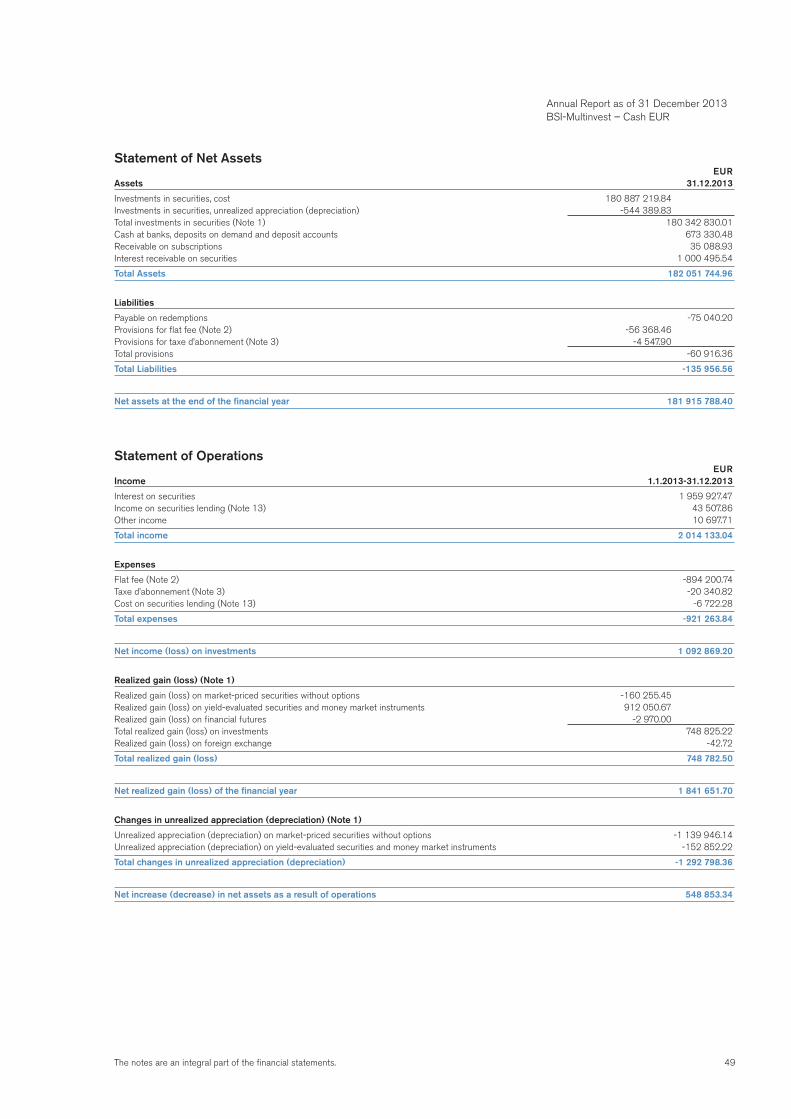
49The notes are an integral part of the financial statements.
Annual Report as of 31 December 2013 BSI-Multinvest – Cash EUR
Statement of Net Assets EURAssets 31.12.2013
Investments in securities, cost 180 887 219.84Investments in securities, unrealized appreciation (depreciation) -544 389.83Total investments in securities (Note 1) 180 342 830.01Cash at banks, deposits on demand and deposit accounts 673 330.48Receivable on subscriptions 35 088.93Interest receivable on securities 1 000 495.54
Total Assets 182 051 744.96
Liabilities
Payable on redemptions -75 040.20Provisions for flat fee (Note 2) -56 368.46Provisions for taxe d’abonnement (Note 3) -4 547.90Total provisions -60 916.36
Total Liabilities -135 956.56
Net assets at the end of the financial year 181 915 788.40
Statement of Operations EURIncome 1.1.2013-31.12.2013
Interest on securities 1 959 927.47Income on securities lending (Note 13) 43 507.86Other income 10 697.71
Total income 2 014 133.04
Expenses
Flat fee (Note 2) -894 200.74Taxe d’abonnement (Note 3) -20 340.82Cost on securities lending (Note 13) -6 722.28
Total expenses -921 263.84
Net income (loss) on investments 1 092 869.20
Realized gain (loss) (Note 1)
Realized gain (loss) on market-priced securities without options -160 255.45Realized gain (loss) on yield-evaluated securities and money market instruments 912 050.67Realized gain (loss) on financial futures -2 970.00Total realized gain (loss) on investments 748 825.22Realized gain (loss) on foreign exchange -42.72
Total realized gain (loss) 748 782.50
Net realized gain (loss) of the financial year 1 841 651.70
Changes in unrealized appreciation (depreciation) (Note 1)
Unrealized appreciation (depreciation) on market-priced securities without options -1 139 946.14Unrealized appreciation (depreciation) on yield-evaluated securities and money market instruments -152 852.22
Total changes in unrealized appreciation (depreciation) -1 292 798.36
Net increase (decrease) in net assets as a result of operations 548 853.34
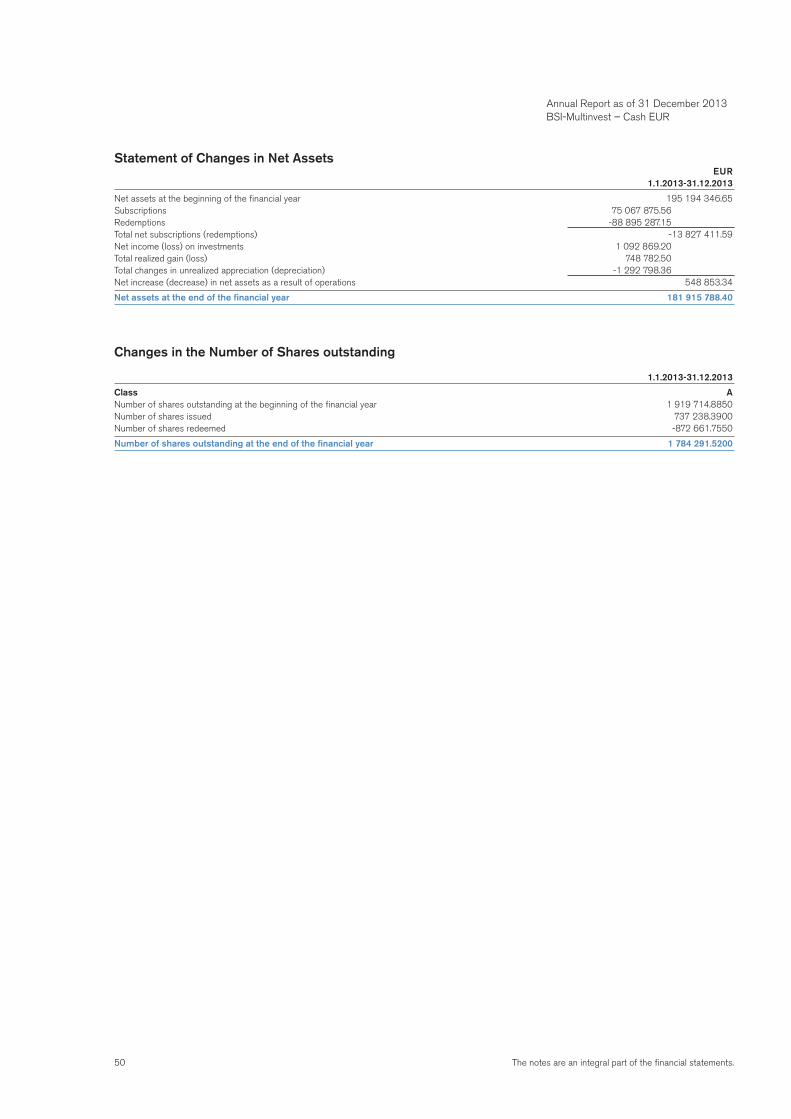
50 The notes are an integral part of the financial statements.
Statement of Changes in Net Assets EUR 1.1.2013-31.12.2013
Net assets at the beginning of the financial year 195 194 346.65Subscriptions 75 067 875.56Redemptions -88 895 287.15Total net subscriptions (redemptions) -13 827 411.59Net income (loss) on investments 1 092 869.20Total realized gain (loss) 748 782.50Total changes in unrealized appreciation (depreciation) -1 292 798.36Net increase (decrease) in net assets as a result of operations 548 853.34
Net assets at the end of the financial year 181 915 788.40
Changes in the Number of Shares outstanding
1.1.2013-31.12.2013
Class ANumber of shares outstanding at the beginning of the financial year 1 919 714.8850Number of shares issued 737 238.3900Number of shares redeemed -872 661.7550
Number of shares outstanding at the end of the financial year 1 784 291.5200
Annual Report as of 31 December 2013 BSI-Multinvest – Cash EUR
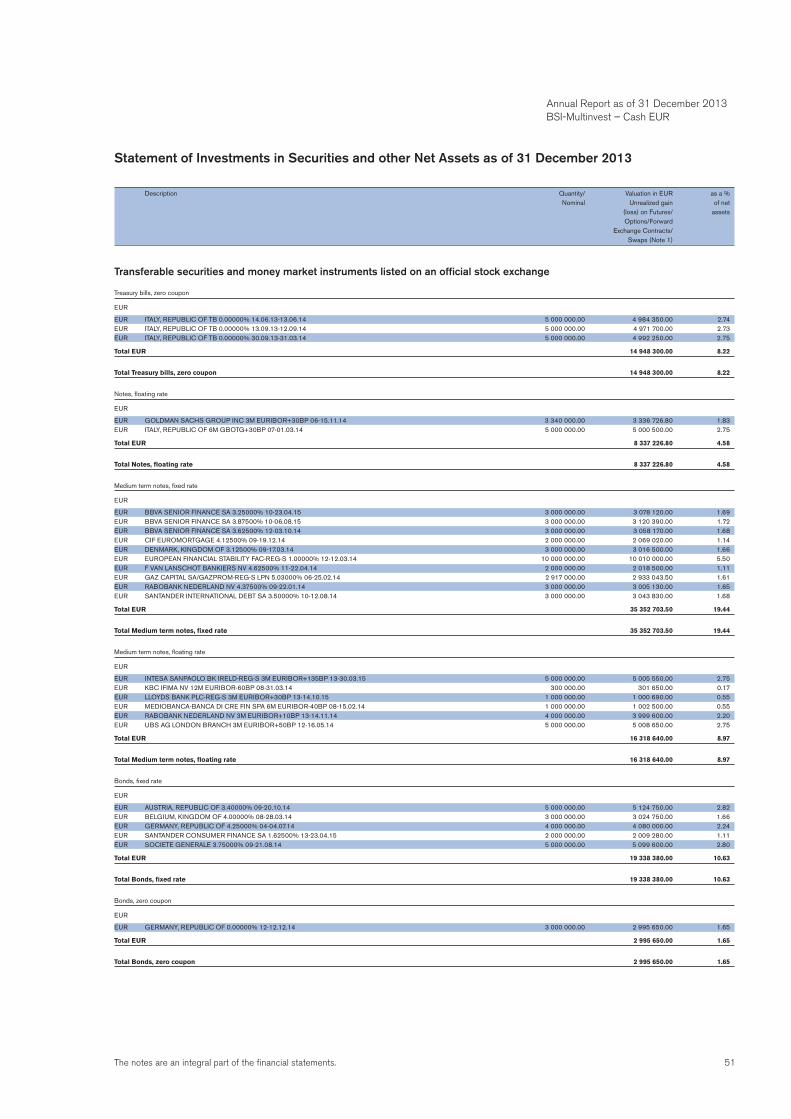
51The notes are an integral part of the financial statements.
Statement of Investments in Securities and other Net Assets as of 31 December 2013
Description Quantity/ Valuation in EUR as a % Nominal Unrealized gain of net (loss) on Futures/ assets Options/Forward Exchange Contracts/ Swaps (Note 1)
Transferable securities and money market instruments listed on an official stock exchange
Treasury bills, zero coupon
EUR
EUR ITALY, REPUBLIC OF TB 0.00000% 14.06.13-13.06.14 5 000 000.00 4 984 350.00 2.74EUR ITALY, REPUBLIC OF TB 0.00000% 13.09.13-12.09.14 5 000 000.00 4 971 700.00 2.73EUR ITALY, REPUBLIC OF TB 0.00000% 30.09.13-31.03.14 5 000 000.00 4 992 250.00 2.75
Total EUR 14 948 300.00 8.22
Total Treasury bills, zero coupon 14 948 300.00 8.22
Notes, floating rate
EUR
EUR GOLDMAN SACHS GROUP INC 3M EURIBOR+30BP 06-15.11.14 3 340 000.00 3 336 726.80 1.83EUR ITALY, REPUBLIC OF 6M GBOTG+30BP 07-01.03.14 5 000 000.00 5 000 500.00 2.75
Total EUR 8 337 226.80 4.58
Total Notes, floating rate 8 337 226.80 4.58
Medium term notes, fixed rate
EUR
EUR BBVA SENIOR FINANCE SA 3.25000% 10-23.04.15 3 000 000.00 3 078 120.00 1.69EUR BBVA SENIOR FINANCE SA 3.87500% 10-06.08.15 3 000 000.00 3 120 390.00 1.72EUR BBVA SENIOR FINANCE SA 3.62500% 12-03.10.14 3 000 000.00 3 058 170.00 1.68EUR CIF EUROMORTGAGE 4.12500% 09-19.12.14 2 000 000.00 2 069 020.00 1.14EUR DENMARK, KINGDOM OF 3.12500% 09-17.03.14 3 000 000.00 3 016 500.00 1.66EUR EUROPEAN FINANCIAL STABILITY FAC-REG-S 1.00000% 12-12.03.14 10 000 000.00 10 010 000.00 5.50EUR F VAN LANSCHOT BANKIERS NV 4.62500% 11-22.04.14 2 000 000.00 2 018 500.00 1.11EUR GAZ CAPITAL SA/GAZPROM-REG-S LPN 5.03000% 06-25.02.14 2 917 000.00 2 933 043.50 1.61EUR RABOBANK NEDERLAND NV 4.37500% 09-22.01.14 3 000 000.00 3 005 130.00 1.65EUR SANTANDER INTERNATIONAL DEBT SA 3.50000% 10-12.08.14 3 000 000.00 3 043 830.00 1.68
Total EUR 35 352 703.50 19.44
Total Medium term notes, fixed rate 35 352 703.50 19.44
Medium term notes, floating rate
EUR
EUR INTESA SANPAOLO BK IRELD-REG-S 3M EURIBOR+135BP 13-30.03.15 5 000 000.00 5 005 550.00 2.75EUR KBC IFIMA NV 12M EURIBOR-60BP 08-31.03.14 300 000.00 301 650.00 0.17EUR LLOYDS BANK PLC-REG-S 3M EURIBOR+30BP 13-14.10.15 1 000 000.00 1 000 690.00 0.55EUR MEDIOBANCA-BANCA DI CRE FIN SPA 6M EURIBOR-40BP 08-15.02.14 1 000 000.00 1 002 500.00 0.55EUR RABOBANK NEDERLAND NV 3M EURIBOR+10BP 13-14.11.14 4 000 000.00 3 999 600.00 2.20EUR UBS AG LONDON BRANCH 3M EURIBOR+50BP 12-16.05.14 5 000 000.00 5 008 650.00 2.75
Total EUR 16 318 640.00 8.97
Total Medium term notes, floating rate 16 318 640.00 8.97
Bonds, fixed rate
EUR
EUR AUSTRIA, REPUBLIC OF 3.40000% 09-20.10.14 5 000 000.00 5 124 750.00 2.82EUR BELGIUM, KINGDOM OF 4.00000% 08-28.03.14 3 000 000.00 3 024 750.00 1.66EUR GERMANY, REPUBLIC OF 4.25000% 04-04.07.14 4 000 000.00 4 080 000.00 2.24EUR SANTANDER CONSUMER FINANCE SA 1.62500% 13-23.04.15 2 000 000.00 2 009 280.00 1.11EUR SOCIETE GENERALE 3.75000% 09-21.08.14 5 000 000.00 5 099 600.00 2.80
Total EUR 19 338 380.00 10.63
Total Bonds, fixed rate 19 338 380.00 10.63
Bonds, zero coupon
EUR
EUR GERMANY, REPUBLIC OF 0.00000% 12-12.12.14 3 000 000.00 2 995 650.00 1.65
Total EUR 2 995 650.00 1.65
Total Bonds, zero coupon 2 995 650.00 1.65
Annual Report as of 31 December 2013 BSI-Multinvest – Cash EUR
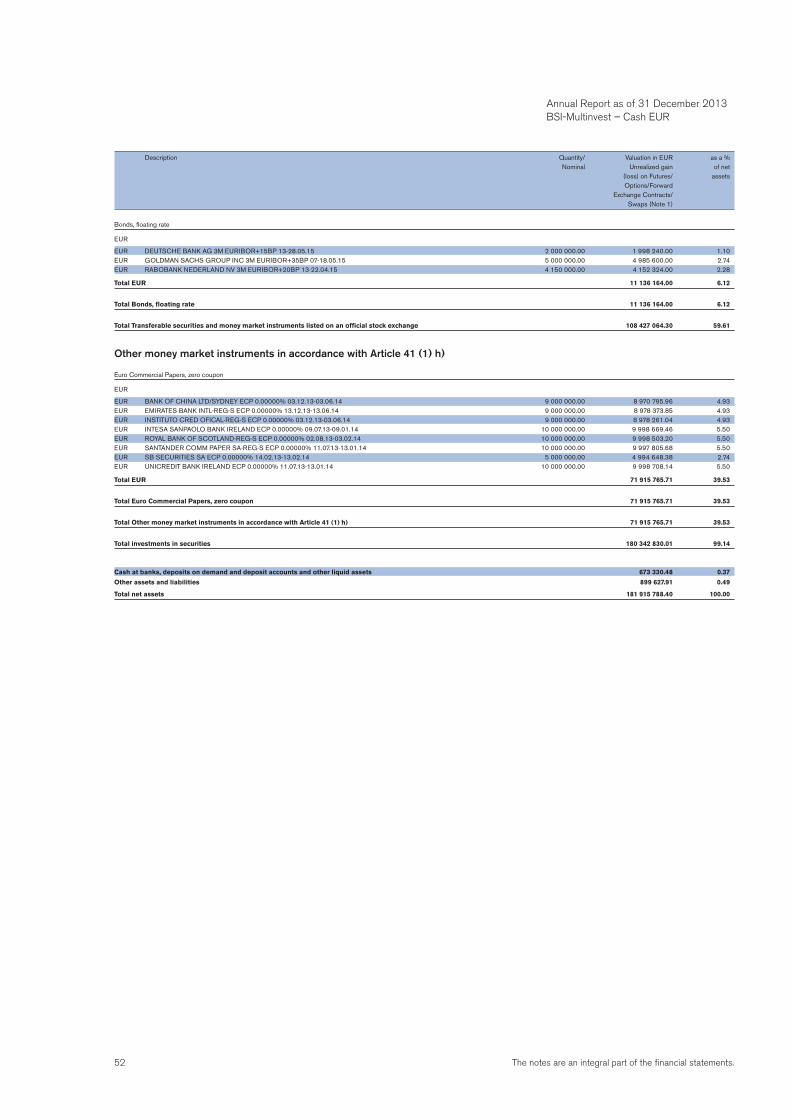
52 The notes are an integral part of the financial statements.
Bonds, floating rate
EUR
EUR DEUTSCHE BANK AG 3M EURIBOR+15BP 13-28.05.15 2 000 000.00 1 998 240.00 1.10EUR GOLDMAN SACHS GROUP INC 3M EURIBOR+35BP 07-18.05.15 5 000 000.00 4 985 600.00 2.74EUR RABOBANK NEDERLAND NV 3M EURIBOR+20BP 13-22.04.15 4 150 000.00 4 152 324.00 2.28
Total EUR 11 136 164.00 6.12
Total Bonds, floating rate 11 136 164.00 6.12
Total Transferable securities and money market instruments listed on an official stock exchange 108 427 064.30 59.61
Other money market instruments in accordance with Article 41 (1) h)
Euro Commercial Papers, zero coupon
EUR
EUR BANK OF CHINA LTD/SYDNEY ECP 0.00000% 03.12.13-03.06.14 9 000 000.00 8 970 795.96 4.93EUR EMIRATES BANK INTL-REG-S ECP 0.00000% 13.12.13-13.06.14 9 000 000.00 8 978 373.85 4.93EUR INSTITUTO CRED OFICAL-REG-S ECP 0.00000% 03.12.13-03.06.14 9 000 000.00 8 978 261.04 4.93EUR INTESA SANPAOLO BANK IRELAND ECP 0.00000% 09.07.13-09.01.14 10 000 000.00 9 998 669.46 5.50EUR ROYAL BANK OF SCOTLAND-REG-S ECP 0.00000% 02.08.13-03.02.14 10 000 000.00 9 998 503.20 5.50EUR SANTANDER COMM PAPER SA-REG-S ECP 0.00000% 11.07.13-13.01.14 10 000 000.00 9 997 805.68 5.50EUR SB SECURITIES SA ECP 0.00000% 14.02.13-13.02.14 5 000 000.00 4 994 648.38 2.74EUR UNICREDIT BANK IRELAND ECP 0.00000% 11.07.13-13.01.14 10 000 000.00 9 998 708.14 5.50
Total EUR 71 915 765.71 39.53
Total Euro Commercial Papers, zero coupon 71 915 765.71 39.53
Total Other money market instruments in accordance with Article 41 (1) h) 71 915 765.71 39.53
Total investments in securities 180 342 830.01 99.14
Cash at banks, deposits on demand and deposit accounts and other liquid assets 673 330.48 0.37
Other assets and liabilities 899 627.91 0.49
Total net assets 181 915 788.40 100.00
Description Quantity/ Valuation in EUR as a % Nominal Unrealized gain of net (loss) on Futures/ assets Options/Forward Exchange Contracts/ Swaps (Note 1)
Annual Report as of 31 December 2013 BSI-Multinvest – Cash EUR
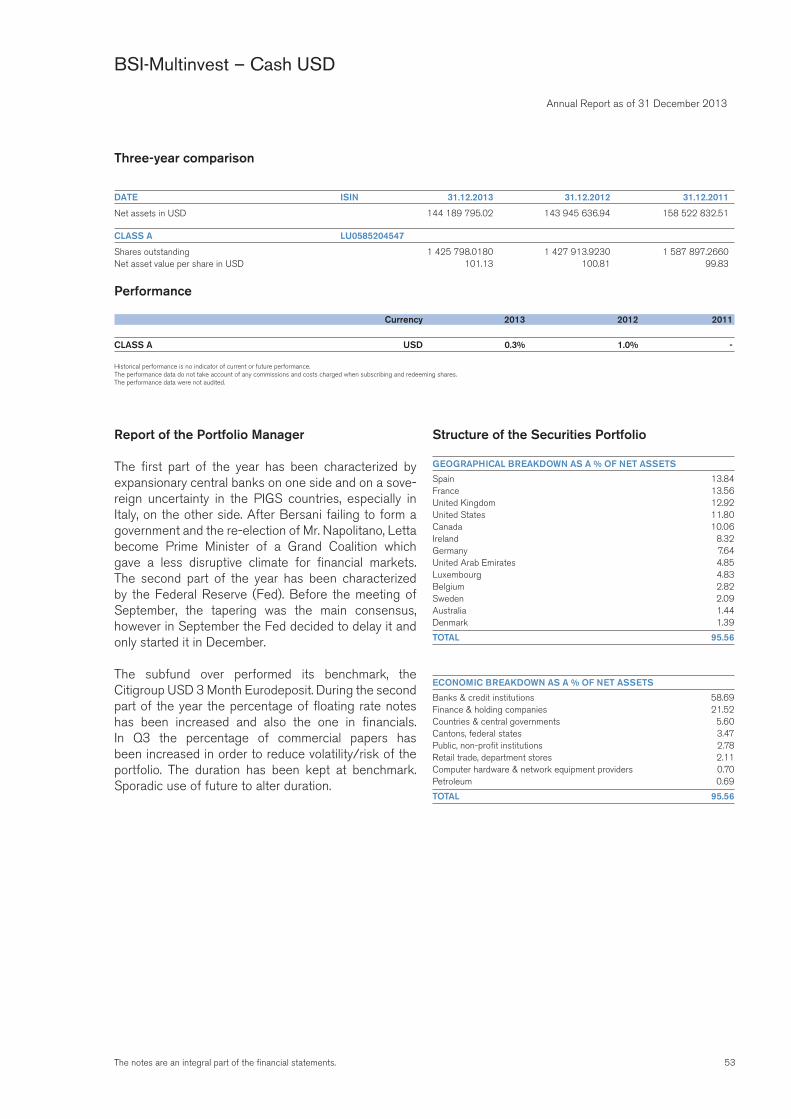
53The notes are an integral part of the financial statements.
Annual Report as of 31 December 2013
BSI-Multinvest – Cash USD
Three-year comparison
DATE ISIN 31.12.2013 31.12.2012 31.12.2011
Net assets in USD 144 189 795.02 143 945 636.94 158 522 832.51
CLASS A LU0585204547
Shares outstanding 1 425 798.0180 1 427 913.9230 1 587 897.2660Net asset value per share in USD 101.13 100.81 99.83
Performance
Currency 2013 2012 2011
CLASS A USD 0.3% 1.0% -
Historical performance is no indicator of current or future performance.The performance data do not take account of any commissions and costs charged when subscribing and redeeming shares.The performance data were not audited.
Report of the Portfolio Manager
The first part of the year has been characterized by expansionary central banks on one side and on a sove-reign uncertainty in the PIGS countries, especially in Italy, on the other side. After Bersani failing to form a government and the re-election of Mr. Napolitano, Letta become Prime Minister of a Grand Coalition which gave a less disruptive climate for financial markets. The second part of the year has been characterized by the Federal Reserve (Fed). Before the meeting of September, the tapering was the main consensus, however in September the Fed decided to delay it and only started it in December.
The subfund over performed its benchmark, the Citigroup USD 3 Month Eurodeposit. During the second part of the year the percentage of floating rate notes has been increased and also the one in financials. In Q3 the percentage of commercial papers has been increased in order to reduce volatility/risk of the portfolio. The duration has been kept at benchmark. Sporadic use of future to alter duration.
Structure of the Securities Portfolio
GEOGRAPHICAL BREAKDOWN AS A % OF NET ASSETS
Spain 13.84France 13.56United Kingdom 12.92United States 11.80Canada 10.06Ireland 8.32Germany 7.64United Arab Emirates 4.85Luxembourg 4.83Belgium 2.82Sweden 2.09Australia 1.44Denmark 1.39
TOTAL 95.56
ECONOMIC BREAKDOWN AS A % OF NET ASSETS
Banks & credit institutions 58.69Finance & holding companies 21.52Countries & central governments 5.60Cantons, federal states 3.47Public, non-profit institutions 2.78Retail trade, department stores 2.11Computer hardware & network equipment providers 0.70Petroleum 0.69
TOTAL 95.56
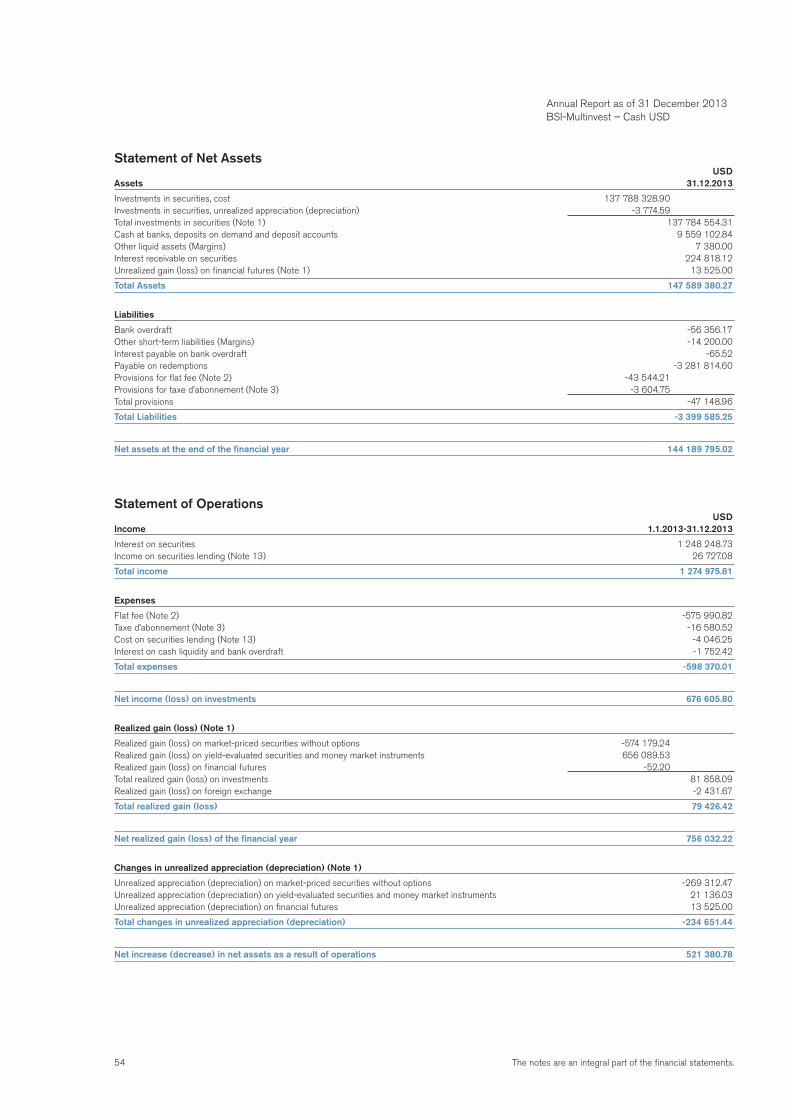
54 The notes are an integral part of the financial statements.
Statement of Net Assets USDAssets 31.12.2013
Investments in securities, cost 137 788 328.90Investments in securities, unrealized appreciation (depreciation) -3 774.59Total investments in securities (Note 1) 137 784 554.31Cash at banks, deposits on demand and deposit accounts 9 559 102.84Other liquid assets (Margins) 7 380.00Interest receivable on securities 224 818.12Unrealized gain (loss) on financial futures (Note 1) 13 525.00
Total Assets 147 589 380.27
Liabilities
Bank overdraft -56 356.17Other short-term liabilities (Margins) -14 200.00Interest payable on bank overdraft -65.52Payable on redemptions -3 281 814.60Provisions for flat fee (Note 2) -43 544.21Provisions for taxe d’abonnement (Note 3) -3 604.75Total provisions -47 148.96
Total Liabilities -3 399 585.25
Net assets at the end of the financial year 144 189 795.02
Statement of Operations USDIncome 1.1.2013-31.12.2013
Interest on securities 1 248 248.73Income on securities lending (Note 13) 26 727.08
Total income 1 274 975.81
Expenses
Flat fee (Note 2) -575 990.82Taxe d’abonnement (Note 3) -16 580.52Cost on securities lending (Note 13) -4 046.25Interest on cash liquidity and bank overdraft -1 752.42
Total expenses -598 370.01
Net income (loss) on investments 676 605.80
Realized gain (loss) (Note 1)
Realized gain (loss) on market-priced securities without options -574 179.24Realized gain (loss) on yield-evaluated securities and money market instruments 656 089.53Realized gain (loss) on financial futures -52.20Total realized gain (loss) on investments 81 858.09Realized gain (loss) on foreign exchange -2 431.67
Total realized gain (loss) 79 426.42
Net realized gain (loss) of the financial year 756 032.22
Changes in unrealized appreciation (depreciation) (Note 1)
Unrealized appreciation (depreciation) on market-priced securities without options -269 312.47Unrealized appreciation (depreciation) on yield-evaluated securities and money market instruments 21 136.03Unrealized appreciation (depreciation) on financial futures 13 525.00
Total changes in unrealized appreciation (depreciation) -234 651.44
Net increase (decrease) in net assets as a result of operations 521 380.78
Annual Report as of 31 December 2013 BSI-Multinvest – Cash USD
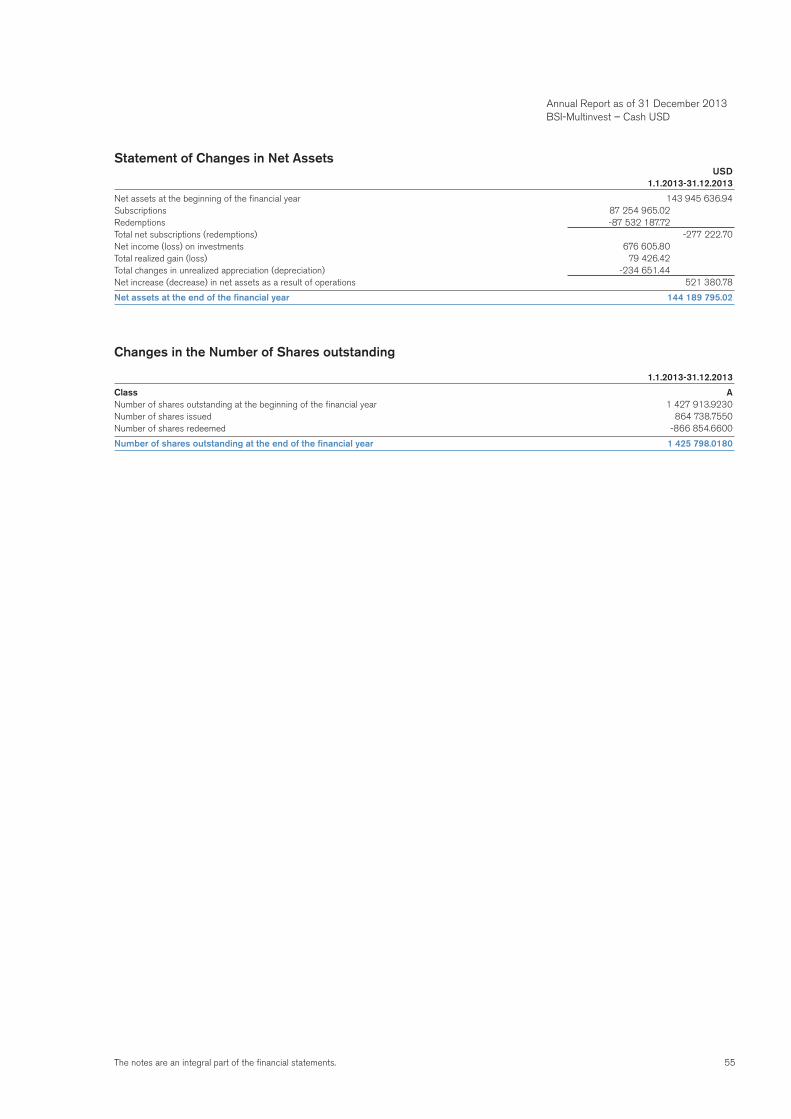
55The notes are an integral part of the financial statements.
Statement of Changes in Net Assets USD 1.1.2013-31.12.2013
Net assets at the beginning of the financial year 143 945 636.94Subscriptions 87 254 965.02Redemptions -87 532 187.72Total net subscriptions (redemptions) -277 222.70Net income (loss) on investments 676 605.80Total realized gain (loss) 79 426.42Total changes in unrealized appreciation (depreciation) -234 651.44Net increase (decrease) in net assets as a result of operations 521 380.78
Net assets at the end of the financial year 144 189 795.02
Changes in the Number of Shares outstanding
1.1.2013-31.12.2013
Class ANumber of shares outstanding at the beginning of the financial year 1 427 913.9230Number of shares issued 864 738.7550Number of shares redeemed -866 854.6600
Number of shares outstanding at the end of the financial year 1 425 798.0180
Annual Report as of 31 December 2013 BSI-Multinvest – Cash USD
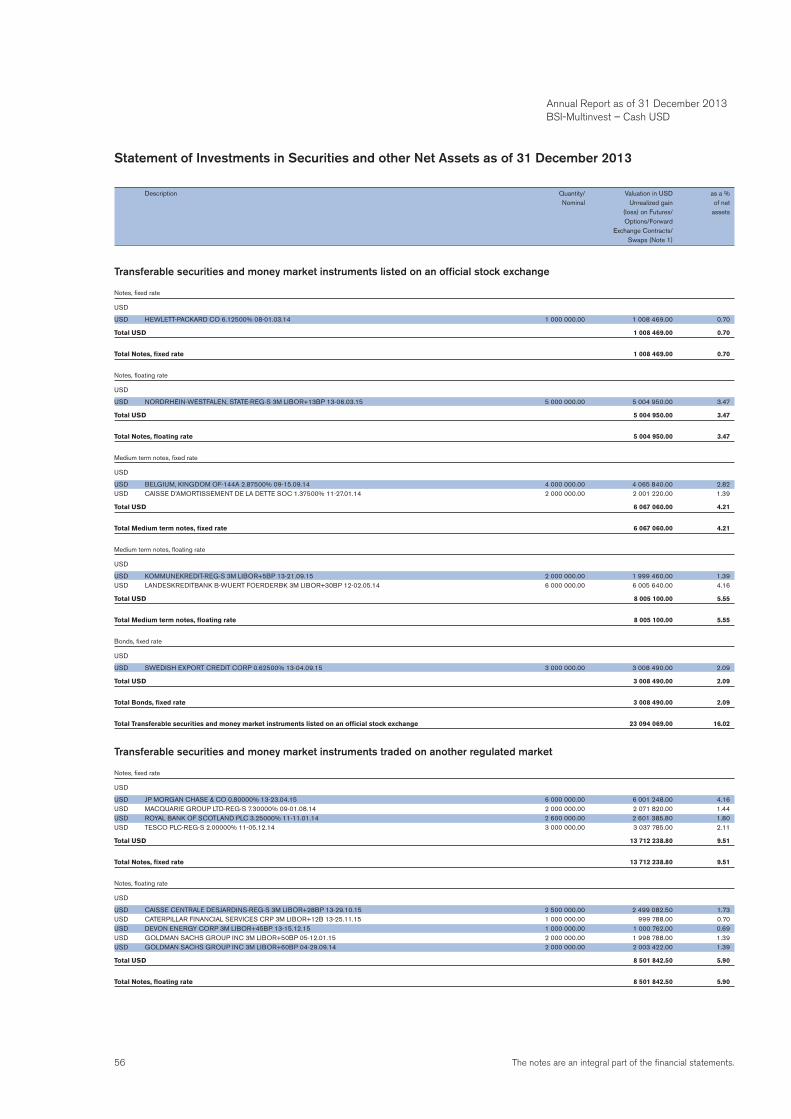
56 The notes are an integral part of the financial statements.
Statement of Investments in Securities and other Net Assets as of 31 December 2013
Description Quantity/ Valuation in USD as a % Nominal Unrealized gain of net (loss) on Futures/ assets Options/Forward Exchange Contracts/ Swaps (Note 1)
Transferable securities and money market instruments listed on an official stock exchange
Notes, fixed rate
USD
USD HEWLETT-PACKARD CO 6.12500% 08-01.03.14 1 000 000.00 1 008 469.00 0.70
Total USD 1 008 469.00 0.70
Total Notes, fixed rate 1 008 469.00 0.70
Notes, floating rate
USD
USD NORDRHEIN-WESTFALEN, STATE-REG-S 3M LIBOR+13BP 13-06.03.15 5 000 000.00 5 004 950.00 3.47
Total USD 5 004 950.00 3.47
Total Notes, floating rate 5 004 950.00 3.47
Medium term notes, fixed rate
USD
USD BELGIUM, KINGDOM OF-144A 2.87500% 09-15.09.14 4 000 000.00 4 065 840.00 2.82USD CAISSE D’AMORTISSEMENT DE LA DETTE SOC 1.37500% 11-27.01.14 2 000 000.00 2 001 220.00 1.39
Total USD 6 067 060.00 4.21
Total Medium term notes, fixed rate 6 067 060.00 4.21
Medium term notes, floating rate
USD
USD KOMMUNEKREDIT-REG-S 3M LIBOR+5BP 13-21.09.15 2 000 000.00 1 999 460.00 1.39USD LANDESKREDITBANK B-WUERT FOERDERBK 3M LIBOR+30BP 12-02.05.14 6 000 000.00 6 005 640.00 4.16
Total USD 8 005 100.00 5.55
Total Medium term notes, floating rate 8 005 100.00 5.55
Bonds, fixed rate
USD
USD SWEDISH EXPORT CREDIT CORP 0.62500% 13-04.09.15 3 000 000.00 3 008 490.00 2.09
Total USD 3 008 490.00 2.09
Total Bonds, fixed rate 3 008 490.00 2.09
Total Transferable securities and money market instruments listed on an official stock exchange 23 094 069.00 16.02
Transferable securities and money market instruments traded on another regulated market
Notes, fixed rate
USD
USD JP MORGAN CHASE & CO 0.80000% 13-23.04.15 6 000 000.00 6 001 248.00 4.16USD MACQUARIE GROUP LTD-REG-S 7.30000% 09-01.08.14 2 000 000.00 2 071 820.00 1.44USD ROYAL BANK OF SCOTLAND PLC 3.25000% 11-11.01.14 2 600 000.00 2 601 385.80 1.80USD TESCO PLC-REG-S 2.00000% 11-05.12.14 3 000 000.00 3 037 785.00 2.11
Total USD 13 712 238.80 9.51
Total Notes, fixed rate 13 712 238.80 9.51
Notes, floating rate
USD
USD CAISSE CENTRALE DESJARDINS-REG-S 3M LIBOR+28BP 13-29.10.15 2 500 000.00 2 499 082.50 1.73USD CATERPILLAR FINANCIAL SERVICES CRP 3M LIBOR+12B 13-25.11.15 1 000 000.00 999 788.00 0.70USD DEVON ENERGY CORP 3M LIBOR+45BP 13-15.12.15 1 000 000.00 1 000 762.00 0.69USD GOLDMAN SACHS GROUP INC 3M LIBOR+50BP 05-12.01.15 2 000 000.00 1 998 788.00 1.39USD GOLDMAN SACHS GROUP INC 3M LIBOR+60BP 04-29.09.14 2 000 000.00 2 003 422.00 1.39
Total USD 8 501 842.50 5.90
Total Notes, floating rate 8 501 842.50 5.90
Annual Report as of 31 December 2013 BSI-Multinvest – Cash USD
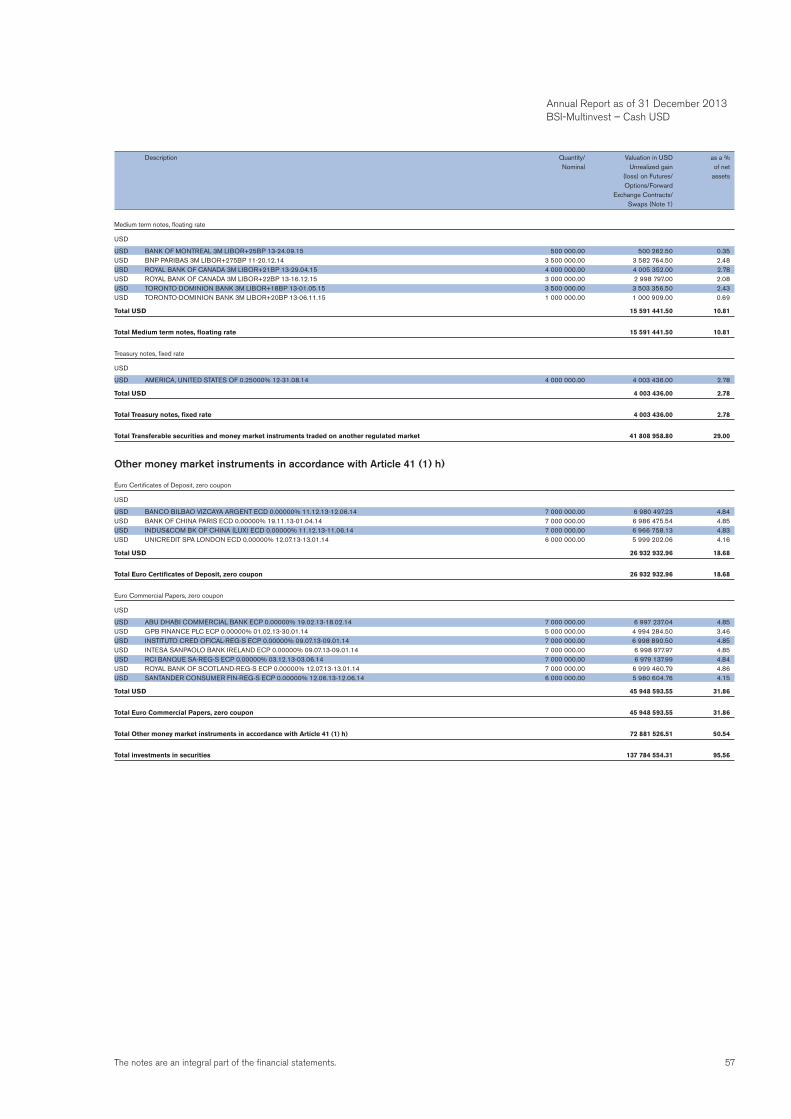
57The notes are an integral part of the financial statements.
Medium term notes, floating rate
USD
USD BANK OF MONTREAL 3M LIBOR+25BP 13-24.09.15 500 000.00 500 262.50 0.35USD BNP PARIBAS 3M LIBOR+275BP 11-20.12.14 3 500 000.00 3 582 764.50 2.48USD ROYAL BANK OF CANADA 3M LIBOR+21BP 13-29.04.15 4 000 000.00 4 005 352.00 2.78USD ROYAL BANK OF CANADA 3M LIBOR+22BP 13-16.12.15 3 000 000.00 2 998 797.00 2.08USD TORONTO DOMINION BANK 3M LIBOR+18BP 13-01.05.15 3 500 000.00 3 503 356.50 2.43USD TORONTO-DOMINION BANK 3M LIBOR+20BP 13-06.11.15 1 000 000.00 1 000 909.00 0.69
Total USD 15 591 441.50 10.81
Total Medium term notes, floating rate 15 591 441.50 10.81
Treasury notes, fixed rate
USD
USD AMERICA, UNITED STATES OF 0.25000% 12-31.08.14 4 000 000.00 4 003 436.00 2.78
Total USD 4 003 436.00 2.78
Total Treasury notes, fixed rate 4 003 436.00 2.78
Total Transferable securities and money market instruments traded on another regulated market 41 808 958.80 29.00
Other money market instruments in accordance with Article 41 (1) h)
Euro Certificates of Deposit, zero coupon
USD
USD BANCO BILBAO VIZCAYA ARGENT ECD 0.00000% 11.12.13-12.06.14 7 000 000.00 6 980 497.23 4.84USD BANK OF CHINA PARIS ECD 0.00000% 19.11.13-01.04.14 7 000 000.00 6 986 475.54 4.85USD INDUS&COM BK OF CHINA (LUX) ECD 0.00000% 11.12.13-11.06.14 7 000 000.00 6 966 758.13 4.83USD UNICREDIT SPA LONDON ECD 0.00000% 12.07.13-13.01.14 6 000 000.00 5 999 202.06 4.16
Total USD 26 932 932.96 18.68
Total Euro Certificates of Deposit, zero coupon 26 932 932.96 18.68
Euro Commercial Papers, zero coupon
USD
USD ABU DHABI COMMERCIAL BANK ECP 0.00000% 19.02.13-18.02.14 7 000 000.00 6 997 237.04 4.85USD GPB FINANCE PLC ECP 0.00000% 01.02.13-30.01.14 5 000 000.00 4 994 284.50 3.46USD INSTITUTO CRED OFICAL-REG-S ECP 0.00000% 09.07.13-09.01.14 7 000 000.00 6 998 890.50 4.85USD INTESA SANPAOLO BANK IRELAND ECP 0.00000% 09.07.13-09.01.14 7 000 000.00 6 998 977.97 4.85USD RCI BANQUE SA-REG-S ECP 0.00000% 03.12.13-03.06.14 7 000 000.00 6 979 137.99 4.84USD ROYAL BANK OF SCOTLAND-REG-S ECP 0.00000% 12.07.13-13.01.14 7 000 000.00 6 999 460.79 4.86USD SANTANDER CONSUMER FIN-REG-S ECP 0.00000% 12.06.13-12.06.14 6 000 000.00 5 980 604.76 4.15
Total USD 45 948 593.55 31.86
Total Euro Commercial Papers, zero coupon 45 948 593.55 31.86
Total Other money market instruments in accordance with Article 41 (1) h) 72 881 526.51 50.54
Total investments in securities 137 784 554.31 95.56
Description Quantity/ Valuation in USD as a % Nominal Unrealized gain of net (loss) on Futures/ assets Options/Forward Exchange Contracts/ Swaps (Note 1)
Annual Report as of 31 December 2013 BSI-Multinvest – Cash USD

58 The notes are an integral part of the financial statements.
Derivative instruments
Derivative instruments listed on an official stock exchange
Financial Futures on interest rates
USD 90DAY EURO DOLLAR FUTURE 15.06.15 18.00 13 525.00 0.01Total Financial Futures on interest rates 13 525.00 0.01
Total Derivative instruments listed on an official stock exchange 13 525.00 0.01
Total Derivative instruments 13 525.00 0.01
Cash at banks, deposits on demand and deposit accounts and other liquid assets 9 566 482.84 6.63
Bank overdraft and other short-term liabilities -70 556.17 -0.05Other assets and liabilities -3 104 210.96 -2.15
Total net assets 144 189 795.02 100.00
Annual Report as of 31 December 2013 BSI-Multinvest – Cash USD
Description Quantity/ Valuation in USD as a % Nominal Unrealized gain of net (loss) on Futures/ assets Options/Forward Exchange Contracts/ Swaps (Note 1)
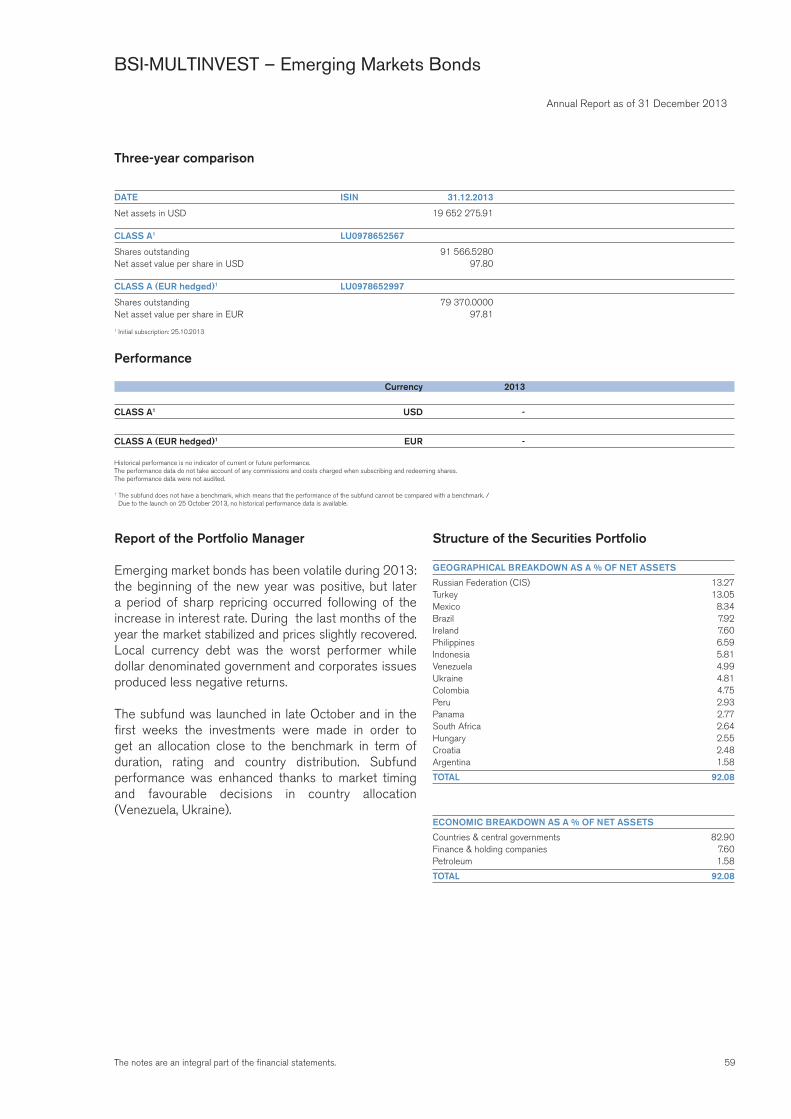
59The notes are an integral part of the financial statements.
Annual Report as of 31 December 2013
BSI-MULTINVEST – Emerging Markets Bonds
Three-year comparison
DATE ISIN 31.12.2013
Net assets in USD 19 652 275.91
CLASS A1 LU0978652567
Shares outstanding 91 566.5280Net asset value per share in USD 97.80
CLASS A (EUR hedged)1 LU0978652997
Shares outstanding 79 370.0000Net asset value per share in EUR 97.81
1 Initial subscription: 25.10.2013
Performance
Currency 2013
CLASS A1 USD -
CLASS A (EUR hedged)1 EUR -
Historical performance is no indicator of current or future performance.The performance data do not take account of any commissions and costs charged when subscribing and redeeming shares.The performance data were not audited.
1 The subfund does not have a benchmark, which means that the performance of the subfund cannot be compared with a benchmark. / Due to the launch on 25 October 2013, no historical performance data is available.
Report of the Portfolio Manager
Emerging market bonds has been volatile during 2013: the beginning of the new year was positive, but later a period of sharp repricing occurred following of the increase in interest rate. During the last months of the year the market stabilized and prices slightly recovered. Local currency debt was the worst performer while dollar denominated government and corporates issues produced less negative returns.
The subfund was launched in late October and in the first weeks the investments were made in order to get an allocation close to the benchmark in term of duration, rating and country distribution. Subfund performance was enhanced thanks to market timing and favourable decisions in country allocation (Venezuela, Ukraine).
Structure of the Securities Portfolio
GEOGRAPHICAL BREAKDOWN AS A % OF NET ASSETS
Russian Federation (CIS) 13.27Turkey 13.05Mexico 8.34Brazil 7.92Ireland 7.60Philippines 6.59Indonesia 5.81Venezuela 4.99Ukraine 4.81Colombia 4.75Peru 2.93Panama 2.77South Africa 2.64Hungary 2.55Croatia 2.48Argentina 1.58
TOTAL 92.08
ECONOMIC BREAKDOWN AS A % OF NET ASSETS
Countries & central governments 82.90Finance & holding companies 7.60Petroleum 1.58
TOTAL 92.08
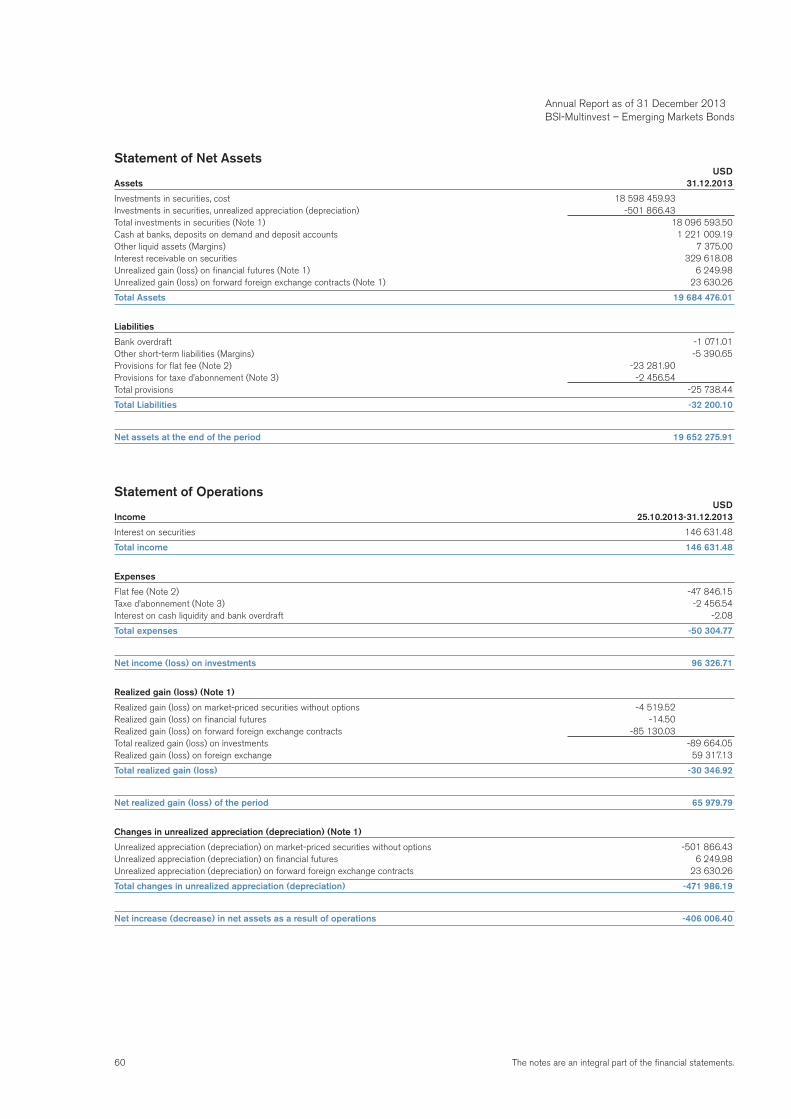
60 The notes are an integral part of the financial statements.
Statement of Net Assets USDAssets 31.12.2013
Investments in securities, cost 18 598 459.93Investments in securities, unrealized appreciation (depreciation) -501 866.43Total investments in securities (Note 1) 18 096 593.50Cash at banks, deposits on demand and deposit accounts 1 221 009.19Other liquid assets (Margins) 7 375.00Interest receivable on securities 329 618.08Unrealized gain (loss) on financial futures (Note 1) 6 249.98Unrealized gain (loss) on forward foreign exchange contracts (Note 1) 23 630.26
Total Assets 19 684 476.01
Liabilities
Bank overdraft -1 071.01Other short-term liabilities (Margins) -5 390.65Provisions for flat fee (Note 2) -23 281.90Provisions for taxe d’abonnement (Note 3) -2 456.54Total provisions -25 738.44
Total Liabilities -32 200.10
Net assets at the end of the period 19 652 275.91
Statement of Operations USDIncome 25.10.2013-31.12.2013
Interest on securities 146 631.48
Total income 146 631.48
Expenses
Flat fee (Note 2) -47 846.15Taxe d’abonnement (Note 3) -2 456.54Interest on cash liquidity and bank overdraft -2.08
Total expenses -50 304.77
Net income (loss) on investments 96 326.71
Realized gain (loss) (Note 1)
Realized gain (loss) on market-priced securities without options -4 519.52Realized gain (loss) on financial futures -14.50Realized gain (loss) on forward foreign exchange contracts -85 130.03Total realized gain (loss) on investments -89 664.05Realized gain (loss) on foreign exchange 59 317.13
Total realized gain (loss) -30 346.92
Net realized gain (loss) of the period 65 979.79
Changes in unrealized appreciation (depreciation) (Note 1)
Unrealized appreciation (depreciation) on market-priced securities without options -501 866.43Unrealized appreciation (depreciation) on financial futures 6 249.98Unrealized appreciation (depreciation) on forward foreign exchange contracts 23 630.26
Total changes in unrealized appreciation (depreciation) -471 986.19
Net increase (decrease) in net assets as a result of operations -406 006.40
Annual Report as of 31 December 2013 BSI-Multinvest – Emerging Markets Bonds
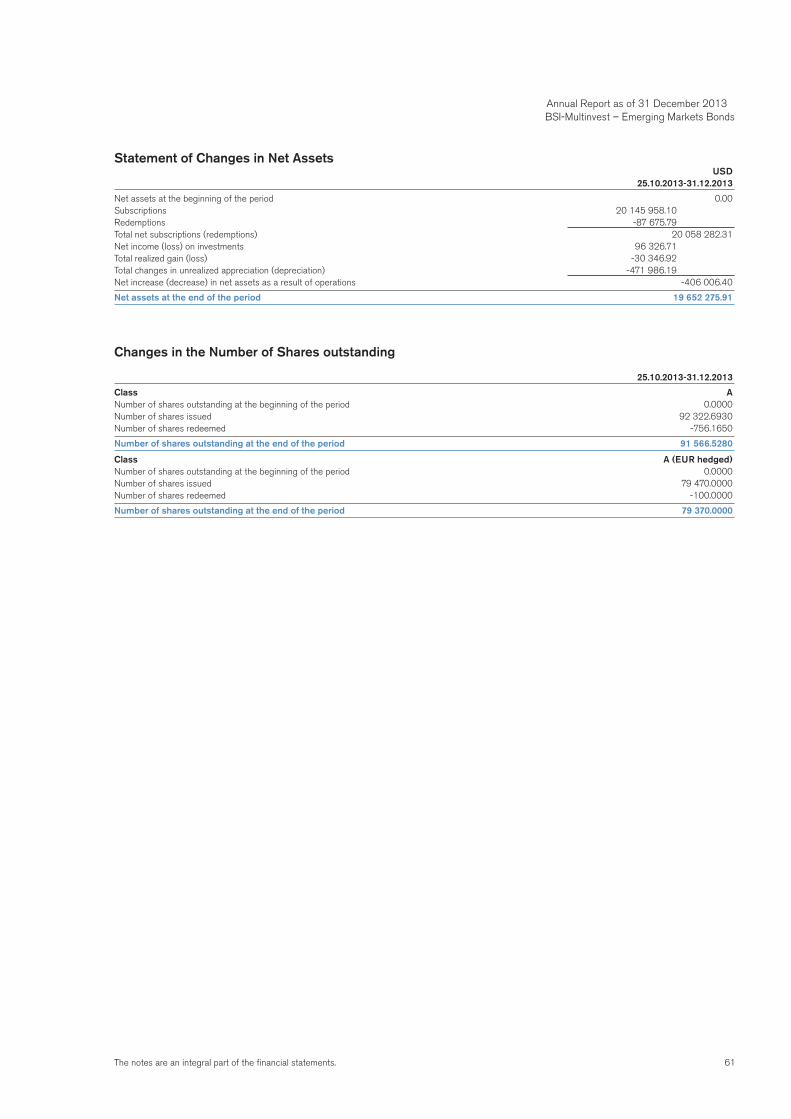
61The notes are an integral part of the financial statements.
Statement of Changes in Net Assets USD 25.10.2013-31.12.2013
Net assets at the beginning of the period 0.00Subscriptions 20 145 958.10Redemptions -87 675.79Total net subscriptions (redemptions) 20 058 282.31Net income (loss) on investments 96 326.71Total realized gain (loss) -30 346.92Total changes in unrealized appreciation (depreciation) -471 986.19Net increase (decrease) in net assets as a result of operations -406 006.40
Net assets at the end of the period 19 652 275.91
Changes in the Number of Shares outstanding
25.10.2013-31.12.2013
Class ANumber of shares outstanding at the beginning of the period 0.0000Number of shares issued 92 322.6930Number of shares redeemed -756.1650
Number of shares outstanding at the end of the period 91 566.5280
Class A (EUR hedged)Number of shares outstanding at the beginning of the period 0.0000Number of shares issued 79 470.0000Number of shares redeemed -100.0000
Number of shares outstanding at the end of the period 79 370.0000
Annual Report as of 31 December 2013 BSI-Multinvest – Emerging Markets Bonds
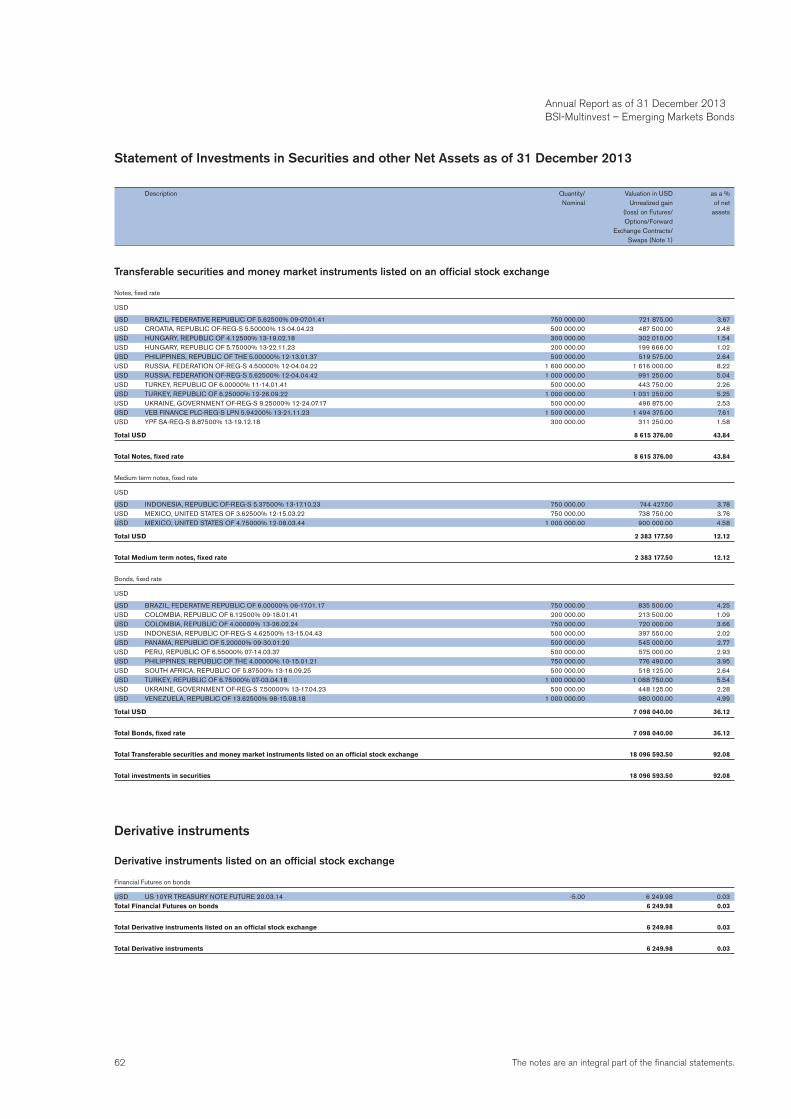
62 The notes are an integral part of the financial statements.
Annual Report as of 31 December 2013 BSI-Multinvest – Emerging Markets Bonds
Statement of Investments in Securities and other Net Assets as of 31 December 2013
Description Quantity/ Valuation in USD as a % Nominal Unrealized gain of net (loss) on Futures/ assets Options/Forward Exchange Contracts/ Swaps (Note 1)
Transferable securities and money market instruments listed on an official stock exchange
Notes, fixed rate
USD
USD BRAZIL, FEDERATIVE REPUBLIC OF 5.62500% 09-07.01.41 750 000.00 721 875.00 3.67USD CROATIA, REPUBLIC OF-REG-S 5.50000% 13-04.04.23 500 000.00 487 500.00 2.48USD HUNGARY, REPUBLIC OF 4.12500% 13-19.02.18 300 000.00 302 010.00 1.54USD HUNGARY, REPUBLIC OF 5.75000% 13-22.11.23 200 000.00 199 666.00 1.02USD PHILIPPINES, REPUBLIC OF THE 5.00000% 12-13.01.37 500 000.00 519 575.00 2.64USD RUSSIA, FEDERATION OF-REG-S 4.50000% 12-04.04.22 1 600 000.00 1 616 000.00 8.22USD RUSSIA, FEDERATION OF-REG-S 5.62500% 12-04.04.42 1 000 000.00 991 250.00 5.04USD TURKEY, REPUBLIC OF 6.00000% 11-14.01.41 500 000.00 443 750.00 2.26USD TURKEY, REPUBLIC OF 6.25000% 12-26.09.22 1 000 000.00 1 031 250.00 5.25USD UKRAINE, GOVERNMENT OF-REG-S 9.25000% 12-24.07.17 500 000.00 496 875.00 2.53USD VEB FINANCE PLC-REG-S LPN 5.94200% 13-21.11.23 1 500 000.00 1 494 375.00 7.61USD YPF SA-REG-S 8.87500% 13-19.12.18 300 000.00 311 250.00 1.58
Total USD 8 615 376.00 43.84
Total Notes, fixed rate 8 615 376.00 43.84
Medium term notes, fixed rate
USD
USD INDONESIA, REPUBLIC OF-REG-S 5.37500% 13-17.10.23 750 000.00 744 427.50 3.78USD MEXICO, UNITED STATES OF 3.62500% 12-15.03.22 750 000.00 738 750.00 3.76USD MEXICO, UNITED STATES OF 4.75000% 12-08.03.44 1 000 000.00 900 000.00 4.58
Total USD 2 383 177.50 12.12
Total Medium term notes, fixed rate 2 383 177.50 12.12
Bonds, fixed rate
USD
USD BRAZIL, FEDERATIVE REPUBLIC OF 6.00000% 06-17.01.17 750 000.00 835 500.00 4.25USD COLOMBIA, REPUBLIC OF 6.12500% 09-18.01.41 200 000.00 213 500.00 1.09USD COLOMBIA, REPUBLIC OF 4.00000% 13-26.02.24 750 000.00 720 000.00 3.66USD INDONESIA, REPUBLIC OF-REG-S 4.62500% 13-15.04.43 500 000.00 397 550.00 2.02USD PANAMA, REPUBLIC OF 5.20000% 09-30.01.20 500 000.00 545 000.00 2.77USD PERU, REPUBLIC OF 6.55000% 07-14.03.37 500 000.00 575 000.00 2.93USD PHILIPPINES, REPUBLIC OF THE 4.00000% 10-15.01.21 750 000.00 776 490.00 3.95USD SOUTH AFRICA, REPUBLIC OF 5.87500% 13-16.09.25 500 000.00 518 125.00 2.64USD TURKEY, REPUBLIC OF 6.75000% 07-03.04.18 1 000 000.00 1 088 750.00 5.54USD UKRAINE, GOVERNMENT OF-REG-S 7.50000% 13-17.04.23 500 000.00 448 125.00 2.28USD VENEZUELA, REPUBLIC OF 13.62500% 98-15.08.18 1 000 000.00 980 000.00 4.99
Total USD 7 098 040.00 36.12
Total Bonds, fixed rate 7 098 040.00 36.12
Total Transferable securities and money market instruments listed on an official stock exchange 18 096 593.50 92.08
Total investments in securities 18 096 593.50 92.08
Derivative instruments
Derivative instruments listed on an official stock exchange
Financial Futures on bonds
USD US 10YR TREASURY NOTE FUTURE 20.03.14 -5.00 6 249.98 0.03Total Financial Futures on bonds 6 249.98 0.03
Total Derivative instruments listed on an official stock exchange 6 249.98 0.03
Total Derivative instruments 6 249.98 0.03
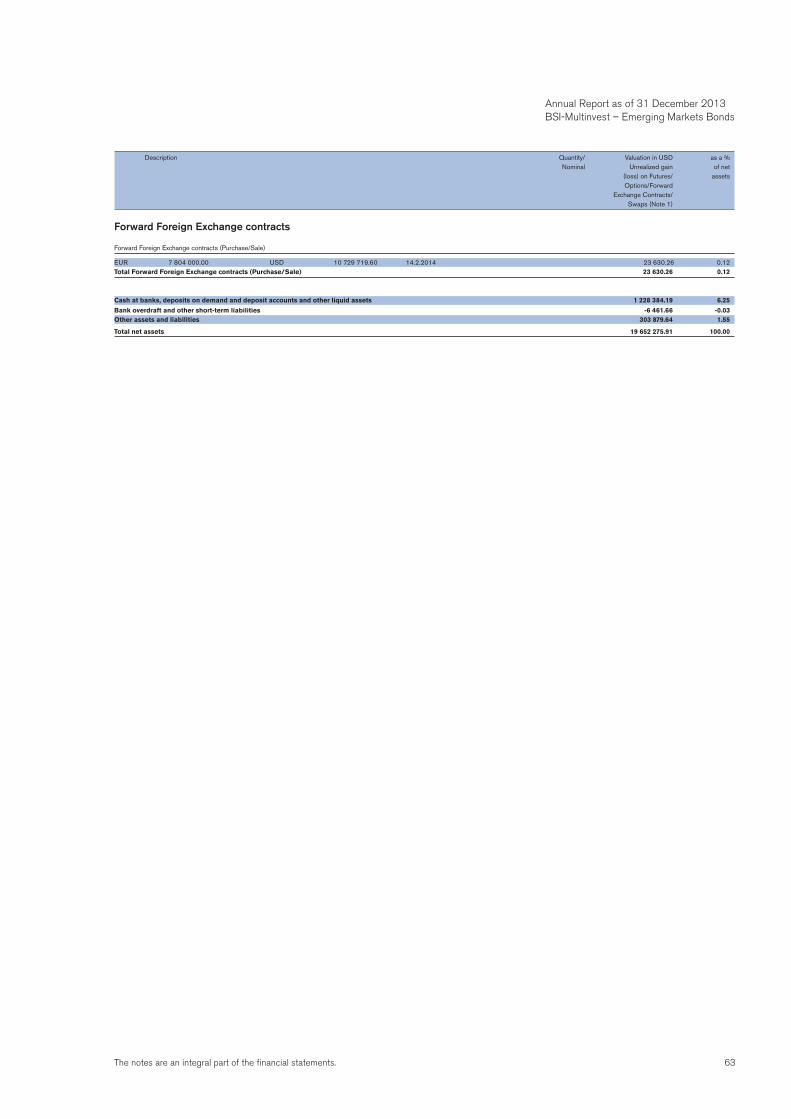
63The notes are an integral part of the financial statements.
Forward Foreign Exchange contracts
Forward Foreign Exchange contracts (Purchase/Sale)
EUR 7 804 000.00 USD 10 729 719.60 14.2.2014 23 630.26 0.12Total Forward Foreign Exchange contracts (Purchase/Sale) 23 630.26 0.12
Cash at banks, deposits on demand and deposit accounts and other liquid assets 1 228 384.19 6.25
Bank overdraft and other short-term liabilities -6 461.66 -0.03Other assets and liabilities 303 879.64 1.55
Total net assets 19 652 275.91 100.00
Description Quantity/ Valuation in USD as a % Nominal Unrealized gain of net (loss) on Futures/ assets Options/Forward Exchange Contracts/ Swaps (Note 1)
Annual Report as of 31 December 2013 BSI-Multinvest – Emerging Markets Bonds
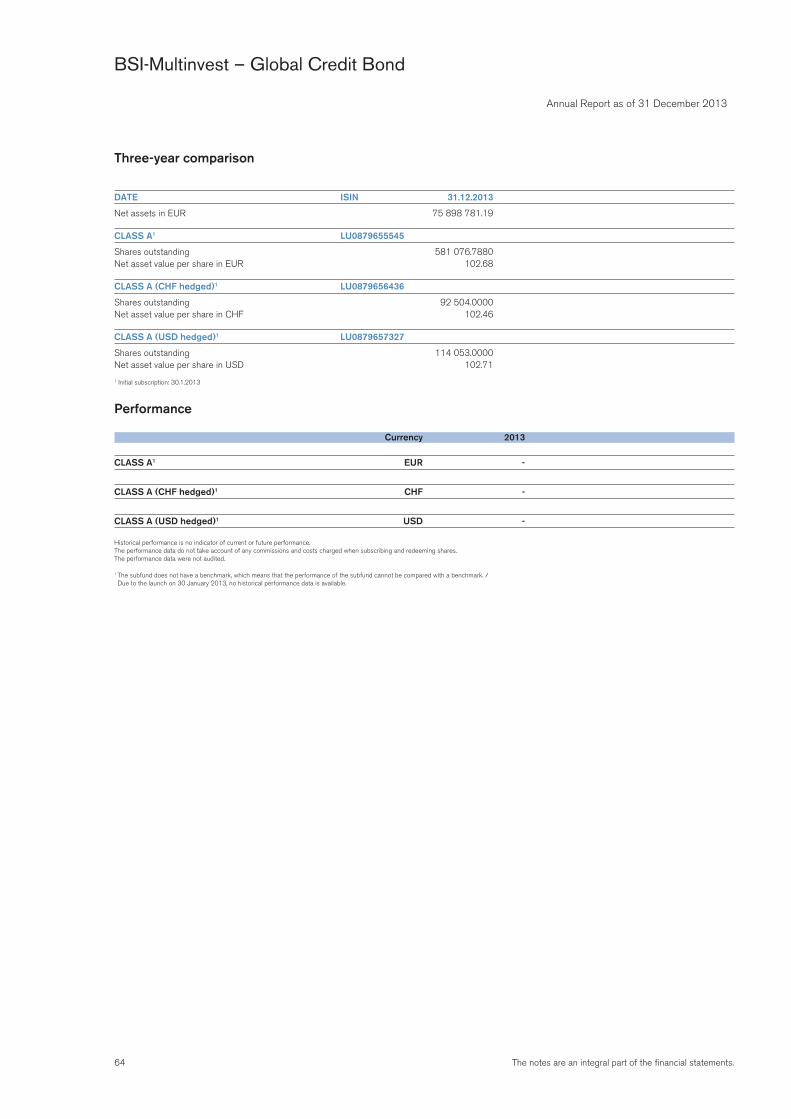
64 The notes are an integral part of the financial statements.
Annual Report as of 31 December 2013
BSI-Multinvest – Global Credit Bond
Three-year comparison
DATE ISIN 31.12.2013
Net assets in EUR 75 898 781.19
CLASS A1 LU0879655545
Shares outstanding 581 076.7880Net asset value per share in EUR 102.68
CLASS A (CHF hedged)1 LU0879656436
Shares outstanding 92 504.0000Net asset value per share in CHF 102.46
CLASS A (USD hedged)1 LU0879657327
Shares outstanding 114 053.0000Net asset value per share in USD 102.71
1 Initial subscription: 30.1.2013
Performance
Currency 2013
CLASS A1 EUR -
CLASS A (CHF hedged)1 CHF -
CLASS A (USD hedged)1 USD -
Historical performance is no indicator of current or future performance.The performance data do not take account of any commissions and costs charged when subscribing and redeeming shares.The performance data were not audited.
1 The subfund does not have a benchmark, which means that the performance of the subfund cannot be compared with a benchmark. / Due to the launch on 30 January 2013, no historical performance data is available.
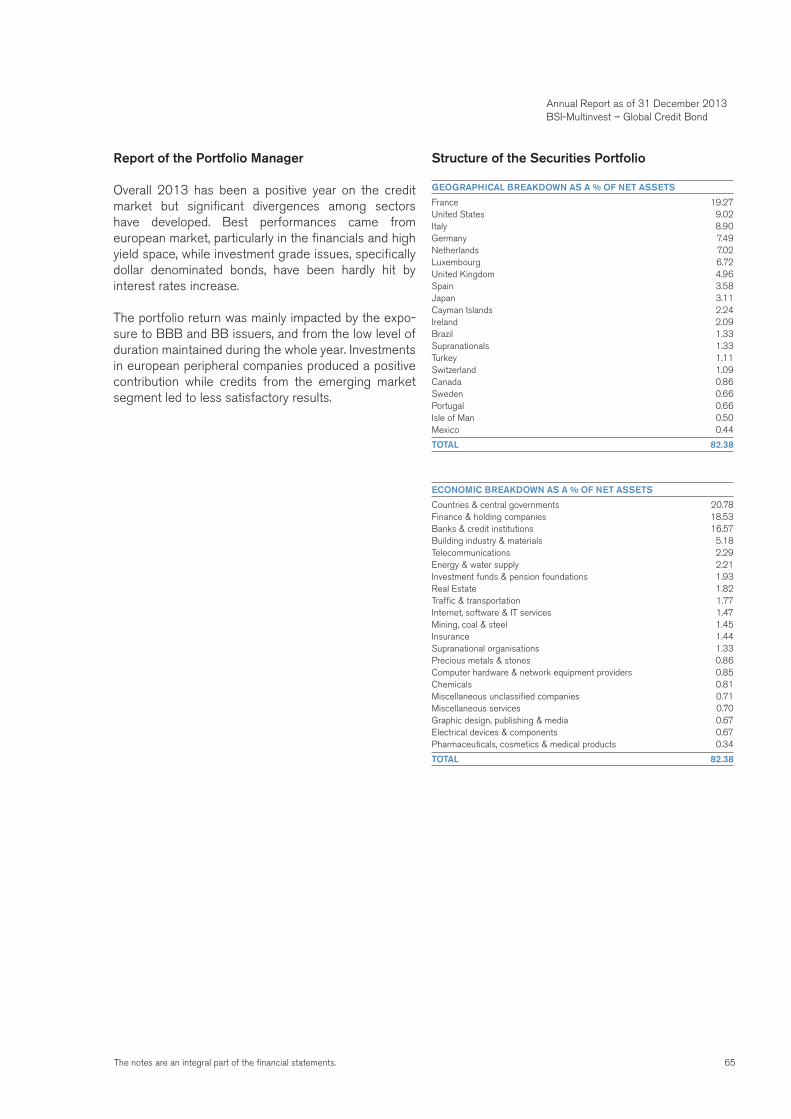
65The notes are an integral part of the financial statements.
Annual Report as of 31 December 2013 BSI-Multinvest – Global Credit Bond
Report of the Portfolio Manager
Overall 2013 has been a positive year on the credit market but significant divergences among sectors have developed. Best performances came from european market, particularly in the financials and high yield space, while investment grade issues, specifically dollar denominated bonds, have been hardly hit by interest rates increase.
The portfolio return was mainly impacted by the expo-sure to BBB and BB issuers, and from the low level of duration maintained during the whole year. Investments in european peripheral companies produced a positive contribution while credits from the emerging market segment led to less satisfactory results.
Structure of the Securities Portfolio
GEOGRAPHICAL BREAKDOWN AS A % OF NET ASSETS
France 19.27United States 9.02Italy 8.90Germany 7.49Netherlands 7.02Luxembourg 6.72United Kingdom 4.96Spain 3.58Japan 3.11Cayman Islands 2.24Ireland 2.09Brazil 1.33Supranationals 1.33Turkey 1.11Switzerland 1.09Canada 0.86Sweden 0.66Portugal 0.66Isle of Man 0.50Mexico 0.44
TOTAL 82.38
ECONOMIC BREAKDOWN AS A % OF NET ASSETS
Countries & central governments 20.78Finance & holding companies 18.53Banks & credit institutions 16.57Building industry & materials 5.18Telecommunications 2.29Energy & water supply 2.21Investment funds & pension foundations 1.93Real Estate 1.82Traffic & transportation 1.77Internet, software & IT services 1.47Mining, coal & steel 1.45Insurance 1.44Supranational organisations 1.33Precious metals & stones 0.86Computer hardware & network equipment providers 0.85Chemicals 0.81Miscellaneous unclassified companies 0.71Miscellaneous services 0.70Graphic design, publishing & media 0.67Electrical devices & components 0.67Pharmaceuticals, cosmetics & medical products 0.34
TOTAL 82.38
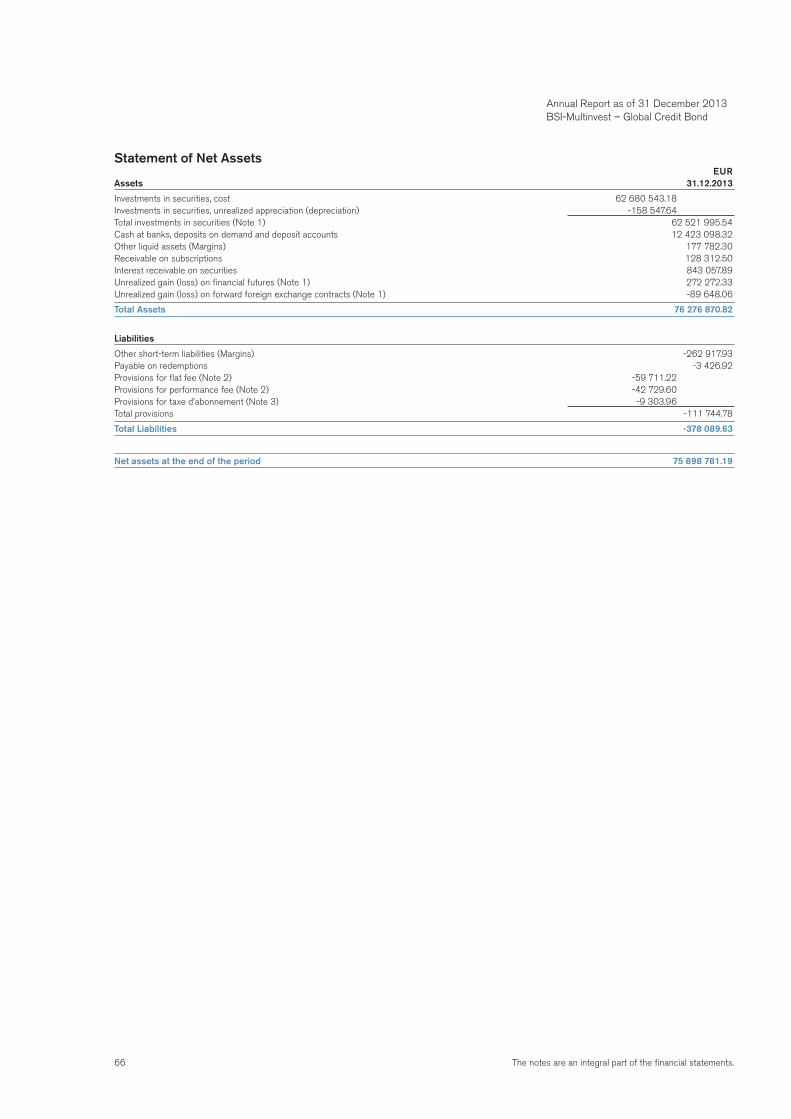
66 The notes are an integral part of the financial statements.
Statement of Net Assets EURAssets 31.12.2013
Investments in securities, cost 62 680 543.18Investments in securities, unrealized appreciation (depreciation) -158 547.64Total investments in securities (Note 1) 62 521 995.54Cash at banks, deposits on demand and deposit accounts 12 423 098.32Other liquid assets (Margins) 177 782.30Receivable on subscriptions 128 312.50Interest receivable on securities 843 057.89Unrealized gain (loss) on financial futures (Note 1) 272 272.33Unrealized gain (loss) on forward foreign exchange contracts (Note 1) -89 648.06
Total Assets 76 276 870.82
Liabilities
Other short-term liabilities (Margins) -262 917.93Payable on redemptions -3 426.92Provisions for flat fee (Note 2) -59 711.22Provisions for performance fee (Note 2) -42 729.60Provisions for taxe d’abonnement (Note 3) -9 303.96Total provisions -111 744.78
Total Liabilities -378 089.63
Net assets at the end of the period 75 898 781.19
Annual Report as of 31 December 2013 BSI-Multinvest – Global Credit Bond
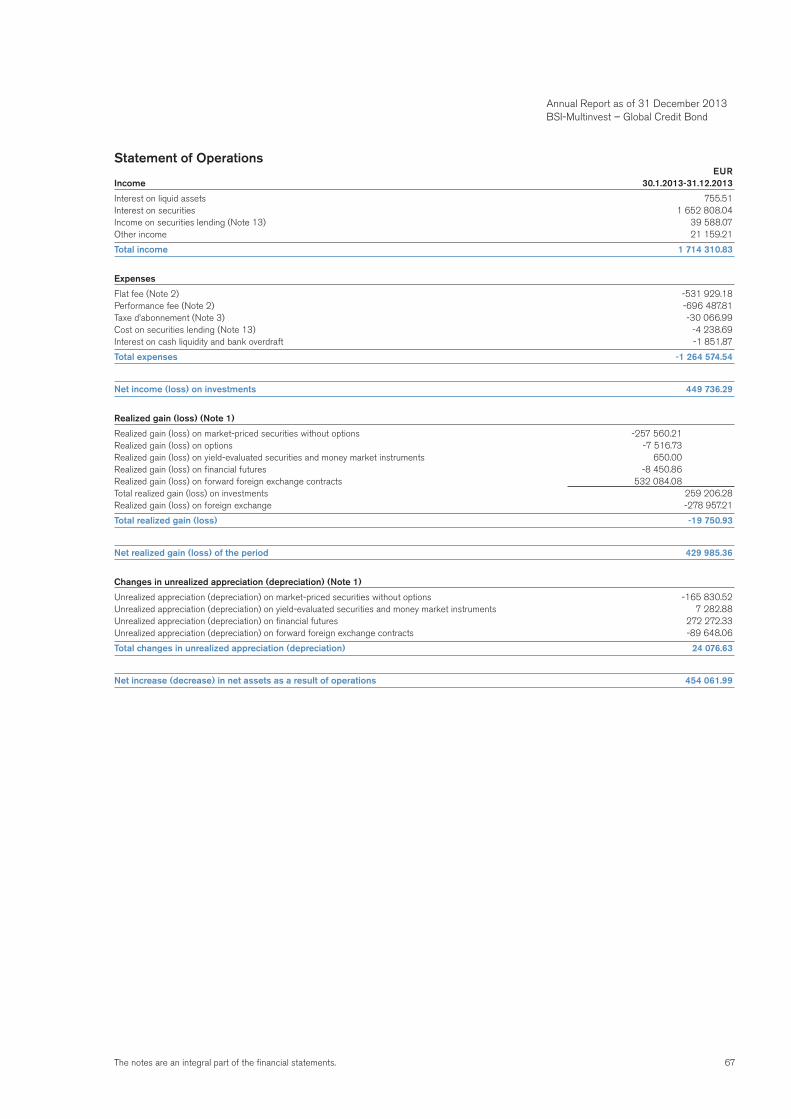
67The notes are an integral part of the financial statements.
Statement of Operations EURIncome 30.1.2013-31.12.2013
Interest on liquid assets 755.51Interest on securities 1 652 808.04Income on securities lending (Note 13) 39 588.07Other income 21 159.21
Total income 1 714 310.83
Expenses
Flat fee (Note 2) -531 929.18Performance fee (Note 2) -696 487.81Taxe d’abonnement (Note 3) -30 066.99Cost on securities lending (Note 13) -4 238.69Interest on cash liquidity and bank overdraft -1 851.87
Total expenses -1 264 574.54
Net income (loss) on investments 449 736.29
Realized gain (loss) (Note 1)
Realized gain (loss) on market-priced securities without options -257 560.21Realized gain (loss) on options -7 516.73Realized gain (loss) on yield-evaluated securities and money market instruments 650.00Realized gain (loss) on financial futures -8 450.86Realized gain (loss) on forward foreign exchange contracts 532 084.08Total realized gain (loss) on investments 259 206.28Realized gain (loss) on foreign exchange -278 957.21
Total realized gain (loss) -19 750.93
Net realized gain (loss) of the period 429 985.36
Changes in unrealized appreciation (depreciation) (Note 1)
Unrealized appreciation (depreciation) on market-priced securities without options -165 830.52Unrealized appreciation (depreciation) on yield-evaluated securities and money market instruments 7 282.88Unrealized appreciation (depreciation) on financial futures 272 272.33Unrealized appreciation (depreciation) on forward foreign exchange contracts -89 648.06
Total changes in unrealized appreciation (depreciation) 24 076.63
Net increase (decrease) in net assets as a result of operations 454 061.99
Annual Report as of 31 December 2013 BSI-Multinvest – Global Credit Bond
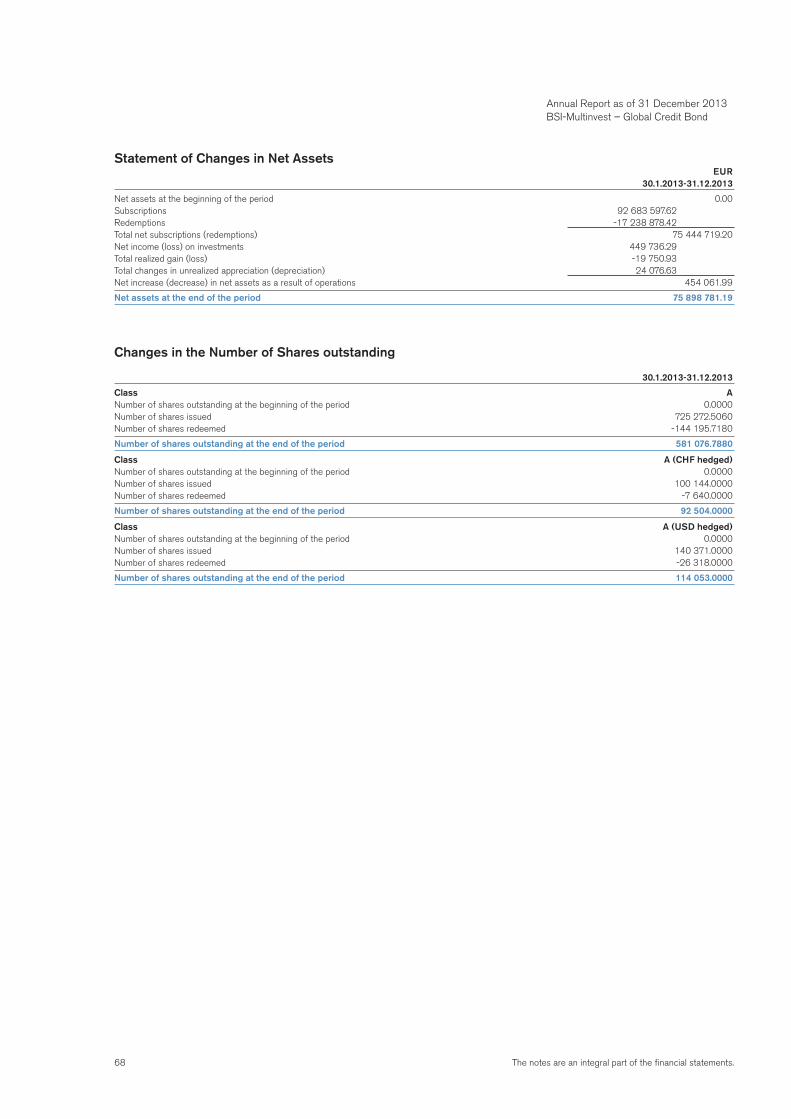
68 The notes are an integral part of the financial statements.
Annual Report as of 31 December 2013 BSI-Multinvest – Global Credit Bond
Statement of Changes in Net Assets EUR 30.1.2013-31.12.2013
Net assets at the beginning of the period 0.00Subscriptions 92 683 597.62Redemptions -17 238 878.42Total net subscriptions (redemptions) 75 444 719.20Net income (loss) on investments 449 736.29Total realized gain (loss) -19 750.93Total changes in unrealized appreciation (depreciation) 24 076.63Net increase (decrease) in net assets as a result of operations 454 061.99
Net assets at the end of the period 75 898 781.19
Changes in the Number of Shares outstanding
30.1.2013-31.12.2013
Class ANumber of shares outstanding at the beginning of the period 0.0000Number of shares issued 725 272.5060Number of shares redeemed -144 195.7180
Number of shares outstanding at the end of the period 581 076.7880
Class A (CHF hedged)Number of shares outstanding at the beginning of the period 0.0000Number of shares issued 100 144.0000Number of shares redeemed -7 640.0000
Number of shares outstanding at the end of the period 92 504.0000
Class A (USD hedged)Number of shares outstanding at the beginning of the period 0.0000Number of shares issued 140 371.0000Number of shares redeemed -26 318.0000
Number of shares outstanding at the end of the period 114 053.0000
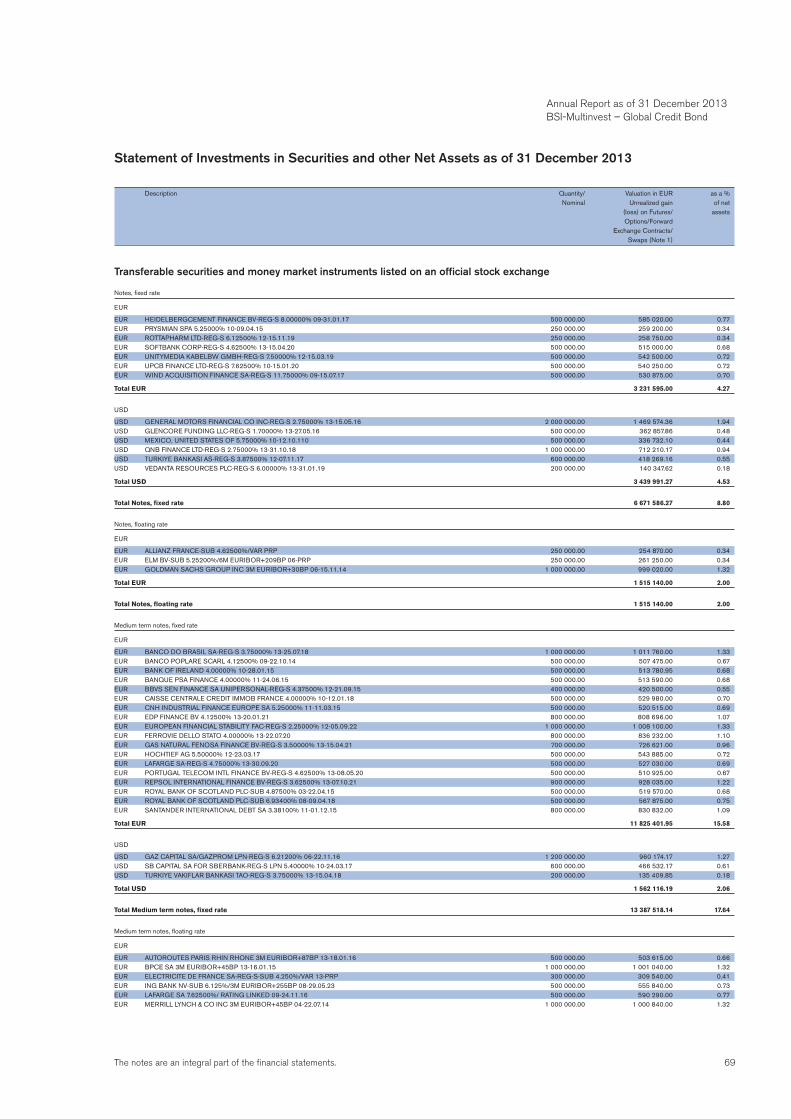
69The notes are an integral part of the financial statements.
Statement of Investments in Securities and other Net Assets as of 31 December 2013
Description Quantity/ Valuation in EUR as a % Nominal Unrealized gain of net (loss) on Futures/ assets Options/Forward Exchange Contracts/ Swaps (Note 1)
Transferable securities and money market instruments listed on an official stock exchange
Notes, fixed rate
EUR
EUR HEIDELBERGCEMENT FINANCE BV-REG-S 8.00000% 09-31.01.17 500 000.00 585 020.00 0.77EUR PRYSMIAN SPA 5.25000% 10-09.04.15 250 000.00 259 200.00 0.34EUR ROTTAPHARM LTD-REG-S 6.12500% 12-15.11.19 250 000.00 258 750.00 0.34EUR SOFTBANK CORP-REG-S 4.62500% 13-15.04.20 500 000.00 515 000.00 0.68EUR UNITYMEDIA KABELBW GMBH-REG-S 7.50000% 12-15.03.19 500 000.00 542 500.00 0.72EUR UPCB FINANCE LTD-REG-S 7.62500% 10-15.01.20 500 000.00 540 250.00 0.72EUR WIND ACQUISITION FINANCE SA-REG-S 11.75000% 09-15.07.17 500 000.00 530 875.00 0.70
Total EUR 3 231 595.00 4.27
USD
USD GENERAL MOTORS FINANCIAL CO INC-REG-S 2.75000% 13-15.05.16 2 000 000.00 1 469 574.36 1.94USD GLENCORE FUNDING LLC-REG-S 1.70000% 13-27.05.16 500 000.00 362 857.86 0.48USD MEXICO, UNITED STATES OF 5.75000% 10-12.10.110 500 000.00 336 732.10 0.44USD QNB FINANCE LTD-REG-S 2.75000% 13-31.10.18 1 000 000.00 712 210.17 0.94USD TURKIYE BANKASI AS-REG-S 3.87500% 12-07.11.17 600 000.00 418 269.16 0.55USD VEDANTA RESOURCES PLC-REG-S 6.00000% 13-31.01.19 200 000.00 140 347.62 0.18
Total USD 3 439 991.27 4.53
Total Notes, fixed rate 6 671 586.27 8.80
Notes, floating rate
EUR
EUR ALLIANZ FRANCE-SUB 4.62500%/VAR PRP 250 000.00 254 870.00 0.34EUR ELM BV-SUB 5.25200%/6M EURIBOR+209BP 06-PRP 250 000.00 261 250.00 0.34EUR GOLDMAN SACHS GROUP INC 3M EURIBOR+30BP 06-15.11.14 1 000 000.00 999 020.00 1.32
Total EUR 1 515 140.00 2.00
Total Notes, floating rate 1 515 140.00 2.00
Medium term notes, fixed rate
EUR
EUR BANCO DO BRASIL SA-REG-S 3.75000% 13-25.07.18 1 000 000.00 1 011 760.00 1.33EUR BANCO POPLARE SCARL 4.12500% 09-22.10.14 500 000.00 507 475.00 0.67EUR BANK OF IRELAND 4.00000% 10-28.01.15 500 000.00 513 780.95 0.68EUR BANQUE PSA FINANCE 4.00000% 11-24.06.15 500 000.00 513 590.00 0.68EUR BBVS SEN FINANCE SA UNIPERSONAL-REG-S 4.37500% 12-21.09.15 400 000.00 420 500.00 0.55EUR CAISSE CENTRALE CREDIT IMMOB FRANCE 4.00000% 10-12.01.18 500 000.00 529 980.00 0.70EUR CNH INDUSTRIAL FINANCE EUROPE SA 5.25000% 11-11.03.15 500 000.00 520 515.00 0.69EUR EDP FINANCE BV 4.12500% 13-20.01.21 800 000.00 808 696.00 1.07EUR EUROPEAN FINANCIAL STABILITY FAC-REG-S 2.25000% 12-05.09.22 1 000 000.00 1 008 100.00 1.33EUR FERROVIE DELLO STATO 4.00000% 13-22.07.20 800 000.00 836 232.00 1.10EUR GAS NATURAL FENOSA FINANCE BV-REG-S 3.50000% 13-15.04.21 700 000.00 726 621.00 0.96EUR HOCHTIEF AG 5.50000% 12-23.03.17 500 000.00 543 885.00 0.72EUR LAFARGE SA-REG-S 4.75000% 13-30.09.20 500 000.00 527 030.00 0.69EUR PORTUGAL TELECOM INTL FINANCE BV-REG-S 4.62500% 13-08.05.20 500 000.00 510 925.00 0.67EUR REPSOL INTERNATIONAL FINANCE BV-REG-S 3.62500% 13-07.10.21 900 000.00 928 035.00 1.22EUR ROYAL BANK OF SCOTLAND PLC-SUB 4.87500% 03-22.04.15 500 000.00 519 570.00 0.68EUR ROYAL BANK OF SCOTLAND PLC-SUB 6.93400% 08-09.04.18 500 000.00 567 875.00 0.75EUR SANTANDER INTERNATIONAL DEBT SA 3.38100% 11-01.12.15 800 000.00 830 832.00 1.09
Total EUR 11 825 401.95 15.58
USD
USD GAZ CAPITAL SA/GAZPROM LPN-REG-S 6.21200% 06-22.11.16 1 200 000.00 960 174.17 1.27USD SB CAPITAL SA FOR SBERBANK-REG-S LPN 5.40000% 10-24.03.17 600 000.00 466 532.17 0.61USD TURKIYE VAKIFLAR BANKASI TAO-REG-S 3.75000% 13-15.04.18 200 000.00 135 409.85 0.18
Total USD 1 562 116.19 2.06
Total Medium term notes, fixed rate 13 387 518.14 17.64
Medium term notes, floating rate
EUR
EUR AUTOROUTES PARIS RHIN RHONE 3M EURIBOR+87BP 13-18.01.16 500 000.00 503 615.00 0.66EUR BPCE SA 3M EURIBOR+45BP 13-16.01.15 1 000 000.00 1 001 040.00 1.32EUR ELECTRICITE DE FRANCE SA-REG-S-SUB 4.250%/VAR 13-PRP 300 000.00 309 540.00 0.41EUR ING BANK NV-SUB 6.125%/3M EURIBOR+255BP 08-29.05.23 500 000.00 555 840.00 0.73EUR LAFARGE SA 7.62500%/ RATING LINKED 09-24.11.16 500 000.00 590 290.00 0.77EUR MERRILL LYNCH & CO INC 3M EURIBOR+45BP 04-22.07.14 1 000 000.00 1 000 840.00 1.32
Annual Report as of 31 December 2013 BSI-Multinvest – Global Credit Bond
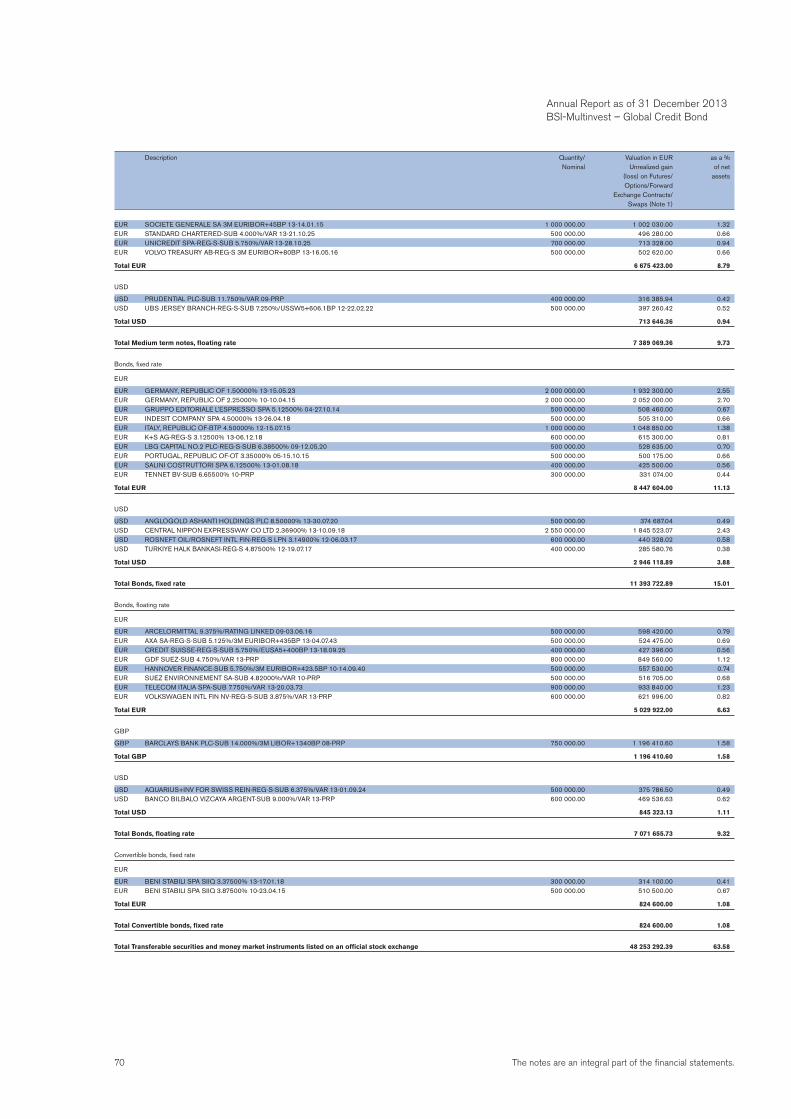
70 The notes are an integral part of the financial statements.
Annual Report as of 31 December 2013 BSI-Multinvest – Global Credit Bond
EUR SOCIETE GENERALE SA 3M EURIBOR+45BP 13-14.01.15 1 000 000.00 1 002 030.00 1.32EUR STANDARD CHARTERED-SUB 4.000%/VAR 13-21.10.25 500 000.00 496 280.00 0.66EUR UNICREDIT SPA-REG-S-SUB 5.750%/VAR 13-28.10.25 700 000.00 713 328.00 0.94EUR VOLVO TREASURY AB-REG-S 3M EURIBOR+80BP 13-16.05.16 500 000.00 502 620.00 0.66
Total EUR 6 675 423.00 8.79
USD
USD PRUDENTIAL PLC-SUB 11.750%/VAR 09-PRP 400 000.00 316 385.94 0.42USD UBS JERSEY BRANCH-REG-S-SUB 7.250%/USSW5+606.1BP 12-22.02.22 500 000.00 397 260.42 0.52
Total USD 713 646.36 0.94
Total Medium term notes, floating rate 7 389 069.36 9.73
Bonds, fixed rate
EUR
EUR GERMANY, REPUBLIC OF 1.50000% 13-15.05.23 2 000 000.00 1 932 300.00 2.55EUR GERMANY, REPUBLIC OF 2.25000% 10-10.04.15 2 000 000.00 2 052 000.00 2.70EUR GRUPPO EDITORIALE L’ESPRESSO SPA 5.12500% 04-27.10.14 500 000.00 508 460.00 0.67EUR INDESIT COMPANY SPA 4.50000% 13-26.04.18 500 000.00 505 310.00 0.66EUR ITALY, REPUBLIC OF-BTP 4.50000% 12-15.07.15 1 000 000.00 1 048 850.00 1.38EUR K+S AG-REG-S 3.12500% 13-06.12.18 600 000.00 615 300.00 0.81EUR LBG CAPITAL NO.2 PLC-REG-S-SUB 6.38500% 09-12.05.20 500 000.00 528 635.00 0.70EUR PORTUGAL, REPUBLIC OF-OT 3.35000% 05-15.10.15 500 000.00 500 175.00 0.66EUR SALINI COSTRUTTORI SPA 6.12500% 13-01.08.18 400 000.00 425 500.00 0.56EUR TENNET BV-SUB 6.65500% 10-PRP 300 000.00 331 074.00 0.44
Total EUR 8 447 604.00 11.13
USD
USD ANGLOGOLD ASHANTI HOLDINGS PLC 8.50000% 13-30.07.20 500 000.00 374 687.04 0.49USD CENTRAL NIPPON EXPRESSWAY CO LTD 2.36900% 13-10.09.18 2 550 000.00 1 845 523.07 2.43USD ROSNEFT OIL/ROSNEFT INTL FIN-REG-S LPN 3.14900% 12-06.03.17 600 000.00 440 328.02 0.58USD TURKIYE HALK BANKASI-REG-S 4.87500% 12-19.07.17 400 000.00 285 580.76 0.38
Total USD 2 946 118.89 3.88
Total Bonds, fixed rate 11 393 722.89 15.01
Bonds, floating rate
EUR
EUR ARCELORMITTAL 9.375%/RATING LINKED 09-03.06.16 500 000.00 598 420.00 0.79EUR AXA SA-REG-S-SUB 5.125%/3M EURIBOR+435BP 13-04.07.43 500 000.00 524 475.00 0.69EUR CREDIT SUISSE-REG-S-SUB 5.750%/EUSA5+400BP 13-18.09.25 400 000.00 427 396.00 0.56EUR GDF SUEZ-SUB 4.750%/VAR 13-PRP 800 000.00 849 560.00 1.12EUR HANNOVER FINANCE-SUB 5.750%/3M EURIBOR+423.5BP 10-14.09.40 500 000.00 557 530.00 0.74EUR SUEZ ENVIRONNEMENT SA-SUB 4.82000%/VAR 10-PRP 500 000.00 516 705.00 0.68EUR TELECOM ITALIA SPA-SUB 7.750%/VAR 13-20.03.73 900 000.00 933 840.00 1.23EUR VOLKSWAGEN INTL FIN NV-REG-S-SUB 3.875%/VAR 13-PRP 600 000.00 621 996.00 0.82
Total EUR 5 029 922.00 6.63
GBP
GBP BARCLAYS BANK PLC-SUB 14.000%/3M LIBOR+1340BP 08-PRP 750 000.00 1 196 410.60 1.58
Total GBP 1 196 410.60 1.58
USD
USD AQUARIUS+INV FOR SWISS REIN-REG-S-SUB 6.375%/VAR 13-01.09.24 500 000.00 375 786.50 0.49USD BANCO BILBALO VIZCAYA ARGENT-SUB 9.000%/VAR 13-PRP 600 000.00 469 536.63 0.62
Total USD 845 323.13 1.11
Total Bonds, floating rate 7 071 655.73 9.32
Convertible bonds, fixed rate
EUR
EUR BENI STABILI SPA SIIQ 3.37500% 13-17.01.18 300 000.00 314 100.00 0.41EUR BENI STABILI SPA SIIQ 3.87500% 10-23.04.15 500 000.00 510 500.00 0.67
Total EUR 824 600.00 1.08
Total Convertible bonds, fixed rate 824 600.00 1.08
Total Transferable securities and money market instruments listed on an official stock exchange 48 253 292.39 63.58
Description Quantity/ Valuation in EUR as a % Nominal Unrealized gain of net (loss) on Futures/ assets Options/Forward Exchange Contracts/ Swaps (Note 1)
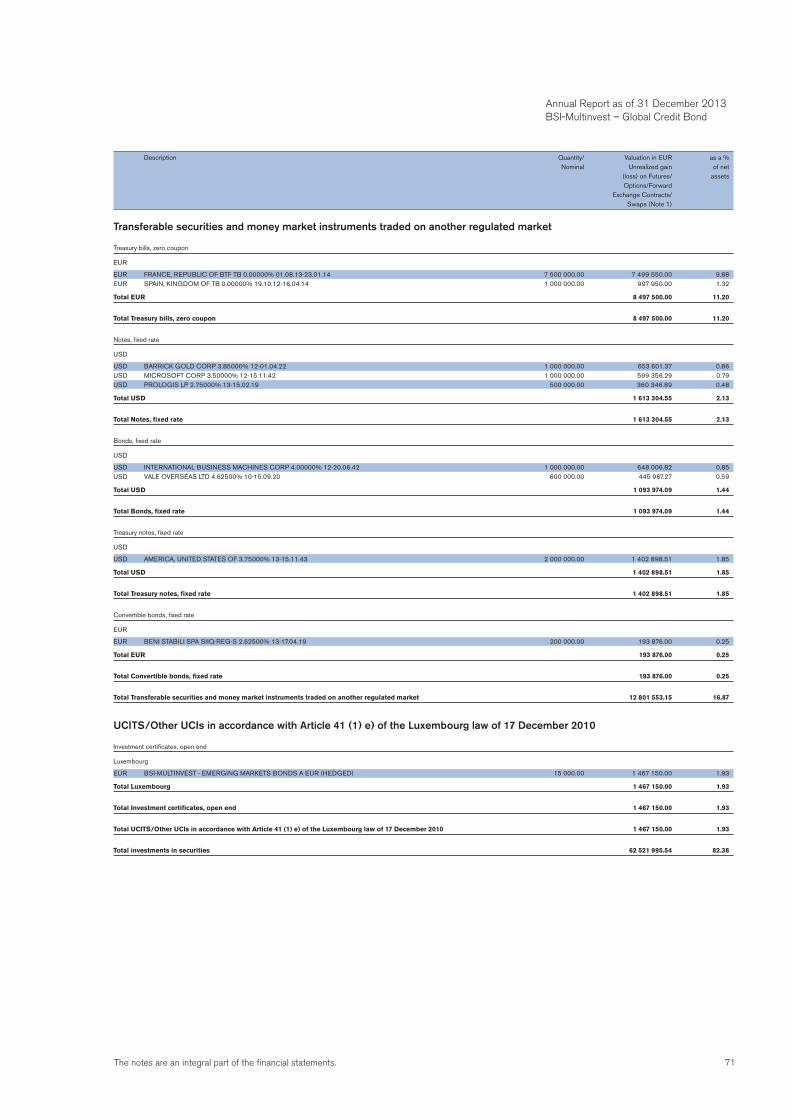
71The notes are an integral part of the financial statements.
Annual Report as of 31 December 2013 BSI-Multinvest – Global Credit Bond
Transferable securities and money market instruments traded on another regulated market
Treasury bills, zero coupon
EUR
EUR FRANCE, REPUBLIC OF BTF TB 0.00000% 01.08.13-23.01.14 7 500 000.00 7 499 550.00 9.88EUR SPAIN, KINGDOM OF TB 0.00000% 19.10.12-16.04.14 1 000 000.00 997 950.00 1.32
Total EUR 8 497 500.00 11.20
Total Treasury bills, zero coupon 8 497 500.00 11.20
Notes, fixed rate
USD
USD BARRICK GOLD CORP 3.85000% 12-01.04.22 1 000 000.00 653 601.37 0.86USD MICROSOFT CORP 3.50000% 12-15.11.42 1 000 000.00 599 356.29 0.79USD PROLOGIS LP 2.75000% 13-15.02.19 500 000.00 360 346.89 0.48
Total USD 1 613 304.55 2.13
Total Notes, fixed rate 1 613 304.55 2.13
Bonds, fixed rate
USD
USD INTERNATIONAL BUSINESS MACHINES CORP 4.00000% 12-20.06.42 1 000 000.00 648 006.82 0.85USD VALE OVERSEAS LTD 4.62500% 10-15.09.20 600 000.00 445 967.27 0.59
Total USD 1 093 974.09 1.44
Total Bonds, fixed rate 1 093 974.09 1.44
Treasury notes, fixed rate
USD
USD AMERICA, UNITED STATES OF 3.75000% 13-15.11.43 2 000 000.00 1 402 898.51 1.85
Total USD 1 402 898.51 1.85
Total Treasury notes, fixed rate 1 402 898.51 1.85
Convertible bonds, fixed rate
EUR
EUR BENI STABILI SPA SIIQ-REG-S 2.62500% 13-17.04.19 200 000.00 193 876.00 0.25
Total EUR 193 876.00 0.25
Total Convertible bonds, fixed rate 193 876.00 0.25
Total Transferable securities and money market instruments traded on another regulated market 12 801 553.15 16.87
UCITS/Other UCIs in accordance with Article 41 (1) e) of the Luxembourg law of 17 December 2010
Investment certificates, open end
Luxembourg
EUR BSI-MULTINVEST - EMERGING MARKETS BONDS A EUR (HEDGED) 15 000.00 1 467 150.00 1.93
Total Luxembourg 1 467 150.00 1.93
Total Investment certificates, open end 1 467 150.00 1.93
Total UCITS/Other UCIs in accordance with Article 41 (1) e) of the Luxembourg law of 17 December 2010 1 467 150.00 1.93
Total investments in securities 62 521 995.54 82.38
Description Quantity/ Valuation in EUR as a % Nominal Unrealized gain of net (loss) on Futures/ assets Options/Forward Exchange Contracts/ Swaps (Note 1)
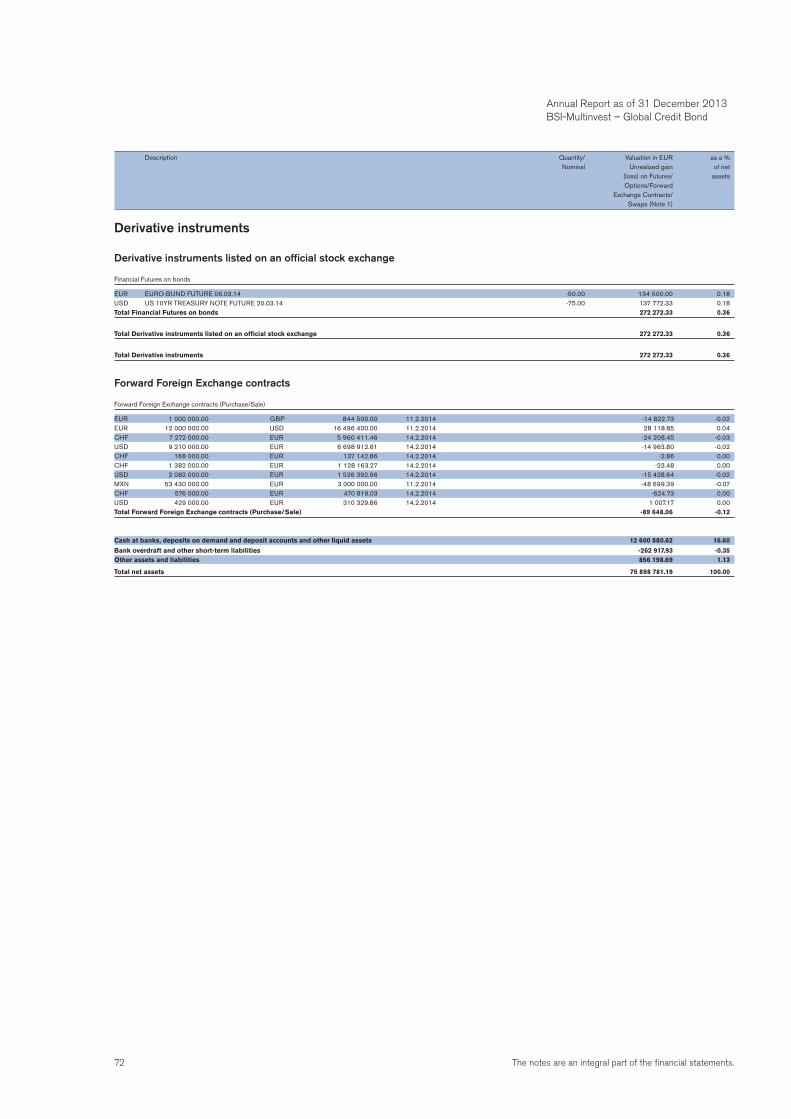
72 The notes are an integral part of the financial statements.
Annual Report as of 31 December 2013 BSI-Multinvest – Global Credit Bond
Derivative instruments
Derivative instruments listed on an official stock exchange
Financial Futures on bonds
EUR EURO-BUND FUTURE 06.03.14 -50.00 134 500.00 0.18USD US 10YR TREASURY NOTE FUTURE 20.03.14 -75.00 137 772.33 0.18Total Financial Futures on bonds 272 272.33 0.36
Total Derivative instruments listed on an official stock exchange 272 272.33 0.36
Total Derivative instruments 272 272.33 0.36
Forward Foreign Exchange contracts
Forward Foreign Exchange contracts (Purchase/Sale)
EUR 1 000 000.00 GBP 844 500.00 11.2.2014 -14 822.73 -0.02EUR 12 000 000.00 USD 16 496 400.00 11.2.2014 28 118.85 0.04CHF 7 272 000.00 EUR 5 960 411.46 14.2.2014 -24 208.45 -0.03USD 9 210 000.00 EUR 6 698 912.61 14.2.2014 -14 963.80 -0.02CHF 168 000.00 EUR 137 142.86 14.2.2014 -2.86 0.00CHF 1 382 000.00 EUR 1 128 163.27 14.2.2014 -23.48 0.00USD 2 082 000.00 EUR 1 526 392.96 14.2.2014 -15 428.64 -0.02MXN 53 430 000.00 EUR 3 000 000.00 11.2.2014 -48 699.39 -0.07CHF 576 000.00 EUR 470 819.03 14.2.2014 -624.73 0.00USD 429 000.00 EUR 310 329.86 14.2.2014 1 007.17 0.00Total Forward Foreign Exchange contracts (Purchase/Sale) -89 648.06 -0.12
Cash at banks, deposits on demand and deposit accounts and other liquid assets 12 600 880.62 16.60
Bank overdraft and other short-term liabilities -262 917.93 -0.35Other assets and liabilities 856 198.69 1.13
Total net assets 75 898 781.19 100.00
Description Quantity/ Valuation in EUR as a % Nominal Unrealized gain of net (loss) on Futures/ assets Options/Forward Exchange Contracts/ Swaps (Note 1)
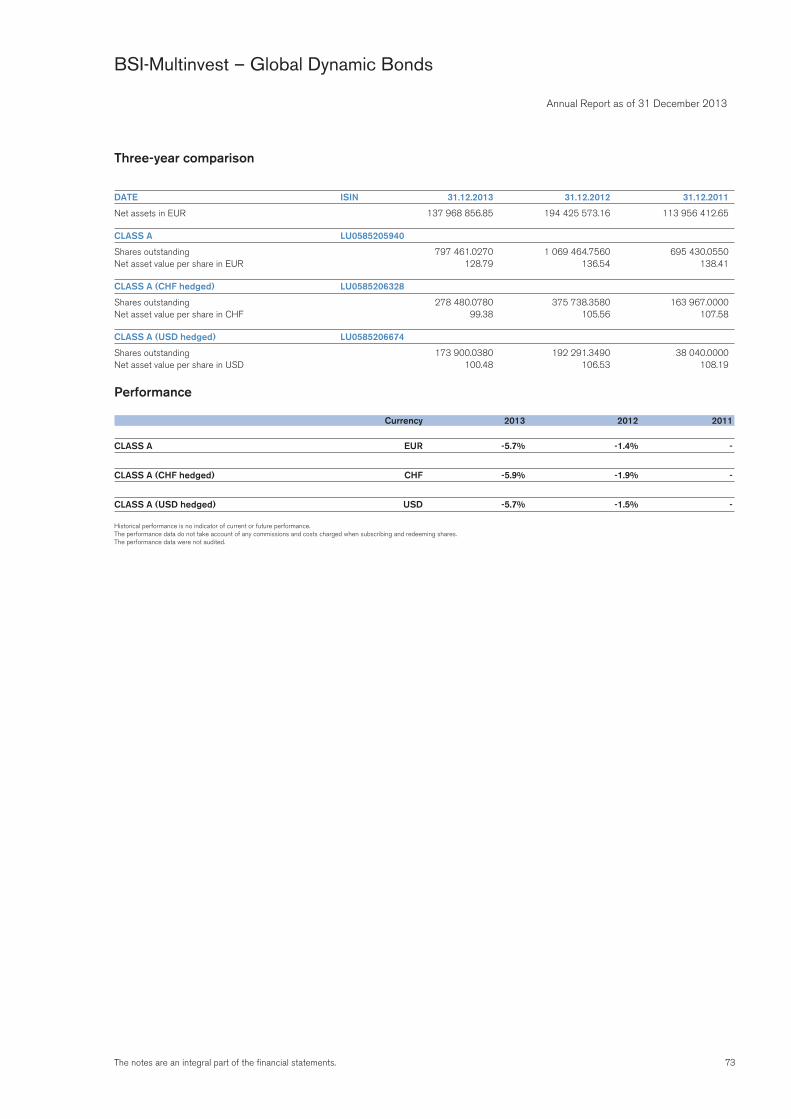
73The notes are an integral part of the financial statements.
Annual Report as of 31 December 2013
BSI-Multinvest – Global Dynamic Bonds
Three-year comparison
DATE ISIN 31.12.2013 31.12.2012 31.12.2011
Net assets in EUR 137 968 856.85 194 425 573.16 113 956 412.65
CLASS A LU0585205940
Shares outstanding 797 461.0270 1 069 464.7560 695 430.0550Net asset value per share in EUR 128.79 136.54 138.41
CLASS A (CHF hedged) LU0585206328
Shares outstanding 278 480.0780 375 738.3580 163 967.0000Net asset value per share in CHF 99.38 105.56 107.58
CLASS A (USD hedged) LU0585206674
Shares outstanding 173 900.0380 192 291.3490 38 040.0000Net asset value per share in USD 100.48 106.53 108.19
Performance
Currency 2013 2012 2011
CLASS A EUR -5.7% -1.4% -
CLASS A (CHF hedged) CHF -5.9% -1.9% -
CLASS A (USD hedged) USD -5.7% -1.5% -
Historical performance is no indicator of current or future performance.The performance data do not take account of any commissions and costs charged when subscribing and redeeming shares.The performance data were not audited.
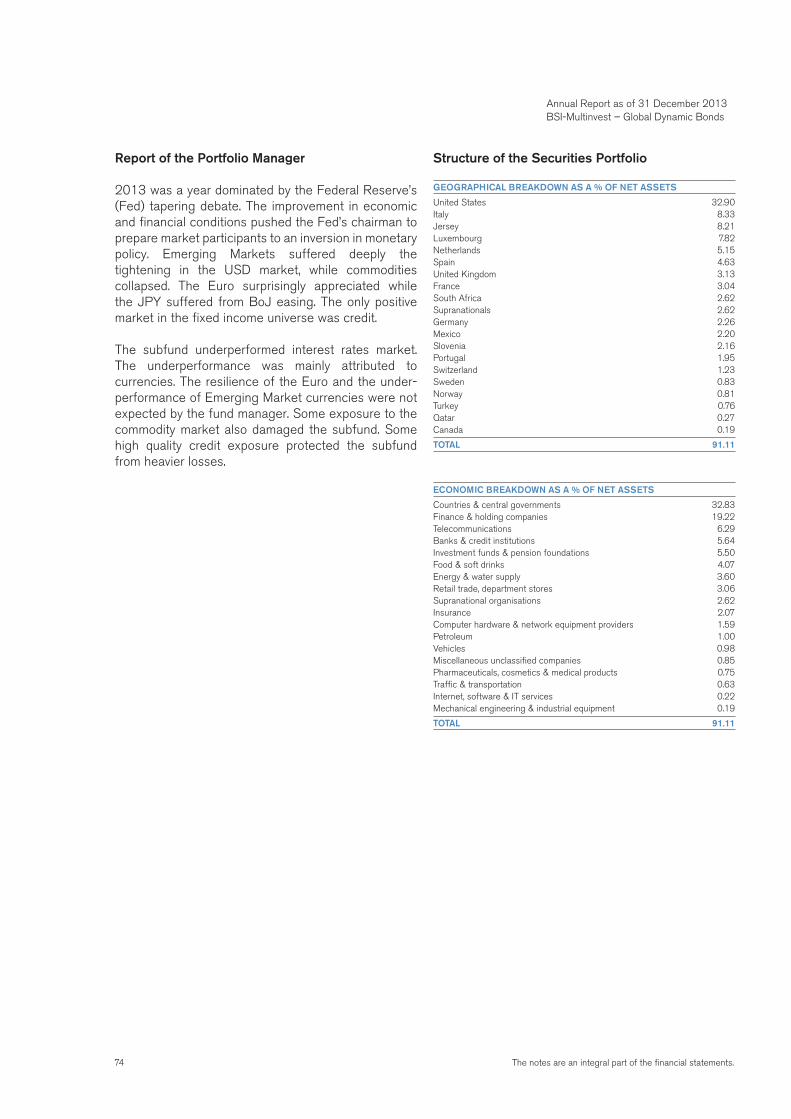
74 The notes are an integral part of the financial statements.
Report of the Portfolio Manager
2013 was a year dominated by the Federal Reserve’s (Fed) tapering debate. The improvement in economic and financial conditions pushed the Fed’s chairman to prepare market participants to an inversion in monetary policy. Emerging Markets suffered deeply the tightening in the USD market, while commodities collapsed. The Euro surprisingly appreciated while the JPY suffered from BoJ easing. The only positive market in the fixed income universe was credit.
The subfund underperformed interest rates market. The underperformance was mainly attributed to currencies. The resilience of the Euro and the under-performance of Emerging Market currencies were not expected by the fund manager. Some exposure to the commodity market also damaged the subfund. Some high quality credit exposure protected the subfund from heavier losses.
Structure of the Securities Portfolio
GEOGRAPHICAL BREAKDOWN AS A % OF NET ASSETS
United States 32.90Italy 8.33Jersey 8.21Luxembourg 7.82Netherlands 5.15Spain 4.63United Kingdom 3.13France 3.04South Africa 2.62Supranationals 2.62Germany 2.26Mexico 2.20Slovenia 2.16Portugal 1.95Switzerland 1.23Sweden 0.83Norway 0.81Turkey 0.76Qatar 0.27Canada 0.19
TOTAL 91.11
ECONOMIC BREAKDOWN AS A % OF NET ASSETS
Countries & central governments 32.83Finance & holding companies 19.22Telecommunications 6.29Banks & credit institutions 5.64Investment funds & pension foundations 5.50Food & soft drinks 4.07Energy & water supply 3.60Retail trade, department stores 3.06Supranational organisations 2.62Insurance 2.07Computer hardware & network equipment providers 1.59Petroleum 1.00Vehicles 0.98Miscellaneous unclassified companies 0.85Pharmaceuticals, cosmetics & medical products 0.75Traffic & transportation 0.63Internet, software & IT services 0.22Mechanical engineering & industrial equipment 0.19
TOTAL 91.11
Annual Report as of 31 December 2013 BSI-Multinvest – Global Dynamic Bonds
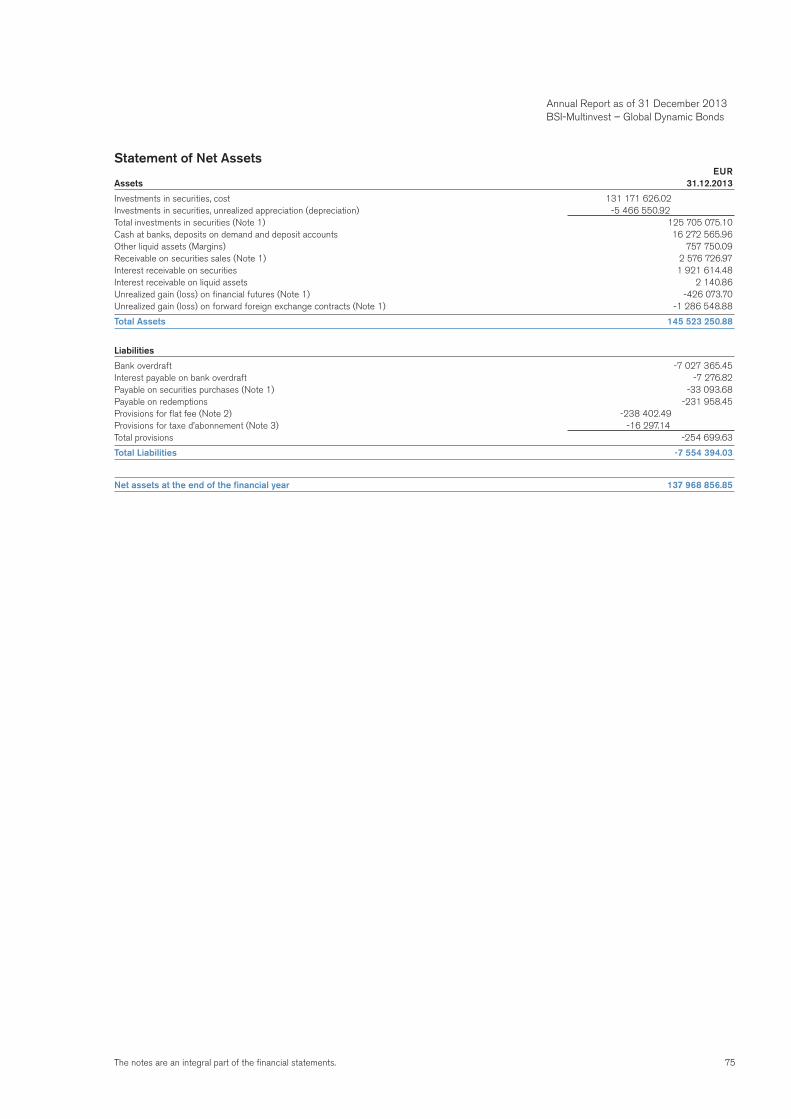
75The notes are an integral part of the financial statements.
Statement of Net Assets EURAssets 31.12.2013
Investments in securities, cost 131 171 626.02Investments in securities, unrealized appreciation (depreciation) -5 466 550.92Total investments in securities (Note 1) 125 705 075.10Cash at banks, deposits on demand and deposit accounts 16 272 565.96Other liquid assets (Margins) 757 750.09Receivable on securities sales (Note 1) 2 576 726.97Interest receivable on securities 1 921 614.48Interest receivable on liquid assets 2 140.86Unrealized gain (loss) on financial futures (Note 1) -426 073.70Unrealized gain (loss) on forward foreign exchange contracts (Note 1) -1 286 548.88
Total Assets 145 523 250.88
Liabilities
Bank overdraft -7 027 365.45Interest payable on bank overdraft -7 276.82Payable on securities purchases (Note 1) -33 093.68Payable on redemptions -231 958.45Provisions for flat fee (Note 2) -238 402.49Provisions for taxe d’abonnement (Note 3) -16 297.14Total provisions -254 699.63
Total Liabilities -7 554 394.03
Net assets at the end of the financial year 137 968 856.85
Annual Report as of 31 December 2013 BSI-Multinvest – Global Dynamic Bonds
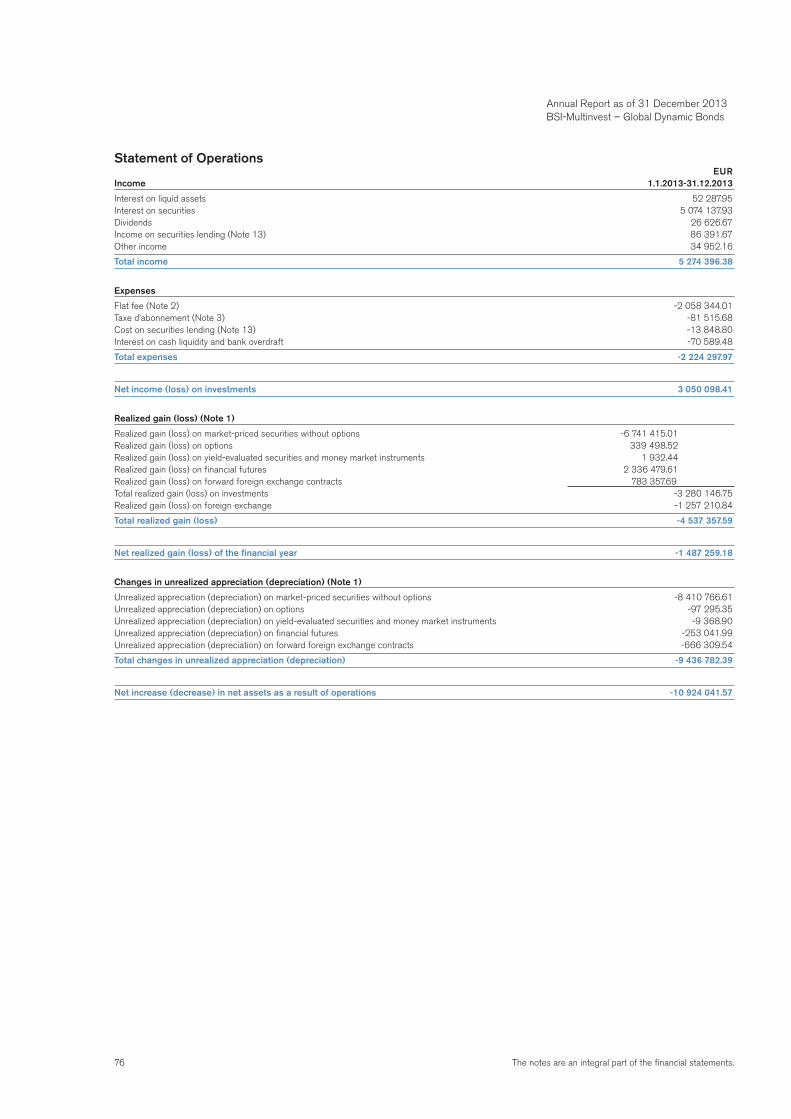
76 The notes are an integral part of the financial statements.
Statement of Operations EURIncome 1.1.2013-31.12.2013
Interest on liquid assets 52 287.95Interest on securities 5 074 137.93Dividends 26 626.67Income on securities lending (Note 13) 86 391.67Other income 34 952.16
Total income 5 274 396.38
Expenses
Flat fee (Note 2) -2 058 344.01Taxe d’abonnement (Note 3) -81 515.68Cost on securities lending (Note 13) -13 848.80Interest on cash liquidity and bank overdraft -70 589.48
Total expenses -2 224 297.97
Net income (loss) on investments 3 050 098.41
Realized gain (loss) (Note 1)
Realized gain (loss) on market-priced securities without options -6 741 415.01Realized gain (loss) on options 339 498.52Realized gain (loss) on yield-evaluated securities and money market instruments 1 932.44Realized gain (loss) on financial futures 2 336 479.61Realized gain (loss) on forward foreign exchange contracts 783 357.69Total realized gain (loss) on investments -3 280 146.75Realized gain (loss) on foreign exchange -1 257 210.84
Total realized gain (loss) -4 537 357.59
Net realized gain (loss) of the financial year -1 487 259.18
Changes in unrealized appreciation (depreciation) (Note 1)
Unrealized appreciation (depreciation) on market-priced securities without options -8 410 766.61Unrealized appreciation (depreciation) on options -97 295.35Unrealized appreciation (depreciation) on yield-evaluated securities and money market instruments -9 368.90Unrealized appreciation (depreciation) on financial futures -253 041.99Unrealized appreciation (depreciation) on forward foreign exchange contracts -666 309.54
Total changes in unrealized appreciation (depreciation) -9 436 782.39
Net increase (decrease) in net assets as a result of operations -10 924 041.57
Annual Report as of 31 December 2013 BSI-Multinvest – Global Dynamic Bonds
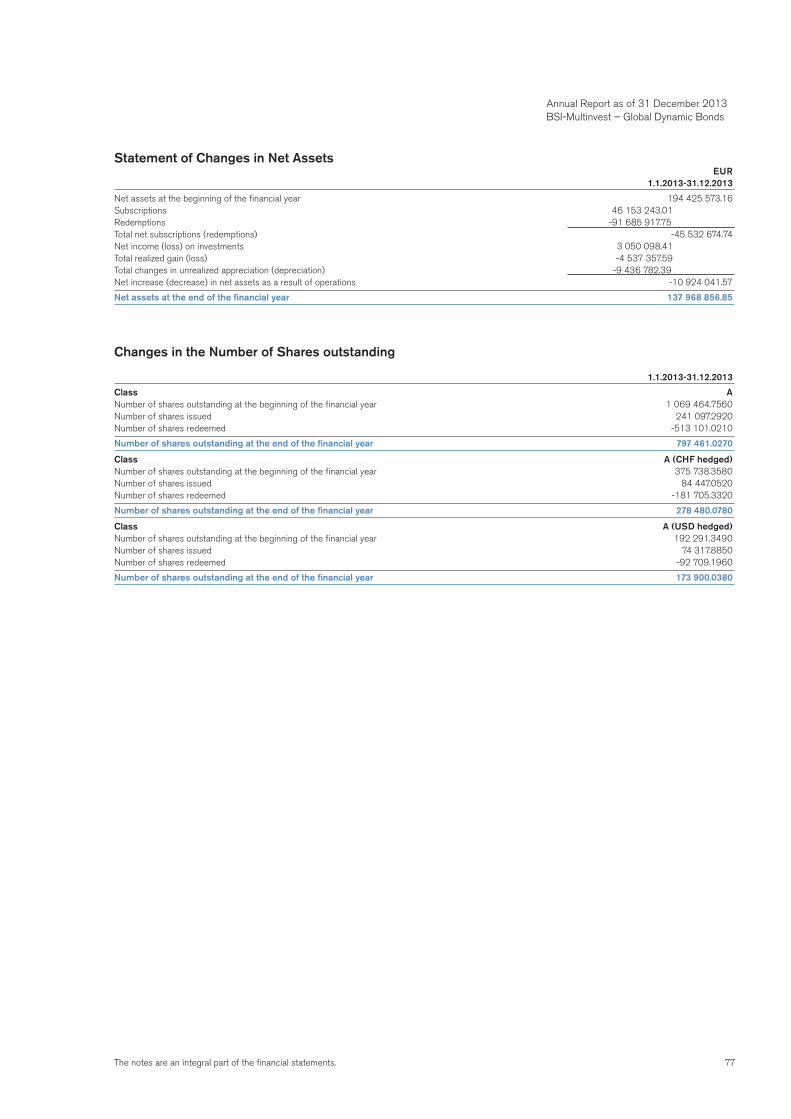
77The notes are an integral part of the financial statements.
Statement of Changes in Net Assets EUR 1.1.2013-31.12.2013
Net assets at the beginning of the financial year 194 425 573.16Subscriptions 46 153 243.01Redemptions -91 685 917.75Total net subscriptions (redemptions) -45 532 674.74Net income (loss) on investments 3 050 098.41Total realized gain (loss) -4 537 357.59Total changes in unrealized appreciation (depreciation) -9 436 782.39Net increase (decrease) in net assets as a result of operations -10 924 041.57
Net assets at the end of the financial year 137 968 856.85
Changes in the Number of Shares outstanding
1.1.2013-31.12.2013
Class ANumber of shares outstanding at the beginning of the financial year 1 069 464.7560Number of shares issued 241 097.2920Number of shares redeemed -513 101.0210
Number of shares outstanding at the end of the financial year 797 461.0270
Class A (CHF hedged)Number of shares outstanding at the beginning of the financial year 375 738.3580Number of shares issued 84 447.0520Number of shares redeemed -181 705.3320
Number of shares outstanding at the end of the financial year 278 480.0780
Class A (USD hedged)Number of shares outstanding at the beginning of the financial year 192 291.3490Number of shares issued 74 317.8850Number of shares redeemed -92 709.1960
Number of shares outstanding at the end of the financial year 173 900.0380
Annual Report as of 31 December 2013 BSI-Multinvest – Global Dynamic Bonds
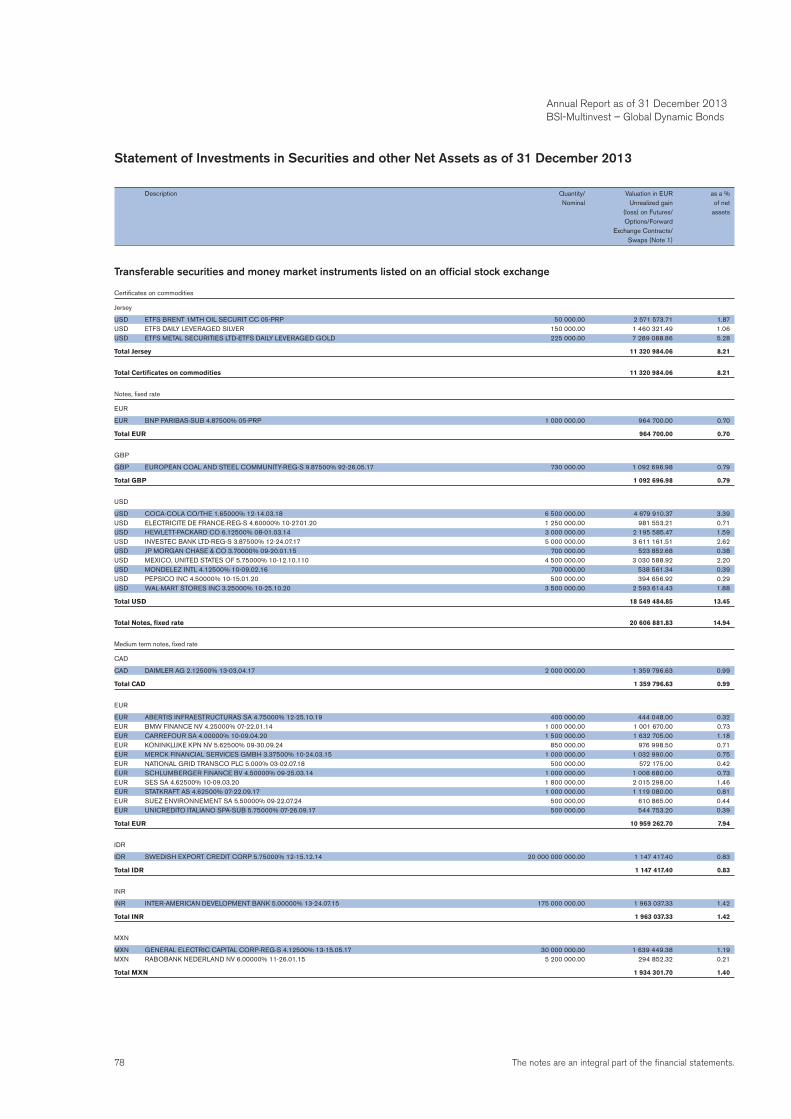
78 The notes are an integral part of the financial statements.
Statement of Investments in Securities and other Net Assets as of 31 December 2013
Description Quantity/ Valuation in EUR as a % Nominal Unrealized gain of net (loss) on Futures/ assets Options/Forward Exchange Contracts/ Swaps (Note 1)
Transferable securities and money market instruments listed on an official stock exchange
Certificates on commodities
Jersey
USD ETFS BRENT 1MTH OIL SECURIT CC 05-PRP 50 000.00 2 571 573.71 1.87USD ETFS DAILY LEVERAGED SILVER 150 000.00 1 460 321.49 1.06USD ETFS METAL SECURITIES LTD-ETFS DAILY LEVERAGED GOLD 225 000.00 7 289 088.86 5.28
Total Jersey 11 320 984.06 8.21
Total Certificates on commodities 11 320 984.06 8.21
Notes, fixed rate
EUR
EUR BNP PARIBAS-SUB 4.87500% 05-PRP 1 000 000.00 964 700.00 0.70
Total EUR 964 700.00 0.70
GBP
GBP EUROPEAN COAL AND STEEL COMMUNITY-REG-S 9.87500% 92-26.05.17 730 000.00 1 092 696.98 0.79
Total GBP 1 092 696.98 0.79
USD
USD COCA-COLA CO/THE 1.65000% 12-14.03.18 6 500 000.00 4 679 910.37 3.39USD ELECTRICITE DE FRANCE-REG-S 4.60000% 10-27.01.20 1 250 000.00 981 553.21 0.71USD HEWLETT-PACKARD CO 6.12500% 08-01.03.14 3 000 000.00 2 195 585.47 1.59USD INVESTEC BANK LTD-REG-S 3.87500% 12-24.07.17 5 000 000.00 3 611 161.51 2.62USD JP MORGAN CHASE & CO 3.70000% 09-20.01.15 700 000.00 523 852.68 0.38USD MEXICO, UNITED STATES OF 5.75000% 10-12.10.110 4 500 000.00 3 030 588.92 2.20USD MONDELEZ INTL 4.12500% 10-09.02.16 700 000.00 538 561.34 0.39USD PEPSICO INC 4.50000% 10-15.01.20 500 000.00 394 656.92 0.29USD WAL-MART STORES INC 3.25000% 10-25.10.20 3 500 000.00 2 593 614.43 1.88
Total USD 18 549 484.85 13.45
Total Notes, fixed rate 20 606 881.83 14.94
Medium term notes, fixed rate
CAD
CAD DAIMLER AG 2.12500% 13-03.04.17 2 000 000.00 1 359 796.63 0.99
Total CAD 1 359 796.63 0.99
EUR
EUR ABERTIS INFRAESTRUCTURAS SA 4.75000% 12-25.10.19 400 000.00 444 048.00 0.32EUR BMW FINANCE NV 4.25000% 07-22.01.14 1 000 000.00 1 001 670.00 0.73EUR CARREFOUR SA 4.00000% 10-09.04.20 1 500 000.00 1 632 705.00 1.18EUR KONINKLIJKE KPN NV 5.62500% 09-30.09.24 850 000.00 976 998.50 0.71EUR MERCK FINANCIAL SERVICES GMBH 3.37500% 10-24.03.15 1 000 000.00 1 032 990.00 0.75EUR NATIONAL GRID TRANSCO PLC 5.000% 03-02.07.18 500 000.00 572 175.00 0.42EUR SCHLUMBERGER FINANCE BV 4.50000% 09-25.03.14 1 000 000.00 1 008 680.00 0.73EUR SES SA 4.62500% 10-09.03.20 1 800 000.00 2 015 298.00 1.46EUR STATKRAFT AS 4.62500% 07-22.09.17 1 000 000.00 1 119 080.00 0.81EUR SUEZ ENVIRONNEMENT SA 5.50000% 09-22.07.24 500 000.00 610 865.00 0.44EUR UNICREDITO ITALIANO SPA-SUB 5.75000% 07-26.09.17 500 000.00 544 753.20 0.39
Total EUR 10 959 262.70 7.94
IDR
IDR SWEDISH EXPORT CREDIT CORP 5.75000% 12-15.12.14 20 000 000 000.00 1 147 417.40 0.83
Total IDR 1 147 417.40 0.83
INR
INR INTER-AMERICAN DEVELOPMENT BANK 5.00000% 13-24.07.15 175 000 000.00 1 963 037.33 1.42
Total INR 1 963 037.33 1.42
MXN
MXN GENERAL ELECTRIC CAPITAL CORP-REG-S 4.12500% 13-15.05.17 30 000 000.00 1 639 449.38 1.19MXN RABOBANK NEDERLAND NV 6.00000% 11-26.01.15 5 200 000.00 294 852.32 0.21
Total MXN 1 934 301.70 1.40
Annual Report as of 31 December 2013 BSI-Multinvest – Global Dynamic Bonds
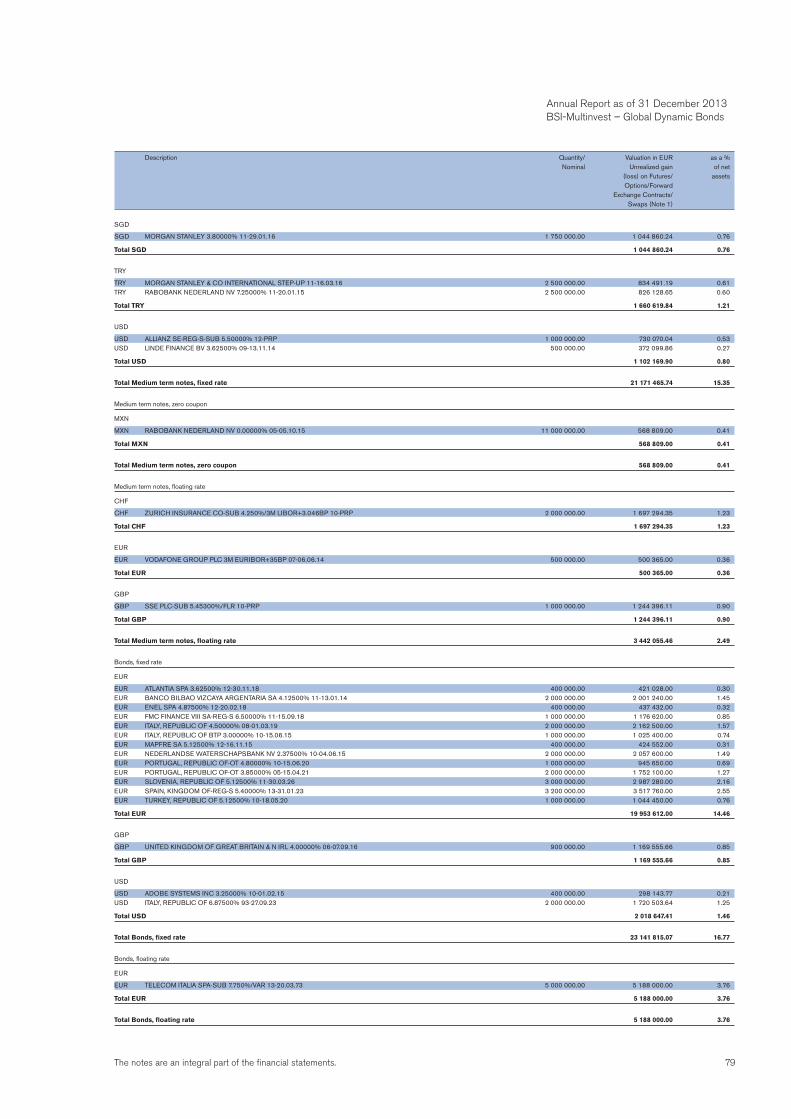
79The notes are an integral part of the financial statements.
SGD
SGD MORGAN STANLEY 3.80000% 11-29.01.16 1 750 000.00 1 044 860.24 0.76
Total SGD 1 044 860.24 0.76
TRY
TRY MORGAN STANLEY & CO INTERNATIONAL STEP-UP 11-16.03.16 2 500 000.00 834 491.19 0.61TRY RABOBANK NEDERLAND NV 7.25000% 11-20.01.15 2 500 000.00 826 128.65 0.60
Total TRY 1 660 619.84 1.21
USD
USD ALLIANZ SE-REG-S-SUB 5.50000% 12-PRP 1 000 000.00 730 070.04 0.53USD LINDE FINANCE BV 3.62500% 09-13.11.14 500 000.00 372 099.86 0.27
Total USD 1 102 169.90 0.80
Total Medium term notes, fixed rate 21 171 465.74 15.35
Medium term notes, zero coupon
MXN
MXN RABOBANK NEDERLAND NV 0.00000% 05-05.10.15 11 000 000.00 568 809.00 0.41
Total MXN 568 809.00 0.41
Total Medium term notes, zero coupon 568 809.00 0.41
Medium term notes, floating rate
CHF
CHF ZURICH INSURANCE CO-SUB 4.250%/3M LIBOR+3.046BP 10-PRP 2 000 000.00 1 697 294.35 1.23
Total CHF 1 697 294.35 1.23
EUR
EUR VODAFONE GROUP PLC 3M EURIBOR+35BP 07-06.06.14 500 000.00 500 365.00 0.36
Total EUR 500 365.00 0.36
GBP
GBP SSE PLC-SUB 5.45300%/FLR 10-PRP 1 000 000.00 1 244 396.11 0.90
Total GBP 1 244 396.11 0.90
Total Medium term notes, floating rate 3 442 055.46 2.49
Bonds, fixed rate
EUR
EUR ATLANTIA SPA 3.62500% 12-30.11.18 400 000.00 421 028.00 0.30EUR BANCO BILBAO VIZCAYA ARGENTARIA SA 4.12500% 11-13.01.14 2 000 000.00 2 001 240.00 1.45EUR ENEL SPA 4.87500% 12-20.02.18 400 000.00 437 432.00 0.32EUR FMC FINANCE VIII SA-REG-S 6.50000% 11-15.09.18 1 000 000.00 1 176 620.00 0.85EUR ITALY, REPUBLIC OF 4.50000% 08-01.03.19 2 000 000.00 2 162 500.00 1.57EUR ITALY, REPUBLIC OF BTP 3.00000% 10-15.06.15 1 000 000.00 1 025 400.00 0.74EUR MAPFRE SA 5.12500% 12-16.11.15 400 000.00 424 552.00 0.31EUR NEDERLANDSE WATERSCHAPSBANK NV 2.37500% 10-04.06.15 2 000 000.00 2 057 600.00 1.49EUR PORTUGAL, REPUBLIC OF-OT 4.80000% 10-15.06.20 1 000 000.00 945 650.00 0.69EUR PORTUGAL, REPUBLIC OF-OT 3.85000% 05-15.04.21 2 000 000.00 1 752 100.00 1.27EUR SLOVENIA, REPUBLIC OF 5.12500% 11-30.03.26 3 000 000.00 2 987 280.00 2.16EUR SPAIN, KINGDOM OF-REG-S 5.40000% 13-31.01.23 3 200 000.00 3 517 760.00 2.55EUR TURKEY, REPUBLIC OF 5.12500% 10-18.05.20 1 000 000.00 1 044 450.00 0.76
Total EUR 19 953 612.00 14.46
GBP
GBP UNITED KINGDOM OF GREAT BRITAIN & N IRL 4.00000% 06-07.09.16 900 000.00 1 169 555.66 0.85
Total GBP 1 169 555.66 0.85
USD
USD ADOBE SYSTEMS INC 3.25000% 10-01.02.15 400 000.00 298 143.77 0.21USD ITALY, REPUBLIC OF 6.87500% 93-27.09.23 2 000 000.00 1 720 503.64 1.25
Total USD 2 018 647.41 1.46
Total Bonds, fixed rate 23 141 815.07 16.77
Bonds, floating rate
EUR
EUR TELECOM ITALIA SPA-SUB 7.750%/VAR 13-20.03.73 5 000 000.00 5 188 000.00 3.76
Total EUR 5 188 000.00 3.76
Total Bonds, floating rate 5 188 000.00 3.76
Description Quantity/ Valuation in EUR as a % Nominal Unrealized gain of net (loss) on Futures/ assets Options/Forward Exchange Contracts/ Swaps (Note 1)
Annual Report as of 31 December 2013 BSI-Multinvest – Global Dynamic Bonds
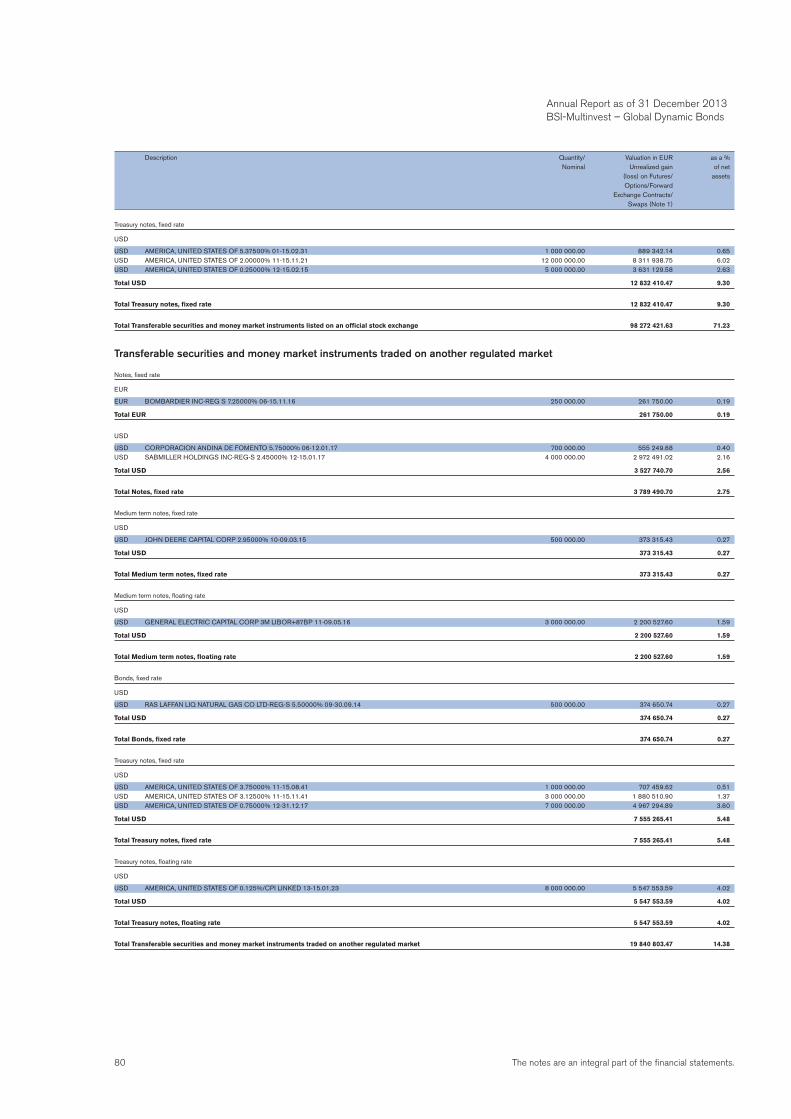
80 The notes are an integral part of the financial statements.
Treasury notes, fixed rate
USD
USD AMERICA, UNITED STATES OF 5.37500% 01-15.02.31 1 000 000.00 889 342.14 0.65USD AMERICA, UNITED STATES OF 2.00000% 11-15.11.21 12 000 000.00 8 311 938.75 6.02USD AMERICA, UNITED STATES OF 0.25000% 12-15.02.15 5 000 000.00 3 631 129.58 2.63
Total USD 12 832 410.47 9.30
Total Treasury notes, fixed rate 12 832 410.47 9.30
Total Transferable securities and money market instruments listed on an official stock exchange 98 272 421.63 71.23
Transferable securities and money market instruments traded on another regulated market
Notes, fixed rate
EUR
EUR BOMBARDIER INC-REG S 7.25000% 06-15.11.16 250 000.00 261 750.00 0.19
Total EUR 261 750.00 0.19
USD
USD CORPORACION ANDINA DE FOMENTO 5.75000% 06-12.01.17 700 000.00 555 249.68 0.40USD SABMILLER HOLDINGS INC-REG-S 2.45000% 12-15.01.17 4 000 000.00 2 972 491.02 2.16
Total USD 3 527 740.70 2.56
Total Notes, fixed rate 3 789 490.70 2.75
Medium term notes, fixed rate
USD
USD JOHN DEERE CAPITAL CORP 2.95000% 10-09.03.15 500 000.00 373 315.43 0.27
Total USD 373 315.43 0.27
Total Medium term notes, fixed rate 373 315.43 0.27
Medium term notes, floating rate
USD
USD GENERAL ELECTRIC CAPITAL CORP 3M LIBOR+87BP 11-09.05.16 3 000 000.00 2 200 527.60 1.59
Total USD 2 200 527.60 1.59
Total Medium term notes, floating rate 2 200 527.60 1.59
Bonds, fixed rate
USD
USD RAS LAFFAN LIQ NATURAL GAS CO LTD-REG-S 5.50000% 09-30.09.14 500 000.00 374 650.74 0.27
Total USD 374 650.74 0.27
Total Bonds, fixed rate 374 650.74 0.27
Treasury notes, fixed rate
USD
USD AMERICA, UNITED STATES OF 3.75000% 11-15.08.41 1 000 000.00 707 459.62 0.51USD AMERICA, UNITED STATES OF 3.12500% 11-15.11.41 3 000 000.00 1 880 510.90 1.37USD AMERICA, UNITED STATES OF 0.75000% 12-31.12.17 7 000 000.00 4 967 294.89 3.60
Total USD 7 555 265.41 5.48
Total Treasury notes, fixed rate 7 555 265.41 5.48
Treasury notes, floating rate
USD
USD AMERICA, UNITED STATES OF 0.125%/CPI LINKED 13-15.01.23 8 000 000.00 5 547 553.59 4.02
Total USD 5 547 553.59 4.02
Total Treasury notes, floating rate 5 547 553.59 4.02
Total Transferable securities and money market instruments traded on another regulated market 19 840 803.47 14.38
Description Quantity/ Valuation in EUR as a % Nominal Unrealized gain of net (loss) on Futures/ assets Options/Forward Exchange Contracts/ Swaps (Note 1)
Annual Report as of 31 December 2013 BSI-Multinvest – Global Dynamic Bonds
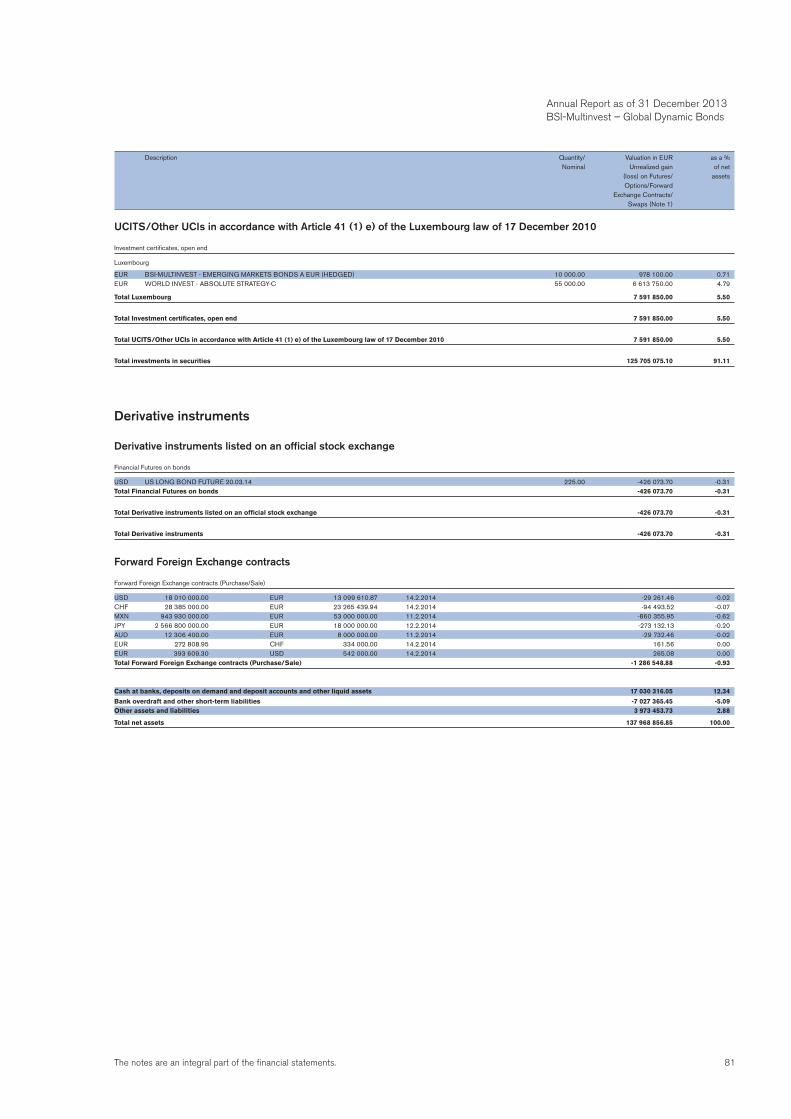
81The notes are an integral part of the financial statements.
UCITS/Other UCIs in accordance with Article 41 (1) e) of the Luxembourg law of 17 December 2010
Investment certificates, open end
Luxembourg
EUR BSI-MULTINVEST - EMERGING MARKETS BONDS A EUR (HEDGED) 10 000.00 978 100.00 0.71EUR WORLD INVEST - ABSOLUTE STRATEGY-C 55 000.00 6 613 750.00 4.79
Total Luxembourg 7 591 850.00 5.50
Total Investment certificates, open end 7 591 850.00 5.50
Total UCITS/Other UCIs in accordance with Article 41 (1) e) of the Luxembourg law of 17 December 2010 7 591 850.00 5.50
Total investments in securities 125 705 075.10 91.11
Derivative instruments
Derivative instruments listed on an official stock exchange
Financial Futures on bonds
USD US LONG BOND FUTURE 20.03.14 225.00 -426 073.70 -0.31Total Financial Futures on bonds -426 073.70 -0.31
Total Derivative instruments listed on an official stock exchange -426 073.70 -0.31
Total Derivative instruments -426 073.70 -0.31
Forward Foreign Exchange contracts
Forward Foreign Exchange contracts (Purchase/Sale)
USD 18 010 000.00 EUR 13 099 610.87 14.2.2014 -29 261.46 -0.02CHF 28 385 000.00 EUR 23 265 439.94 14.2.2014 -94 493.52 -0.07MXN 943 930 000.00 EUR 53 000 000.00 11.2.2014 -860 355.95 -0.62JPY 2 566 800 000.00 EUR 18 000 000.00 12.2.2014 -273 132.13 -0.20AUD 12 306 400.00 EUR 8 000 000.00 11.2.2014 -29 732.46 -0.02EUR 272 808.95 CHF 334 000.00 14.2.2014 161.56 0.00EUR 393 609.30 USD 542 000.00 14.2.2014 265.08 0.00Total Forward Foreign Exchange contracts (Purchase/Sale) -1 286 548.88 -0.93
Cash at banks, deposits on demand and deposit accounts and other liquid assets 17 030 316.05 12.34
Bank overdraft and other short-term liabilities -7 027 365.45 -5.09Other assets and liabilities 3 973 453.73 2.88
Total net assets 137 968 856.85 100.00
Description Quantity/ Valuation in EUR as a % Nominal Unrealized gain of net (loss) on Futures/ assets Options/Forward Exchange Contracts/ Swaps (Note 1)
Annual Report as of 31 December 2013 BSI-Multinvest – Global Dynamic Bonds
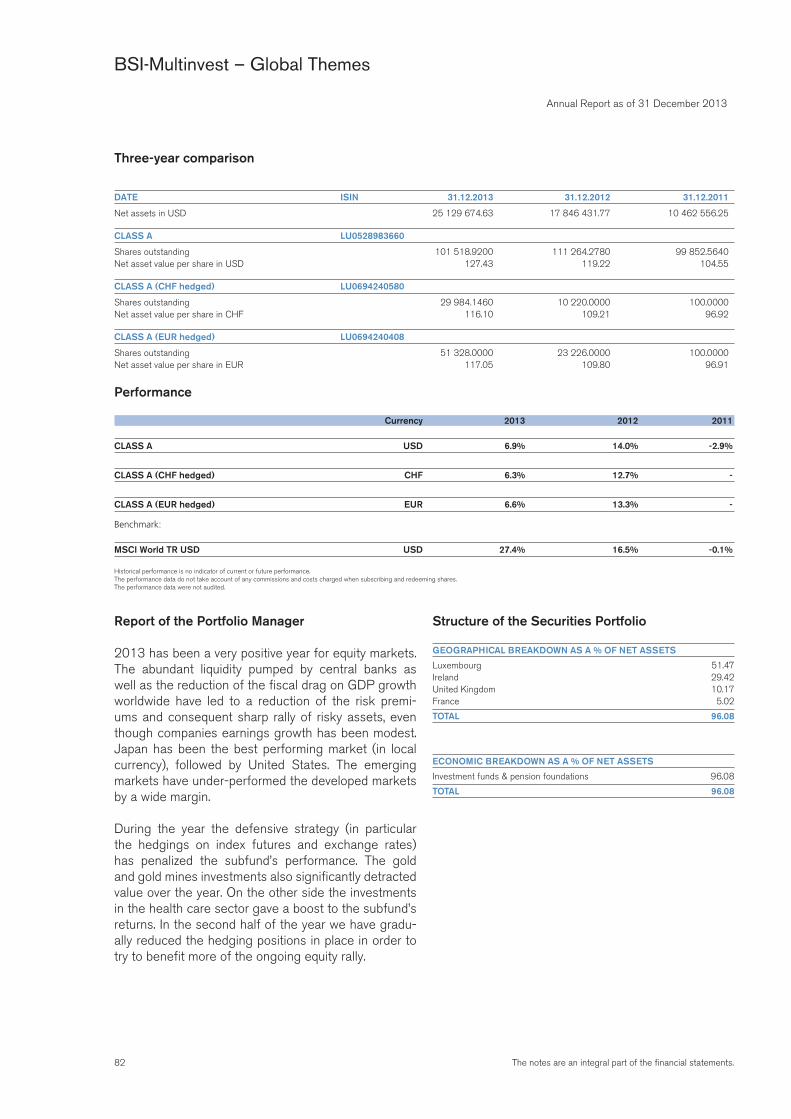
82 The notes are an integral part of the financial statements.
Annual Report as of 31 December 2013
BSI-Multinvest – Global Themes
Three-year comparison
DATE ISIN 31.12.2013 31.12.2012 31.12.2011
Net assets in USD 25 129 674.63 17 846 431.77 10 462 556.25
CLASS A LU0528983660
Shares outstanding 101 518.9200 111 264.2780 99 852.5640Net asset value per share in USD 127.43 119.22 104.55
CLASS A (CHF hedged) LU0694240580
Shares outstanding 29 984.1460 10 220.0000 100.0000Net asset value per share in CHF 116.10 109.21 96.92
CLASS A (EUR hedged) LU0694240408
Shares outstanding 51 328.0000 23 226.0000 100.0000Net asset value per share in EUR 117.05 109.80 96.91
Performance
Currency 2013 2012 2011
CLASS A USD 6.9% 14.0% -2.9%
CLASS A (CHF hedged) CHF 6.3% 12.7% -
CLASS A (EUR hedged) EUR 6.6% 13.3% -
Benchmark:
MSCI World TR USD USD 27.4% 16.5% -0.1%
Historical performance is no indicator of current or future performance.The performance data do not take account of any commissions and costs charged when subscribing and redeeming shares.The performance data were not audited.
Report of the Portfolio Manager
2013 has been a very positive year for equity markets. The abundant liquidity pumped by central banks as well as the reduction of the fiscal drag on GDP growth worldwide have led to a reduction of the risk premi-ums and consequent sharp rally of risky assets, even though companies earnings growth has been modest. Japan has been the best performing market (in local currency), followed by United States. The emerging markets have under-performed the developed markets by a wide margin.
During the year the defensive strategy (in particular the hedgings on index futures and exchange rates) has penalized the subfund’s performance. The gold and gold mines investments also significantly detracted value over the year. On the other side the investments in the health care sector gave a boost to the subfund’s returns. In the second half of the year we have gradu-ally reduced the hedging positions in place in order to try to benefit more of the ongoing equity rally.
Structure of the Securities Portfolio
GEOGRAPHICAL BREAKDOWN AS A % OF NET ASSETS
Luxembourg 51.47Ireland 29.42United Kingdom 10.17France 5.02
TOTAL 96.08
ECONOMIC BREAKDOWN AS A % OF NET ASSETS
Investment funds & pension foundations 96.08
TOTAL 96.08
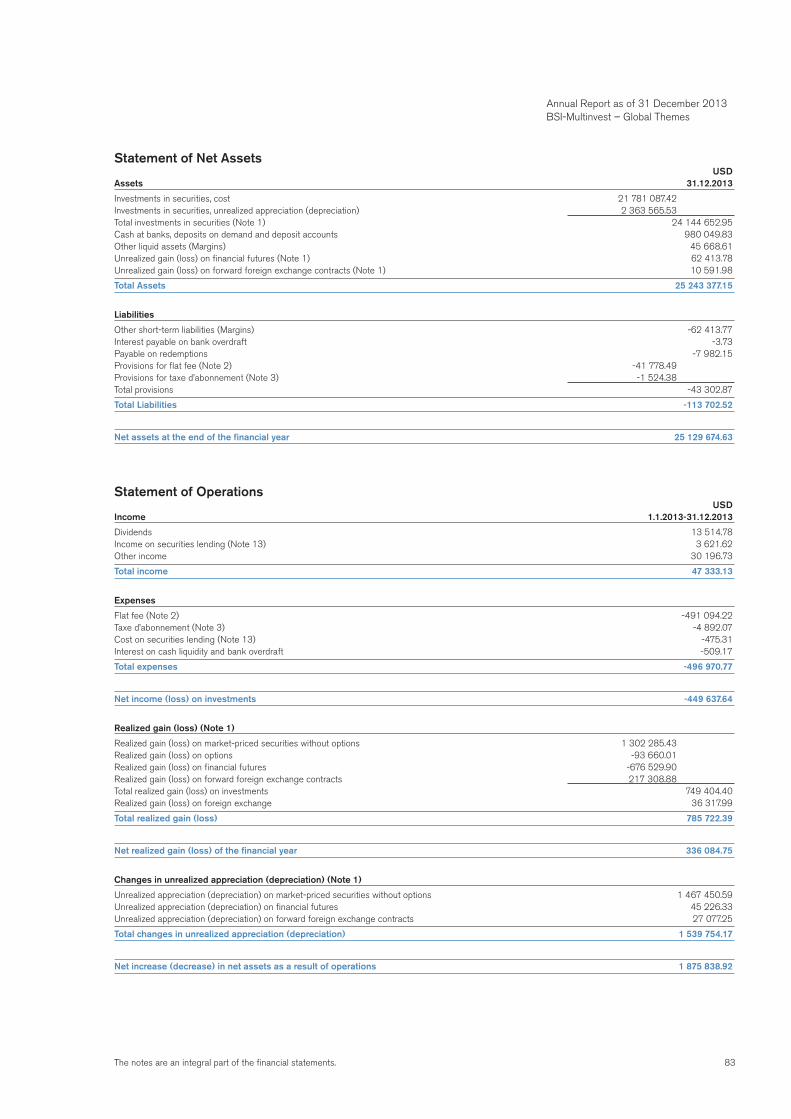
83The notes are an integral part of the financial statements.
Annual Report as of 31 December 2013 BSI-Multinvest – Global Themes
Statement of Net Assets USDAssets 31.12.2013
Investments in securities, cost 21 781 087.42Investments in securities, unrealized appreciation (depreciation) 2 363 565.53Total investments in securities (Note 1) 24 144 652.95Cash at banks, deposits on demand and deposit accounts 980 049.83Other liquid assets (Margins) 45 668.61Unrealized gain (loss) on financial futures (Note 1) 62 413.78Unrealized gain (loss) on forward foreign exchange contracts (Note 1) 10 591.98
Total Assets 25 243 377.15
Liabilities
Other short-term liabilities (Margins) -62 413.77Interest payable on bank overdraft -3.73Payable on redemptions -7 982.15Provisions for flat fee (Note 2) -41 778.49Provisions for taxe d’abonnement (Note 3) -1 524.38Total provisions -43 302.87
Total Liabilities -113 702.52
Net assets at the end of the financial year 25 129 674.63
Statement of Operations USDIncome 1.1.2013-31.12.2013
Dividends 13 514.78Income on securities lending (Note 13) 3 621.62Other income 30 196.73
Total income 47 333.13
Expenses
Flat fee (Note 2) -491 094.22Taxe d’abonnement (Note 3) -4 892.07Cost on securities lending (Note 13) -475.31Interest on cash liquidity and bank overdraft -509.17
Total expenses -496 970.77
Net income (loss) on investments -449 637.64
Realized gain (loss) (Note 1)
Realized gain (loss) on market-priced securities without options 1 302 285.43Realized gain (loss) on options -93 660.01Realized gain (loss) on financial futures -676 529.90Realized gain (loss) on forward foreign exchange contracts 217 308.88Total realized gain (loss) on investments 749 404.40Realized gain (loss) on foreign exchange 36 317.99
Total realized gain (loss) 785 722.39
Net realized gain (loss) of the financial year 336 084.75
Changes in unrealized appreciation (depreciation) (Note 1)
Unrealized appreciation (depreciation) on market-priced securities without options 1 467 450.59Unrealized appreciation (depreciation) on financial futures 45 226.33Unrealized appreciation (depreciation) on forward foreign exchange contracts 27 077.25
Total changes in unrealized appreciation (depreciation) 1 539 754.17
Net increase (decrease) in net assets as a result of operations 1 875 838.92
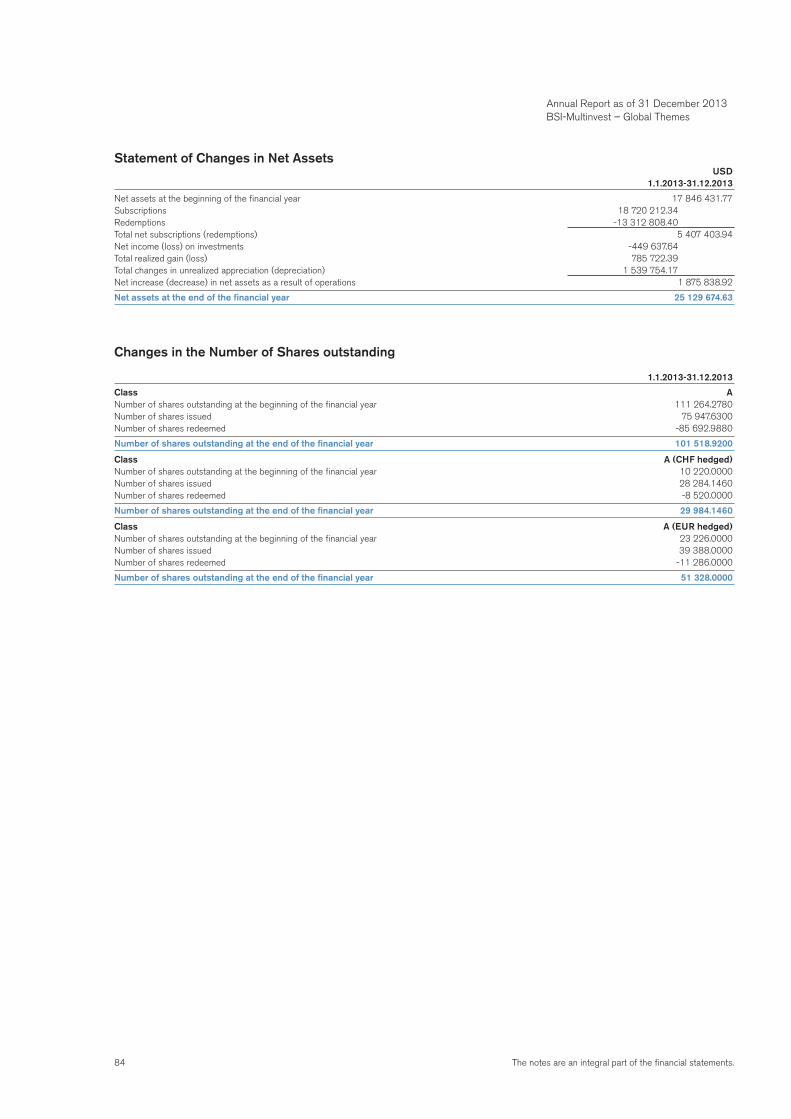
84 The notes are an integral part of the financial statements.
Statement of Changes in Net Assets USD 1.1.2013-31.12.2013
Net assets at the beginning of the financial year 17 846 431.77Subscriptions 18 720 212.34Redemptions -13 312 808.40Total net subscriptions (redemptions) 5 407 403.94Net income (loss) on investments -449 637.64Total realized gain (loss) 785 722.39Total changes in unrealized appreciation (depreciation) 1 539 754.17Net increase (decrease) in net assets as a result of operations 1 875 838.92
Net assets at the end of the financial year 25 129 674.63
Changes in the Number of Shares outstanding
1.1.2013-31.12.2013
Class ANumber of shares outstanding at the beginning of the financial year 111 264.2780Number of shares issued 75 947.6300Number of shares redeemed -85 692.9880
Number of shares outstanding at the end of the financial year 101 518.9200
Class A (CHF hedged)Number of shares outstanding at the beginning of the financial year 10 220.0000Number of shares issued 28 284.1460Number of shares redeemed -8 520.0000
Number of shares outstanding at the end of the financial year 29 984.1460
Class A (EUR hedged)Number of shares outstanding at the beginning of the financial year 23 226.0000Number of shares issued 39 388.0000Number of shares redeemed -11 286.0000
Number of shares outstanding at the end of the financial year 51 328.0000
Annual Report as of 31 December 2013 BSI-Multinvest – Global Themes
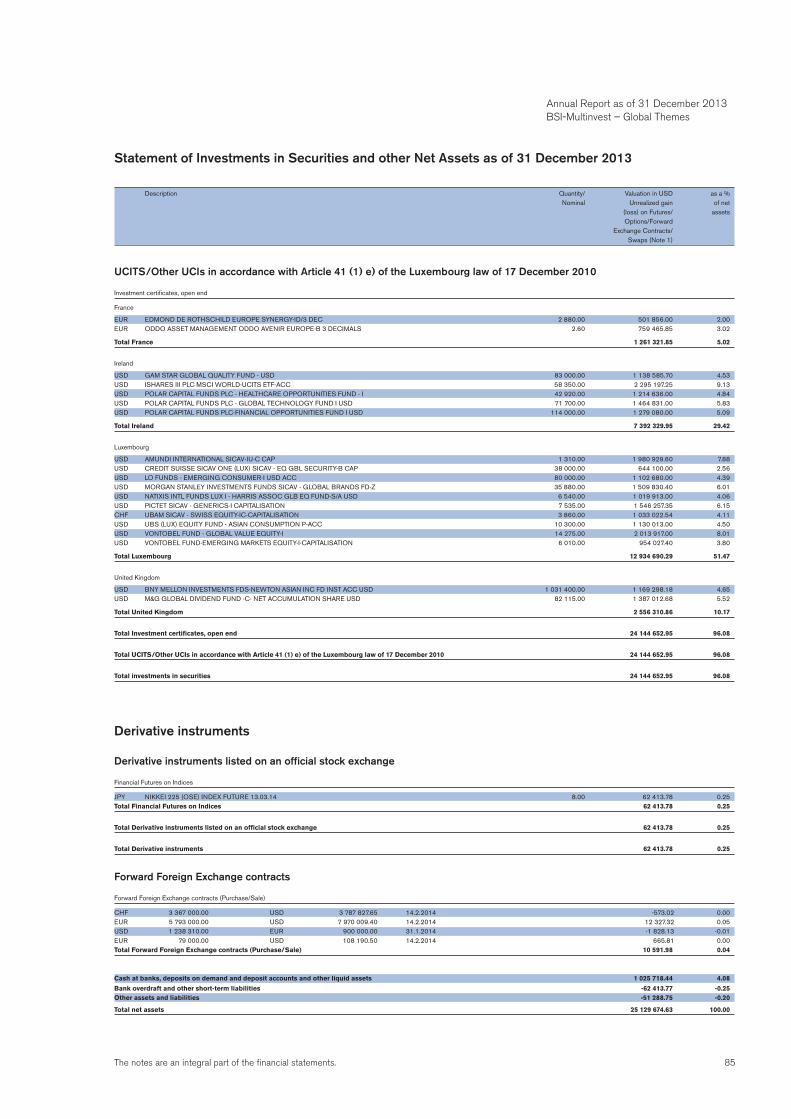
85The notes are an integral part of the financial statements.
Statement of Investments in Securities and other Net Assets as of 31 December 2013
Description Quantity/ Valuation in USD as a % Nominal Unrealized gain of net (loss) on Futures/ assets Options/Forward Exchange Contracts/ Swaps (Note 1)
UCITS/Other UCIs in accordance with Article 41 (1) e) of the Luxembourg law of 17 December 2010
Investment certificates, open end
France
EUR EDMOND DE ROTHSCHILD EUROPE SYNERGY-ID/3 DEC 2 880.00 501 856.00 2.00EUR ODDO ASSET MANAGEMENT ODDO AVENIR EUROPE-B 3 DECIMALS 2.60 759 465.85 3.02
Total France 1 261 321.85 5.02
Ireland
USD GAM STAR GLOBAL QUALITY FUND - USD 83 000.00 1 138 585.70 4.53USD ISHARES III PLC MSCI WORLD-UCITS ETF-ACC 58 350.00 2 295 197.25 9.13USD POLAR CAPITAL FUNDS PLC - HEALTHCARE OPPORTUNITIES FUND - I 42 920.00 1 214 636.00 4.84USD POLAR CAPITAL FUNDS PLC - GLOBAL TECHNOLOGY FUND I USD 71 700.00 1 464 831.00 5.83USD POLAR CAPITAL FUNDS PLC-FINANCIAL OPPORTUNITIES FUND I USD 114 000.00 1 279 080.00 5.09
Total Ireland 7 392 329.95 29.42
Luxembourg
USD AMUNDI INTERNATIONAL SICAV-IU-C CAP 1 310.00 1 980 929.60 7.88USD CREDIT SUISSE SICAV ONE (LUX) SICAV - EQ GBL SECURITY-B CAP 38 000.00 644 100.00 2.56USD LO FUNDS - EMERGING CONSUMER-I USD ACC 80 000.00 1 102 680.00 4.39USD MORGAN STANLEY INVESTMENTS FUNDS SICAV - GLOBAL BRANDS FD-Z 35 880.00 1 509 830.40 6.01USD NATIXIS INTL FUNDS LUX I - HARRIS ASSOC GLB EQ FUND-S/A USD 6 540.00 1 019 913.00 4.06USD PICTET SICAV - GENERICS-I CAPITALISATION 7 535.00 1 546 257.35 6.15CHF UBAM SICAV - SWISS EQUITY-IC-CAPITALISATION 3 860.00 1 033 022.54 4.11USD UBS (LUX) EQUITY FUND - ASIAN CONSUMPTION P-ACC 10 300.00 1 130 013.00 4.50USD VONTOBEL FUND - GLOBAL VALUE EQUITY-I 14 275.00 2 013 917.00 8.01USD VONTOBEL FUND-EMERGING MARKETS EQUITY-I-CAPITALISATION 6 010.00 954 027.40 3.80
Total Luxembourg 12 934 690.29 51.47
United Kingdom
USD BNY MELLON INVESTMENTS FDS-NEWTON ASIAN INC FD INST ACC USD 1 031 400.00 1 169 298.18 4.65USD M&G GLOBAL DIVIDEND FUND -C- NET ACCUMULATION SHARE USD 82 115.00 1 387 012.68 5.52
Total United Kingdom 2 556 310.86 10.17
Total Investment certificates, open end 24 144 652.95 96.08
Total UCITS/Other UCIs in accordance with Article 41 (1) e) of the Luxembourg law of 17 December 2010 24 144 652.95 96.08
Total investments in securities 24 144 652.95 96.08
Derivative instruments
Derivative instruments listed on an official stock exchange
Financial Futures on Indices
JPY NIKKEI 225 (OSE) INDEX FUTURE 13.03.14 8.00 62 413.78 0.25Total Financial Futures on Indices 62 413.78 0.25
Total Derivative instruments listed on an official stock exchange 62 413.78 0.25
Total Derivative instruments 62 413.78 0.25
Forward Foreign Exchange contracts
Forward Foreign Exchange contracts (Purchase/Sale)
CHF 3 367 000.00 USD 3 787 827.65 14.2.2014 -573.02 0.00EUR 5 793 000.00 USD 7 970 009.40 14.2.2014 12 327.32 0.05USD 1 238 310.00 EUR 900 000.00 31.1.2014 -1 828.13 -0.01EUR 79 000.00 USD 108 190.50 14.2.2014 665.81 0.00Total Forward Foreign Exchange contracts (Purchase/Sale) 10 591.98 0.04
Cash at banks, deposits on demand and deposit accounts and other liquid assets 1 025 718.44 4.08
Bank overdraft and other short-term liabilities -62 413.77 -0.25Other assets and liabilities -51 288.75 -0.20
Total net assets 25 129 674.63 100.00
Annual Report as of 31 December 2013 BSI-Multinvest – Global Themes
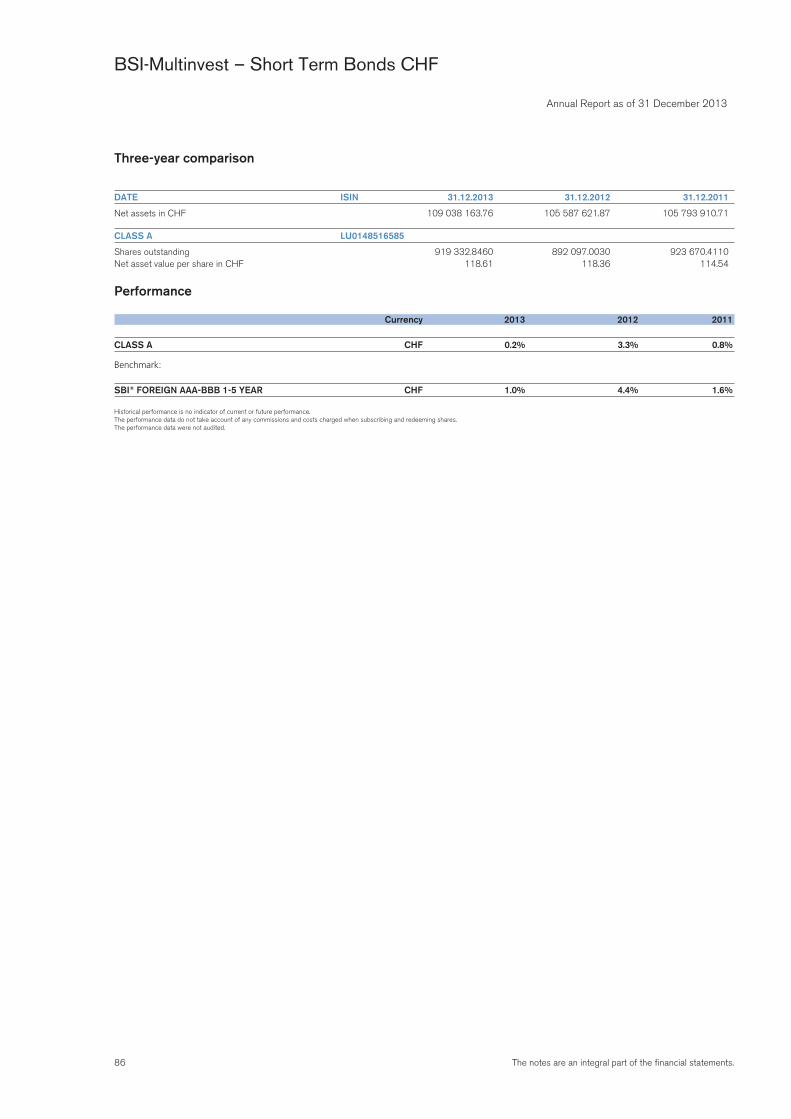
86 The notes are an integral part of the financial statements.
Annual Report as of 31 December 2013
BSI-Multinvest – Short Term Bonds CHF
Three-year comparison
DATE ISIN 31.12.2013 31.12.2012 31.12.2011
Net assets in CHF 109 038 163.76 105 587 621.87 105 793 910.71
CLASS A LU0148516585
Shares outstanding 919 332.8460 892 097.0030 923 670.4110Net asset value per share in CHF 118.61 118.36 114.54
Performance
Currency 2013 2012 2011
CLASS A CHF 0.2% 3.3% 0.8%
Benchmark:
SBI® FOREIGN AAA-BBB 1-5 YEAR CHF 1.0% 4.4% 1.6%
Historical performance is no indicator of current or future performance.The performance data do not take account of any commissions and costs charged when subscribing and redeeming shares.The performance data were not audited.
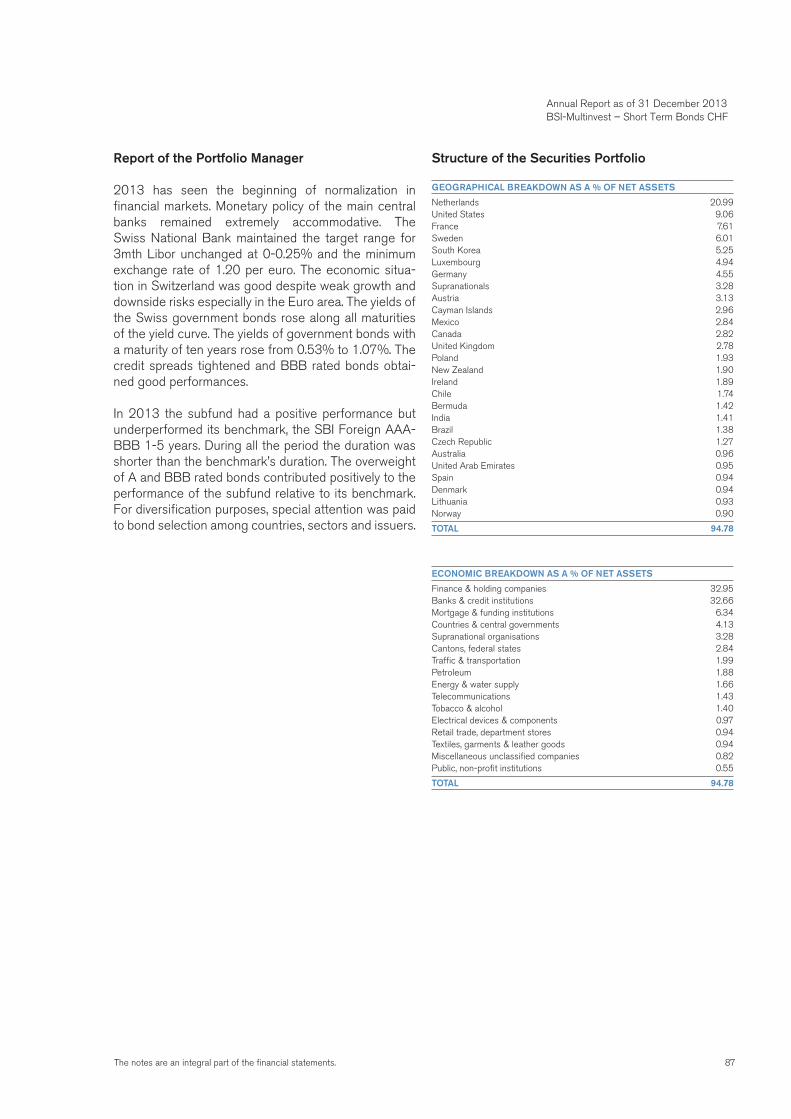
87The notes are an integral part of the financial statements.
Annual Report as of 31 December 2013 BSI-Multinvest – Short Term Bonds CHF
Report of the Portfolio Manager
2013 has seen the beginning of normalization in financial markets. Monetary policy of the main central banks remained extremely accommodative. The Swiss National Bank maintained the target range for 3mth Libor unchanged at 0-0.25% and the minimum exchange rate of 1.20 per euro. The economic situa-tion in Switzerland was good despite weak growth and downside risks especially in the Euro area. The yields of the Swiss government bonds rose along all maturities of the yield curve. The yields of government bonds with a maturity of ten years rose from 0.53% to 1.07%. The credit spreads tightened and BBB rated bonds obtai-ned good performances.
In 2013 the subfund had a positive performance but underperformed its benchmark, the SBI Foreign AAA-BBB 1-5 years. During all the period the duration was shorter than the benchmark’s duration. The overweight of A and BBB rated bonds contributed positively to the performance of the subfund relative to its benchmark. For diversification purposes, special attention was paid to bond selection among countries, sectors and issuers.
Structure of the Securities Portfolio
GEOGRAPHICAL BREAKDOWN AS A % OF NET ASSETS
Netherlands 20.99United States 9.06France 7.61Sweden 6.01South Korea 5.25Luxembourg 4.94Germany 4.55Supranationals 3.28Austria 3.13Cayman Islands 2.96Mexico 2.84Canada 2.82United Kingdom 2.78Poland 1.93New Zealand 1.90Ireland 1.89Chile 1.74Bermuda 1.42India 1.41Brazil 1.38Czech Republic 1.27Australia 0.96United Arab Emirates 0.95Spain 0.94Denmark 0.94Lithuania 0.93Norway 0.90
TOTAL 94.78
ECONOMIC BREAKDOWN AS A % OF NET ASSETS
Finance & holding companies 32.95Banks & credit institutions 32.66Mortgage & funding institutions 6.34Countries & central governments 4.13Supranational organisations 3.28Cantons, federal states 2.84Traffic & transportation 1.99Petroleum 1.88Energy & water supply 1.66Telecommunications 1.43Tobacco & alcohol 1.40Electrical devices & components 0.97Retail trade, department stores 0.94Textiles, garments & leather goods 0.94Miscellaneous unclassified companies 0.82Public, non-profit institutions 0.55
TOTAL 94.78
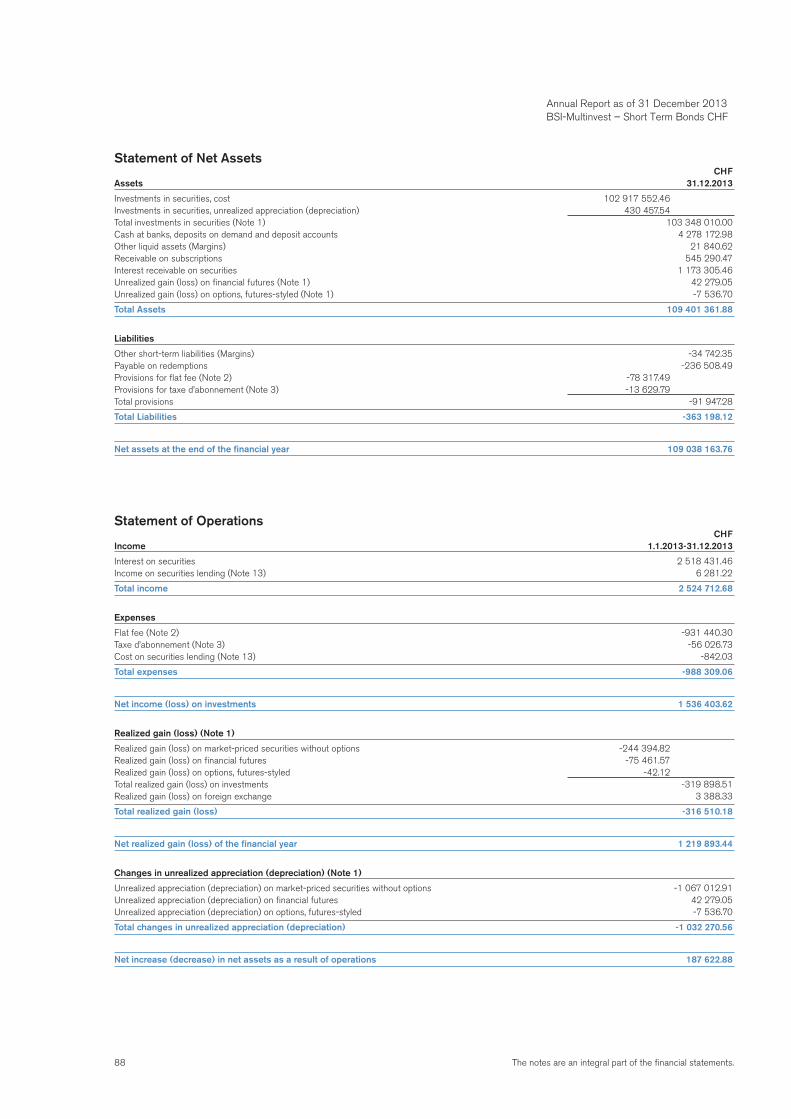
88 The notes are an integral part of the financial statements.
Statement of Net Assets CHFAssets 31.12.2013
Investments in securities, cost 102 917 552.46Investments in securities, unrealized appreciation (depreciation) 430 457.54Total investments in securities (Note 1) 103 348 010.00Cash at banks, deposits on demand and deposit accounts 4 278 172.98Other liquid assets (Margins) 21 840.62Receivable on subscriptions 545 290.47Interest receivable on securities 1 173 305.46Unrealized gain (loss) on financial futures (Note 1) 42 279.05Unrealized gain (loss) on options, futures-styled (Note 1) -7 536.70
Total Assets 109 401 361.88
Liabilities
Other short-term liabilities (Margins) -34 742.35Payable on redemptions -236 508.49Provisions for flat fee (Note 2) -78 317.49Provisions for taxe d’abonnement (Note 3) -13 629.79Total provisions -91 947.28
Total Liabilities -363 198.12
Net assets at the end of the financial year 109 038 163.76
Statement of Operations CHFIncome 1.1.2013-31.12.2013
Interest on securities 2 518 431.46Income on securities lending (Note 13) 6 281.22
Total income 2 524 712.68
Expenses
Flat fee (Note 2) -931 440.30Taxe d’abonnement (Note 3) -56 026.73Cost on securities lending (Note 13) -842.03
Total expenses -988 309.06
Net income (loss) on investments 1 536 403.62
Realized gain (loss) (Note 1)
Realized gain (loss) on market-priced securities without options -244 394.82Realized gain (loss) on financial futures -75 461.57Realized gain (loss) on options, futures-styled -42.12Total realized gain (loss) on investments -319 898.51Realized gain (loss) on foreign exchange 3 388.33
Total realized gain (loss) -316 510.18
Net realized gain (loss) of the financial year 1 219 893.44
Changes in unrealized appreciation (depreciation) (Note 1)
Unrealized appreciation (depreciation) on market-priced securities without options -1 067 012.91Unrealized appreciation (depreciation) on financial futures 42 279.05Unrealized appreciation (depreciation) on options, futures-styled -7 536.70
Total changes in unrealized appreciation (depreciation) -1 032 270.56
Net increase (decrease) in net assets as a result of operations 187 622.88
Annual Report as of 31 December 2013 BSI-Multinvest – Short Term Bonds CHF
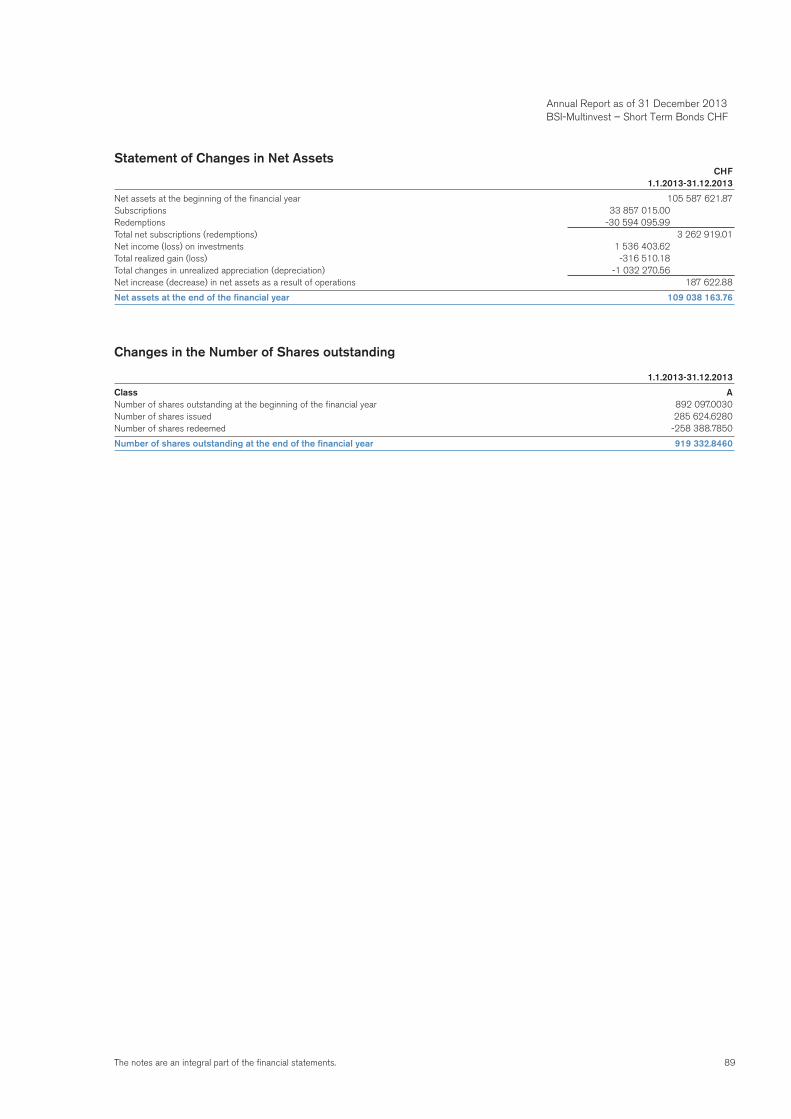
89The notes are an integral part of the financial statements.
Statement of Changes in Net Assets CHF 1.1.2013-31.12.2013
Net assets at the beginning of the financial year 105 587 621.87Subscriptions 33 857 015.00Redemptions -30 594 095.99Total net subscriptions (redemptions) 3 262 919.01Net income (loss) on investments 1 536 403.62Total realized gain (loss) -316 510.18Total changes in unrealized appreciation (depreciation) -1 032 270.56Net increase (decrease) in net assets as a result of operations 187 622.88
Net assets at the end of the financial year 109 038 163.76
Changes in the Number of Shares outstanding
1.1.2013-31.12.2013
Class ANumber of shares outstanding at the beginning of the financial year 892 097.0030Number of shares issued 285 624.6280Number of shares redeemed -258 388.7850
Number of shares outstanding at the end of the financial year 919 332.8460
Annual Report as of 31 December 2013 BSI-Multinvest – Short Term Bonds CHF
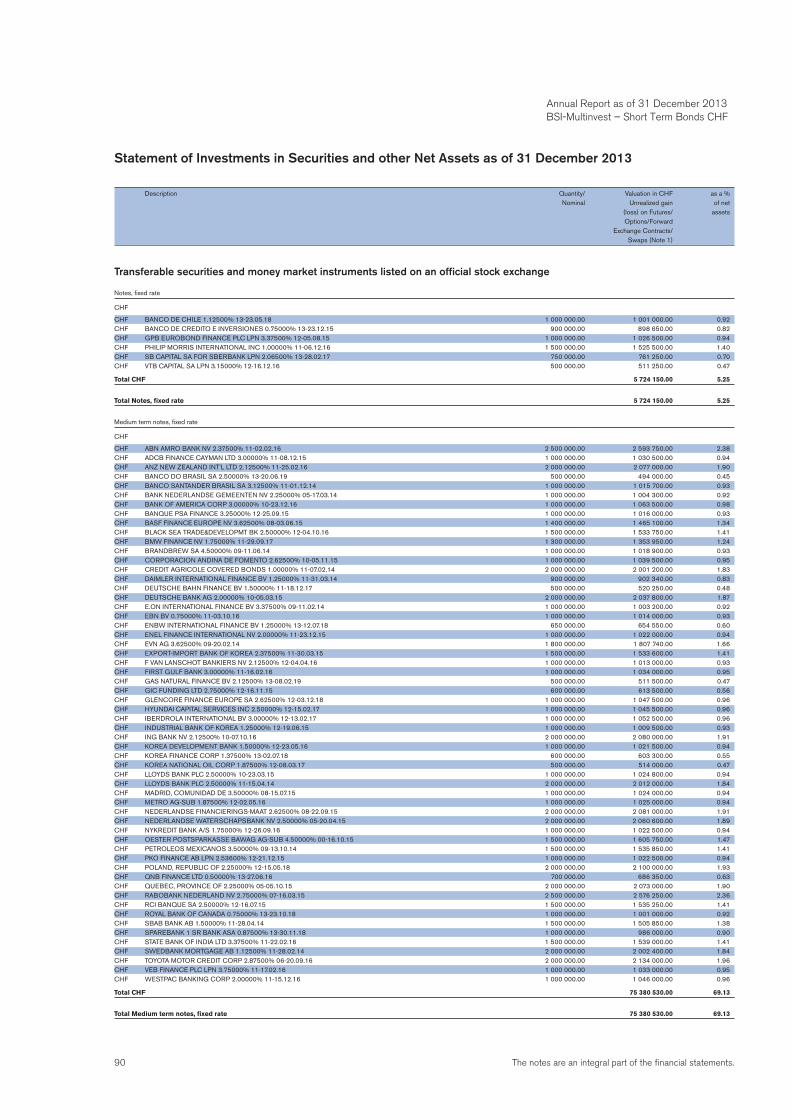
90 The notes are an integral part of the financial statements.
Statement of Investments in Securities and other Net Assets as of 31 December 2013
Description Quantity/ Valuation in CHF as a % Nominal Unrealized gain of net (loss) on Futures/ assets Options/Forward Exchange Contracts/ Swaps (Note 1)
Transferable securities and money market instruments listed on an official stock exchange
Notes, fixed rate
CHF
CHF BANCO DE CHILE 1.12500% 13-23.05.18 1 000 000.00 1 001 000.00 0.92CHF BANCO DE CREDITO E INVERSIONES 0.75000% 13-23.12.15 900 000.00 898 650.00 0.82CHF GPB EUROBOND FINANCE PLC LPN 3.37500% 12-05.08.15 1 000 000.00 1 026 500.00 0.94CHF PHILIP MORRIS INTERNATIONAL INC 1.00000% 11-06.12.16 1 500 000.00 1 525 500.00 1.40CHF SB CAPITAL SA FOR SBERBANK LPN 2.06500% 13-28.02.17 750 000.00 761 250.00 0.70CHF VTB CAPITAL SA LPN 3.15000% 12-16.12.16 500 000.00 511 250.00 0.47
Total CHF 5 724 150.00 5.25
Total Notes, fixed rate 5 724 150.00 5.25
Medium term notes, fixed rate
CHF
CHF ABN AMRO BANK NV 2.37500% 11-02.02.16 2 500 000.00 2 593 750.00 2.38CHF ADCB FINANCE CAYMAN LTD 3.00000% 11-08.12.15 1 000 000.00 1 030 500.00 0.94CHF ANZ NEW ZEALAND INT’L LTD 2.12500% 11-25.02.16 2 000 000.00 2 077 000.00 1.90CHF BANCO DO BRASIL SA 2.50000% 13-20.06.19 500 000.00 494 000.00 0.45CHF BANCO SANTANDER BRASIL SA 3.12500% 11-01.12.14 1 000 000.00 1 015 700.00 0.93CHF BANK NEDERLANDSE GEMEENTEN NV 2.25000% 05-17.03.14 1 000 000.00 1 004 300.00 0.92CHF BANK OF AMERICA CORP 3.00000% 10-23.12.16 1 000 000.00 1 063 500.00 0.98CHF BANQUE PSA FINANCE 3.25000% 12-25.09.15 1 000 000.00 1 016 000.00 0.93CHF BASF FINANCE EUROPE NV 3.62500% 08-03.06.15 1 400 000.00 1 465 100.00 1.34CHF BLACK SEA TRADE&DEVELOPMT BK 2.50000% 12-04.10.16 1 500 000.00 1 533 750.00 1.41CHF BMW FINANCE NV 1.75000% 11-29.09.17 1 300 000.00 1 353 950.00 1.24CHF BRANDBREW SA 4.50000% 09-11.06.14 1 000 000.00 1 018 900.00 0.93CHF CORPORACION ANDINA DE FOMENTO 2.62500% 10-05.11.15 1 000 000.00 1 039 500.00 0.95CHF CREDIT AGRICOLE COVERED BONDS 1.00000% 11-07.02.14 2 000 000.00 2 001 200.00 1.83CHF DAIMLER INTERNATIONAL FINANCE BV 1.25000% 11-31.03.14 900 000.00 902 340.00 0.83CHF DEUTSCHE BAHN FINANCE BV 1.50000% 11-18.12.17 500 000.00 520 250.00 0.48CHF DEUTSCHE BANK AG 2.00000% 10-05.03.15 2 000 000.00 2 037 800.00 1.87CHF E.ON INTERNATIONAL FINANCE BV 3.37500% 09-11.02.14 1 000 000.00 1 003 200.00 0.92CHF EBN BV 0.75000% 11-03.10.16 1 000 000.00 1 014 000.00 0.93CHF ENBW INTERNATIONAL FINANCE BV 1.25000% 13-12.07.18 650 000.00 654 550.00 0.60CHF ENEL FINANCE INTERNATIONAL NV 2.00000% 11-23.12.15 1 000 000.00 1 022 000.00 0.94CHF EVN AG 3.62500% 09-20.02.14 1 800 000.00 1 807 740.00 1.66CHF EXPORT-IMPORT BANK OF KOREA 2.37500% 11-30.03.15 1 500 000.00 1 533 600.00 1.41CHF F VAN LANSCHOT BANKIERS NV 2.12500% 12-04.04.16 1 000 000.00 1 013 000.00 0.93CHF FIRST GULF BANK 3.00000% 11-16.02.16 1 000 000.00 1 034 000.00 0.95CHF GAS NATURAL FINANCE BV 2.12500% 13-08.02.19 500 000.00 511 500.00 0.47CHF GIC FUNDING LTD 2.75000% 12-16.11.15 600 000.00 613 500.00 0.56CHF GLENCORE FINANCE EUROPE SA 2.62500% 12-03.12.18 1 000 000.00 1 047 500.00 0.96CHF HYUNDAI CAPITAL SERVICES INC 2.50000% 12-15.02.17 1 000 000.00 1 045 500.00 0.96CHF IBERDROLA INTERNATIONAL BV 3.00000% 12-13.02.17 1 000 000.00 1 052 500.00 0.96CHF INDUSTRIAL BANK OF KOREA 1.25000% 12-19.06.15 1 000 000.00 1 009 500.00 0.93CHF ING BANK NV 2.12500% 10-07.10.16 2 000 000.00 2 080 000.00 1.91CHF KOREA DEVELOPMENT BANK 1.50000% 12-23.05.16 1 000 000.00 1 021 500.00 0.94CHF KOREA FINANCE CORP 1.37500% 13-02.07.18 600 000.00 603 300.00 0.55CHF KOREA NATIONAL OIL CORP 1.87500% 12-08.03.17 500 000.00 514 000.00 0.47CHF LLOYDS BANK PLC 2.50000% 10-23.03.15 1 000 000.00 1 024 800.00 0.94CHF LLOYDS BANK PLC 2.50000% 11-15.04.14 2 000 000.00 2 012 000.00 1.84CHF MADRID, COMUNIDAD DE 3.50000% 08-15.07.15 1 000 000.00 1 024 000.00 0.94CHF METRO AG-SUB 1.87500% 12-02.05.16 1 000 000.00 1 025 000.00 0.94CHF NEDERLANDSE FINANCIERINGS-MAAT 2.62500% 08-22.09.15 2 000 000.00 2 081 000.00 1.91CHF NEDERLANDSE WATERSCHAPSBANK NV 2.50000% 05-20.04.15 2 000 000.00 2 060 600.00 1.89CHF NYKREDIT BANK A/S 1.75000% 12-26.09.16 1 000 000.00 1 022 500.00 0.94CHF OESTER POSTSPARKASSE BAWAG AG-SUB 4.50000% 00-16.10.15 1 500 000.00 1 605 750.00 1.47CHF PETROLEOS MEXICANOS 3.50000% 09-13.10.14 1 500 000.00 1 535 850.00 1.41CHF PKO FINANCE AB LPN 2.53600% 12-21.12.15 1 000 000.00 1 022 500.00 0.94CHF POLAND, REPUBLIC OF 2.25000% 12-15.05.18 2 000 000.00 2 100 000.00 1.93CHF QNB FINANCE LTD 0.50000% 13-27.06.16 700 000.00 686 350.00 0.63CHF QUEBEC, PROVINCE OF 2.25000% 05-05.10.15 2 000 000.00 2 073 000.00 1.90CHF RABOBANK NEDERLAND NV 2.75000% 07-16.03.15 2 500 000.00 2 576 250.00 2.36CHF RCI BANQUE SA 2.50000% 12-16.07.15 1 500 000.00 1 535 250.00 1.41CHF ROYAL BANK OF CANADA 0.75000% 13-23.10.18 1 000 000.00 1 001 000.00 0.92CHF SBAB BANK AB 1.50000% 11-28.04.14 1 500 000.00 1 505 850.00 1.38CHF SPAREBANK 1 SR BANK ASA 0.87500% 13-30.11.18 1 000 000.00 986 000.00 0.90CHF STATE BANK OF INDIA LTD 3.37500% 11-22.02.16 1 500 000.00 1 539 000.00 1.41CHF SWEDBANK MORTGAGE AB 1.12500% 11-28.02.14 2 000 000.00 2 002 400.00 1.84CHF TOYOTA MOTOR CREDIT CORP 2.87500% 06-20.09.16 2 000 000.00 2 134 000.00 1.96CHF VEB FINANCE PLC LPN 3.75000% 11-17.02.16 1 000 000.00 1 033 000.00 0.95CHF WESTPAC BANKING CORP 2.00000% 11-15.12.16 1 000 000.00 1 046 000.00 0.96
Total CHF 75 380 530.00 69.13
Total Medium term notes, fixed rate 75 380 530.00 69.13
Annual Report as of 31 December 2013 BSI-Multinvest – Short Term Bonds CHF
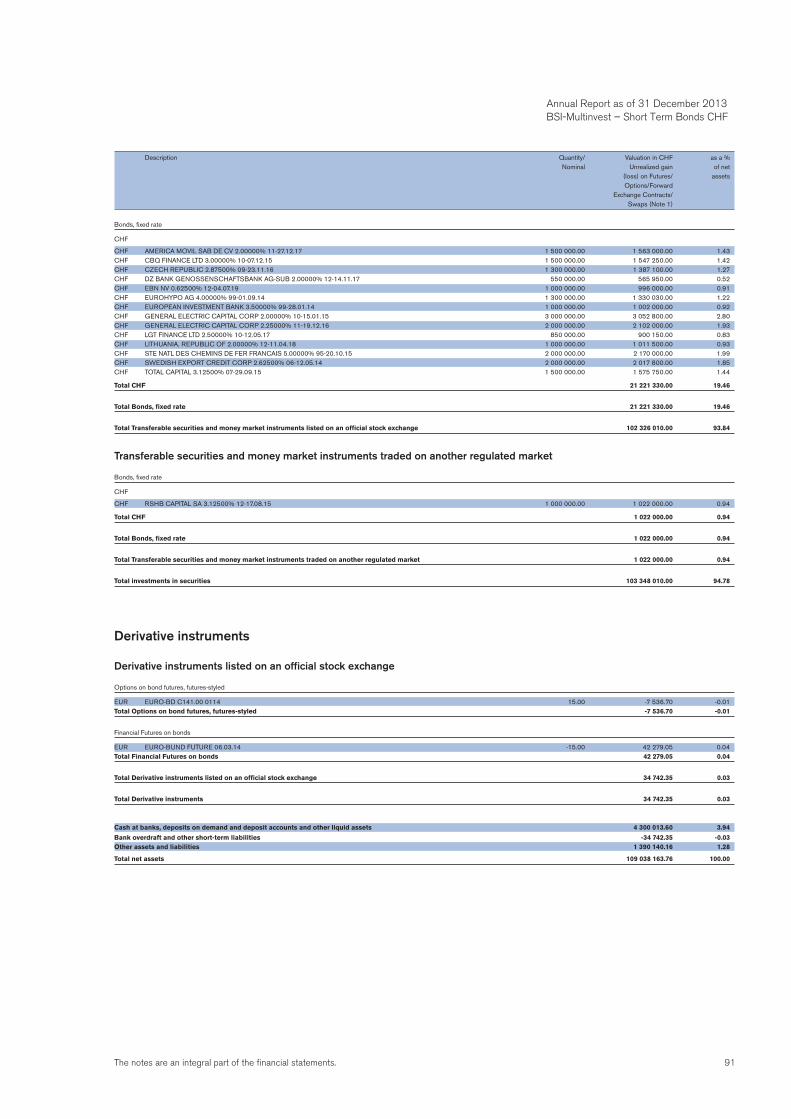
91The notes are an integral part of the financial statements.
Annual Report as of 31 December 2013 BSI-Multinvest – Short Term Bonds CHF
Bonds, fixed rate
CHF
CHF AMERICA MOVIL SAB DE CV 2.00000% 11-27.12.17 1 500 000.00 1 563 000.00 1.43CHF CBQ FINANCE LTD 3.00000% 10-07.12.15 1 500 000.00 1 547 250.00 1.42CHF CZECH REPUBLIC 2.87500% 09-23.11.16 1 300 000.00 1 387 100.00 1.27CHF DZ BANK GENOSSENSCHAFTSBANK AG-SUB 2.00000% 12-14.11.17 550 000.00 565 950.00 0.52CHF EBN NV 0.62500% 12-04.07.19 1 000 000.00 996 000.00 0.91CHF EUROHYPO AG 4.00000% 99-01.09.14 1 300 000.00 1 330 030.00 1.22CHF EUROPEAN INVESTMENT BANK 3.50000% 99-28.01.14 1 000 000.00 1 002 000.00 0.92CHF GENERAL ELECTRIC CAPITAL CORP 2.00000% 10-15.01.15 3 000 000.00 3 052 800.00 2.80CHF GENERAL ELECTRIC CAPITAL CORP 2.25000% 11-19.12.16 2 000 000.00 2 102 000.00 1.93CHF LGT FINANCE LTD 2.50000% 10-12.05.17 850 000.00 900 150.00 0.83CHF LITHUANIA, REPUBLIC OF 2.00000% 12-11.04.18 1 000 000.00 1 011 500.00 0.93CHF STE NATL DES CHEMINS DE FER FRANCAIS 5.00000% 95-20.10.15 2 000 000.00 2 170 000.00 1.99CHF SWEDISH EXPORT CREDIT CORP 2.62500% 06-12.05.14 2 000 000.00 2 017 800.00 1.85CHF TOTAL CAPITAL 3.12500% 07-29.09.15 1 500 000.00 1 575 750.00 1.44
Total CHF 21 221 330.00 19.46
Total Bonds, fixed rate 21 221 330.00 19.46
Total Transferable securities and money market instruments listed on an official stock exchange 102 326 010.00 93.84
Transferable securities and money market instruments traded on another regulated market
Bonds, fixed rate
CHF
CHF RSHB CAPITAL SA 3.12500% 12-17.08.15 1 000 000.00 1 022 000.00 0.94
Total CHF 1 022 000.00 0.94
Total Bonds, fixed rate 1 022 000.00 0.94
Total Transferable securities and money market instruments traded on another regulated market 1 022 000.00 0.94
Total investments in securities 103 348 010.00 94.78
Derivative instruments
Derivative instruments listed on an official stock exchange
Options on bond futures, futures-styled
EUR EURO-BD C141.00 0114 15.00 -7 536.70 -0.01Total Options on bond futures, futures-styled -7 536.70 -0.01
Financial Futures on bonds
EUR EURO-BUND FUTURE 06.03.14 -15.00 42 279.05 0.04Total Financial Futures on bonds 42 279.05 0.04
Total Derivative instruments listed on an official stock exchange 34 742.35 0.03
Total Derivative instruments 34 742.35 0.03
Cash at banks, deposits on demand and deposit accounts and other liquid assets 4 300 013.60 3.94
Bank overdraft and other short-term liabilities -34 742.35 -0.03Other assets and liabilities 1 390 140.16 1.28
Total net assets 109 038 163.76 100.00
Description Quantity/ Valuation in CHF as a % Nominal Unrealized gain of net (loss) on Futures/ assets Options/Forward Exchange Contracts/ Swaps (Note 1)
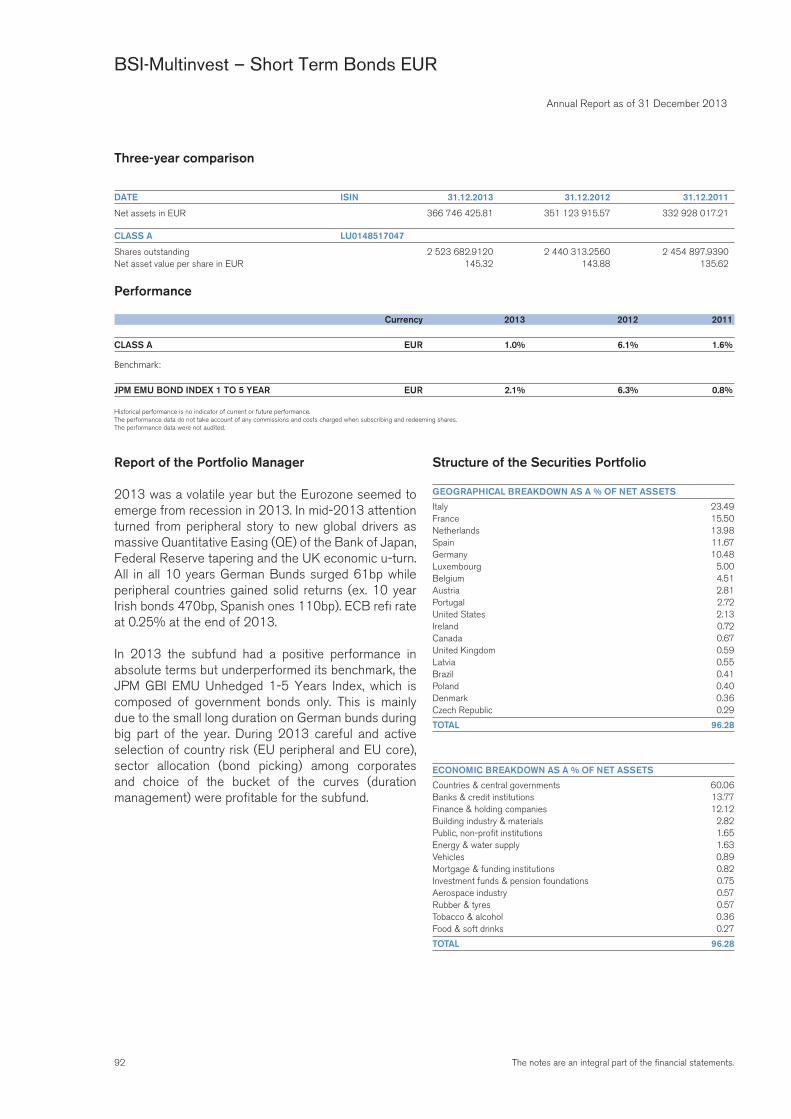
92 The notes are an integral part of the financial statements.
Annual Report as of 31 December 2013
BSI-Multinvest – Short Term Bonds EUR
Three-year comparison
DATE ISIN 31.12.2013 31.12.2012 31.12.2011
Net assets in EUR 366 746 425.81 351 123 915.57 332 928 017.21
CLASS A LU0148517047
Shares outstanding 2 523 682.9120 2 440 313.2560 2 454 897.9390Net asset value per share in EUR 145.32 143.88 135.62
Performance
Currency 2013 2012 2011
CLASS A EUR 1.0% 6.1% 1.6%
Benchmark:
JPM EMU BOND INDEX 1 TO 5 YEAR EUR 2.1% 6.3% 0.8%
Historical performance is no indicator of current or future performance.The performance data do not take account of any commissions and costs charged when subscribing and redeeming shares.The performance data were not audited.
Report of the Portfolio Manager
2013 was a volatile year but the Eurozone seemed to emerge from recession in 2013. In mid-2013 attention turned from peripheral story to new global drivers as massive Quantitative Easing (QE) of the Bank of Japan, Federal Reserve tapering and the UK economic u-turn. All in all 10 years German Bunds surged 61bp while peripheral countries gained solid returns (ex. 10 year Irish bonds 470bp, Spanish ones 110bp). ECB refi rate at 0.25% at the end of 2013.
In 2013 the subfund had a positive performance in absolute terms but underperformed its benchmark, the JPM GBI EMU Unhedged 1-5 Years Index, which is composed of government bonds only. This is mainly due to the small long duration on German bunds during big part of the year. During 2013 careful and active selection of country risk (EU peripheral and EU core), sector allocation (bond picking) among corporates and choice of the bucket of the curves (duration management) were profitable for the subfund.
Structure of the Securities Portfolio
GEOGRAPHICAL BREAKDOWN AS A % OF NET ASSETS
Italy 23.49France 15.50Netherlands 13.98Spain 11.67Germany 10.48Luxembourg 5.00Belgium 4.51Austria 2.81Portugal 2.72United States 2.13Ireland 0.72Canada 0.67United Kingdom 0.59Latvia 0.55Brazil 0.41Poland 0.40Denmark 0.36Czech Republic 0.29
TOTAL 96.28
ECONOMIC BREAKDOWN AS A % OF NET ASSETS
Countries & central governments 60.06Banks & credit institutions 13.77Finance & holding companies 12.12Building industry & materials 2.82Public, non-profit institutions 1.65Energy & water supply 1.63Vehicles 0.89Mortgage & funding institutions 0.82Investment funds & pension foundations 0.75Aerospace industry 0.57Rubber & tyres 0.57Tobacco & alcohol 0.36Food & soft drinks 0.27
TOTAL 96.28
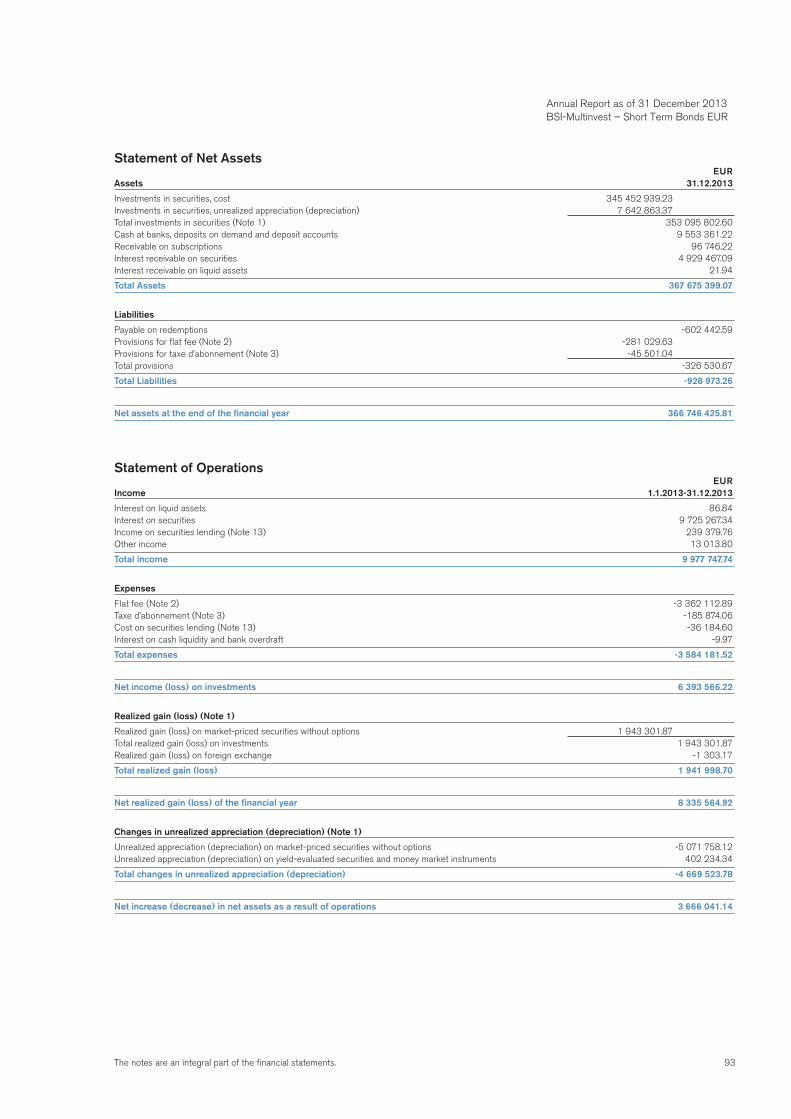
93The notes are an integral part of the financial statements.
Statement of Net Assets EURAssets 31.12.2013
Investments in securities, cost 345 452 939.23Investments in securities, unrealized appreciation (depreciation) 7 642 863.37Total investments in securities (Note 1) 353 095 802.60Cash at banks, deposits on demand and deposit accounts 9 553 361.22Receivable on subscriptions 96 746.22Interest receivable on securities 4 929 467.09Interest receivable on liquid assets 21.94
Total Assets 367 675 399.07
Liabilities
Payable on redemptions -602 442.59Provisions for flat fee (Note 2) -281 029.63Provisions for taxe d’abonnement (Note 3) -45 501.04Total provisions -326 530.67
Total Liabilities -928 973.26
Net assets at the end of the financial year 366 746 425.81
Statement of Operations EURIncome 1.1.2013-31.12.2013
Interest on liquid assets 86.84Interest on securities 9 725 267.34Income on securities lending (Note 13) 239 379.76Other income 13 013.80
Total income 9 977 747.74
Expenses
Flat fee (Note 2) -3 362 112.89Taxe d’abonnement (Note 3) -185 874.06Cost on securities lending (Note 13) -36 184.60Interest on cash liquidity and bank overdraft -9.97
Total expenses -3 584 181.52
Net income (loss) on investments 6 393 566.22
Realized gain (loss) (Note 1)
Realized gain (loss) on market-priced securities without options 1 943 301.87Total realized gain (loss) on investments 1 943 301.87Realized gain (loss) on foreign exchange -1 303.17
Total realized gain (loss) 1 941 998.70
Net realized gain (loss) of the financial year 8 335 564.92
Changes in unrealized appreciation (depreciation) (Note 1)
Unrealized appreciation (depreciation) on market-priced securities without options -5 071 758.12Unrealized appreciation (depreciation) on yield-evaluated securities and money market instruments 402 234.34
Total changes in unrealized appreciation (depreciation) -4 669 523.78
Net increase (decrease) in net assets as a result of operations 3 666 041.14
Annual Report as of 31 December 2013 BSI-Multinvest – Short Term Bonds EUR
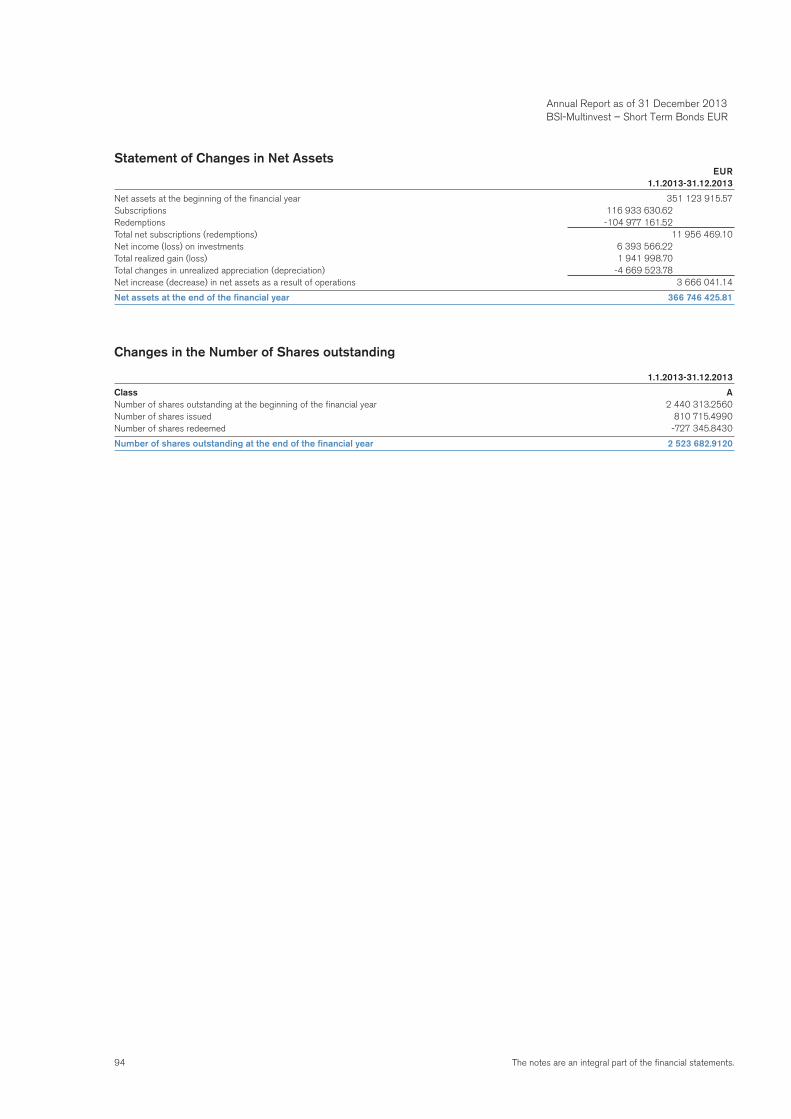
94 The notes are an integral part of the financial statements.
Statement of Changes in Net Assets EUR 1.1.2013-31.12.2013
Net assets at the beginning of the financial year 351 123 915.57Subscriptions 116 933 630.62Redemptions -104 977 161.52Total net subscriptions (redemptions) 11 956 469.10Net income (loss) on investments 6 393 566.22Total realized gain (loss) 1 941 998.70Total changes in unrealized appreciation (depreciation) -4 669 523.78Net increase (decrease) in net assets as a result of operations 3 666 041.14
Net assets at the end of the financial year 366 746 425.81
Changes in the Number of Shares outstanding
1.1.2013-31.12.2013
Class ANumber of shares outstanding at the beginning of the financial year 2 440 313.2560Number of shares issued 810 715.4990Number of shares redeemed -727 345.8430
Number of shares outstanding at the end of the financial year 2 523 682.9120
Annual Report as of 31 December 2013 BSI-Multinvest – Short Term Bonds EUR
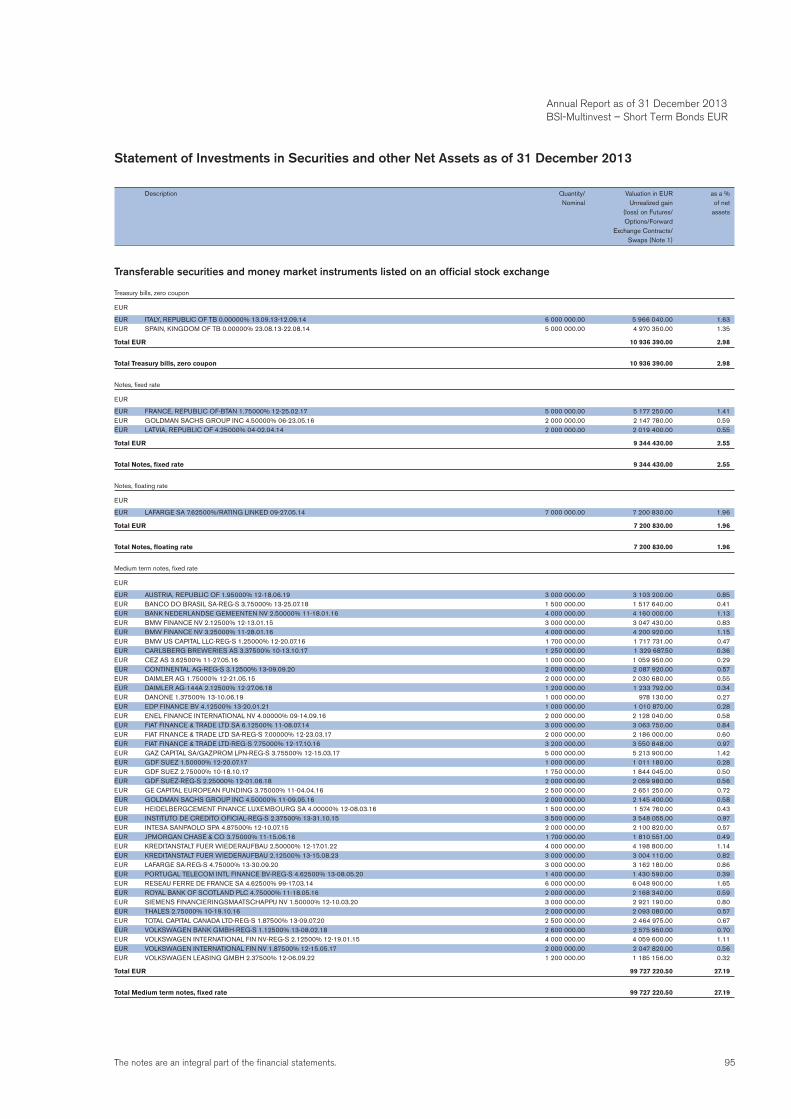
95The notes are an integral part of the financial statements.
Statement of Investments in Securities and other Net Assets as of 31 December 2013
Description Quantity/ Valuation in EUR as a % Nominal Unrealized gain of net (loss) on Futures/ assets Options/Forward Exchange Contracts/ Swaps (Note 1)
Transferable securities and money market instruments listed on an official stock exchange
Treasury bills, zero coupon
EUR
EUR ITALY, REPUBLIC OF TB 0.00000% 13.09.13-12.09.14 6 000 000.00 5 966 040.00 1.63EUR SPAIN, KINGDOM OF TB 0.00000% 23.08.13-22.08.14 5 000 000.00 4 970 350.00 1.35
Total EUR 10 936 390.00 2.98
Total Treasury bills, zero coupon 10 936 390.00 2.98
Notes, fixed rate
EUR
EUR FRANCE, REPUBLIC OF-BTAN 1.75000% 12-25.02.17 5 000 000.00 5 177 250.00 1.41EUR GOLDMAN SACHS GROUP INC 4.50000% 06-23.05.16 2 000 000.00 2 147 780.00 0.59EUR LATVIA, REPUBLIC OF 4.25000% 04-02.04.14 2 000 000.00 2 019 400.00 0.55
Total EUR 9 344 430.00 2.55
Total Notes, fixed rate 9 344 430.00 2.55
Notes, floating rate
EUR
EUR LAFARGE SA 7.62500%/RATING LINKED 09-27.05.14 7 000 000.00 7 200 830.00 1.96
Total EUR 7 200 830.00 1.96
Total Notes, floating rate 7 200 830.00 1.96
Medium term notes, fixed rate
EUR
EUR AUSTRIA, REPUBLIC OF 1.95000% 12-18.06.19 3 000 000.00 3 103 200.00 0.85EUR BANCO DO BRASIL SA-REG-S 3.75000% 13-25.07.18 1 500 000.00 1 517 640.00 0.41EUR BANK NEDERLANDSE GEMEENTEN NV 2.50000% 11-18.01.16 4 000 000.00 4 160 000.00 1.13EUR BMW FINANCE NV 2.12500% 12-13.01.15 3 000 000.00 3 047 430.00 0.83EUR BMW FINANCE NV 3.25000% 11-28.01.16 4 000 000.00 4 200 920.00 1.15EUR BMW US CAPITAL LLC-REG-S 1.25000% 12-20.07.16 1 700 000.00 1 717 731.00 0.47EUR CARLSBERG BREWERIES AS 3.37500% 10-13.10.17 1 250 000.00 1 329 687.50 0.36EUR CEZ AS 3.62500% 11-27.05.16 1 000 000.00 1 059 950.00 0.29EUR CONTINENTAL AG-REG-S 3.12500% 13-09.09.20 2 000 000.00 2 087 920.00 0.57EUR DAIMLER AG 1.75000% 12-21.05.15 2 000 000.00 2 030 680.00 0.55EUR DAIMLER AG-144A 2.12500% 12-27.06.18 1 200 000.00 1 233 792.00 0.34EUR DANONE 1.37500% 13-10.06.19 1 000 000.00 978 130.00 0.27EUR EDP FINANCE BV 4.12500% 13-20.01.21 1 000 000.00 1 010 870.00 0.28EUR ENEL FINANCE INTERNATIONAL NV 4.00000% 09-14.09.16 2 000 000.00 2 128 040.00 0.58EUR FIAT FINANCE & TRADE LTD SA 6.12500% 11-08.07.14 3 000 000.00 3 063 750.00 0.84EUR FIAT FINANCE & TRADE LTD SA-REG-S 7.00000% 12-23.03.17 2 000 000.00 2 186 000.00 0.60EUR FIAT FINANCE & TRADE LTD-REG-S 7.75000% 12-17.10.16 3 200 000.00 3 550 848.00 0.97EUR GAZ CAPITAL SA/GAZPROM LPN-REG-S 3.75500% 12-15.03.17 5 000 000.00 5 213 900.00 1.42EUR GDF SUEZ 1.50000% 12-20.07.17 1 000 000.00 1 011 180.00 0.28EUR GDF SUEZ 2.75000% 10-18.10.17 1 750 000.00 1 844 045.00 0.50EUR GDF SUEZ-REG-S 2.25000% 12-01.06.18 2 000 000.00 2 059 980.00 0.56EUR GE CAPITAL EUROPEAN FUNDING 3.75000% 11-04.04.16 2 500 000.00 2 651 250.00 0.72EUR GOLDMAN SACHS GROUP INC 4.50000% 11-09.05.16 2 000 000.00 2 145 400.00 0.58EUR HEIDELBERGCEMENT FINANCE LUXEMBOURG SA 4.00000% 12-08.03.16 1 500 000.00 1 574 760.00 0.43EUR INSTITUTO DE CREDITO OFICIAL-REG-S 2.37500% 13-31.10.15 3 500 000.00 3 548 055.00 0.97EUR INTESA SANPAOLO SPA 4.87500% 12-10.07.15 2 000 000.00 2 100 820.00 0.57EUR JPMORGAN CHASE & CO 3.75000% 11-15.06.16 1 700 000.00 1 810 551.00 0.49EUR KREDITANSTALT FUER WIEDERAUFBAU 2.50000% 12-17.01.22 4 000 000.00 4 198 800.00 1.14EUR KREDITANSTALT FUER WIEDERAUFBAU 2.12500% 13-15.08.23 3 000 000.00 3 004 110.00 0.82EUR LAFARGE SA-REG-S 4.75000% 13-30.09.20 3 000 000.00 3 162 180.00 0.86EUR PORTUGAL TELECOM INTL FINANCE BV-REG-S 4.62500% 13-08.05.20 1 400 000.00 1 430 590.00 0.39EUR RESEAU FERRE DE FRANCE SA 4.62500% 99-17.03.14 6 000 000.00 6 048 900.00 1.65EUR ROYAL BANK OF SCOTLAND PLC 4.75000% 11-18.05.16 2 000 000.00 2 168 340.00 0.59EUR SIEMENS FINANCIERINGSMAATSCHAPPIJ NV 1.50000% 12-10.03.20 3 000 000.00 2 921 190.00 0.80EUR THALES 2.75000% 10-19.10.16 2 000 000.00 2 093 080.00 0.57EUR TOTAL CAPITAL CANADA LTD-REG-S 1.87500% 13-09.07.20 2 500 000.00 2 464 975.00 0.67EUR VOLKSWAGEN BANK GMBH-REG-S 1.12500% 13-08.02.18 2 600 000.00 2 575 950.00 0.70EUR VOLKSWAGEN INTERNATIONAL FIN NV-REG-S 2.12500% 12-19.01.15 4 000 000.00 4 059 600.00 1.11EUR VOLKSWAGEN INTERNATIONAL FIN NV 1.87500% 12-15.05.17 2 000 000.00 2 047 820.00 0.56EUR VOLKSWAGEN LEASING GMBH 2.37500% 12-06.09.22 1 200 000.00 1 185 156.00 0.32
Total EUR 99 727 220.50 27.19
Total Medium term notes, fixed rate 99 727 220.50 27.19
Annual Report as of 31 December 2013 BSI-Multinvest – Short Term Bonds EUR
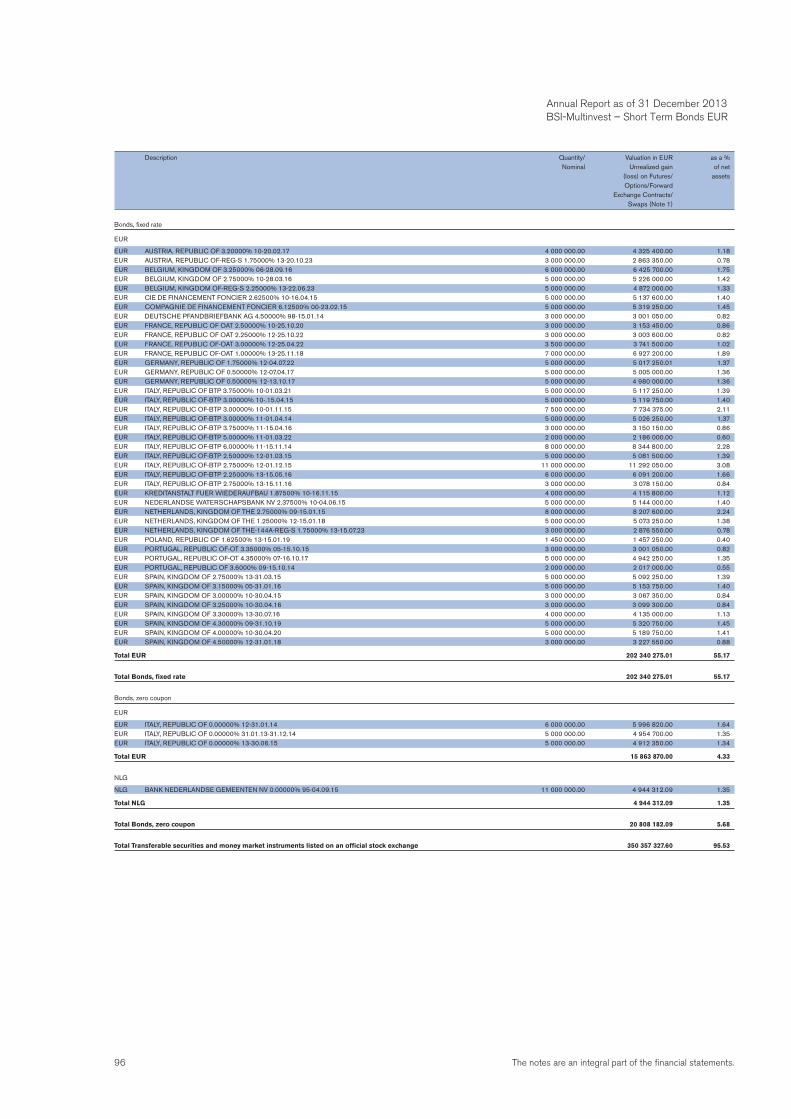
96 The notes are an integral part of the financial statements.
Bonds, fixed rate
EUR
EUR AUSTRIA, REPUBLIC OF 3.20000% 10-20.02.17 4 000 000.00 4 325 400.00 1.18EUR AUSTRIA, REPUBLIC OF-REG-S 1.75000% 13-20.10.23 3 000 000.00 2 863 350.00 0.78EUR BELGIUM, KINGDOM OF 3.25000% 06-28.09.16 6 000 000.00 6 425 700.00 1.75EUR BELGIUM, KINGDOM OF 2.75000% 10-28.03.16 5 000 000.00 5 226 000.00 1.42EUR BELGIUM, KINGDOM OF-REG-S 2.25000% 13-22.06.23 5 000 000.00 4 872 000.00 1.33EUR CIE DE FINANCEMENT FONCIER 2.62500% 10-16.04.15 5 000 000.00 5 137 600.00 1.40EUR COMPAGNIE DE FINANCEMENT FONCIER 6.12500% 00-23.02.15 5 000 000.00 5 319 250.00 1.45EUR DEUTSCHE PFANDBRIEFBANK AG 4.50000% 98-15.01.14 3 000 000.00 3 001 050.00 0.82EUR FRANCE, REPUBLIC OF OAT 2.50000% 10-25.10.20 3 000 000.00 3 153 450.00 0.86EUR FRANCE, REPUBLIC OF OAT 2.25000% 12-25.10.22 3 000 000.00 3 003 600.00 0.82EUR FRANCE, REPUBLIC OF-OAT 3.00000% 12-25.04.22 3 500 000.00 3 741 500.00 1.02EUR FRANCE, REPUBLIC OF-OAT 1.00000% 13-25.11.18 7 000 000.00 6 927 200.00 1.89EUR GERMANY, REPUBLIC OF 1.75000% 12-04.07.22 5 000 000.00 5 017 250.01 1.37EUR GERMANY, REPUBLIC OF 0.50000% 12-07.04.17 5 000 000.00 5 005 000.00 1.36EUR GERMANY, REPUBLIC OF 0.50000% 12-13.10.17 5 000 000.00 4 980 000.00 1.36EUR ITALY, REPUBLIC OF BTP 3.75000% 10-01.03.21 5 000 000.00 5 117 250.00 1.39EUR ITALY, REPUBLIC OF-BTP 3.00000% 10-.15.04.15 5 000 000.00 5 119 750.00 1.40EUR ITALY, REPUBLIC OF-BTP 3.00000% 10-01.11.15 7 500 000.00 7 734 375.00 2.11EUR ITALY, REPUBLIC OF-BTP 3.00000% 11-01.04.14 5 000 000.00 5 026 250.00 1.37EUR ITALY, REPUBLIC OF-BTP 3.75000% 11-15.04.16 3 000 000.00 3 150 150.00 0.86EUR ITALY, REPUBLIC OF-BTP 5.00000% 11-01.03.22 2 000 000.00 2 186 000.00 0.60EUR ITALY, REPUBLIC OF-BTP 6.00000% 11-15.11.14 8 000 000.00 8 344 800.00 2.28EUR ITALY, REPUBLIC OF-BTP 2.50000% 12-01.03.15 5 000 000.00 5 081 500.00 1.39EUR ITALY, REPUBLIC OF-BTP 2.75000% 12-01.12.15 11 000 000.00 11 292 050.00 3.08EUR ITALY, REPUBLIC OF-BTP 2.25000% 13-15.05.16 6 000 000.00 6 091 200.00 1.66EUR ITALY, REPUBLIC OF-BTP 2.75000% 13-15.11.16 3 000 000.00 3 078 150.00 0.84EUR KREDITANSTALT FUER WIEDERAUFBAU 1.87500% 10-16.11.15 4 000 000.00 4 115 800.00 1.12EUR NEDERLANDSE WATERSCHAPSBANK NV 2.37500% 10-04.06.15 5 000 000.00 5 144 000.00 1.40EUR NETHERLANDS, KINGDOM OF THE 2.75000% 09-15.01.15 8 000 000.00 8 207 600.00 2.24EUR NETHERLANDS, KINGDOM OF THE 1.25000% 12-15.01.18 5 000 000.00 5 073 250.00 1.38EUR NETHERLANDS, KINGDOM OF THE-144A-REG-S 1.75000% 13-15.07.23 3 000 000.00 2 876 550.00 0.78EUR POLAND, REPUBLIC OF 1.62500% 13-15.01.19 1 450 000.00 1 457 250.00 0.40EUR PORTUGAL, REPUBLIC OF-OT 3.35000% 05-15.10.15 3 000 000.00 3 001 050.00 0.82EUR PORTUGAL, REPUBLIC OF-OT 4.35000% 07-16.10.17 5 000 000.00 4 942 250.00 1.35EUR PORTUGAL, REPUBLIC OF 3.6000% 09-15.10.14 2 000 000.00 2 017 000.00 0.55EUR SPAIN, KINGDOM OF 2.75000% 13-31.03.15 5 000 000.00 5 092 250.00 1.39EUR SPAIN, KINGDOM OF 3.15000% 05-31.01.16 5 000 000.00 5 153 750.00 1.40EUR SPAIN, KINGDOM OF 3.00000% 10-30.04.15 3 000 000.00 3 067 350.00 0.84EUR SPAIN, KINGDOM OF 3.25000% 10-30.04.16 3 000 000.00 3 099 300.00 0.84EUR SPAIN, KINGDOM OF 3.30000% 13-30.07.16 4 000 000.00 4 135 000.00 1.13EUR SPAIN, KINGDOM OF 4.30000% 09-31.10.19 5 000 000.00 5 320 750.00 1.45EUR SPAIN, KINGDOM OF 4.00000% 10-30.04.20 5 000 000.00 5 189 750.00 1.41EUR SPAIN, KINGDOM OF 4.50000% 12-31.01.18 3 000 000.00 3 227 550.00 0.88
Total EUR 202 340 275.01 55.17
Total Bonds, fixed rate 202 340 275.01 55.17
Bonds, zero coupon
EUR
EUR ITALY, REPUBLIC OF 0.00000% 12-31.01.14 6 000 000.00 5 996 820.00 1.64EUR ITALY, REPUBLIC OF 0.00000% 31.01.13-31.12.14 5 000 000.00 4 954 700.00 1.35EUR ITALY, REPUBLIC OF 0.00000% 13-30.06.15 5 000 000.00 4 912 350.00 1.34
Total EUR 15 863 870.00 4.33
NLG
NLG BANK NEDERLANDSE GEMEENTEN NV 0.00000% 95-04.09.15 11 000 000.00 4 944 312.09 1.35
Total NLG 4 944 312.09 1.35
Total Bonds, zero coupon 20 808 182.09 5.68
Total Transferable securities and money market instruments listed on an official stock exchange 350 357 327.60 95.53
Description Quantity/ Valuation in EUR as a % Nominal Unrealized gain of net (loss) on Futures/ assets Options/Forward Exchange Contracts/ Swaps (Note 1)
Annual Report as of 31 December 2013 BSI-Multinvest – Short Term Bonds EUR
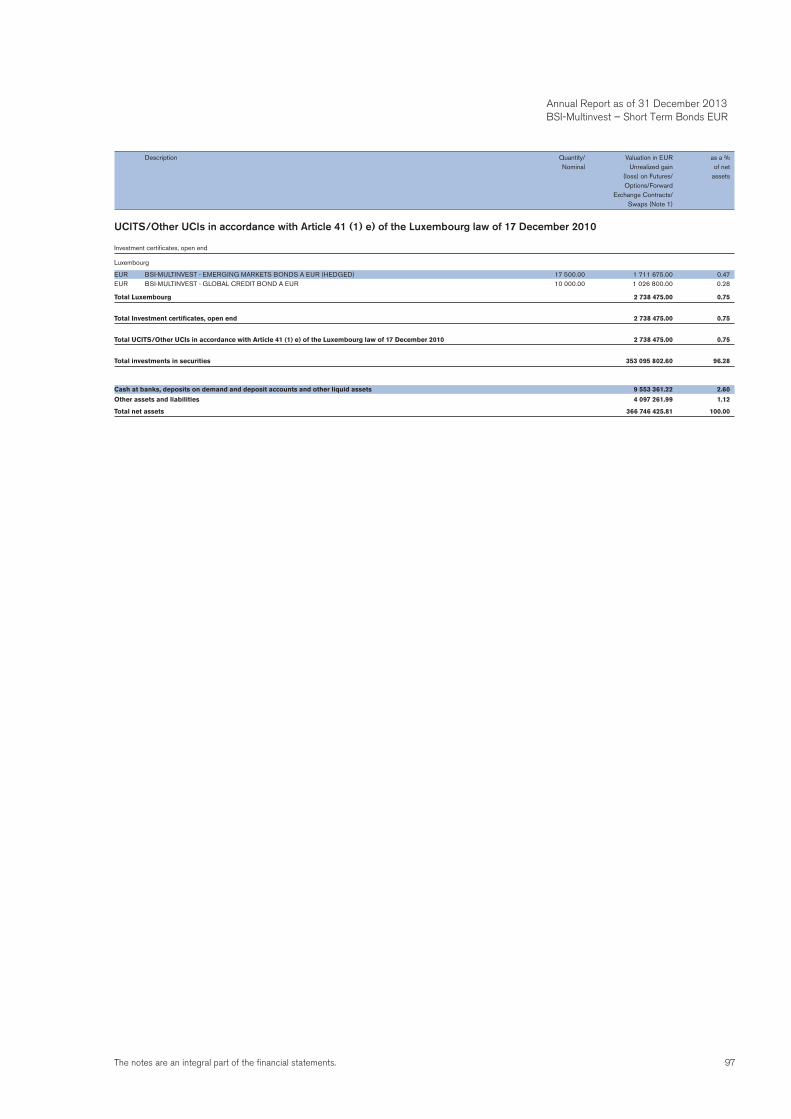
97The notes are an integral part of the financial statements.
UCITS/Other UCIs in accordance with Article 41 (1) e) of the Luxembourg law of 17 December 2010
Investment certificates, open end
Luxembourg
EUR BSI-MULTINVEST - EMERGING MARKETS BONDS A EUR (HEDGED) 17 500.00 1 711 675.00 0.47EUR BSI-MULTINVEST - GLOBAL CREDIT BOND A EUR 10 000.00 1 026 800.00 0.28
Total Luxembourg 2 738 475.00 0.75
Total Investment certificates, open end 2 738 475.00 0.75
Total UCITS/Other UCIs in accordance with Article 41 (1) e) of the Luxembourg law of 17 December 2010 2 738 475.00 0.75
Total investments in securities 353 095 802.60 96.28
Cash at banks, deposits on demand and deposit accounts and other liquid assets 9 553 361.22 2.60
Other assets and liabilities 4 097 261.99 1.12
Total net assets 366 746 425.81 100.00
Description Quantity/ Valuation in EUR as a % Nominal Unrealized gain of net (loss) on Futures/ assets Options/Forward Exchange Contracts/ Swaps (Note 1)
Annual Report as of 31 December 2013 BSI-Multinvest – Short Term Bonds EUR
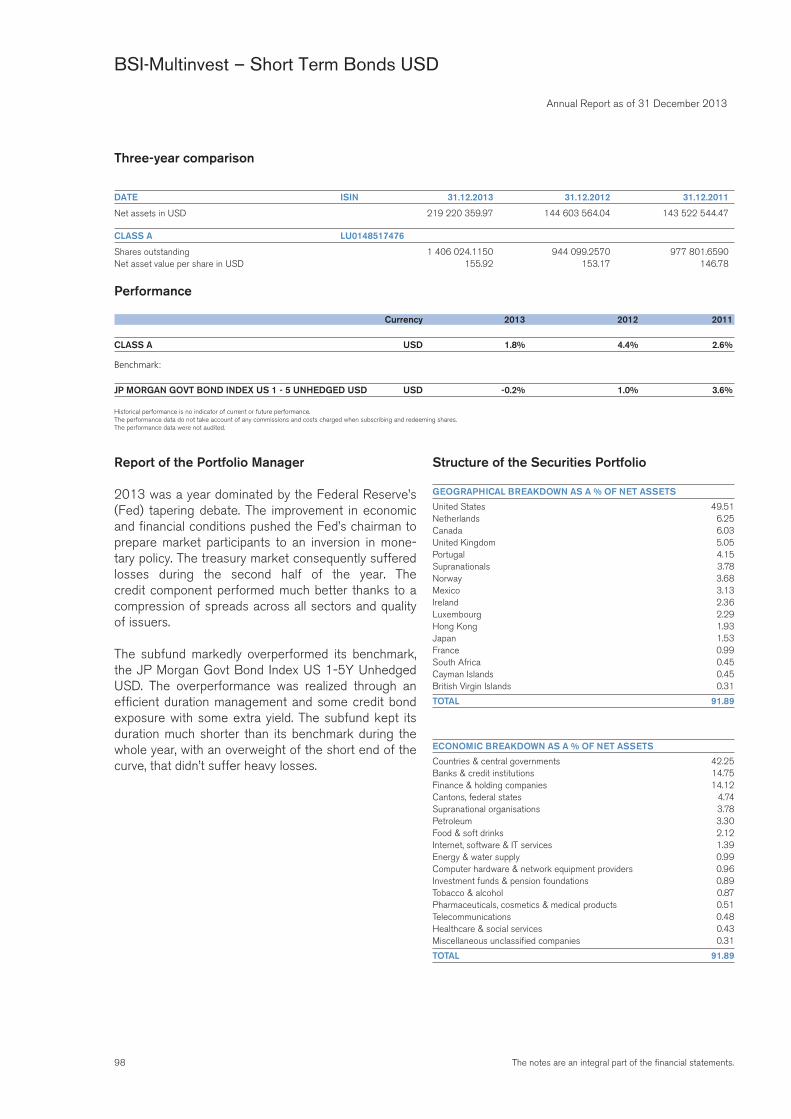
98 The notes are an integral part of the financial statements.
Annual Report as of 31 December 2013
BSI-Multinvest – Short Term Bonds USD
Three-year comparison
DATE ISIN 31.12.2013 31.12.2012 31.12.2011
Net assets in USD 219 220 359.97 144 603 564.04 143 522 544.47
CLASS A LU0148517476
Shares outstanding 1 406 024.1150 944 099.2570 977 801.6590Net asset value per share in USD 155.92 153.17 146.78
Performance
Currency 2013 2012 2011
CLASS A USD 1.8% 4.4% 2.6%
Benchmark:
JP MORGAN GOVT BOND INDEX US 1 - 5 UNHEDGED USD USD -0.2% 1.0% 3.6%
Historical performance is no indicator of current or future performance.The performance data do not take account of any commissions and costs charged when subscribing and redeeming shares.The performance data were not audited.
Report of the Portfolio Manager
2013 was a year dominated by the Federal Reserve’s (Fed) tapering debate. The improvement in economic and financial conditions pushed the Fed’s chairman to prepare market participants to an inversion in mone-tary policy. The treasury market consequently suffered losses during the second half of the year. The credit component performed much better thanks to a compression of spreads across all sectors and quality of issuers.
The subfund markedly overperformed its benchmark, the JP Morgan Govt Bond Index US 1-5Y Unhedged USD. The overperformance was realized through an efficient duration management and some credit bond exposure with some extra yield. The subfund kept its duration much shorter than its benchmark during the whole year, with an overweight of the short end of the curve, that didn’t suffer heavy losses.
Structure of the Securities Portfolio
GEOGRAPHICAL BREAKDOWN AS A % OF NET ASSETS
United States 49.51Netherlands 6.25Canada 6.03United Kingdom 5.05Portugal 4.15Supranationals 3.78Norway 3.68Mexico 3.13Ireland 2.36Luxembourg 2.29Hong Kong 1.93Japan 1.53France 0.99South Africa 0.45Cayman Islands 0.45British Virgin Islands 0.31
TOTAL 91.89
ECONOMIC BREAKDOWN AS A % OF NET ASSETS
Countries & central governments 42.25Banks & credit institutions 14.75Finance & holding companies 14.12Cantons, federal states 4.74Supranational organisations 3.78Petroleum 3.30Food & soft drinks 2.12Internet, software & IT services 1.39Energy & water supply 0.99Computer hardware & network equipment providers 0.96Investment funds & pension foundations 0.89Tobacco & alcohol 0.87Pharmaceuticals, cosmetics & medical products 0.51Telecommunications 0.48Healthcare & social services 0.43Miscellaneous unclassified companies 0.31
TOTAL 91.89
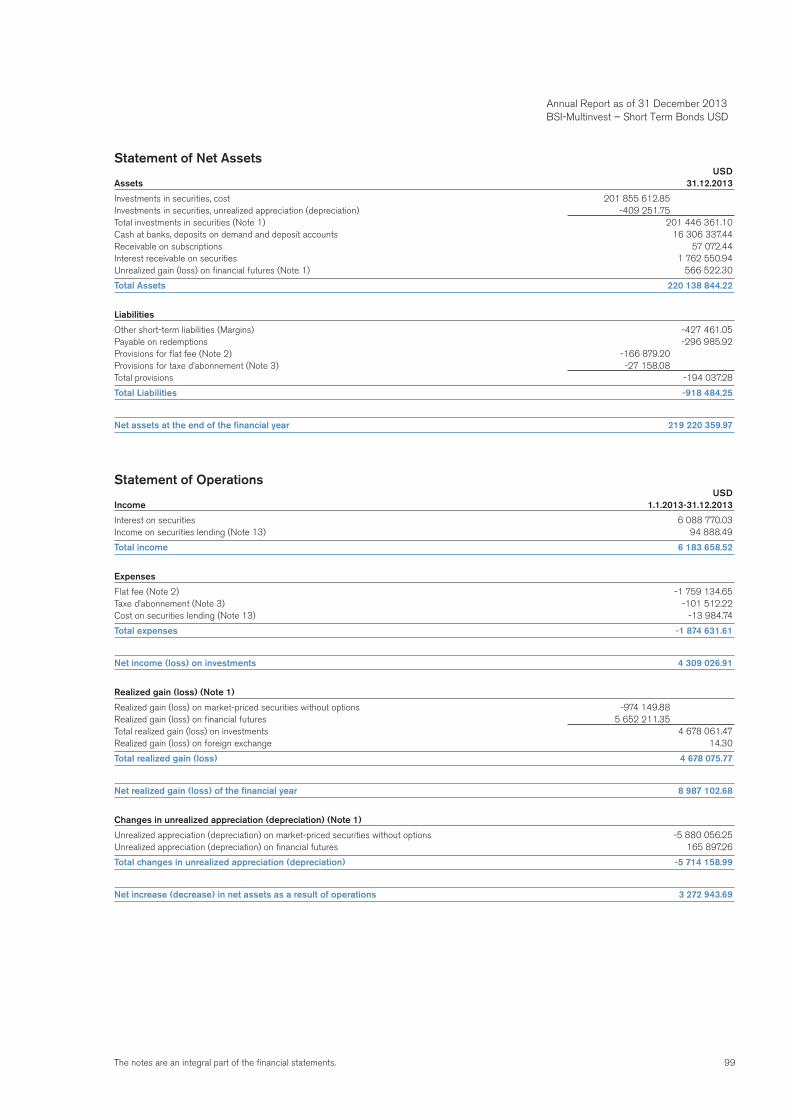
99The notes are an integral part of the financial statements.
Statement of Net Assets USDAssets 31.12.2013
Investments in securities, cost 201 855 612.85Investments in securities, unrealized appreciation (depreciation) -409 251.75Total investments in securities (Note 1) 201 446 361.10Cash at banks, deposits on demand and deposit accounts 16 306 337.44Receivable on subscriptions 57 072.44Interest receivable on securities 1 762 550.94Unrealized gain (loss) on financial futures (Note 1) 566 522.30
Total Assets 220 138 844.22
Liabilities
Other short-term liabilities (Margins) -427 461.05Payable on redemptions -296 985.92Provisions for flat fee (Note 2) -166 879.20Provisions for taxe d’abonnement (Note 3) -27 158.08Total provisions -194 037.28
Total Liabilities -918 484.25
Net assets at the end of the financial year 219 220 359.97
Statement of Operations USDIncome 1.1.2013-31.12.2013
Interest on securities 6 088 770.03Income on securities lending (Note 13) 94 888.49
Total income 6 183 658.52
Expenses
Flat fee (Note 2) -1 759 134.65Taxe d’abonnement (Note 3) -101 512.22Cost on securities lending (Note 13) -13 984.74
Total expenses -1 874 631.61
Net income (loss) on investments 4 309 026.91
Realized gain (loss) (Note 1)
Realized gain (loss) on market-priced securities without options -974 149.88Realized gain (loss) on financial futures 5 652 211.35Total realized gain (loss) on investments 4 678 061.47Realized gain (loss) on foreign exchange 14.30
Total realized gain (loss) 4 678 075.77
Net realized gain (loss) of the financial year 8 987 102.68
Changes in unrealized appreciation (depreciation) (Note 1)
Unrealized appreciation (depreciation) on market-priced securities without options -5 880 056.25Unrealized appreciation (depreciation) on financial futures 165 897.26
Total changes in unrealized appreciation (depreciation) -5 714 158.99
Net increase (decrease) in net assets as a result of operations 3 272 943.69
Annual Report as of 31 December 2013 BSI-Multinvest – Short Term Bonds USD

100 The notes are an integral part of the financial statements.
Statement of Changes in Net Assets USD 1.1.2013-31.12.2013
Net assets at the beginning of the financial year 144 603 564.04Subscriptions 110 379 850.25Redemptions -39 035 998.01Total net subscriptions (redemptions) 71 343 852.24Net income (loss) on investments 4 309 026.91Total realized gain (loss) 4 678 075.77Total changes in unrealized appreciation (depreciation) -5 714 158.99Net increase (decrease) in net assets as a result of operations 3 272 943.69
Net assets at the end of the financial year 219 220 359.97
Changes in the Number of Shares outstanding
1.1.2013-31.12.2013
Class ANumber of shares outstanding at the beginning of the financial year 944 099.2570Number of shares issued 713 858.7130Number of shares redeemed -251 933.8550
Number of shares outstanding at the end of the financial year 1 406 024.1150
Annual Report as of 31 December 2013 BSI-Multinvest – Short Term Bonds USD
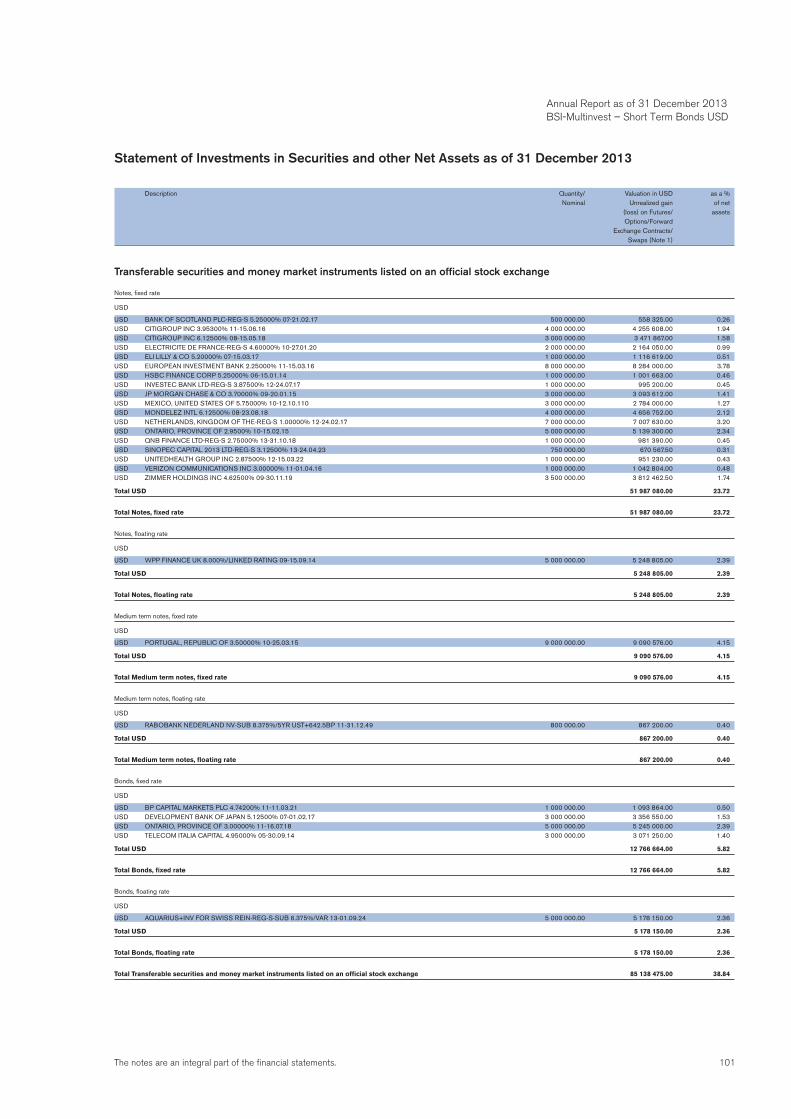
101The notes are an integral part of the financial statements.
Statement of Investments in Securities and other Net Assets as of 31 December 2013
Description Quantity/ Valuation in USD as a % Nominal Unrealized gain of net (loss) on Futures/ assets Options/Forward Exchange Contracts/ Swaps (Note 1)
Transferable securities and money market instruments listed on an official stock exchange
Notes, fixed rate
USD
USD BANK OF SCOTLAND PLC-REG-S 5.25000% 07-21.02.17 500 000.00 558 325.00 0.26USD CITIGROUP INC 3.95300% 11-15.06.16 4 000 000.00 4 255 608.00 1.94USD CITIGROUP INC 6.12500% 08-15.05.18 3 000 000.00 3 471 867.00 1.58USD ELECTRICITE DE FRANCE-REG-S 4.60000% 10-27.01.20 2 000 000.00 2 164 050.00 0.99USD ELI LILLY & CO 5.20000% 07-15.03.17 1 000 000.00 1 116 619.00 0.51USD EUROPEAN INVESTMENT BANK 2.25000% 11-15.03.16 8 000 000.00 8 284 000.00 3.78USD HSBC FINANCE CORP 5.25000% 06-15.01.14 1 000 000.00 1 001 663.00 0.46USD INVESTEC BANK LTD-REG-S 3.87500% 12-24.07.17 1 000 000.00 995 200.00 0.45USD JP MORGAN CHASE & CO 3.70000% 09-20.01.15 3 000 000.00 3 093 612.00 1.41USD MEXICO, UNITED STATES OF 5.75000% 10-12.10.110 3 000 000.00 2 784 000.00 1.27USD MONDELEZ INTL 6.12500% 08-23.08.18 4 000 000.00 4 656 752.00 2.12USD NETHERLANDS, KINGDOM OF THE-REG-S 1.00000% 12-24.02.17 7 000 000.00 7 007 630.00 3.20USD ONTARIO, PROVINCE OF 2.9500% 10-15.02.15 5 000 000.00 5 139 300.00 2.34USD QNB FINANCE LTD-REG-S 2.75000% 13-31.10.18 1 000 000.00 981 390.00 0.45USD SINOPEC CAPITAL 2013 LTD-REG-S 3.12500% 13-24.04.23 750 000.00 670 567.50 0.31USD UNITEDHEALTH GROUP INC 2.87500% 12-15.03.22 1 000 000.00 951 230.00 0.43USD VERIZON COMMUNICATIONS INC 3.00000% 11-01.04.16 1 000 000.00 1 042 804.00 0.48USD ZIMMER HOLDINGS INC 4.62500% 09-30.11.19 3 500 000.00 3 812 462.50 1.74
Total USD 51 987 080.00 23.72
Total Notes, fixed rate 51 987 080.00 23.72
Notes, floating rate
USD
USD WPP FINANCE UK 8.000%/LINKED RATING 09-15.09.14 5 000 000.00 5 248 805.00 2.39
Total USD 5 248 805.00 2.39
Total Notes, floating rate 5 248 805.00 2.39
Medium term notes, fixed rate
USD
USD PORTUGAL, REPUBLIC OF 3.50000% 10-25.03.15 9 000 000.00 9 090 576.00 4.15
Total USD 9 090 576.00 4.15
Total Medium term notes, fixed rate 9 090 576.00 4.15
Medium term notes, floating rate
USD
USD RABOBANK NEDERLAND NV-SUB 8.375%/5YR UST+642.5BP 11-31.12.49 800 000.00 867 200.00 0.40
Total USD 867 200.00 0.40
Total Medium term notes, floating rate 867 200.00 0.40
Bonds, fixed rate
USD
USD BP CAPITAL MARKETS PLC 4.74200% 11-11.03.21 1 000 000.00 1 093 864.00 0.50USD DEVELOPMENT BANK OF JAPAN 5.12500% 07-01.02.17 3 000 000.00 3 356 550.00 1.53USD ONTARIO, PROVINCE OF 3.00000% 11-16.07.18 5 000 000.00 5 245 000.00 2.39USD TELECOM ITALIA CAPITAL 4.95000% 05-30.09.14 3 000 000.00 3 071 250.00 1.40
Total USD 12 766 664.00 5.82
Total Bonds, fixed rate 12 766 664.00 5.82
Bonds, floating rate
USD
USD AQUARIUS+INV FOR SWISS REIN-REG-S-SUB 6.375%/VAR 13-01.09.24 5 000 000.00 5 178 150.00 2.36
Total USD 5 178 150.00 2.36
Total Bonds, floating rate 5 178 150.00 2.36
Total Transferable securities and money market instruments listed on an official stock exchange 85 138 475.00 38.84
Annual Report as of 31 December 2013 BSI-Multinvest – Short Term Bonds USD
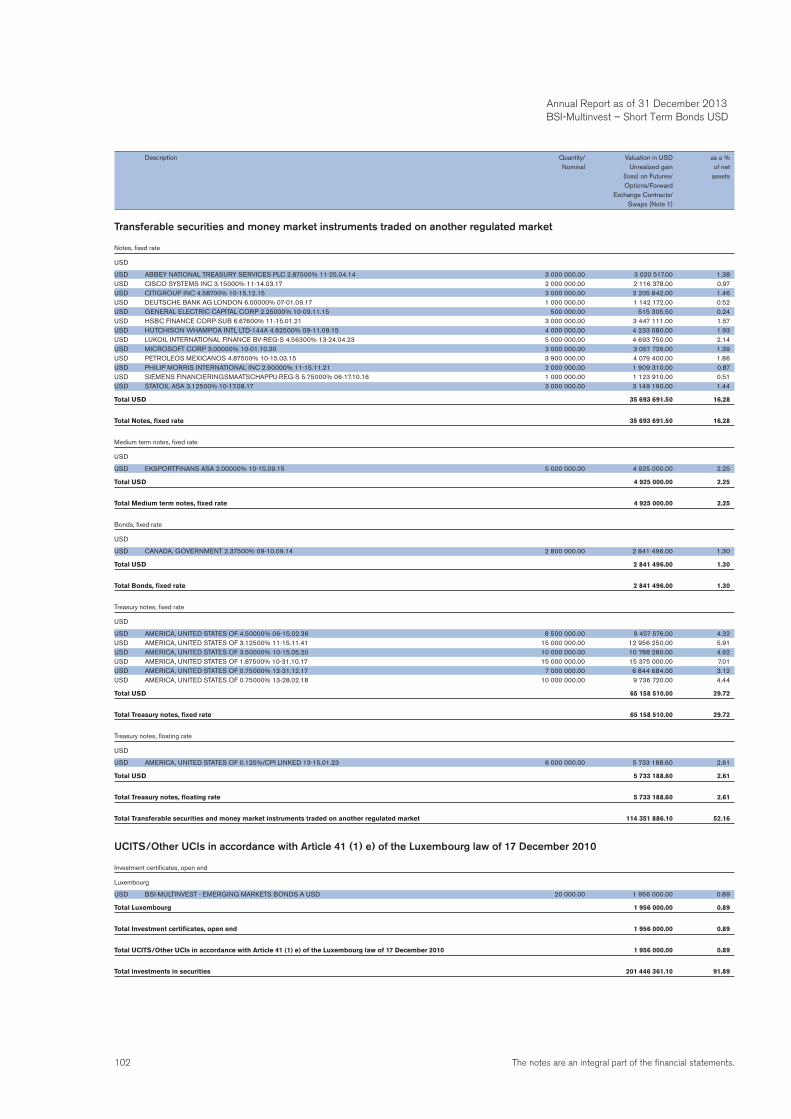
102 The notes are an integral part of the financial statements.
Transferable securities and money market instruments traded on another regulated market
Notes, fixed rate
USD
USD ABBEY NATIONAL TREASURY SERVICES PLC 2.87500% 11-25.04.14 3 000 000.00 3 020 517.00 1.38USD CISCO SYSTEMS INC 3.15000% 11-14.03.17 2 000 000.00 2 116 378.00 0.97USD CITIGROUP INC 4.58700% 10-15.12.15 3 000 000.00 3 205 842.00 1.46USD DEUTSCHE BANK AG LONDON 6.00000% 07-01.09.17 1 000 000.00 1 142 172.00 0.52USD GENERAL ELECTRIC CAPITAL CORP 2.25000% 10-09.11.15 500 000.00 515 305.50 0.24USD HSBC FINANCE CORP-SUB 6.67600% 11-15.01.21 3 000 000.00 3 447 111.00 1.57USD HUTCHISON WHAMPOA INTL LTD-144A 4.62500% 09-11.09.15 4 000 000.00 4 233 080.00 1.93USD LUKOIL INTERNATIONAL FINANCE BV-REG-S 4.56300% 13-24.04.23 5 000 000.00 4 693 750.00 2.14USD MICROSOFT CORP 3.00000% 10-01.10.20 3 000 000.00 3 057 726.00 1.39USD PETROLEOS MEXICANOS 4.87500% 10-15.03.15 3 900 000.00 4 079 400.00 1.86USD PHILIP MORRIS INTERNATIONAL INC 2.90000% 11-15.11.21 2 000 000.00 1 909 310.00 0.87USD SIEMENS FINANCIERINGSMAATSCHAPPIJ-REG-S 5.75000% 06-17.10.16 1 000 000.00 1 123 910.00 0.51USD STATOIL ASA 3.12500% 10-17.08.17 3 000 000.00 3 149 190.00 1.44
Total USD 35 693 691.50 16.28
Total Notes, fixed rate 35 693 691.50 16.28
Medium term notes, fixed rate
USD
USD EKSPORTFINANS ASA 2.00000% 10-15.09.15 5 000 000.00 4 925 000.00 2.25
Total USD 4 925 000.00 2.25
Total Medium term notes, fixed rate 4 925 000.00 2.25
Bonds, fixed rate
USD
USD CANADA, GOVERNMENT 2.37500% 09-10.09.14 2 800 000.00 2 841 496.00 1.30
Total USD 2 841 496.00 1.30
Total Bonds, fixed rate 2 841 496.00 1.30
Treasury notes, fixed rate
USD
USD AMERICA, UNITED STATES OF 4.50000% 06-15.02.36 8 500 000.00 9 457 576.00 4.32USD AMERICA, UNITED STATES OF 3.12500% 11-15.11.41 15 000 000.00 12 956 250.00 5.91USD AMERICA, UNITED STATES OF 3.50000% 10-15.05.20 10 000 000.00 10 788 280.00 4.92USD AMERICA, UNITED STATES OF 1.87500% 10-31.10.17 15 000 000.00 15 375 000.00 7.01USD AMERICA, UNITED STATES OF 0.75000% 12-31.12.17 7 000 000.00 6 844 684.00 3.12USD AMERICA, UNITED STATES OF 0.75000% 13-28.02.18 10 000 000.00 9 736 720.00 4.44
Total USD 65 158 510.00 29.72
Total Treasury notes, fixed rate 65 158 510.00 29.72
Treasury notes, floating rate
USD
USD AMERICA, UNITED STATES OF 0.125%/CPI LINKED 13-15.01.23 6 000 000.00 5 733 188.60 2.61
Total USD 5 733 188.60 2.61
Total Treasury notes, floating rate 5 733 188.60 2.61
Total Transferable securities and money market instruments traded on another regulated market 114 351 886.10 52.16
UCITS/Other UCIs in accordance with Article 41 (1) e) of the Luxembourg law of 17 December 2010
Investment certificates, open end
Luxembourg
USD BSI-MULTINVEST - EMERGING MARKETS BONDS A USD 20 000.00 1 956 000.00 0.89
Total Luxembourg 1 956 000.00 0.89
Total Investment certificates, open end 1 956 000.00 0.89
Total UCITS/Other UCIs in accordance with Article 41 (1) e) of the Luxembourg law of 17 December 2010 1 956 000.00 0.89
Total investments in securities 201 446 361.10 91.89
Description Quantity/ Valuation in USD as a % Nominal Unrealized gain of net (loss) on Futures/ assets Options/Forward Exchange Contracts/ Swaps (Note 1)
Annual Report as of 31 December 2013 BSI-Multinvest – Short Term Bonds USD
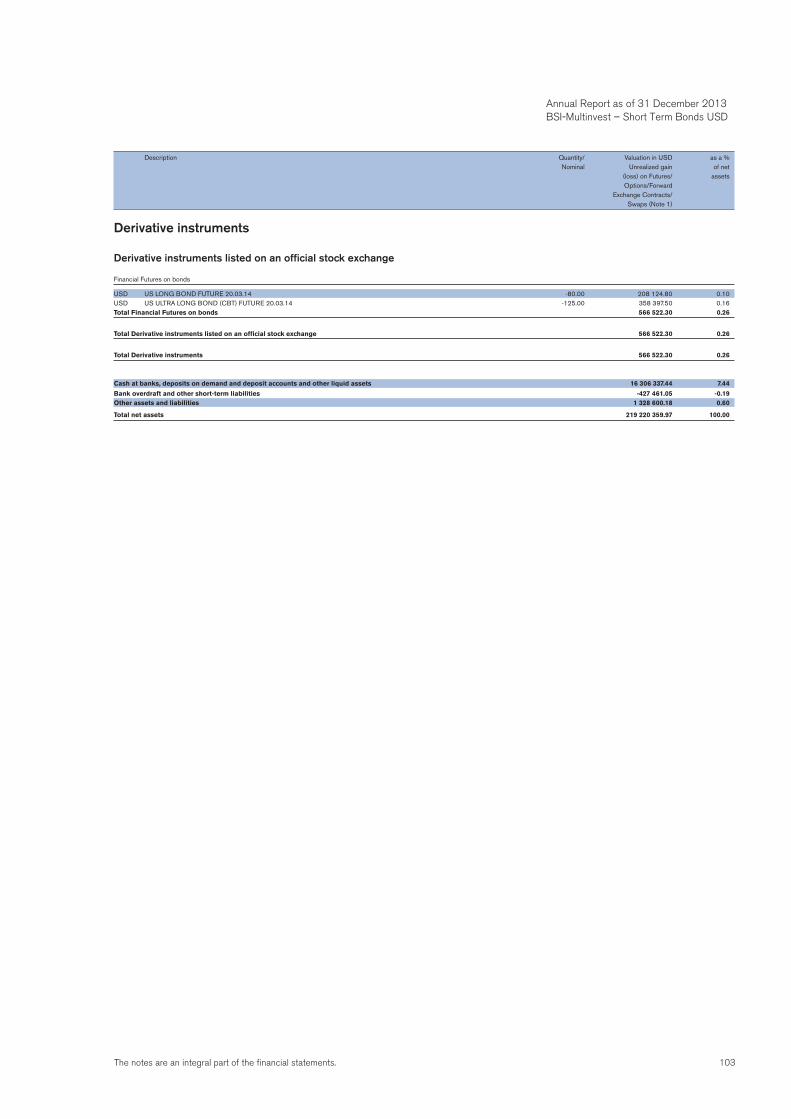
103The notes are an integral part of the financial statements.
Derivative instruments
Derivative instruments listed on an official stock exchange
Financial Futures on bonds
USD US LONG BOND FUTURE 20.03.14 -80.00 208 124.80 0.10USD US ULTRA LONG BOND (CBT) FUTURE 20.03.14 -125.00 358 397.50 0.16Total Financial Futures on bonds 566 522.30 0.26
Total Derivative instruments listed on an official stock exchange 566 522.30 0.26
Total Derivative instruments 566 522.30 0.26
Cash at banks, deposits on demand and deposit accounts and other liquid assets 16 306 337.44 7.44
Bank overdraft and other short-term liabilities -427 461.05 -0.19Other assets and liabilities 1 328 600.18 0.60
Total net assets 219 220 359.97 100.00
Description Quantity/ Valuation in USD as a % Nominal Unrealized gain of net (loss) on Futures/ assets Options/Forward Exchange Contracts/ Swaps (Note 1)
Annual Report as of 31 December 2013 BSI-Multinvest – Short Term Bonds USD
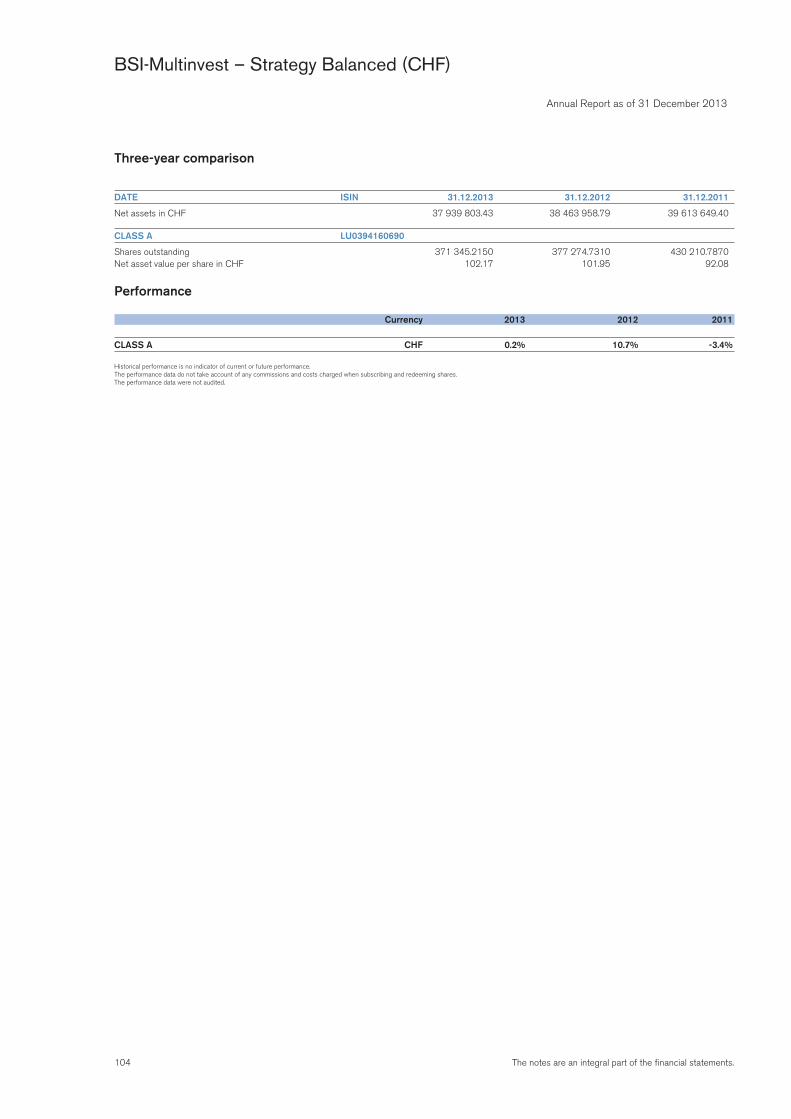
104 The notes are an integral part of the financial statements.
Annual Report as of 31 December 2013
BSI-Multinvest – Strategy Balanced (CHF)
Three-year comparison
DATE ISIN 31.12.2013 31.12.2012 31.12.2011
Net assets in CHF 37 939 803.43 38 463 958.79 39 613 649.40
CLASS A LU0394160690
Shares outstanding 371 345.2150 377 274.7310 430 210.7870Net asset value per share in CHF 102.17 101.95 92.08
Performance
Currency 2013 2012 2011
CLASS A CHF 0.2% 10.7% -3.4%
Historical performance is no indicator of current or future performance.The performance data do not take account of any commissions and costs charged when subscribing and redeeming shares.The performance data were not audited.
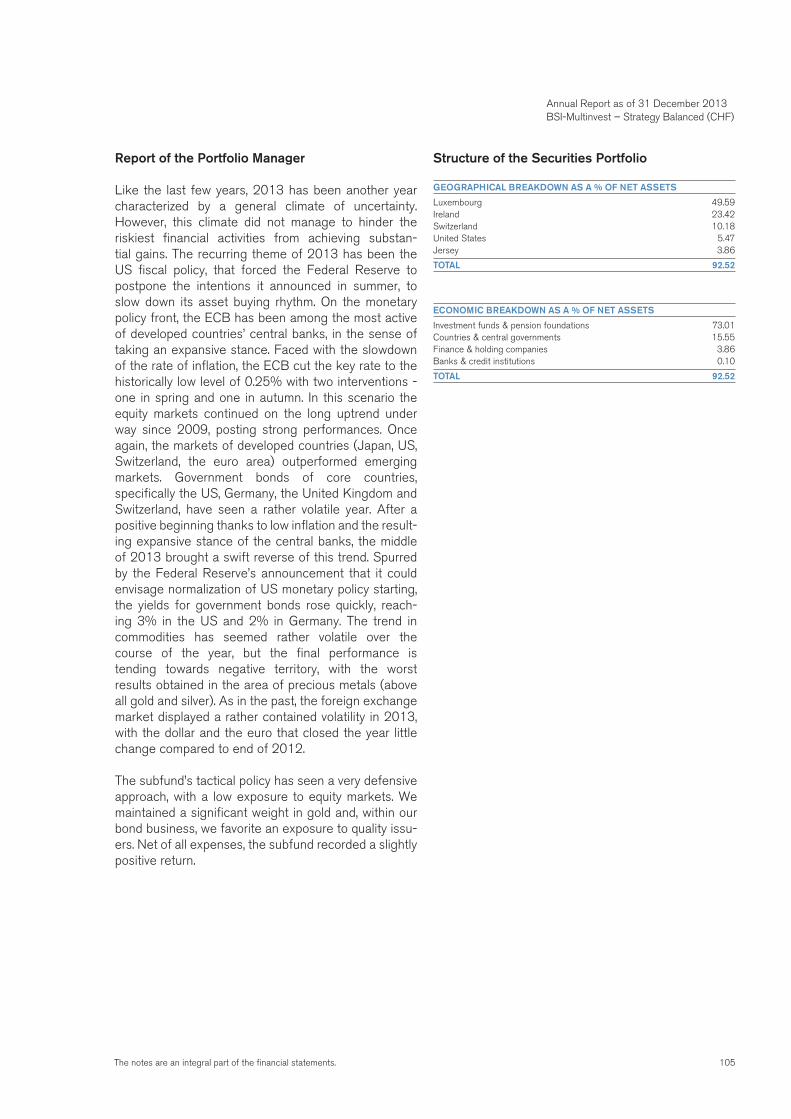
105The notes are an integral part of the financial statements.
Report of the Portfolio Manager
Like the last few years, 2013 has been another year characterized by a general climate of uncertainty. However, this climate did not manage to hinder the riskiest financial activities from achieving substan-tial gains. The recurring theme of 2013 has been the US fiscal policy, that forced the Federal Reserve to postpone the intentions it announced in summer, to slow down its asset buying rhythm. On the monetary policy front, the ECB has been among the most active of developed countries’ central banks, in the sense of taking an expansive stance. Faced with the slowdown of the rate of inflation, the ECB cut the key rate to the historically low level of 0.25% with two interventions - one in spring and one in autumn. In this scenario the equity markets continued on the long uptrend under way since 2009, posting strong performances. Once again, the markets of developed countries (Japan, US, Switzerland, the euro area) outperformed emerging markets. Government bonds of core countries, specifically the US, Germany, the United Kingdom and Switzerland, have seen a rather volatile year. After a positive beginning thanks to low inflation and the result-ing expansive stance of the central banks, the middle of 2013 brought a swift reverse of this trend. Spurred by the Federal Reserve’s announcement that it could envisage normalization of US monetary policy starting, the yields for government bonds rose quickly, reach-ing 3% in the US and 2% in Germany. The trend in commodities has seemed rather volatile over the course of the year, but the final performance is tending towards negative territory, with the worst results obtained in the area of precious metals (above all gold and silver). As in the past, the foreign exchange market displayed a rather contained volatility in 2013, with the dollar and the euro that closed the year little change compared to end of 2012.
The subfund’s tactical policy has seen a very defensive approach, with a low exposure to equity markets. We maintained a significant weight in gold and, within our bond business, we favorite an exposure to quality issu-ers. Net of all expenses, the subfund recorded a slightly positive return.
Structure of the Securities Portfolio
GEOGRAPHICAL BREAKDOWN AS A % OF NET ASSETS
Luxembourg 49.59Ireland 23.42Switzerland 10.18United States 5.47Jersey 3.86
TOTAL 92.52
ECONOMIC BREAKDOWN AS A % OF NET ASSETS
Investment funds & pension foundations 73.01Countries & central governments 15.55Finance & holding companies 3.86Banks & credit institutions 0.10
TOTAL 92.52
Annual Report as of 31 December 2013 BSI-Multinvest – Strategy Balanced (CHF)
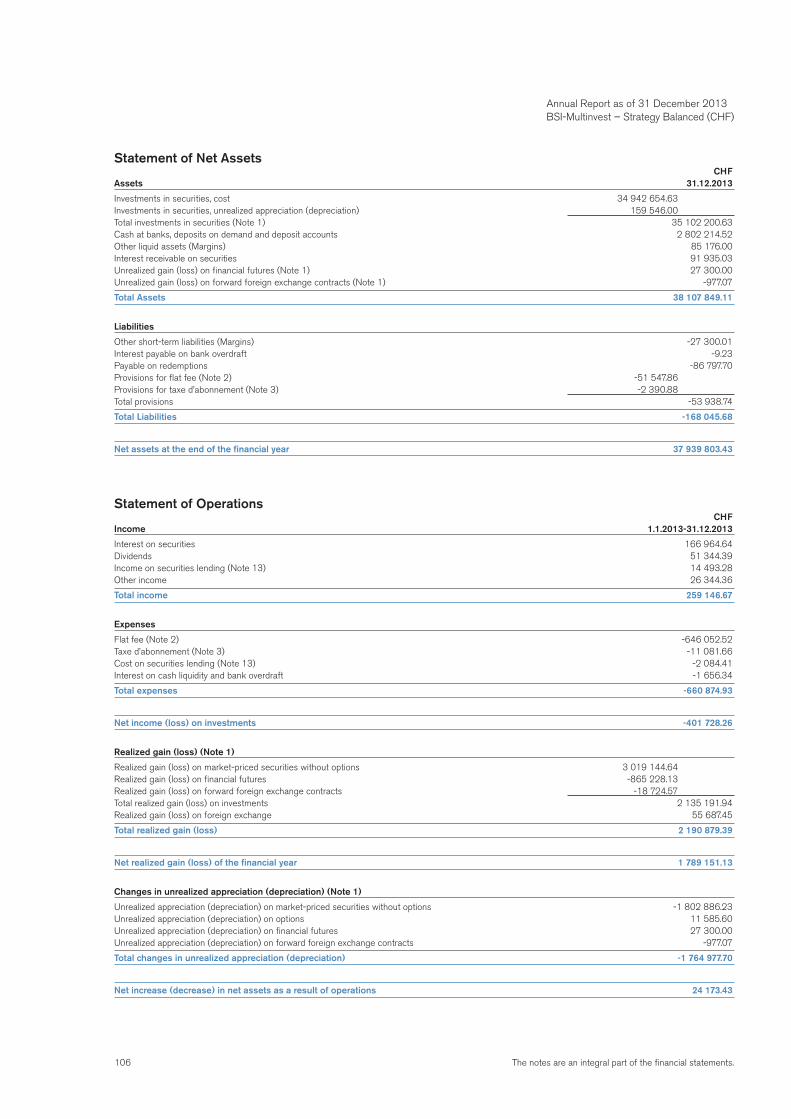
106 The notes are an integral part of the financial statements.
Annual Report as of 31 December 2013 BSI-Multinvest – Strategy Balanced (CHF)
Statement of Net Assets CHFAssets 31.12.2013
Investments in securities, cost 34 942 654.63Investments in securities, unrealized appreciation (depreciation) 159 546.00Total investments in securities (Note 1) 35 102 200.63Cash at banks, deposits on demand and deposit accounts 2 802 214.52Other liquid assets (Margins) 85 176.00Interest receivable on securities 91 935.03Unrealized gain (loss) on financial futures (Note 1) 27 300.00Unrealized gain (loss) on forward foreign exchange contracts (Note 1) -977.07
Total Assets 38 107 849.11
Liabilities
Other short-term liabilities (Margins) -27 300.01Interest payable on bank overdraft -9.23Payable on redemptions -86 797.70Provisions for flat fee (Note 2) -51 547.86Provisions for taxe d’abonnement (Note 3) -2 390.88Total provisions -53 938.74
Total Liabilities -168 045.68
Net assets at the end of the financial year 37 939 803.43
Statement of Operations CHFIncome 1.1.2013-31.12.2013
Interest on securities 166 964.64Dividends 51 344.39Income on securities lending (Note 13) 14 493.28Other income 26 344.36
Total income 259 146.67
Expenses
Flat fee (Note 2) -646 052.52Taxe d’abonnement (Note 3) -11 081.66Cost on securities lending (Note 13) -2 084.41Interest on cash liquidity and bank overdraft -1 656.34
Total expenses -660 874.93
Net income (loss) on investments -401 728.26
Realized gain (loss) (Note 1)
Realized gain (loss) on market-priced securities without options 3 019 144.64Realized gain (loss) on financial futures -865 228.13Realized gain (loss) on forward foreign exchange contracts -18 724.57Total realized gain (loss) on investments 2 135 191.94Realized gain (loss) on foreign exchange 55 687.45
Total realized gain (loss) 2 190 879.39
Net realized gain (loss) of the financial year 1 789 151.13
Changes in unrealized appreciation (depreciation) (Note 1)
Unrealized appreciation (depreciation) on market-priced securities without options -1 802 886.23Unrealized appreciation (depreciation) on options 11 585.60Unrealized appreciation (depreciation) on financial futures 27 300.00Unrealized appreciation (depreciation) on forward foreign exchange contracts -977.07
Total changes in unrealized appreciation (depreciation) -1 764 977.70
Net increase (decrease) in net assets as a result of operations 24 173.43
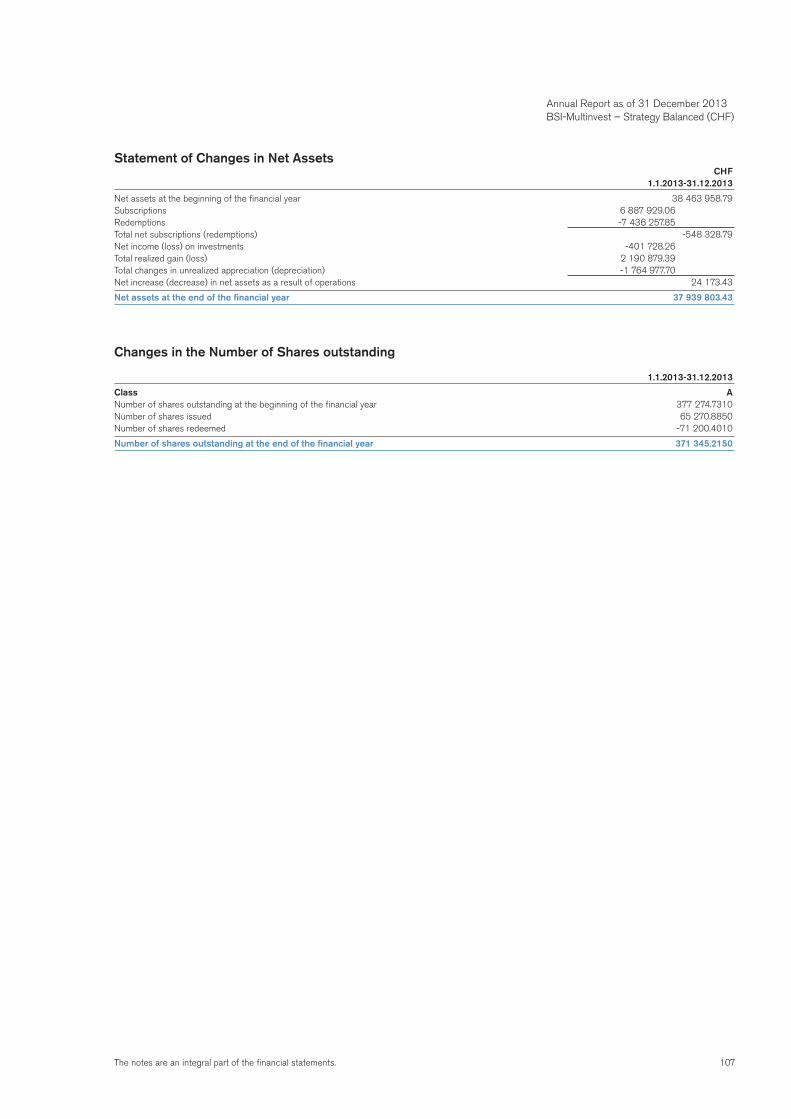
107The notes are an integral part of the financial statements.
Statement of Changes in Net Assets CHF 1.1.2013-31.12.2013
Net assets at the beginning of the financial year 38 463 958.79Subscriptions 6 887 929.06Redemptions -7 436 257.85Total net subscriptions (redemptions) -548 328.79Net income (loss) on investments -401 728.26Total realized gain (loss) 2 190 879.39Total changes in unrealized appreciation (depreciation) -1 764 977.70Net increase (decrease) in net assets as a result of operations 24 173.43
Net assets at the end of the financial year 37 939 803.43
Changes in the Number of Shares outstanding
1.1.2013-31.12.2013
Class ANumber of shares outstanding at the beginning of the financial year 377 274.7310Number of shares issued 65 270.8850Number of shares redeemed -71 200.4010
Number of shares outstanding at the end of the financial year 371 345.2150
Annual Report as of 31 December 2013 BSI-Multinvest – Strategy Balanced (CHF)
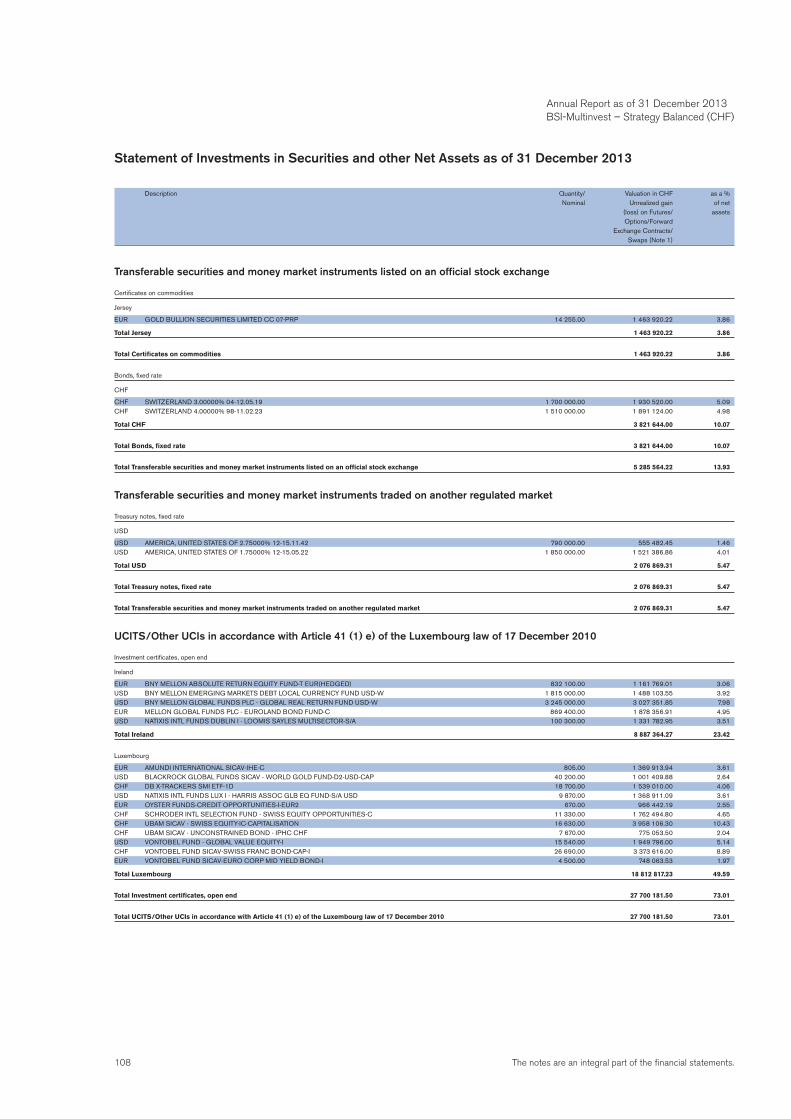
108 The notes are an integral part of the financial statements.
Statement of Investments in Securities and other Net Assets as of 31 December 2013
Description Quantity/ Valuation in CHF as a % Nominal Unrealized gain of net (loss) on Futures/ assets Options/Forward Exchange Contracts/ Swaps (Note 1)
Transferable securities and money market instruments listed on an official stock exchange
Certificates on commodities
Jersey
EUR GOLD BULLION SECURITIES LIMITED CC 07-PRP 14 255.00 1 463 920.22 3.86
Total Jersey 1 463 920.22 3.86
Total Certificates on commodities 1 463 920.22 3.86
Bonds, fixed rate
CHF
CHF SWITZERLAND 3.00000% 04-12.05.19 1 700 000.00 1 930 520.00 5.09CHF SWITZERLAND 4.00000% 98-11.02.23 1 510 000.00 1 891 124.00 4.98
Total CHF 3 821 644.00 10.07
Total Bonds, fixed rate 3 821 644.00 10.07
Total Transferable securities and money market instruments listed on an official stock exchange 5 285 564.22 13.93
Transferable securities and money market instruments traded on another regulated market
Treasury notes, fixed rate
USD
USD AMERICA, UNITED STATES OF 2.75000% 12-15.11.42 790 000.00 555 482.45 1.46USD AMERICA, UNITED STATES OF 1.75000% 12-15.05.22 1 850 000.00 1 521 386.86 4.01
Total USD 2 076 869.31 5.47
Total Treasury notes, fixed rate 2 076 869.31 5.47
Total Transferable securities and money market instruments traded on another regulated market 2 076 869.31 5.47
UCITS/Other UCIs in accordance with Article 41 (1) e) of the Luxembourg law of 17 December 2010
Investment certificates, open end
Ireland
EUR BNY MELLON ABSOLUTE RETURN EQUITY FUND-T EUR(HEDGED) 832 100.00 1 161 769.01 3.06USD BNY MELLON EMERGING MARKETS DEBT LOCAL CURRENCY FUND USD-W 1 815 000.00 1 488 103.55 3.92USD BNY MELLON GLOBAL FUNDS PLC - GLOBAL REAL RETURN FUND USD-W 3 245 000.00 3 027 351.85 7.98EUR MELLON GLOBAL FUNDS PLC - EUROLAND BOND FUND-C 869 400.00 1 878 356.91 4.95USD NATIXIS INTL FUNDS DUBLIN I - LOOMIS SAYLES MULTISECTOR-S/A 100 300.00 1 331 782.95 3.51
Total Ireland 8 887 364.27 23.42
Luxembourg
EUR AMUNDI INTERNATIONAL SICAV-IHE-C 805.00 1 369 913.94 3.61USD BLACKROCK GLOBAL FUNDS SICAV - WORLD GOLD FUND-D2-USD-CAP 40 200.00 1 001 409.88 2.64CHF DB X-TRACKERS SMI ETF-1D 18 700.00 1 539 010.00 4.06USD NATIXIS INTL FUNDS LUX I - HARRIS ASSOC GLB EQ FUND-S/A USD 9 870.00 1 368 911.09 3.61EUR OYSTER FUNDS-CREDIT OPPORTUNITIES-I-EUR2 670.00 966 442.19 2.55CHF SCHRODER INTL SELECTION FUND - SWISS EQUITY OPPORTUNITIES-C 11 330.00 1 762 494.80 4.65CHF UBAM SICAV - SWISS EQUITY-IC-CAPITALISATION 16 630.00 3 958 106.30 10.43CHF UBAM SICAV - UNCONSTRAINED BOND - IPHC CHF 7 670.00 775 053.50 2.04USD VONTOBEL FUND - GLOBAL VALUE EQUITY-I 15 540.00 1 949 796.00 5.14CHF VONTOBEL FUND SICAV-SWISS FRANC BOND-CAP-I 26 690.00 3 373 616.00 8.89EUR VONTOBEL FUND SICAV-EURO CORP MID YIELD BOND-I 4 500.00 748 063.53 1.97
Total Luxembourg 18 812 817.23 49.59
Total Investment certificates, open end 27 700 181.50 73.01
Total UCITS/Other UCIs in accordance with Article 41 (1) e) of the Luxembourg law of 17 December 2010 27 700 181.50 73.01
Annual Report as of 31 December 2013 BSI-Multinvest – Strategy Balanced (CHF)
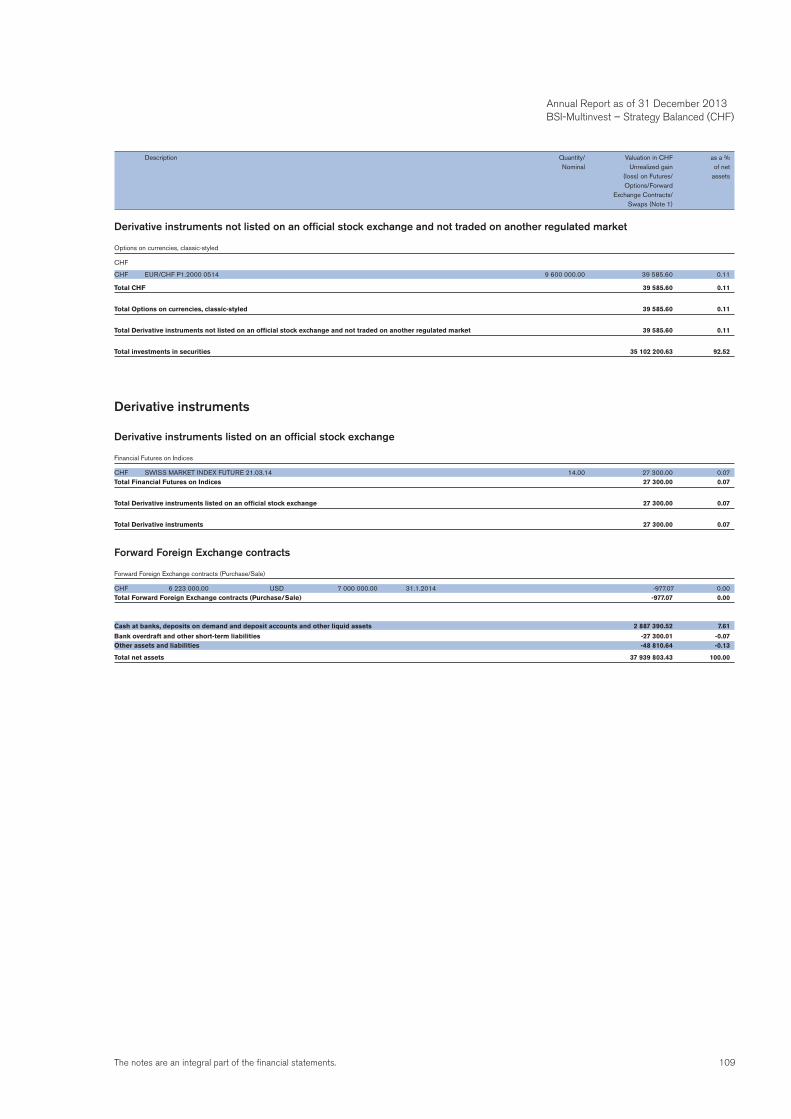
109The notes are an integral part of the financial statements.
Annual Report as of 31 December 2013 BSI-Multinvest – Strategy Balanced (CHF)
Derivative instruments not listed on an official stock exchange and not traded on another regulated market
Options on currencies, classic-styled
CHF
CHF EUR/CHF P1.2000 0514 9 600 000.00 39 585.60 0.11
Total CHF 39 585.60 0.11
Total Options on currencies, classic-styled 39 585.60 0.11
Total Derivative instruments not listed on an official stock exchange and not traded on another regulated market 39 585.60 0.11
Total investments in securities 35 102 200.63 92.52
Derivative instruments
Derivative instruments listed on an official stock exchange
Financial Futures on Indices
CHF SWISS MARKET INDEX FUTURE 21.03.14 14.00 27 300.00 0.07Total Financial Futures on Indices 27 300.00 0.07
Total Derivative instruments listed on an official stock exchange 27 300.00 0.07
Total Derivative instruments 27 300.00 0.07
Forward Foreign Exchange contracts
Forward Foreign Exchange contracts (Purchase/Sale)
CHF 6 223 000.00 USD 7 000 000.00 31.1.2014 -977.07 0.00Total Forward Foreign Exchange contracts (Purchase/Sale) -977.07 0.00
Cash at banks, deposits on demand and deposit accounts and other liquid assets 2 887 390.52 7.61
Bank overdraft and other short-term liabilities -27 300.01 -0.07Other assets and liabilities -48 810.64 -0.13
Total net assets 37 939 803.43 100.00
Description Quantity/ Valuation in CHF as a % Nominal Unrealized gain of net (loss) on Futures/ assets Options/Forward Exchange Contracts/ Swaps (Note 1)
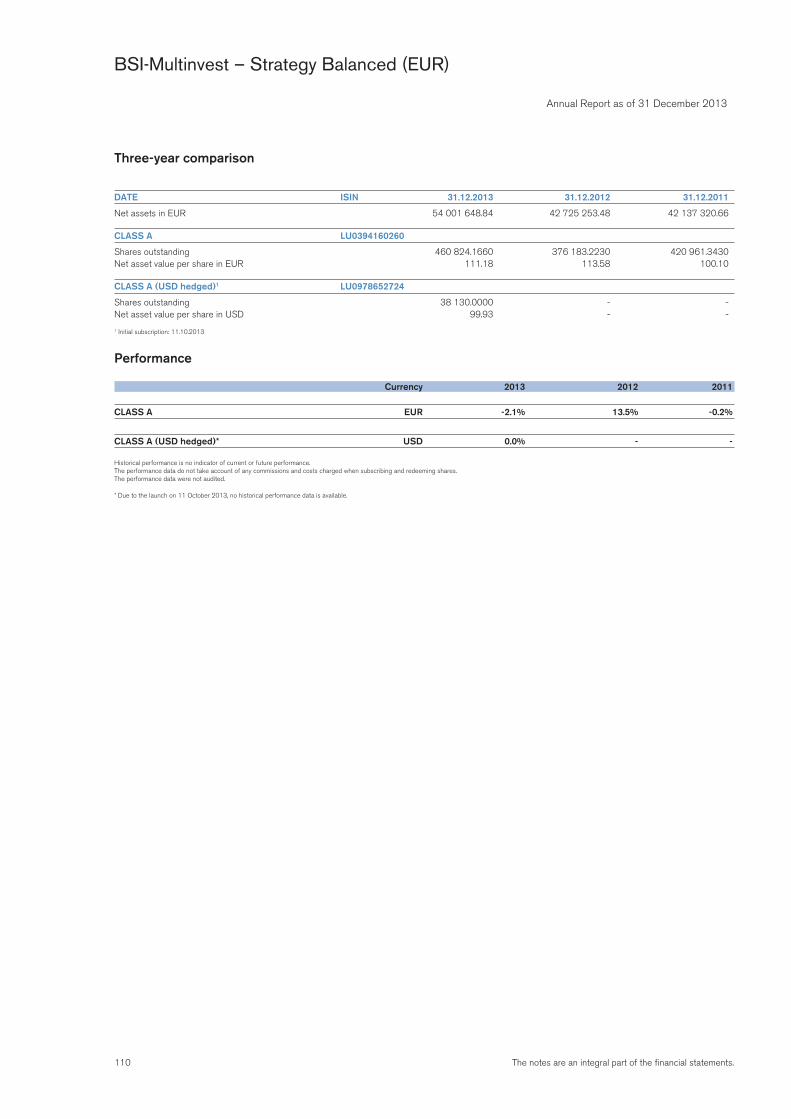
110 The notes are an integral part of the financial statements.
Annual Report as of 31 December 2013
BSI-Multinvest – Strategy Balanced (EUR)
Three-year comparison
DATE ISIN 31.12.2013 31.12.2012 31.12.2011
Net assets in EUR 54 001 648.84 42 725 253.48 42 137 320.66
CLASS A LU0394160260
Shares outstanding 460 824.1660 376 183.2230 420 961.3430Net asset value per share in EUR 111.18 113.58 100.10
CLASS A (USD hedged)1 LU0978652724
Shares outstanding 38 130.0000 - -Net asset value per share in USD 99.93 - -
1 Initial subscription: 11.10.2013
Performance
Currency 2013 2012 2011
CLASS A EUR -2.1% 13.5% -0.2%
CLASS A (USD hedged)* USD 0.0% - -
Historical performance is no indicator of current or future performance.The performance data do not take account of any commissions and costs charged when subscribing and redeeming shares.The performance data were not audited.
* Due to the launch on 11 October 2013, no historical performance data is available.
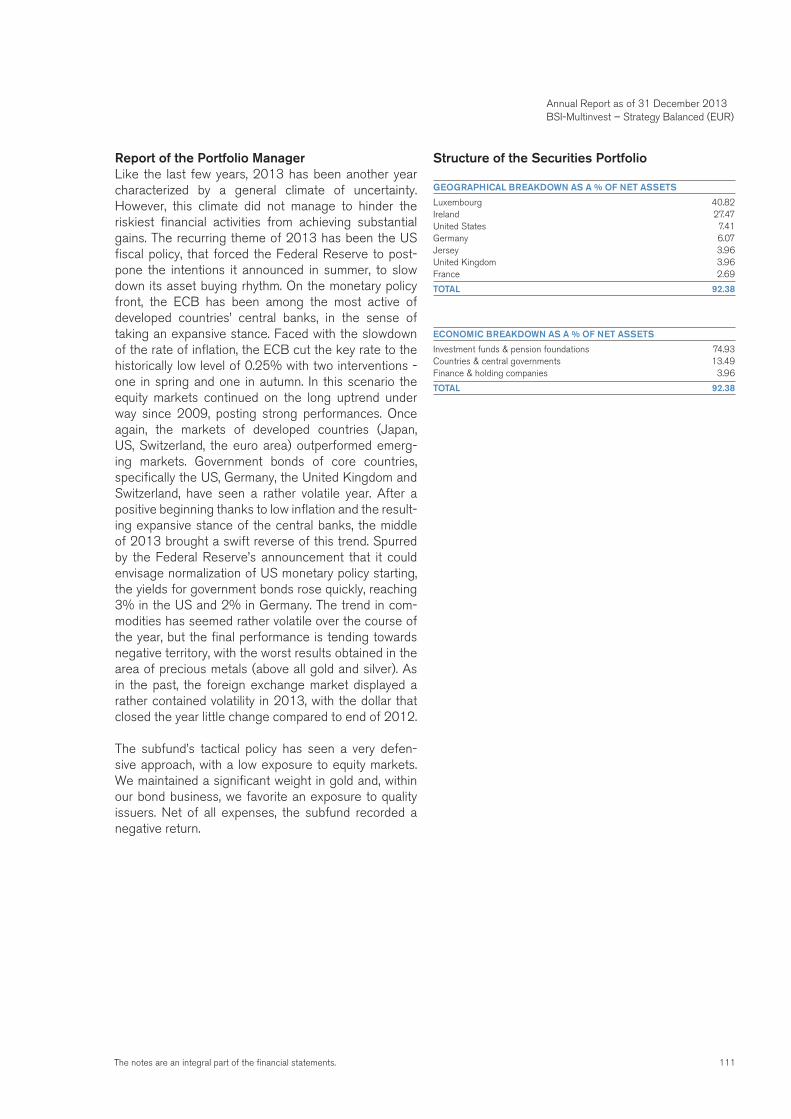
111The notes are an integral part of the financial statements.
Report of the Portfolio ManagerLike the last few years, 2013 has been another year characterized by a general climate of uncertainty. However, this climate did not manage to hinder the riskiest financial activities from achieving substantial gains. The recurring theme of 2013 has been the US fiscal policy, that forced the Federal Reserve to post-pone the intentions it announced in summer, to slow down its asset buying rhythm. On the monetary policy front, the ECB has been among the most active of developed countries’ central banks, in the sense of taking an expansive stance. Faced with the slowdown of the rate of inflation, the ECB cut the key rate to the historically low level of 0.25% with two interventions - one in spring and one in autumn. In this scenario the equity markets continued on the long uptrend under way since 2009, posting strong performances. Once again, the markets of developed countries (Japan, US, Switzerland, the euro area) outperformed emerg-ing markets. Government bonds of core countries, specifically the US, Germany, the United Kingdom and Switzerland, have seen a rather volatile year. After a positive beginning thanks to low inflation and the result-ing expansive stance of the central banks, the middle of 2013 brought a swift reverse of this trend. Spurred by the Federal Reserve’s announcement that it could envisage normalization of US monetary policy starting, the yields for government bonds rose quickly, reaching 3% in the US and 2% in Germany. The trend in com-modities has seemed rather volatile over the course of the year, but the final performance is tending towards negative territory, with the worst results obtained in the area of precious metals (above all gold and silver). As in the past, the foreign exchange market displayed a rather contained volatility in 2013, with the dollar that closed the year little change compared to end of 2012.
The subfund’s tactical policy has seen a very defen-sive approach, with a low exposure to equity markets. We maintained a significant weight in gold and, within our bond business, we favorite an exposure to quality issuers. Net of all expenses, the subfund recorded a negative return.
Structure of the Securities Portfolio
GEOGRAPHICAL BREAKDOWN AS A % OF NET ASSETS
Luxembourg 40.82Ireland 27.47United States 7.41Germany 6.07Jersey 3.96United Kingdom 3.96France 2.69
TOTAL 92.38
ECONOMIC BREAKDOWN AS A % OF NET ASSETS
Investment funds & pension foundations 74.93Countries & central governments 13.49Finance & holding companies 3.96
TOTAL 92.38
Annual Report as of 31 December 2013 BSI-Multinvest – Strategy Balanced (EUR)
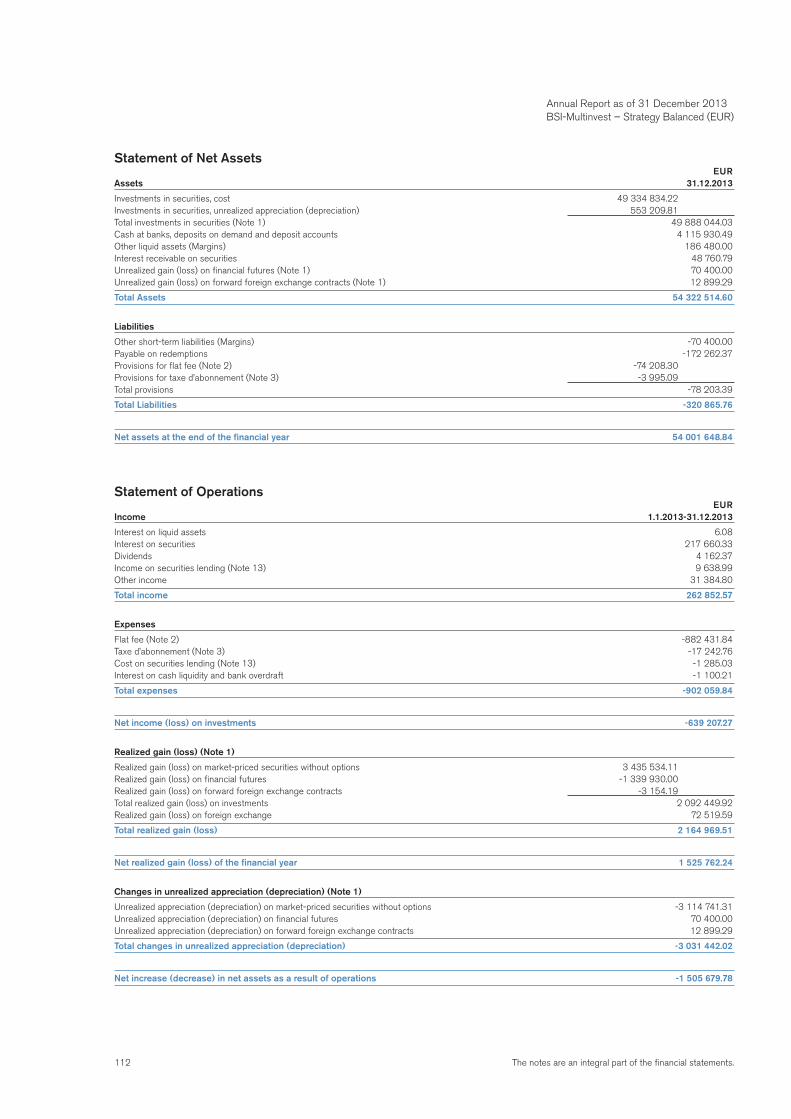
112 The notes are an integral part of the financial statements.
Statement of Net Assets EURAssets 31.12.2013
Investments in securities, cost 49 334 834.22Investments in securities, unrealized appreciation (depreciation) 553 209.81Total investments in securities (Note 1) 49 888 044.03Cash at banks, deposits on demand and deposit accounts 4 115 930.49Other liquid assets (Margins) 186 480.00Interest receivable on securities 48 760.79Unrealized gain (loss) on financial futures (Note 1) 70 400.00Unrealized gain (loss) on forward foreign exchange contracts (Note 1) 12 899.29
Total Assets 54 322 514.60
Liabilities
Other short-term liabilities (Margins) -70 400.00Payable on redemptions -172 262.37Provisions for flat fee (Note 2) -74 208.30Provisions for taxe d’abonnement (Note 3) -3 995.09Total provisions -78 203.39
Total Liabilities -320 865.76
Net assets at the end of the financial year 54 001 648.84
Statement of Operations EURIncome 1.1.2013-31.12.2013
Interest on liquid assets 6.08Interest on securities 217 660.33Dividends 4 162.37Income on securities lending (Note 13) 9 638.99Other income 31 384.80
Total income 262 852.57
Expenses
Flat fee (Note 2) -882 431.84Taxe d’abonnement (Note 3) -17 242.76Cost on securities lending (Note 13) -1 285.03Interest on cash liquidity and bank overdraft -1 100.21
Total expenses -902 059.84
Net income (loss) on investments -639 207.27
Realized gain (loss) (Note 1)
Realized gain (loss) on market-priced securities without options 3 435 534.11Realized gain (loss) on financial futures -1 339 930.00Realized gain (loss) on forward foreign exchange contracts -3 154.19Total realized gain (loss) on investments 2 092 449.92Realized gain (loss) on foreign exchange 72 519.59
Total realized gain (loss) 2 164 969.51
Net realized gain (loss) of the financial year 1 525 762.24
Changes in unrealized appreciation (depreciation) (Note 1)
Unrealized appreciation (depreciation) on market-priced securities without options -3 114 741.31Unrealized appreciation (depreciation) on financial futures 70 400.00Unrealized appreciation (depreciation) on forward foreign exchange contracts 12 899.29
Total changes in unrealized appreciation (depreciation) -3 031 442.02
Net increase (decrease) in net assets as a result of operations -1 505 679.78
Annual Report as of 31 December 2013 BSI-Multinvest – Strategy Balanced (EUR)
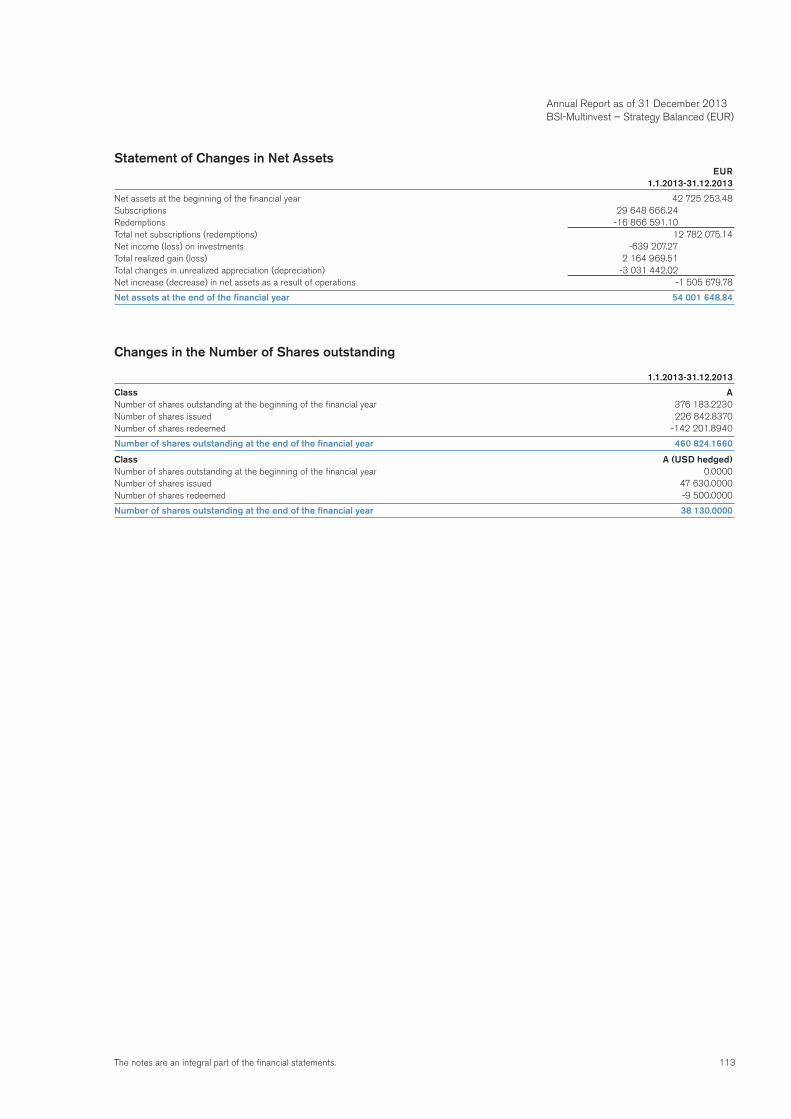
113The notes are an integral part of the financial statements.
Statement of Changes in Net Assets EUR 1.1.2013-31.12.2013
Net assets at the beginning of the financial year 42 725 253.48Subscriptions 29 648 666.24Redemptions -16 866 591.10Total net subscriptions (redemptions) 12 782 075.14Net income (loss) on investments -639 207.27Total realized gain (loss) 2 164 969.51Total changes in unrealized appreciation (depreciation) -3 031 442.02Net increase (decrease) in net assets as a result of operations -1 505 679.78
Net assets at the end of the financial year 54 001 648.84
Changes in the Number of Shares outstanding
1.1.2013-31.12.2013
Class ANumber of shares outstanding at the beginning of the financial year 376 183.2230Number of shares issued 226 842.8370Number of shares redeemed -142 201.8940
Number of shares outstanding at the end of the financial year 460 824.1660
Class A (USD hedged)Number of shares outstanding at the beginning of the financial year 0.0000Number of shares issued 47 630.0000Number of shares redeemed -9 500.0000
Number of shares outstanding at the end of the financial year 38 130.0000
Annual Report as of 31 December 2013 BSI-Multinvest – Strategy Balanced (EUR)
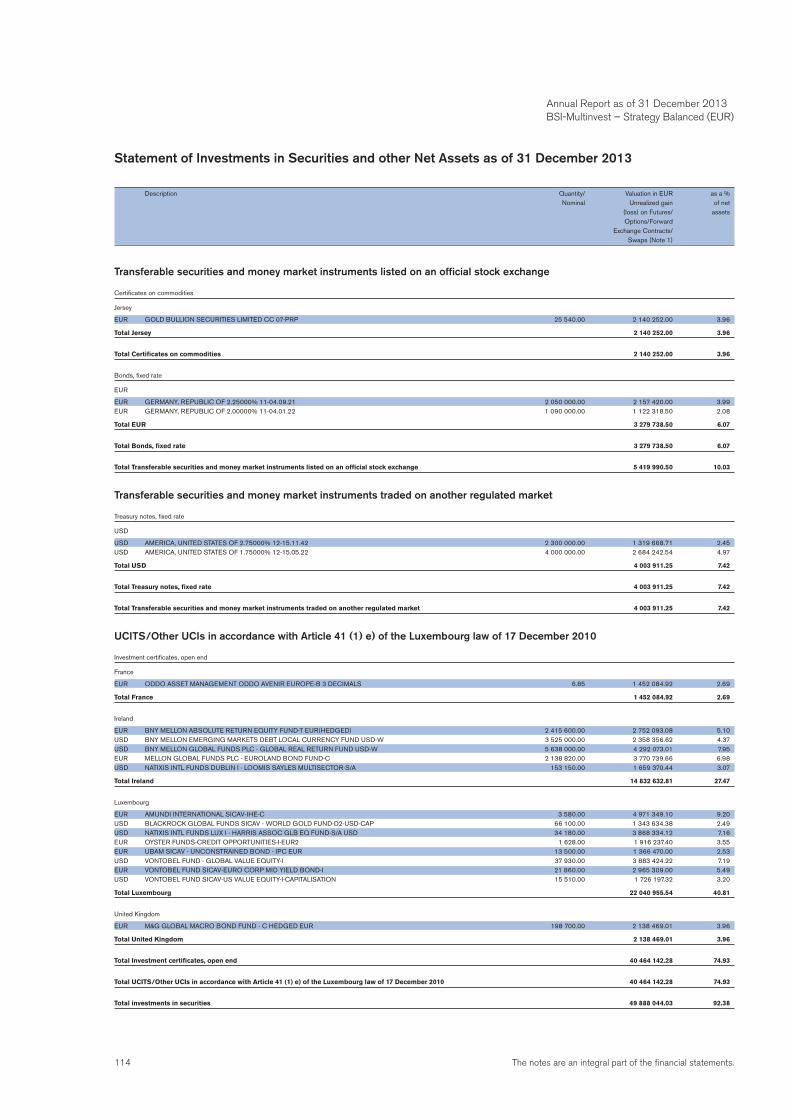
114 The notes are an integral part of the financial statements.
Statement of Investments in Securities and other Net Assets as of 31 December 2013
Description Quantity/ Valuation in EUR as a % Nominal Unrealized gain of net (loss) on Futures/ assets Options/Forward Exchange Contracts/ Swaps (Note 1)
Transferable securities and money market instruments listed on an official stock exchange
Certificates on commodities
Jersey
EUR GOLD BULLION SECURITIES LIMITED CC 07-PRP 25 540.00 2 140 252.00 3.96
Total Jersey 2 140 252.00 3.96
Total Certificates on commodities 2 140 252.00 3.96
Bonds, fixed rate
EUR
EUR GERMANY, REPUBLIC OF 2.25000% 11-04.09.21 2 050 000.00 2 157 420.00 3.99EUR GERMANY, REPUBLIC OF 2.00000% 11-04.01.22 1 090 000.00 1 122 318.50 2.08
Total EUR 3 279 738.50 6.07
Total Bonds, fixed rate 3 279 738.50 6.07
Total Transferable securities and money market instruments listed on an official stock exchange 5 419 990.50 10.03
Transferable securities and money market instruments traded on another regulated market
Treasury notes, fixed rate
USD
USD AMERICA, UNITED STATES OF 2.75000% 12-15.11.42 2 300 000.00 1 319 668.71 2.45USD AMERICA, UNITED STATES OF 1.75000% 12-15.05.22 4 000 000.00 2 684 242.54 4.97
Total USD 4 003 911.25 7.42
Total Treasury notes, fixed rate 4 003 911.25 7.42
Total Transferable securities and money market instruments traded on another regulated market 4 003 911.25 7.42
UCITS/Other UCIs in accordance with Article 41 (1) e) of the Luxembourg law of 17 December 2010
Investment certificates, open end
France
EUR ODDO ASSET MANAGEMENT ODDO AVENIR EUROPE-B 3 DECIMALS 6.85 1 452 084.92 2.69
Total France 1 452 084.92 2.69
Ireland
EUR BNY MELLON ABSOLUTE RETURN EQUITY FUND-T EUR(HEDGED) 2 415 600.00 2 752 093.08 5.10USD BNY MELLON EMERGING MARKETS DEBT LOCAL CURRENCY FUND USD-W 3 525 000.00 2 358 356.62 4.37USD BNY MELLON GLOBAL FUNDS PLC - GLOBAL REAL RETURN FUND USD-W 5 638 000.00 4 292 073.01 7.95EUR MELLON GLOBAL FUNDS PLC - EUROLAND BOND FUND-C 2 138 820.00 3 770 739.66 6.98USD NATIXIS INTL FUNDS DUBLIN I - LOOMIS SAYLES MULTISECTOR-S/A 153 150.00 1 659 370.44 3.07
Total Ireland 14 832 632.81 27.47
Luxembourg
EUR AMUNDI INTERNATIONAL SICAV-IHE-C 3 580.00 4 971 349.10 9.20USD BLACKROCK GLOBAL FUNDS SICAV - WORLD GOLD FUND-D2-USD-CAP 66 100.00 1 343 634.38 2.49USD NATIXIS INTL FUNDS LUX I - HARRIS ASSOC GLB EQ FUND-S/A USD 34 180.00 3 868 334.12 7.16EUR OYSTER FUNDS-CREDIT OPPORTUNITIES-I-EUR2 1 628.00 1 916 237.40 3.55EUR UBAM SICAV - UNCONSTRAINED BOND - IPC EUR 13 500.00 1 366 470.00 2.53USD VONTOBEL FUND - GLOBAL VALUE EQUITY-I 37 930.00 3 883 424.22 7.19EUR VONTOBEL FUND SICAV-EURO CORP MID YIELD BOND-I 21 860.00 2 965 309.00 5.49USD VONTOBEL FUND SICAV-US VALUE EQUITY-I-CAPITALISATION 15 510.00 1 726 197.32 3.20
Total Luxembourg 22 040 955.54 40.81
United Kingdom
EUR M&G GLOBAL MACRO BOND FUND - C HEDGED EUR 198 700.00 2 138 469.01 3.96
Total United Kingdom 2 138 469.01 3.96
Total Investment certificates, open end 40 464 142.28 74.93
Total UCITS/Other UCIs in accordance with Article 41 (1) e) of the Luxembourg law of 17 December 2010 40 464 142.28 74.93
Total investments in securities 49 888 044.03 92.38
Annual Report as of 31 December 2013 BSI-Multinvest – Strategy Balanced (EUR)
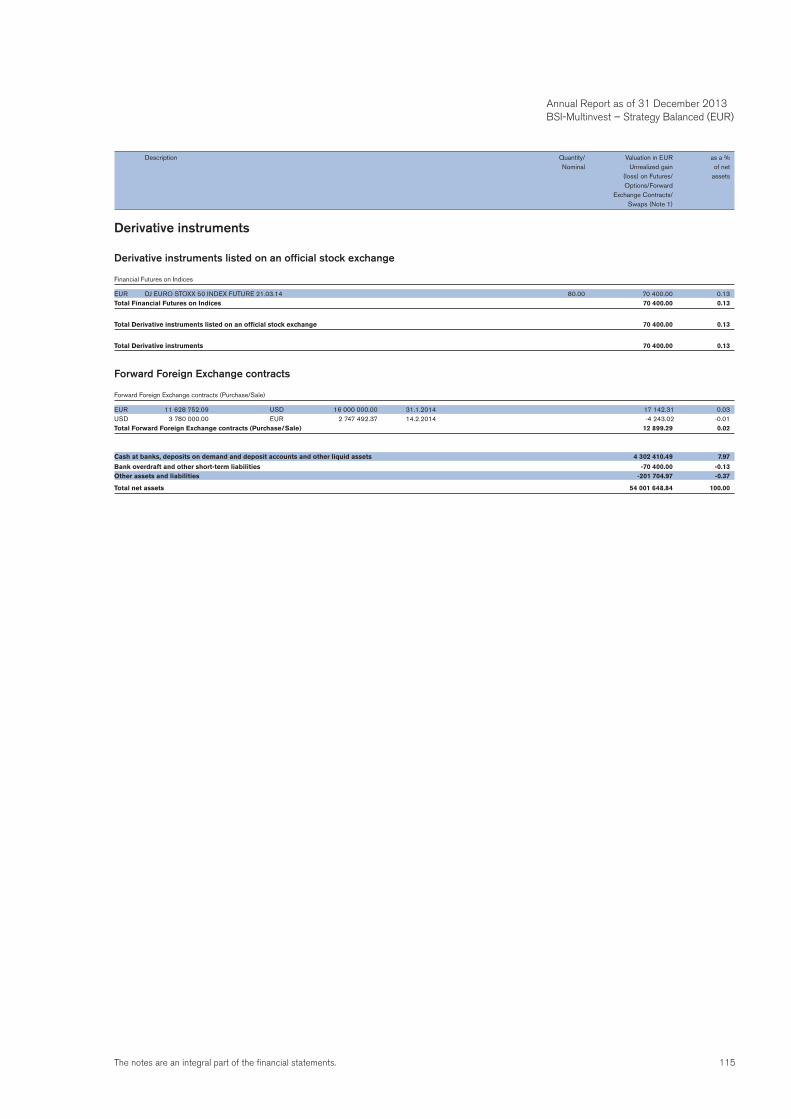
115The notes are an integral part of the financial statements.
Annual Report as of 31 December 2013 BSI-Multinvest – Strategy Balanced (EUR)
Derivative instruments
Derivative instruments listed on an official stock exchange
Financial Futures on Indices
EUR DJ EURO STOXX 50 INDEX FUTURE 21.03.14 80.00 70 400.00 0.13Total Financial Futures on Indices 70 400.00 0.13
Total Derivative instruments listed on an official stock exchange 70 400.00 0.13
Total Derivative instruments 70 400.00 0.13
Forward Foreign Exchange contracts
Forward Foreign Exchange contracts (Purchase/Sale)
EUR 11 628 752.09 USD 16 000 000.00 31.1.2014 17 142.31 0.03USD 3 780 000.00 EUR 2 747 492.37 14.2.2014 -4 243.02 -0.01Total Forward Foreign Exchange contracts (Purchase/Sale) 12 899.29 0.02
Cash at banks, deposits on demand and deposit accounts and other liquid assets 4 302 410.49 7.97
Bank overdraft and other short-term liabilities -70 400.00 -0.13Other assets and liabilities -201 704.97 -0.37
Total net assets 54 001 648.84 100.00
Description Quantity/ Valuation in EUR as a % Nominal Unrealized gain of net (loss) on Futures/ assets Options/Forward Exchange Contracts/ Swaps (Note 1)
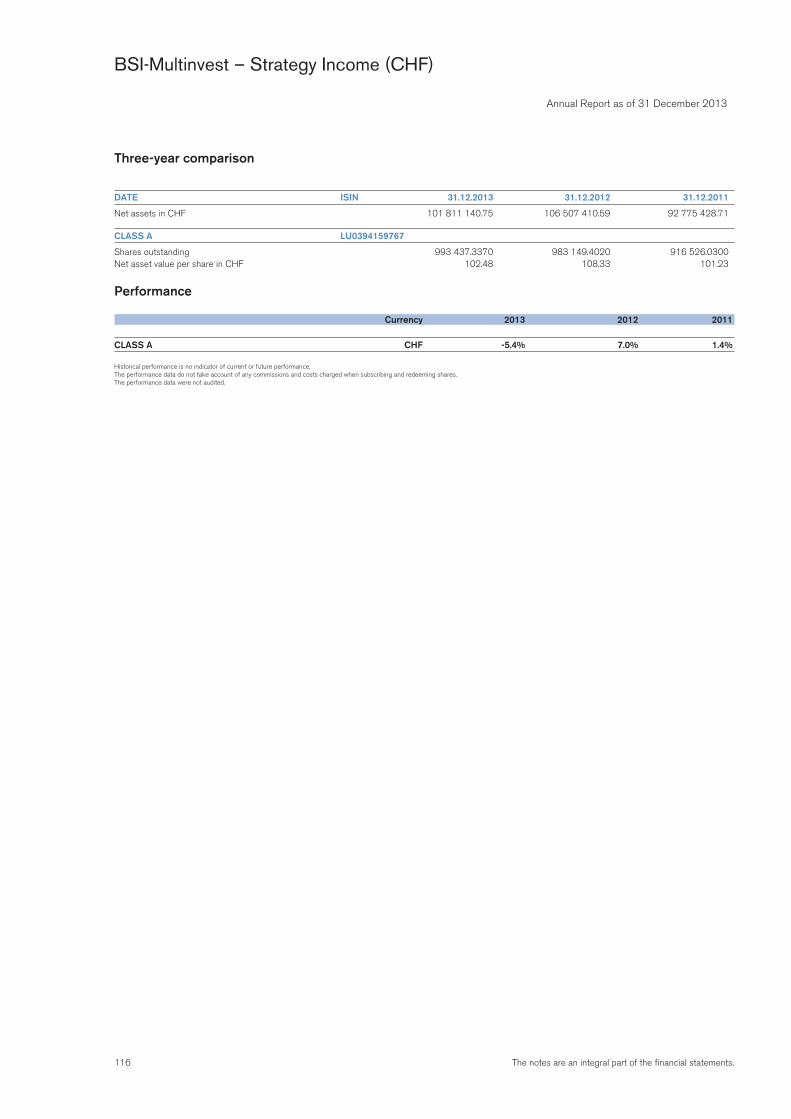
116 The notes are an integral part of the financial statements.
Annual Report as of 31 December 2013
BSI-Multinvest – Strategy Income (CHF)
Three-year comparison
DATE ISIN 31.12.2013 31.12.2012 31.12.2011
Net assets in CHF 101 811 140.75 106 507 410.59 92 775 428.71
CLASS A LU0394159767
Shares outstanding 993 437.3370 983 149.4020 916 526.0300Net asset value per share in CHF 102.48 108.33 101.23
Performance
Currency 2013 2012 2011
CLASS A CHF -5.4% 7.0% 1.4%
Historical performance is no indicator of current or future performance.The performance data do not take account of any commissions and costs charged when subscribing and redeeming shares.The performance data were not audited.
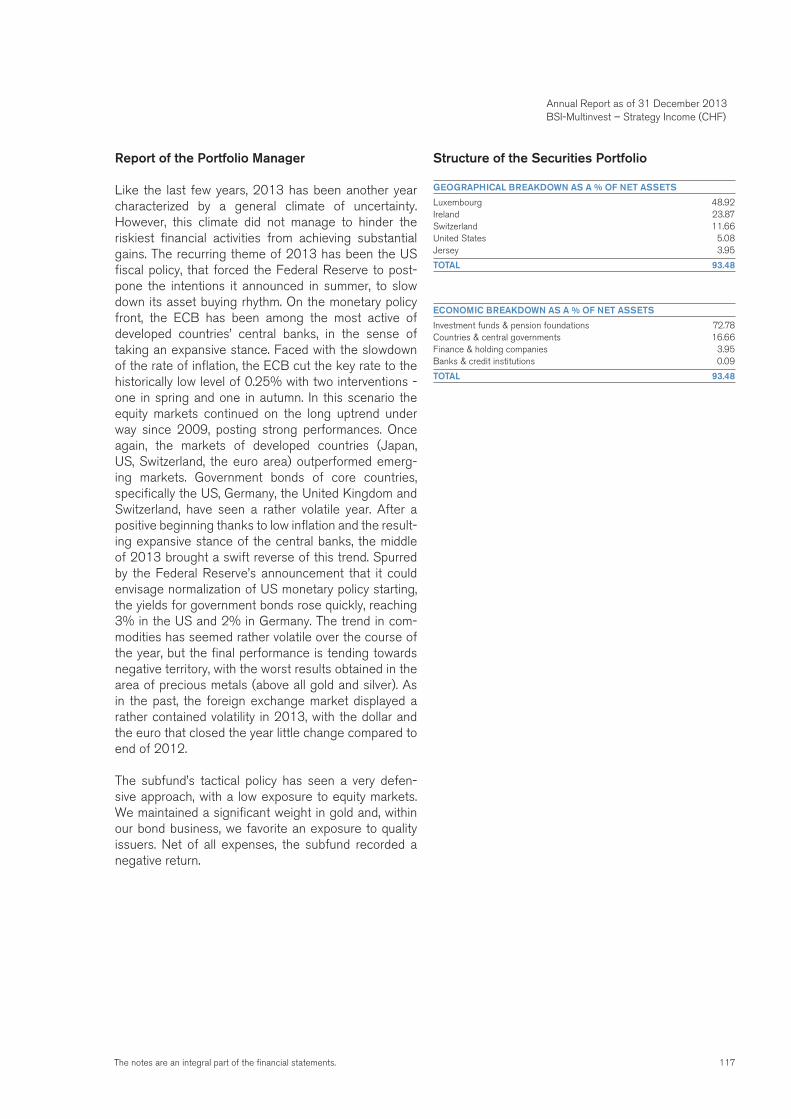
117The notes are an integral part of the financial statements.
Report of the Portfolio Manager
Like the last few years, 2013 has been another year characterized by a general climate of uncertainty. However, this climate did not manage to hinder the riskiest financial activities from achieving substantial gains. The recurring theme of 2013 has been the US fiscal policy, that forced the Federal Reserve to post-pone the intentions it announced in summer, to slow down its asset buying rhythm. On the monetary policy front, the ECB has been among the most active of developed countries’ central banks, in the sense of taking an expansive stance. Faced with the slowdown of the rate of inflation, the ECB cut the key rate to the historically low level of 0.25% with two interventions - one in spring and one in autumn. In this scenario the equity markets continued on the long uptrend under way since 2009, posting strong performances. Once again, the markets of developed countries (Japan, US, Switzerland, the euro area) outperformed emerg-ing markets. Government bonds of core countries, specifically the US, Germany, the United Kingdom and Switzerland, have seen a rather volatile year. After a positive beginning thanks to low inflation and the result-ing expansive stance of the central banks, the middle of 2013 brought a swift reverse of this trend. Spurred by the Federal Reserve’s announcement that it could envisage normalization of US monetary policy starting, the yields for government bonds rose quickly, reaching 3% in the US and 2% in Germany. The trend in com-modities has seemed rather volatile over the course of the year, but the final performance is tending towards negative territory, with the worst results obtained in the area of precious metals (above all gold and silver). As in the past, the foreign exchange market displayed a rather contained volatility in 2013, with the dollar and the euro that closed the year little change compared to end of 2012.
The subfund’s tactical policy has seen a very defen-sive approach, with a low exposure to equity markets. We maintained a significant weight in gold and, within our bond business, we favorite an exposure to quality issuers. Net of all expenses, the subfund recorded a negative return.
Structure of the Securities Portfolio
GEOGRAPHICAL BREAKDOWN AS A % OF NET ASSETS
Luxembourg 48.92Ireland 23.87Switzerland 11.66United States 5.08Jersey 3.95
TOTAL 93.48
ECONOMIC BREAKDOWN AS A % OF NET ASSETS
Investment funds & pension foundations 72.78Countries & central governments 16.66Finance & holding companies 3.95Banks & credit institutions 0.09
TOTAL 93.48
Annual Report as of 31 December 2013 BSI-Multinvest – Strategy Income (CHF)
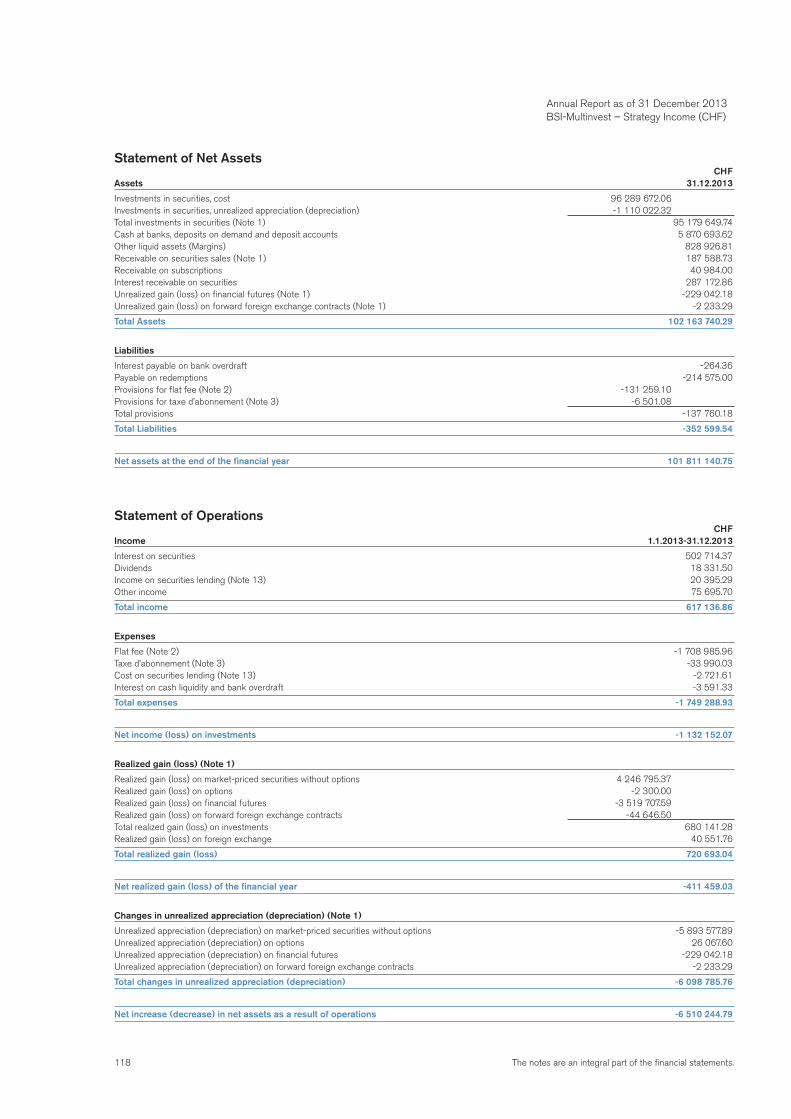
118 The notes are an integral part of the financial statements.
Annual Report as of 31 December 2013 BSI-Multinvest – Strategy Income (CHF)
Statement of Net Assets CHFAssets 31.12.2013
Investments in securities, cost 96 289 672.06Investments in securities, unrealized appreciation (depreciation) -1 110 022.32Total investments in securities (Note 1) 95 179 649.74Cash at banks, deposits on demand and deposit accounts 5 870 693.62Other liquid assets (Margins) 828 926.81Receivable on securities sales (Note 1) 187 588.73Receivable on subscriptions 40 984.00Interest receivable on securities 287 172.86Unrealized gain (loss) on financial futures (Note 1) -229 042.18Unrealized gain (loss) on forward foreign exchange contracts (Note 1) -2 233.29
Total Assets 102 163 740.29
Liabilities
Interest payable on bank overdraft -264.36Payable on redemptions -214 575.00Provisions for flat fee (Note 2) -131 259.10Provisions for taxe d’abonnement (Note 3) -6 501.08Total provisions -137 760.18
Total Liabilities -352 599.54
Net assets at the end of the financial year 101 811 140.75
Statement of Operations CHFIncome 1.1.2013-31.12.2013
Interest on securities 502 714.37Dividends 18 331.50Income on securities lending (Note 13) 20 395.29Other income 75 695.70
Total income 617 136.86
Expenses
Flat fee (Note 2) -1 708 985.96Taxe d’abonnement (Note 3) -33 990.03Cost on securities lending (Note 13) -2 721.61Interest on cash liquidity and bank overdraft -3 591.33
Total expenses -1 749 288.93
Net income (loss) on investments -1 132 152.07
Realized gain (loss) (Note 1)
Realized gain (loss) on market-priced securities without options 4 246 795.37Realized gain (loss) on options -2 300.00Realized gain (loss) on financial futures -3 519 707.59Realized gain (loss) on forward foreign exchange contracts -44 646.50Total realized gain (loss) on investments 680 141.28Realized gain (loss) on foreign exchange 40 551.76
Total realized gain (loss) 720 693.04
Net realized gain (loss) of the financial year -411 459.03
Changes in unrealized appreciation (depreciation) (Note 1)
Unrealized appreciation (depreciation) on market-priced securities without options -5 893 577.89Unrealized appreciation (depreciation) on options 26 067.60Unrealized appreciation (depreciation) on financial futures -229 042.18Unrealized appreciation (depreciation) on forward foreign exchange contracts -2 233.29
Total changes in unrealized appreciation (depreciation) -6 098 785.76
Net increase (decrease) in net assets as a result of operations -6 510 244.79
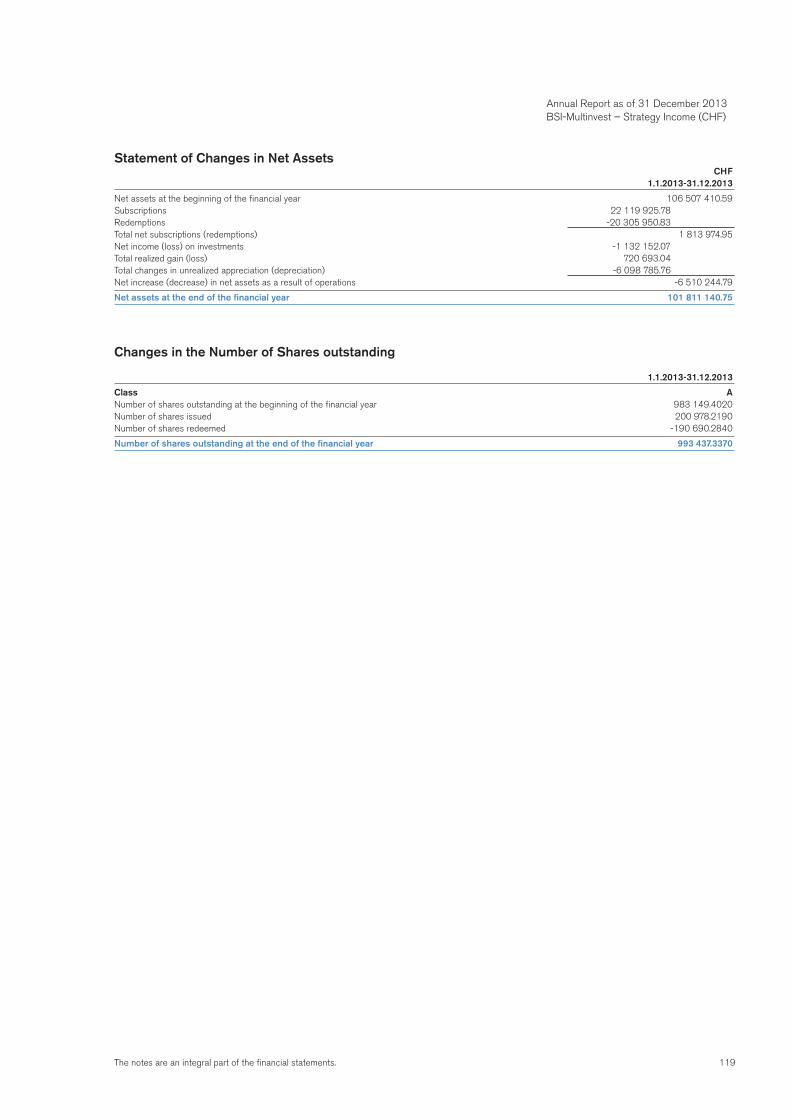
119The notes are an integral part of the financial statements.
Statement of Changes in Net Assets CHF 1.1.2013-31.12.2013
Net assets at the beginning of the financial year 106 507 410.59Subscriptions 22 119 925.78Redemptions -20 305 950.83Total net subscriptions (redemptions) 1 813 974.95Net income (loss) on investments -1 132 152.07Total realized gain (loss) 720 693.04Total changes in unrealized appreciation (depreciation) -6 098 785.76Net increase (decrease) in net assets as a result of operations -6 510 244.79
Net assets at the end of the financial year 101 811 140.75
Changes in the Number of Shares outstanding
1.1.2013-31.12.2013
Class ANumber of shares outstanding at the beginning of the financial year 983 149.4020Number of shares issued 200 978.2190Number of shares redeemed -190 690.2840
Number of shares outstanding at the end of the financial year 993 437.3370
Annual Report as of 31 December 2013 BSI-Multinvest – Strategy Income (CHF)
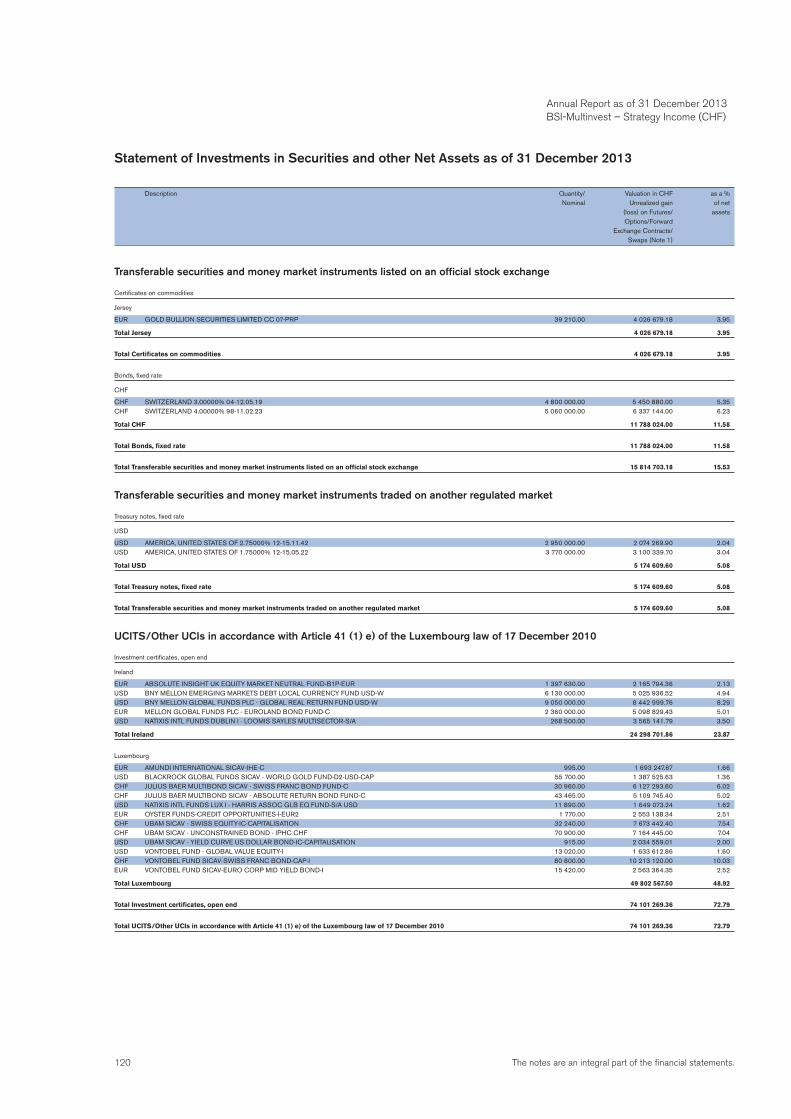
120 The notes are an integral part of the financial statements.
Statement of Investments in Securities and other Net Assets as of 31 December 2013
Description Quantity/ Valuation in CHF as a % Nominal Unrealized gain of net (loss) on Futures/ assets Options/Forward Exchange Contracts/ Swaps (Note 1)
Transferable securities and money market instruments listed on an official stock exchange
Certificates on commodities
Jersey
EUR GOLD BULLION SECURITIES LIMITED CC 07-PRP 39 210.00 4 026 679.18 3.95
Total Jersey 4 026 679.18 3.95
Total Certificates on commodities 4 026 679.18 3.95
Bonds, fixed rate
CHF
CHF SWITZERLAND 3.00000% 04-12.05.19 4 800 000.00 5 450 880.00 5.35CHF SWITZERLAND 4.00000% 98-11.02.23 5 060 000.00 6 337 144.00 6.23
Total CHF 11 788 024.00 11.58
Total Bonds, fixed rate 11 788 024.00 11.58
Total Transferable securities and money market instruments listed on an official stock exchange 15 814 703.18 15.53
Transferable securities and money market instruments traded on another regulated market
Treasury notes, fixed rate
USD
USD AMERICA, UNITED STATES OF 2.75000% 12-15.11.42 2 950 000.00 2 074 269.90 2.04USD AMERICA, UNITED STATES OF 1.75000% 12-15.05.22 3 770 000.00 3 100 339.70 3.04
Total USD 5 174 609.60 5.08
Total Treasury notes, fixed rate 5 174 609.60 5.08
Total Transferable securities and money market instruments traded on another regulated market 5 174 609.60 5.08
UCITS/Other UCIs in accordance with Article 41 (1) e) of the Luxembourg law of 17 December 2010
Investment certificates, open end
Ireland
EUR ABSOLUTE INSIGHT UK EQUITY MARKET NEUTRAL FUND-B1P-EUR 1 397 630.00 2 165 794.36 2.13USD BNY MELLON EMERGING MARKETS DEBT LOCAL CURRENCY FUND USD-W 6 130 000.00 5 025 936.52 4.94USD BNY MELLON GLOBAL FUNDS PLC - GLOBAL REAL RETURN FUND USD-W 9 050 000.00 8 442 999.76 8.29EUR MELLON GLOBAL FUNDS PLC - EUROLAND BOND FUND-C 2 360 000.00 5 098 829.43 5.01USD NATIXIS INTL FUNDS DUBLIN I - LOOMIS SAYLES MULTISECTOR-S/A 268 500.00 3 565 141.79 3.50
Total Ireland 24 298 701.86 23.87
Luxembourg
EUR AMUNDI INTERNATIONAL SICAV-IHE-C 995.00 1 693 247.67 1.66USD BLACKROCK GLOBAL FUNDS SICAV - WORLD GOLD FUND-D2-USD-CAP 55 700.00 1 387 525.63 1.36CHF JULIUS BAER MULTIBOND SICAV - SWISS FRANC BOND FUND-C 30 960.00 6 127 293.60 6.02CHF JULIUS BAER MULTIBOND SICAV - ABSOLUTE RETURN BOND FUND-C 43 465.00 5 109 745.40 5.02USD NATIXIS INTL FUNDS LUX I - HARRIS ASSOC GLB EQ FUND-S/A USD 11 890.00 1 649 073.24 1.62EUR OYSTER FUNDS-CREDIT OPPORTUNITIES-I-EUR2 1 770.00 2 553 138.34 2.51CHF UBAM SICAV - SWISS EQUITY-IC-CAPITALISATION 32 240.00 7 673 442.40 7.54CHF UBAM SICAV - UNCONSTRAINED BOND - IPHC CHF 70 900.00 7 164 445.00 7.04USD UBAM SICAV - YIELD CURVE US DOLLAR BOND-IC-CAPITALISATION 915.00 2 034 559.01 2.00USD VONTOBEL FUND - GLOBAL VALUE EQUITY-I 13 020.00 1 633 612.86 1.60CHF VONTOBEL FUND SICAV-SWISS FRANC BOND-CAP-I 80 800.00 10 213 120.00 10.03EUR VONTOBEL FUND SICAV-EURO CORP MID YIELD BOND-I 15 420.00 2 563 364.35 2.52
Total Luxembourg 49 802 567.50 48.92
Total Investment certificates, open end 74 101 269.36 72.79
Total UCITS/Other UCIs in accordance with Article 41 (1) e) of the Luxembourg law of 17 December 2010 74 101 269.36 72.79
Annual Report as of 31 December 2013 BSI-Multinvest – Strategy Income (CHF)
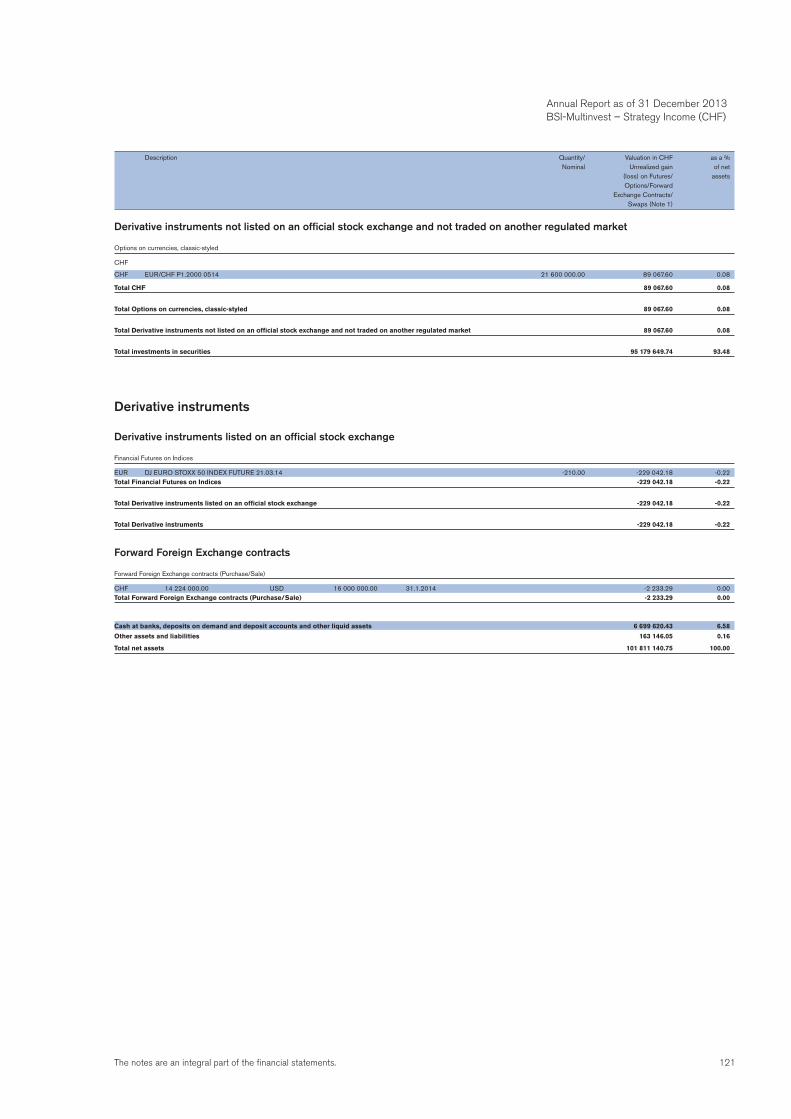
121The notes are an integral part of the financial statements.
Annual Report as of 31 December 2013 BSI-Multinvest – Strategy Income (CHF)
Derivative instruments not listed on an official stock exchange and not traded on another regulated market
Options on currencies, classic-styled
CHF
CHF EUR/CHF P1.2000 0514 21 600 000.00 89 067.60 0.08
Total CHF 89 067.60 0.08
Total Options on currencies, classic-styled 89 067.60 0.08
Total Derivative instruments not listed on an official stock exchange and not traded on another regulated market 89 067.60 0.08
Total investments in securities 95 179 649.74 93.48
Derivative instruments
Derivative instruments listed on an official stock exchange
Financial Futures on Indices
EUR DJ EURO STOXX 50 INDEX FUTURE 21.03.14 -210.00 -229 042.18 -0.22Total Financial Futures on Indices -229 042.18 -0.22
Total Derivative instruments listed on an official stock exchange -229 042.18 -0.22
Total Derivative instruments -229 042.18 -0.22
Forward Foreign Exchange contracts
Forward Foreign Exchange contracts (Purchase/Sale)
CHF 14 224 000.00 USD 16 000 000.00 31.1.2014 -2 233.29 0.00Total Forward Foreign Exchange contracts (Purchase/Sale) -2 233.29 0.00
Cash at banks, deposits on demand and deposit accounts and other liquid assets 6 699 620.43 6.58
Other assets and liabilities 163 146.05 0.16
Total net assets 101 811 140.75 100.00
Description Quantity/ Valuation in CHF as a % Nominal Unrealized gain of net (loss) on Futures/ assets Options/Forward Exchange Contracts/ Swaps (Note 1)
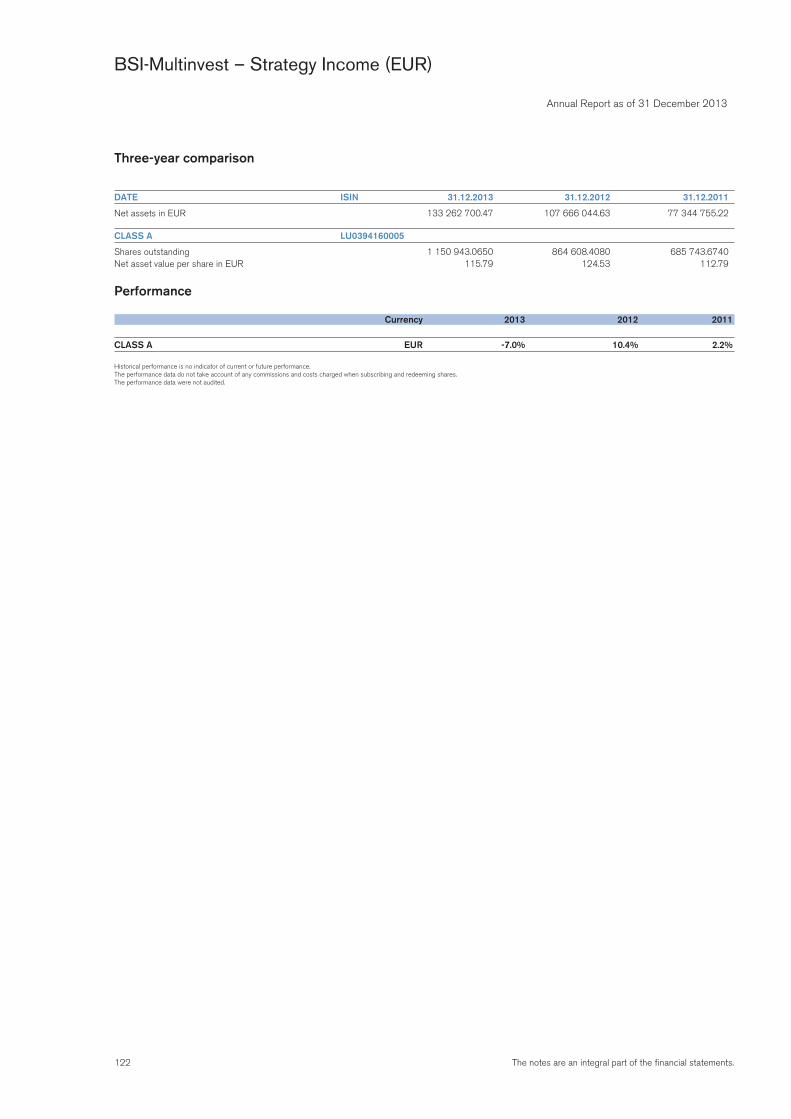
122 The notes are an integral part of the financial statements.
Annual Report as of 31 December 2013
BSI-Multinvest – Strategy Income (EUR)
Three-year comparison
DATE ISIN 31.12.2013 31.12.2012 31.12.2011
Net assets in EUR 133 262 700.47 107 666 044.63 77 344 755.22
CLASS A LU0394160005
Shares outstanding 1 150 943.0650 864 608.4080 685 743.6740Net asset value per share in EUR 115.79 124.53 112.79
Performance
Currency 2013 2012 2011
CLASS A EUR -7.0% 10.4% 2.2%
Historical performance is no indicator of current or future performance.The performance data do not take account of any commissions and costs charged when subscribing and redeeming shares.The performance data were not audited.
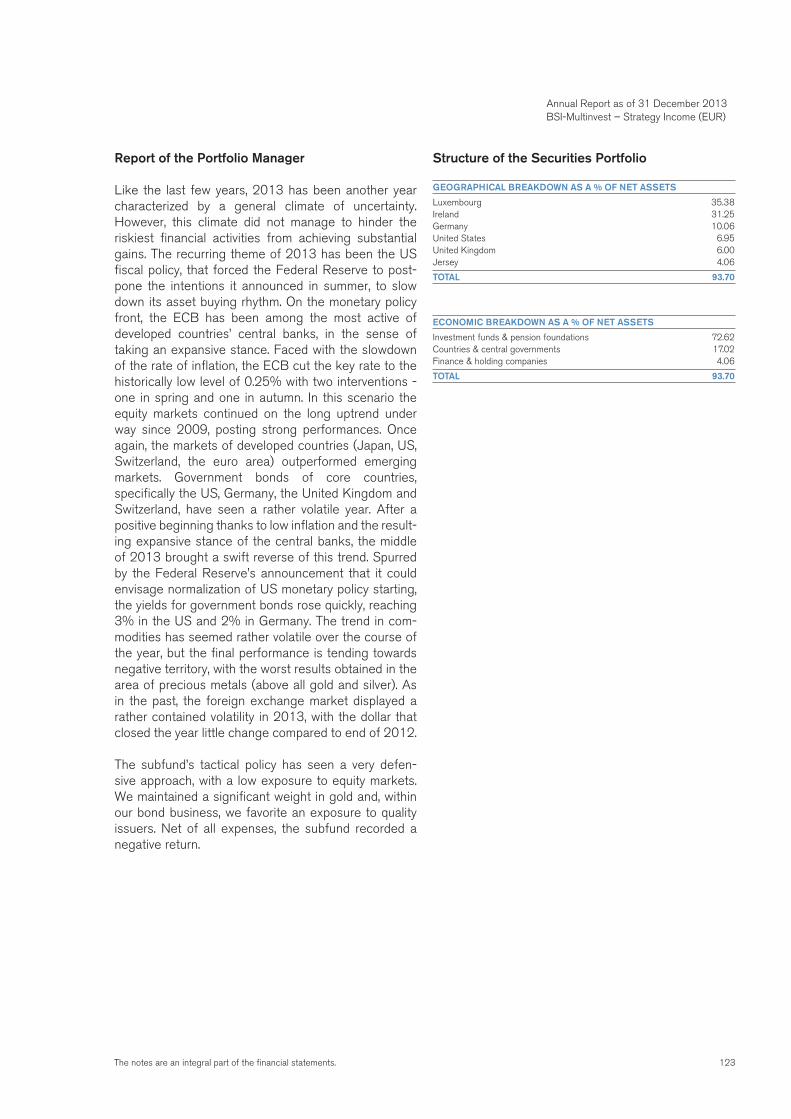
123The notes are an integral part of the financial statements.
Report of the Portfolio Manager
Like the last few years, 2013 has been another year characterized by a general climate of uncertainty. However, this climate did not manage to hinder the riskiest financial activities from achieving substantial gains. The recurring theme of 2013 has been the US fiscal policy, that forced the Federal Reserve to post-pone the intentions it announced in summer, to slow down its asset buying rhythm. On the monetary policy front, the ECB has been among the most active of developed countries’ central banks, in the sense of taking an expansive stance. Faced with the slowdown of the rate of inflation, the ECB cut the key rate to the historically low level of 0.25% with two interventions - one in spring and one in autumn. In this scenario the equity markets continued on the long uptrend under way since 2009, posting strong performances. Once again, the markets of developed countries (Japan, US, Switzerland, the euro area) outperformed emerging markets. Government bonds of core countries, specifically the US, Germany, the United Kingdom and Switzerland, have seen a rather volatile year. After a positive beginning thanks to low inflation and the result-ing expansive stance of the central banks, the middle of 2013 brought a swift reverse of this trend. Spurred by the Federal Reserve’s announcement that it could envisage normalization of US monetary policy starting, the yields for government bonds rose quickly, reaching 3% in the US and 2% in Germany. The trend in com-modities has seemed rather volatile over the course of the year, but the final performance is tending towards negative territory, with the worst results obtained in the area of precious metals (above all gold and silver). As in the past, the foreign exchange market displayed a rather contained volatility in 2013, with the dollar that closed the year little change compared to end of 2012.
The subfund’s tactical policy has seen a very defen-sive approach, with a low exposure to equity markets. We maintained a significant weight in gold and, within our bond business, we favorite an exposure to quality issuers. Net of all expenses, the subfund recorded a negative return.
Structure of the Securities Portfolio
GEOGRAPHICAL BREAKDOWN AS A % OF NET ASSETS
Luxembourg 35.38Ireland 31.25Germany 10.06United States 6.95United Kingdom 6.00Jersey 4.06
TOTAL 93.70
ECONOMIC BREAKDOWN AS A % OF NET ASSETS
Investment funds & pension foundations 72.62Countries & central governments 17.02Finance & holding companies 4.06
TOTAL 93.70
Annual Report as of 31 December 2013 BSI-Multinvest – Strategy Income (EUR)
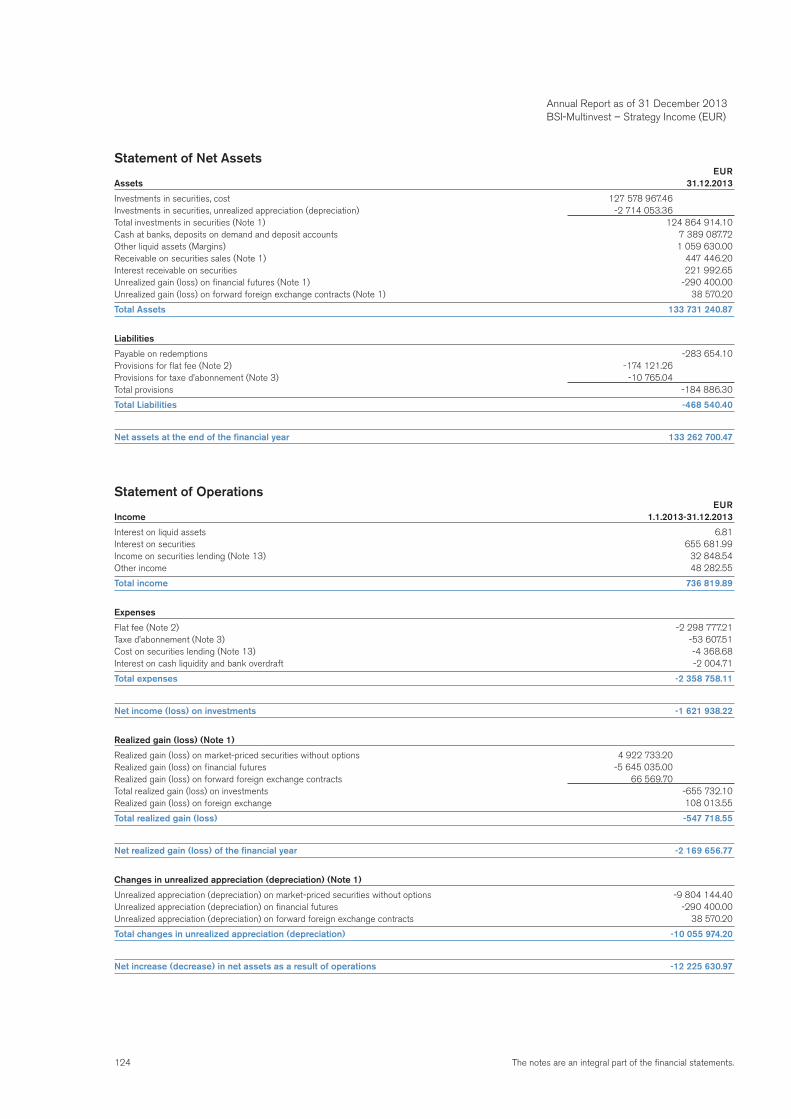
124 The notes are an integral part of the financial statements.
Annual Report as of 31 December 2013 BSI-Multinvest – Strategy Income (EUR)
Statement of Net Assets EURAssets 31.12.2013
Investments in securities, cost 127 578 967.46Investments in securities, unrealized appreciation (depreciation) -2 714 053.36Total investments in securities (Note 1) 124 864 914.10Cash at banks, deposits on demand and deposit accounts 7 389 087.72Other liquid assets (Margins) 1 059 630.00Receivable on securities sales (Note 1) 447 446.20Interest receivable on securities 221 992.65Unrealized gain (loss) on financial futures (Note 1) -290 400.00Unrealized gain (loss) on forward foreign exchange contracts (Note 1) 38 570.20
Total Assets 133 731 240.87
Liabilities
Payable on redemptions -283 654.10Provisions for flat fee (Note 2) -174 121.26Provisions for taxe d’abonnement (Note 3) -10 765.04Total provisions -184 886.30
Total Liabilities -468 540.40
Net assets at the end of the financial year 133 262 700.47
Statement of Operations EURIncome 1.1.2013-31.12.2013
Interest on liquid assets 6.81Interest on securities 655 681.99Income on securities lending (Note 13) 32 848.54Other income 48 282.55
Total income 736 819.89
Expenses
Flat fee (Note 2) -2 298 777.21Taxe d’abonnement (Note 3) -53 607.51Cost on securities lending (Note 13) -4 368.68Interest on cash liquidity and bank overdraft -2 004.71
Total expenses -2 358 758.11
Net income (loss) on investments -1 621 938.22
Realized gain (loss) (Note 1)
Realized gain (loss) on market-priced securities without options 4 922 733.20Realized gain (loss) on financial futures -5 645 035.00Realized gain (loss) on forward foreign exchange contracts 66 569.70Total realized gain (loss) on investments -655 732.10Realized gain (loss) on foreign exchange 108 013.55
Total realized gain (loss) -547 718.55
Net realized gain (loss) of the financial year -2 169 656.77
Changes in unrealized appreciation (depreciation) (Note 1)
Unrealized appreciation (depreciation) on market-priced securities without options -9 804 144.40Unrealized appreciation (depreciation) on financial futures -290 400.00Unrealized appreciation (depreciation) on forward foreign exchange contracts 38 570.20
Total changes in unrealized appreciation (depreciation) -10 055 974.20
Net increase (decrease) in net assets as a result of operations -12 225 630.97
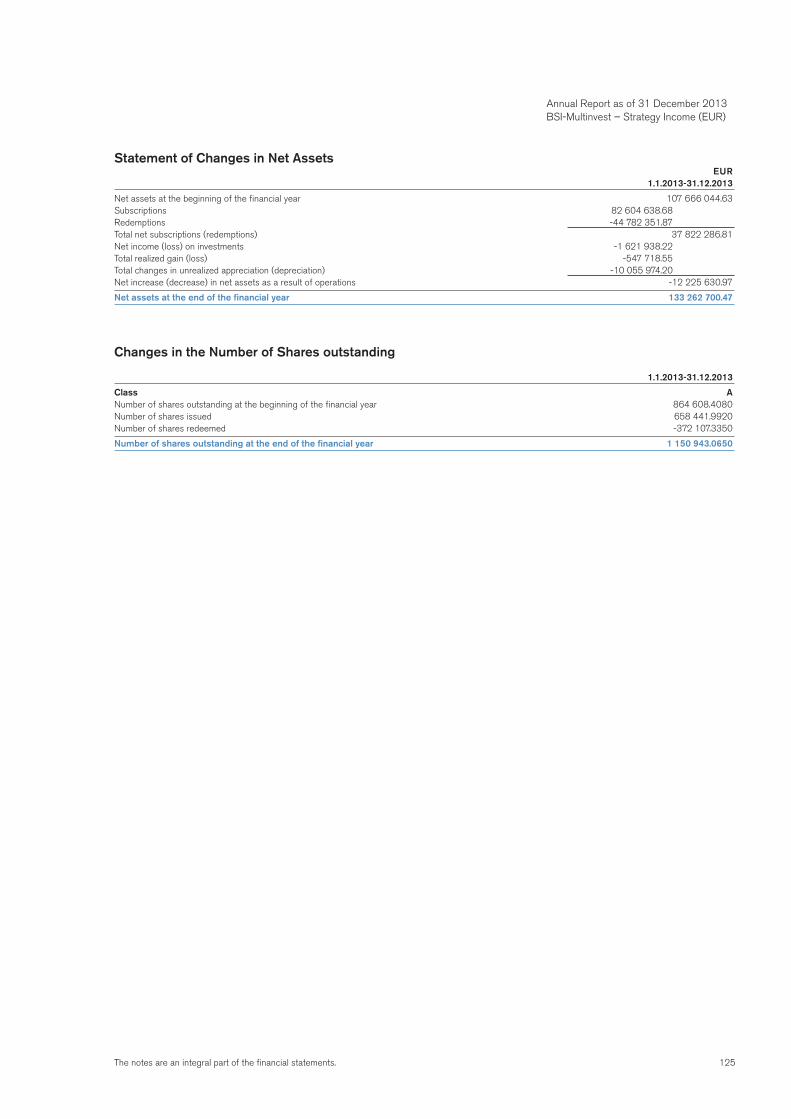
125The notes are an integral part of the financial statements.
Statement of Changes in Net Assets EUR 1.1.2013-31.12.2013
Net assets at the beginning of the financial year 107 666 044.63Subscriptions 82 604 638.68Redemptions -44 782 351.87Total net subscriptions (redemptions) 37 822 286.81Net income (loss) on investments -1 621 938.22Total realized gain (loss) -547 718.55Total changes in unrealized appreciation (depreciation) -10 055 974.20Net increase (decrease) in net assets as a result of operations -12 225 630.97
Net assets at the end of the financial year 133 262 700.47
Changes in the Number of Shares outstanding
1.1.2013-31.12.2013
Class ANumber of shares outstanding at the beginning of the financial year 864 608.4080Number of shares issued 658 441.9920Number of shares redeemed -372 107.3350
Number of shares outstanding at the end of the financial year 1 150 943.0650
Annual Report as of 31 December 2013 BSI-Multinvest – Strategy Income (EUR)
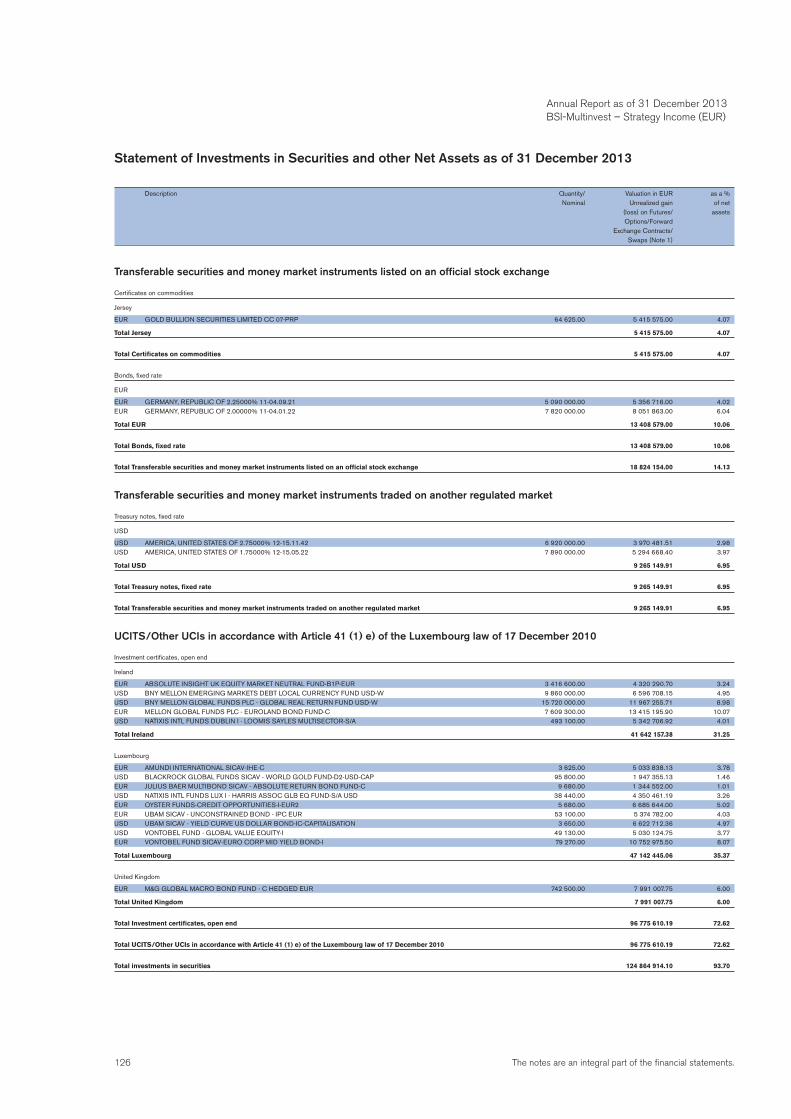
126 The notes are an integral part of the financial statements.
Statement of Investments in Securities and other Net Assets as of 31 December 2013
Description Quantity/ Valuation in EUR as a % Nominal Unrealized gain of net (loss) on Futures/ assets Options/Forward Exchange Contracts/ Swaps (Note 1)
Transferable securities and money market instruments listed on an official stock exchange
Certificates on commodities
Jersey
EUR GOLD BULLION SECURITIES LIMITED CC 07-PRP 64 625.00 5 415 575.00 4.07
Total Jersey 5 415 575.00 4.07
Total Certificates on commodities 5 415 575.00 4.07
Bonds, fixed rate
EUR
EUR GERMANY, REPUBLIC OF 2.25000% 11-04.09.21 5 090 000.00 5 356 716.00 4.02EUR GERMANY, REPUBLIC OF 2.00000% 11-04.01.22 7 820 000.00 8 051 863.00 6.04
Total EUR 13 408 579.00 10.06
Total Bonds, fixed rate 13 408 579.00 10.06
Total Transferable securities and money market instruments listed on an official stock exchange 18 824 154.00 14.13
Transferable securities and money market instruments traded on another regulated market
Treasury notes, fixed rate
USD
USD AMERICA, UNITED STATES OF 2.75000% 12-15.11.42 6 920 000.00 3 970 481.51 2.98USD AMERICA, UNITED STATES OF 1.75000% 12-15.05.22 7 890 000.00 5 294 668.40 3.97
Total USD 9 265 149.91 6.95
Total Treasury notes, fixed rate 9 265 149.91 6.95
Total Transferable securities and money market instruments traded on another regulated market 9 265 149.91 6.95
UCITS/Other UCIs in accordance with Article 41 (1) e) of the Luxembourg law of 17 December 2010
Investment certificates, open end
Ireland
EUR ABSOLUTE INSIGHT UK EQUITY MARKET NEUTRAL FUND-B1P-EUR 3 416 600.00 4 320 290.70 3.24USD BNY MELLON EMERGING MARKETS DEBT LOCAL CURRENCY FUND USD-W 9 860 000.00 6 596 708.15 4.95USD BNY MELLON GLOBAL FUNDS PLC - GLOBAL REAL RETURN FUND USD-W 15 720 000.00 11 967 255.71 8.98EUR MELLON GLOBAL FUNDS PLC - EUROLAND BOND FUND-C 7 609 300.00 13 415 195.90 10.07USD NATIXIS INTL FUNDS DUBLIN I - LOOMIS SAYLES MULTISECTOR-S/A 493 100.00 5 342 706.92 4.01
Total Ireland 41 642 157.38 31.25
Luxembourg
EUR AMUNDI INTERNATIONAL SICAV-IHE-C 3 625.00 5 033 838.13 3.78USD BLACKROCK GLOBAL FUNDS SICAV - WORLD GOLD FUND-D2-USD-CAP 95 800.00 1 947 355.13 1.46EUR JULIUS BAER MULTIBOND SICAV - ABSOLUTE RETURN BOND FUND-C 9 680.00 1 344 552.00 1.01USD NATIXIS INTL FUNDS LUX I - HARRIS ASSOC GLB EQ FUND-S/A USD 38 440.00 4 350 461.19 3.26EUR OYSTER FUNDS-CREDIT OPPORTUNITIES-I-EUR2 5 680.00 6 685 644.00 5.02EUR UBAM SICAV - UNCONSTRAINED BOND - IPC EUR 53 100.00 5 374 782.00 4.03USD UBAM SICAV - YIELD CURVE US DOLLAR BOND-IC-CAPITALISATION 3 650.00 6 622 712.36 4.97USD VONTOBEL FUND - GLOBAL VALUE EQUITY-I 49 130.00 5 030 124.75 3.77EUR VONTOBEL FUND SICAV-EURO CORP MID YIELD BOND-I 79 270.00 10 752 975.50 8.07
Total Luxembourg 47 142 445.06 35.37
United Kingdom
EUR M&G GLOBAL MACRO BOND FUND - C HEDGED EUR 742 500.00 7 991 007.75 6.00
Total United Kingdom 7 991 007.75 6.00
Total Investment certificates, open end 96 775 610.19 72.62
Total UCITS/Other UCIs in accordance with Article 41 (1) e) of the Luxembourg law of 17 December 2010 96 775 610.19 72.62
Total investments in securities 124 864 914.10 93.70
Annual Report as of 31 December 2013 BSI-Multinvest – Strategy Income (EUR)
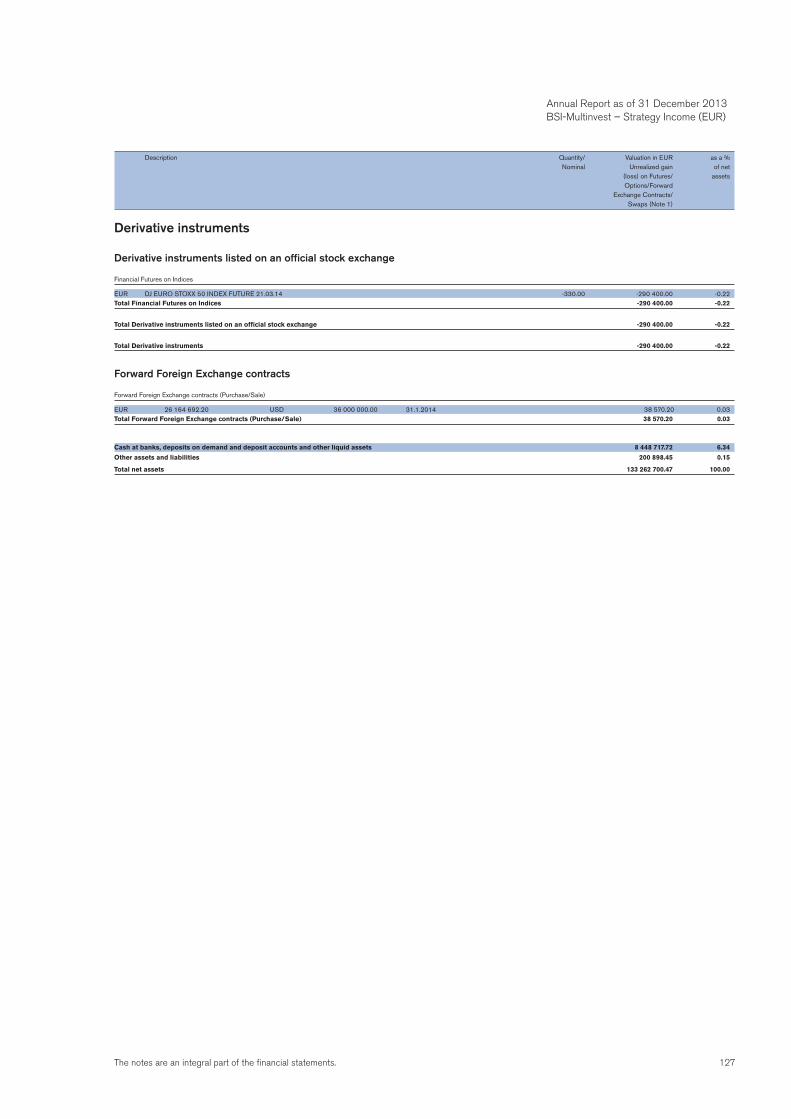
127The notes are an integral part of the financial statements.
Annual Report as of 31 December 2013 BSI-Multinvest – Strategy Income (EUR)
Derivative instruments
Derivative instruments listed on an official stock exchange
Financial Futures on Indices
EUR DJ EURO STOXX 50 INDEX FUTURE 21.03.14 -330.00 -290 400.00 -0.22Total Financial Futures on Indices -290 400.00 -0.22
Total Derivative instruments listed on an official stock exchange -290 400.00 -0.22
Total Derivative instruments -290 400.00 -0.22
Forward Foreign Exchange contracts
Forward Foreign Exchange contracts (Purchase/Sale)
EUR 26 164 692.20 USD 36 000 000.00 31.1.2014 38 570.20 0.03Total Forward Foreign Exchange contracts (Purchase/Sale) 38 570.20 0.03
Cash at banks, deposits on demand and deposit accounts and other liquid assets 8 448 717.72 6.34
Other assets and liabilities 200 898.45 0.15
Total net assets 133 262 700.47 100.00
Description Quantity/ Valuation in EUR as a % Nominal Unrealized gain of net (loss) on Futures/ assets Options/Forward Exchange Contracts/ Swaps (Note 1)
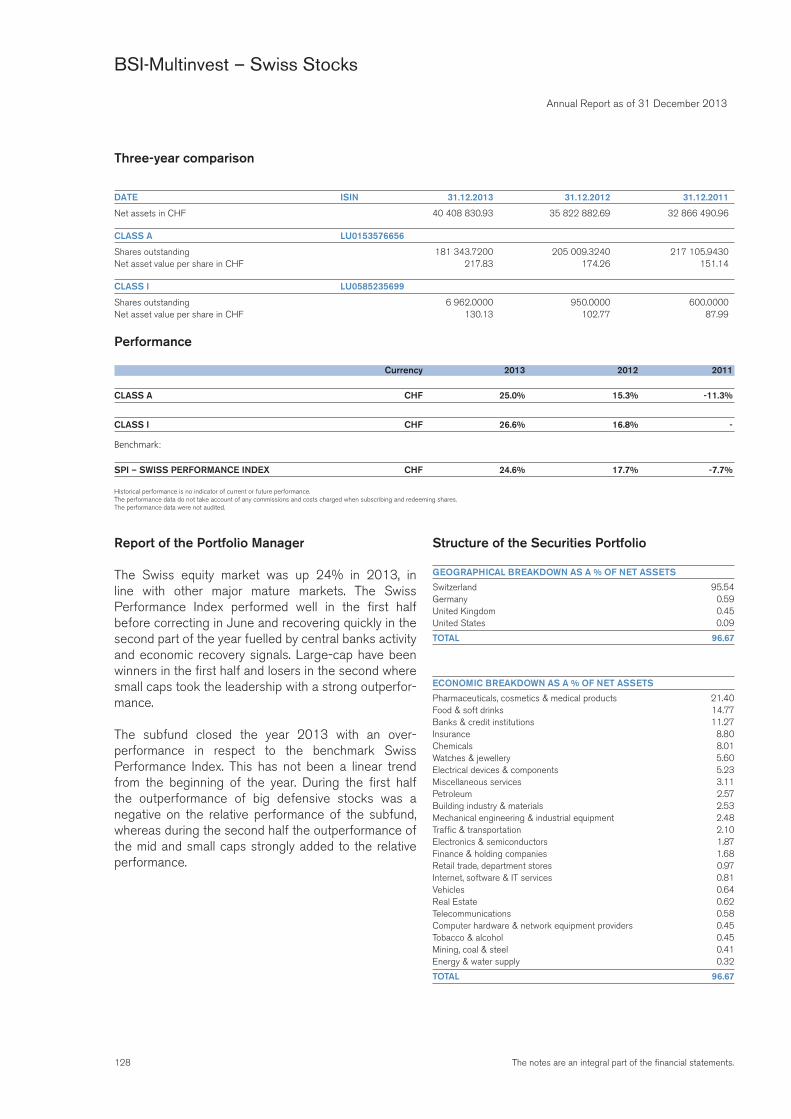
128 The notes are an integral part of the financial statements.
Annual Report as of 31 December 2013
BSI-Multinvest – Swiss Stocks
Three-year comparison
DATE ISIN 31.12.2013 31.12.2012 31.12.2011
Net assets in CHF 40 408 830.93 35 822 882.69 32 866 490.96
CLASS A LU0153576656
Shares outstanding 181 343.7200 205 009.3240 217 105.9430Net asset value per share in CHF 217.83 174.26 151.14
CLASS I LU0585235699
Shares outstanding 6 962.0000 950.0000 600.0000Net asset value per share in CHF 130.13 102.77 87.99
Performance
Currency 2013 2012 2011
CLASS A CHF 25.0% 15.3% -11.3%
CLASS I CHF 26.6% 16.8% -
Benchmark:
SPI – SWISS PERFORMANCE INDEX CHF 24.6% 17.7% -7.7%
Historical performance is no indicator of current or future performance.The performance data do not take account of any commissions and costs charged when subscribing and redeeming shares.The performance data were not audited.
Report of the Portfolio Manager
The Swiss equity market was up 24% in 2013, in line with other major mature markets. The Swiss Performance Index performed well in the first half before correcting in June and recovering quickly in the second part of the year fuelled by central banks activity and economic recovery signals. Large-cap have been winners in the first half and losers in the second where small caps took the leadership with a strong outperfor-mance.
The subfund closed the year 2013 with an over-performance in respect to the benchmark Swiss Performance Index. This has not been a linear trend from the beginning of the year. During the first half the outperformance of big defensive stocks was a negative on the relative performance of the subfund, whereas during the second half the outperformance of the mid and small caps strongly added to the relative performance.
Structure of the Securities Portfolio
GEOGRAPHICAL BREAKDOWN AS A % OF NET ASSETS
Switzerland 95.54Germany 0.59United Kingdom 0.45United States 0.09
TOTAL 96.67
ECONOMIC BREAKDOWN AS A % OF NET ASSETS
Pharmaceuticals, cosmetics & medical products 21.40Food & soft drinks 14.77Banks & credit institutions 11.27Insurance 8.80Chemicals 8.01Watches & jewellery 5.60Electrical devices & components 5.23Miscellaneous services 3.11Petroleum 2.57Building industry & materials 2.53Mechanical engineering & industrial equipment 2.48Traffic & transportation 2.10Electronics & semiconductors 1.87Finance & holding companies 1.68Retail trade, department stores 0.97Internet, software & IT services 0.81Vehicles 0.64Real Estate 0.62Telecommunications 0.58Computer hardware & network equipment providers 0.45Tobacco & alcohol 0.45Mining, coal & steel 0.41Energy & water supply 0.32
TOTAL 96.67
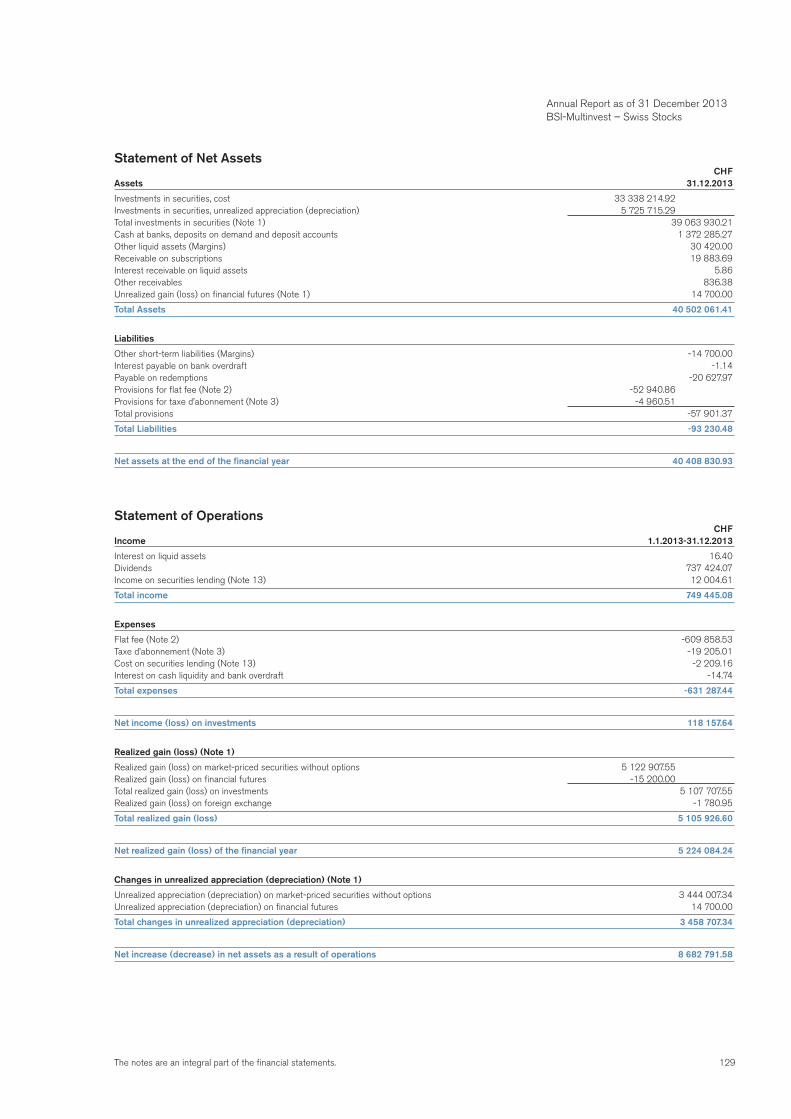
129The notes are an integral part of the financial statements.
Statement of Net Assets CHFAssets 31.12.2013
Investments in securities, cost 33 338 214.92Investments in securities, unrealized appreciation (depreciation) 5 725 715.29Total investments in securities (Note 1) 39 063 930.21Cash at banks, deposits on demand and deposit accounts 1 372 285.27Other liquid assets (Margins) 30 420.00Receivable on subscriptions 19 883.69Interest receivable on liquid assets 5.86Other receivables 836.38Unrealized gain (loss) on financial futures (Note 1) 14 700.00
Total Assets 40 502 061.41
Liabilities
Other short-term liabilities (Margins) -14 700.00Interest payable on bank overdraft -1.14Payable on redemptions -20 627.97Provisions for flat fee (Note 2) -52 940.86Provisions for taxe d’abonnement (Note 3) -4 960.51Total provisions -57 901.37
Total Liabilities -93 230.48
Net assets at the end of the financial year 40 408 830.93
Statement of Operations CHFIncome 1.1.2013-31.12.2013
Interest on liquid assets 16.40Dividends 737 424.07Income on securities lending (Note 13) 12 004.61
Total income 749 445.08
Expenses
Flat fee (Note 2) -609 858.53Taxe d’abonnement (Note 3) -19 205.01Cost on securities lending (Note 13) -2 209.16Interest on cash liquidity and bank overdraft -14.74
Total expenses -631 287.44
Net income (loss) on investments 118 157.64
Realized gain (loss) (Note 1)
Realized gain (loss) on market-priced securities without options 5 122 907.55Realized gain (loss) on financial futures -15 200.00Total realized gain (loss) on investments 5 107 707.55Realized gain (loss) on foreign exchange -1 780.95
Total realized gain (loss) 5 105 926.60
Net realized gain (loss) of the financial year 5 224 084.24
Changes in unrealized appreciation (depreciation) (Note 1)
Unrealized appreciation (depreciation) on market-priced securities without options 3 444 007.34Unrealized appreciation (depreciation) on financial futures 14 700.00
Total changes in unrealized appreciation (depreciation) 3 458 707.34
Net increase (decrease) in net assets as a result of operations 8 682 791.58
Annual Report as of 31 December 2013 BSI-Multinvest – Swiss Stocks
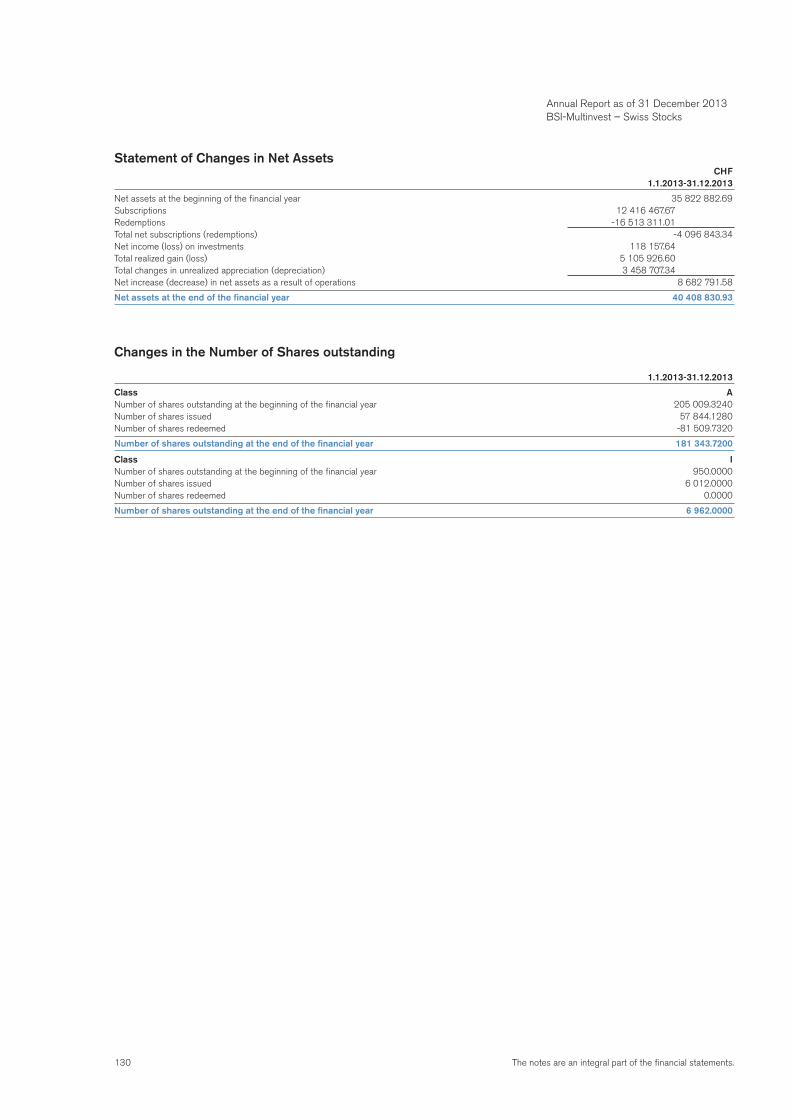
130 The notes are an integral part of the financial statements.
Statement of Changes in Net Assets CHF 1.1.2013-31.12.2013
Net assets at the beginning of the financial year 35 822 882.69Subscriptions 12 416 467.67Redemptions -16 513 311.01Total net subscriptions (redemptions) -4 096 843.34Net income (loss) on investments 118 157.64Total realized gain (loss) 5 105 926.60Total changes in unrealized appreciation (depreciation) 3 458 707.34Net increase (decrease) in net assets as a result of operations 8 682 791.58
Net assets at the end of the financial year 40 408 830.93
Changes in the Number of Shares outstanding
1.1.2013-31.12.2013
Class ANumber of shares outstanding at the beginning of the financial year 205 009.3240Number of shares issued 57 844.1280Number of shares redeemed -81 509.7320
Number of shares outstanding at the end of the financial year 181 343.7200
Class INumber of shares outstanding at the beginning of the financial year 950.0000Number of shares issued 6 012.0000Number of shares redeemed 0.0000
Number of shares outstanding at the end of the financial year 6 962.0000
Annual Report as of 31 December 2013 BSI-Multinvest – Swiss Stocks
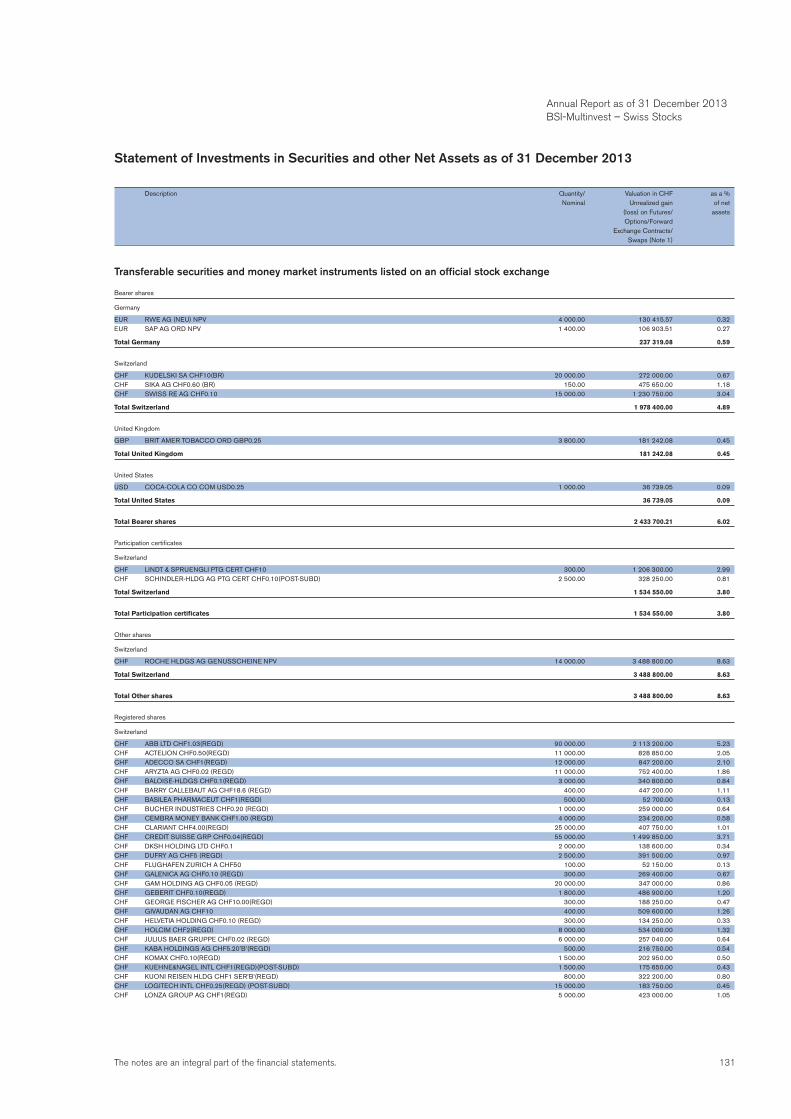
131The notes are an integral part of the financial statements.
Statement of Investments in Securities and other Net Assets as of 31 December 2013
Description Quantity/ Valuation in CHF as a % Nominal Unrealized gain of net (loss) on Futures/ assets Options/Forward Exchange Contracts/ Swaps (Note 1)
Transferable securities and money market instruments listed on an official stock exchange
Bearer shares
Germany
EUR RWE AG (NEU) NPV 4 000.00 130 415.57 0.32EUR SAP AG ORD NPV 1 400.00 106 903.51 0.27
Total Germany 237 319.08 0.59
Switzerland
CHF KUDELSKI SA CHF10(BR) 20 000.00 272 000.00 0.67CHF SIKA AG CHF0.60 (BR) 150.00 475 650.00 1.18CHF SWISS RE AG CHF0.10 15 000.00 1 230 750.00 3.04
Total Switzerland 1 978 400.00 4.89
United Kingdom
GBP BRIT AMER TOBACCO ORD GBP0.25 3 800.00 181 242.08 0.45
Total United Kingdom 181 242.08 0.45
United States
USD COCA-COLA CO COM USD0.25 1 000.00 36 739.05 0.09
Total United States 36 739.05 0.09
Total Bearer shares 2 433 700.21 6.02
Participation certificates
Switzerland
CHF LINDT & SPRUENGLI PTG CERT CHF10 300.00 1 206 300.00 2.99CHF SCHINDLER-HLDG AG PTG CERT CHF0.10(POST-SUBD) 2 500.00 328 250.00 0.81
Total Switzerland 1 534 550.00 3.80
Total Participation certificates 1 534 550.00 3.80
Other shares
Switzerland
CHF ROCHE HLDGS AG GENUSSCHEINE NPV 14 000.00 3 488 800.00 8.63
Total Switzerland 3 488 800.00 8.63
Total Other shares 3 488 800.00 8.63
Registered shares
Switzerland
CHF ABB LTD CHF1.03(REGD) 90 000.00 2 113 200.00 5.23CHF ACTELION CHF0.50(REGD) 11 000.00 828 850.00 2.05CHF ADECCO SA CHF1(REGD) 12 000.00 847 200.00 2.10CHF ARYZTA AG CHF0.02 (REGD) 11 000.00 752 400.00 1.86CHF BALOISE-HLDGS CHF0.1(REGD) 3 000.00 340 800.00 0.84CHF BARRY CALLEBAUT AG CHF18.6 (REGD) 400.00 447 200.00 1.11CHF BASILEA PHARMACEUT CHF1(REGD) 500.00 52 700.00 0.13CHF BUCHER INDUSTRIES CHF0.20 (REGD) 1 000.00 259 000.00 0.64CHF CEMBRA MONEY BANK CHF1.00 (REGD) 4 000.00 234 200.00 0.58CHF CLARIANT CHF4.00(REGD) 25 000.00 407 750.00 1.01CHF CREDIT SUISSE GRP CHF0.04(REGD) 55 000.00 1 499 850.00 3.71CHF DKSH HOLDING LTD CHF0.1 2 000.00 138 600.00 0.34CHF DUFRY AG CHF5 (REGD) 2 500.00 391 500.00 0.97CHF FLUGHAFEN ZURICH A CHF50 100.00 52 150.00 0.13CHF GALENICA AG CHF0.10 (REGD) 300.00 269 400.00 0.67CHF GAM HOLDING AG CHF0.05 (REGD) 20 000.00 347 000.00 0.86CHF GEBERIT CHF0.10(REGD) 1 800.00 486 900.00 1.20CHF GEORGE FISCHER AG CHF10.00(REGD) 300.00 188 250.00 0.47CHF GIVAUDAN AG CHF10 400.00 509 600.00 1.26CHF HELVETIA HOLDING CHF0.10 (REGD) 300.00 134 250.00 0.33CHF HOLCIM CHF2(REGD) 8 000.00 534 000.00 1.32CHF JULIUS BAER GRUPPE CHF0.02 (REGD) 6 000.00 257 040.00 0.64CHF KABA HOLDINGS AG CHF5.20’B’(REGD) 500.00 216 750.00 0.54CHF KOMAX CHF0.10(REGD) 1 500.00 202 950.00 0.50CHF KUEHNE&NAGEL INTL CHF1(REGD)(POST-SUBD) 1 500.00 175 650.00 0.43CHF KUONI REISEN HLDG CHF1 SER’B’(REGD) 800.00 322 200.00 0.80CHF LOGITECH INTL CHF0.25(REGD) (POST-SUBD) 15 000.00 183 750.00 0.45CHF LONZA GROUP AG CHF1(REGD) 5 000.00 423 000.00 1.05
Annual Report as of 31 December 2013 BSI-Multinvest – Swiss Stocks
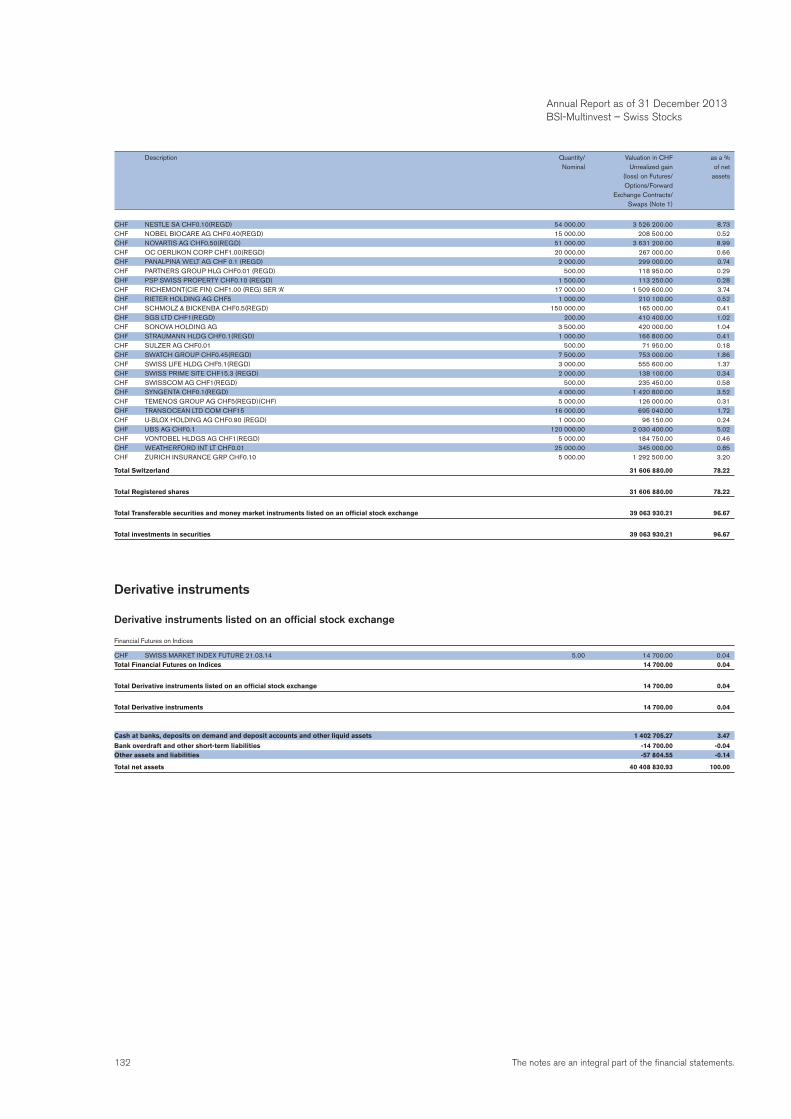
132 The notes are an integral part of the financial statements.
CHF NESTLE SA CHF0.10(REGD) 54 000.00 3 526 200.00 8.73CHF NOBEL BIOCARE AG CHF0.40(REGD) 15 000.00 208 500.00 0.52CHF NOVARTIS AG CHF0.50(REGD) 51 000.00 3 631 200.00 8.99CHF OC OERLIKON CORP CHF1.00(REGD) 20 000.00 267 000.00 0.66CHF PANALPINA WELT AG CHF 0.1 (REGD) 2 000.00 299 000.00 0.74CHF PARTNERS GROUP HLG CHF0.01 (REGD) 500.00 118 950.00 0.29CHF PSP SWISS PROPERTY CHF0.10 (REGD) 1 500.00 113 250.00 0.28CHF RICHEMONT(CIE FIN) CHF1.00 (REG) SER ‘A’ 17 000.00 1 509 600.00 3.74CHF RIETER HOLDING AG CHF5 1 000.00 210 100.00 0.52CHF SCHMOLZ & BICKENBA CHF0.5(REGD) 150 000.00 165 000.00 0.41CHF SGS LTD CHF1(REGD) 200.00 410 400.00 1.02CHF SONOVA HOLDING AG 3 500.00 420 000.00 1.04CHF STRAUMANN HLDG CHF0.1(REGD) 1 000.00 166 800.00 0.41CHF SULZER AG CHF0.01 500.00 71 950.00 0.18CHF SWATCH GROUP CHF0.45(REGD) 7 500.00 753 000.00 1.86CHF SWISS LIFE HLDG CHF5.1(REGD) 3 000.00 555 600.00 1.37CHF SWISS PRIME SITE CHF15.3 (REGD) 2 000.00 138 100.00 0.34CHF SWISSCOM AG CHF1(REGD) 500.00 235 450.00 0.58CHF SYNGENTA CHF0.1(REGD) 4 000.00 1 420 800.00 3.52CHF TEMENOS GROUP AG CHF5(REGD)(CHF) 5 000.00 126 000.00 0.31CHF TRANSOCEAN LTD COM CHF15 16 000.00 695 040.00 1.72CHF U-BLOX HOLDING AG CHF0.90 (REGD) 1 000.00 96 150.00 0.24CHF UBS AG CHF0.1 120 000.00 2 030 400.00 5.02CHF VONTOBEL HLDGS AG CHF1(REGD) 5 000.00 184 750.00 0.46CHF WEATHERFORD INT LT CHF0.01 25 000.00 345 000.00 0.85CHF ZURICH INSURANCE GRP CHF0.10 5 000.00 1 292 500.00 3.20
Total Switzerland 31 606 880.00 78.22
Total Registered shares 31 606 880.00 78.22
Total Transferable securities and money market instruments listed on an official stock exchange 39 063 930.21 96.67
Total investments in securities 39 063 930.21 96.67
Derivative instruments
Derivative instruments listed on an official stock exchange
Financial Futures on Indices
CHF SWISS MARKET INDEX FUTURE 21.03.14 5.00 14 700.00 0.04Total Financial Futures on Indices 14 700.00 0.04
Total Derivative instruments listed on an official stock exchange 14 700.00 0.04
Total Derivative instruments 14 700.00 0.04
Cash at banks, deposits on demand and deposit accounts and other liquid assets 1 402 705.27 3.47
Bank overdraft and other short-term liabilities -14 700.00 -0.04Other assets and liabilities -57 804.55 -0.14
Total net assets 40 408 830.93 100.00
Description Quantity/ Valuation in CHF as a % Nominal Unrealized gain of net (loss) on Futures/ assets Options/Forward Exchange Contracts/ Swaps (Note 1)
Annual Report as of 31 December 2013 BSI-Multinvest – Swiss Stocks
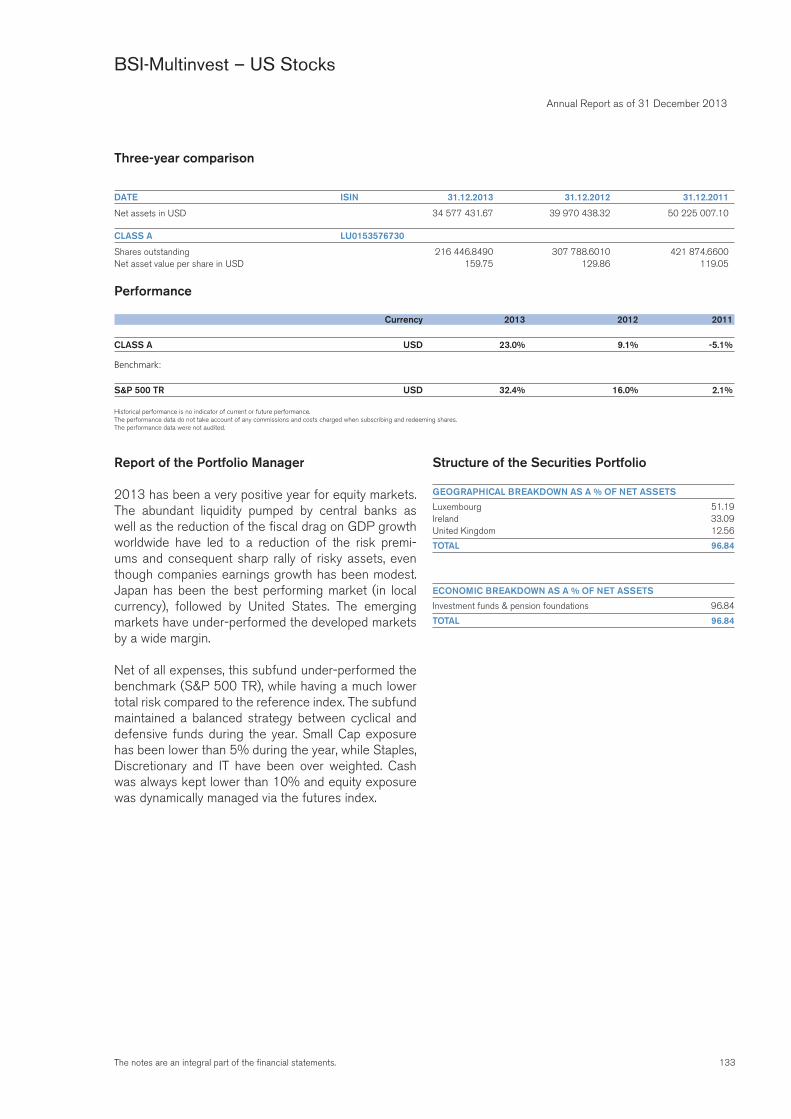
133The notes are an integral part of the financial statements.
Annual Report as of 31 December 2013
BSI-Multinvest – US Stocks
Three-year comparison
DATE ISIN 31.12.2013 31.12.2012 31.12.2011
Net assets in USD 34 577 431.67 39 970 438.32 50 225 007.10
CLASS A LU0153576730
Shares outstanding 216 446.8490 307 788.6010 421 874.6600Net asset value per share in USD 159.75 129.86 119.05
Performance
Currency 2013 2012 2011
CLASS A USD 23.0% 9.1% -5.1%
Benchmark:
S&P 500 TR USD 32.4% 16.0% 2.1%
Historical performance is no indicator of current or future performance.The performance data do not take account of any commissions and costs charged when subscribing and redeeming shares.The performance data were not audited.
Report of the Portfolio Manager
2013 has been a very positive year for equity markets. The abundant liquidity pumped by central banks as well as the reduction of the fiscal drag on GDP growth worldwide have led to a reduction of the risk premi-ums and consequent sharp rally of risky assets, even though companies earnings growth has been modest. Japan has been the best performing market (in local currency), followed by United States. The emerging markets have under-performed the developed markets by a wide margin.
Net of all expenses, this subfund under-performed the benchmark (S&P 500 TR), while having a much lower total risk compared to the reference index. The subfund maintained a balanced strategy between cyclical and defensive funds during the year. Small Cap exposure has been lower than 5% during the year, while Staples, Discretionary and IT have been over weighted. Cash was always kept lower than 10% and equity exposure was dynamically managed via the futures index.
Structure of the Securities Portfolio
GEOGRAPHICAL BREAKDOWN AS A % OF NET ASSETS
Luxembourg 51.19Ireland 33.09United Kingdom 12.56
TOTAL 96.84
ECONOMIC BREAKDOWN AS A % OF NET ASSETS
Investment funds & pension foundations 96.84
TOTAL 96.84
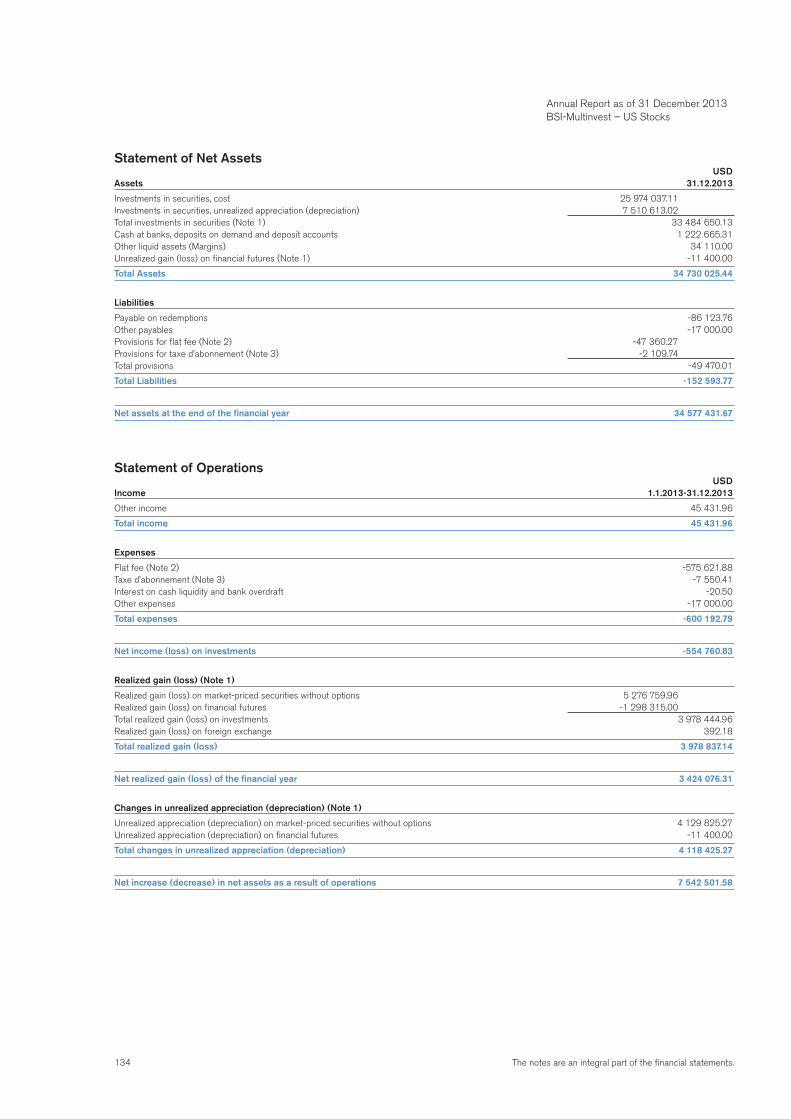
134 The notes are an integral part of the financial statements.
Statement of Net Assets USDAssets 31.12.2013
Investments in securities, cost 25 974 037.11Investments in securities, unrealized appreciation (depreciation) 7 510 613.02Total investments in securities (Note 1) 33 484 650.13Cash at banks, deposits on demand and deposit accounts 1 222 665.31Other liquid assets (Margins) 34 110.00Unrealized gain (loss) on financial futures (Note 1) -11 400.00
Total Assets 34 730 025.44
Liabilities
Payable on redemptions -86 123.76Other payables -17 000.00Provisions for flat fee (Note 2) -47 360.27Provisions for taxe d’abonnement (Note 3) -2 109.74Total provisions -49 470.01
Total Liabilities -152 593.77
Net assets at the end of the financial year 34 577 431.67
Statement of Operations USDIncome 1.1.2013-31.12.2013
Other income 45 431.96
Total income 45 431.96
Expenses
Flat fee (Note 2) -575 621.88Taxe d’abonnement (Note 3) -7 550.41Interest on cash liquidity and bank overdraft -20.50Other expenses -17 000.00
Total expenses -600 192.79
Net income (loss) on investments -554 760.83
Realized gain (loss) (Note 1)
Realized gain (loss) on market-priced securities without options 5 276 759.96Realized gain (loss) on financial futures -1 298 315.00Total realized gain (loss) on investments 3 978 444.96Realized gain (loss) on foreign exchange 392.18
Total realized gain (loss) 3 978 837.14
Net realized gain (loss) of the financial year 3 424 076.31
Changes in unrealized appreciation (depreciation) (Note 1)
Unrealized appreciation (depreciation) on market-priced securities without options 4 129 825.27Unrealized appreciation (depreciation) on financial futures -11 400.00
Total changes in unrealized appreciation (depreciation) 4 118 425.27
Net increase (decrease) in net assets as a result of operations 7 542 501.58
Annual Report as of 31 December 2013 BSI-Multinvest – US Stocks
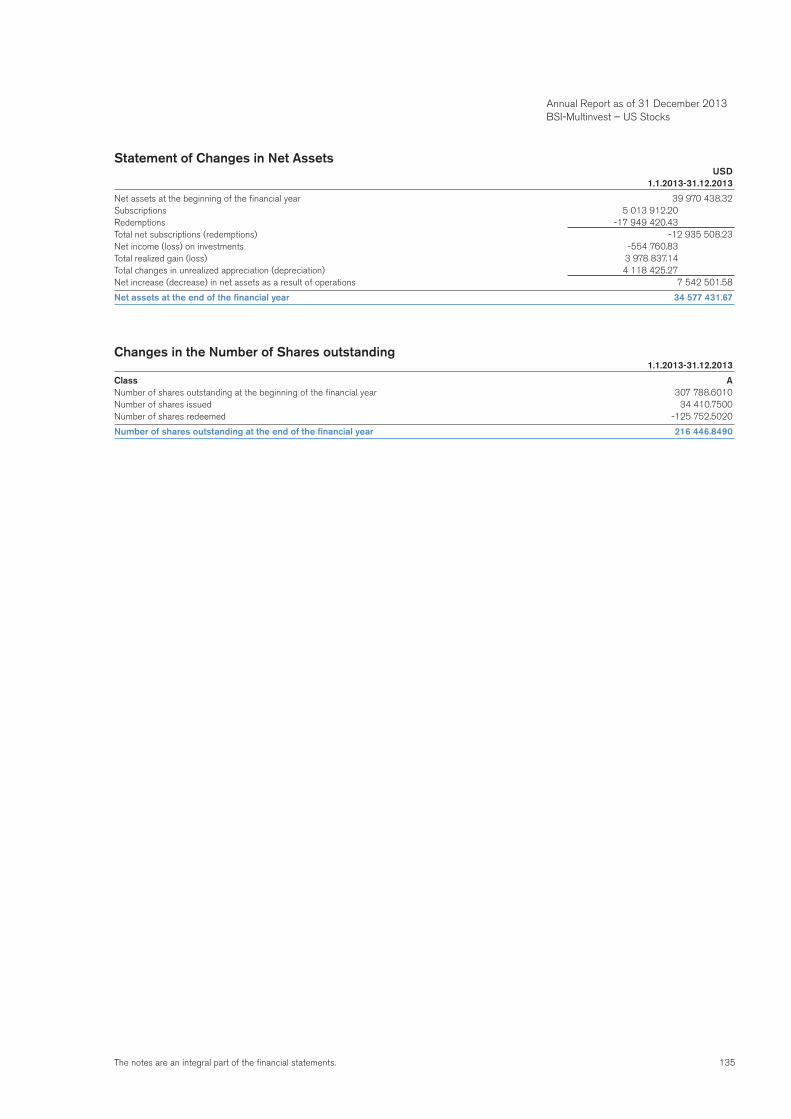
135The notes are an integral part of the financial statements.
Statement of Changes in Net Assets USD 1.1.2013-31.12.2013
Net assets at the beginning of the financial year 39 970 438.32Subscriptions 5 013 912.20Redemptions -17 949 420.43Total net subscriptions (redemptions) -12 935 508.23Net income (loss) on investments -554 760.83Total realized gain (loss) 3 978 837.14Total changes in unrealized appreciation (depreciation) 4 118 425.27Net increase (decrease) in net assets as a result of operations 7 542 501.58
Net assets at the end of the financial year 34 577 431.67
Changes in the Number of Shares outstanding 1.1.2013-31.12.2013
Class ANumber of shares outstanding at the beginning of the financial year 307 788.6010Number of shares issued 34 410.7500Number of shares redeemed -125 752.5020
Number of shares outstanding at the end of the financial year 216 446.8490
Annual Report as of 31 December 2013 BSI-Multinvest – US Stocks

136 The notes are an integral part of the financial statements.
Statement of Investments in Securities and other Net Assets as of 31 December 2013
Description Quantity/ Valuation in USD as a % Nominal Unrealized gain of net (loss) on Futures/ assets Options/Forward Exchange Contracts/ Swaps (Note 1)
UCITS/Other UCIs in accordance with Article 41 (1) e) of the Luxembourg law of 17 December 2010
Investment certificates, open end
Ireland
USD DELAWARE INVESTMENTS US LARGE CAP VALUE FUND-I-USD 184 645.00 3 482 404.70 10.07USD HEPTAGON FUND PLC-YACKTMAN US EQUITY FUND-I 24 181.78 3 450 193.50 9.98USD SANDS CAPITAL US SELECT GROWTH FUND -H USD 170 000.00 2 252 500.00 6.51USD VANGUARD INVESTMENT SERIES PLC-US OPPORTUNITIES FUND-$ INST 4 865.00 2 256 533.92 6.53
Total Ireland 11 441 632.12 33.09
Luxembourg
USD ALGER SICAV-THE ALGER AMERICAN ASSET GROWTH FUND-I 64 030.00 2 930 653.10 8.48USD EDGEWOOD L SELECT - US SELECT GROWTH-USD IC 640.00 2 269 491.20 6.56USD MORGAN STANLEY INVESTMENTS FUNDS SICAV - GLOBAL BRANDS FD-Z 37 405.00 1 574 002.40 4.55USD MORGAN STANLEY INVESTMENT FUNDS - US ADVANTAGE FUND-Z 62 595.00 3 107 841.75 8.99USD NATIXIS IFL HARRIS ASS US EQ FD-I/A CAP 16 060.00 3 493 050.00 10.10USD T.ROWE PRICE FUNDS SICAV-US SMALLER COMPANIES EQUITY FUND-Q 72 200.00 869 288.00 2.52USD VONTOBEL FUND SICAV-US VALUE EQUITY-I-CAPITALISATION 22 530.00 3 455 200.80 9.99
Total Luxembourg 17 699 527.25 51.19
United Kingdom
USD THREADNEEDLE INVESTMENT FUNDS-AMERICAN SELECT GROWTH-$-2 1 135 660.00 3 470 236.26 10.04USD THREADNEEDLE INVESTMENT FUNDS-AMERICAN SMALLER CO FUND-USD-2 265 000.00 873 254.50 2.52
Total United Kingdom 4 343 490.76 12.56
Total Investment certificates, open end 33 484 650.13 96.84
Total UCITS/Other UCIs in accordance with Article 41 (1) e) of the Luxembourg law of 17 December 2010 33 484 650.13 96.84
Total investments in securities 33 484 650.13 96.84
Derivative instruments
Derivative instruments listed on an official stock exchange
Financial Futures on Indices
USD S&P500 EMINI FUTURE 21.03.14 -6.00 -11 400.00 -0.03Total Financial Futures on Indices -11 400.00 -0.03
Total Derivative instruments listed on an official stock exchange -11 400.00 -0.03
Total Derivative instruments -11 400.00 -0.03
Cash at banks, deposits on demand and deposit accounts and other liquid assets 1 256 775.31 3.63
Other assets and liabilities -152 593.77 -0.44
Total net assets 34 577 431.67 100.00
Annual Report as of 31 December 2013 BSI-Multinvest – US Stocks
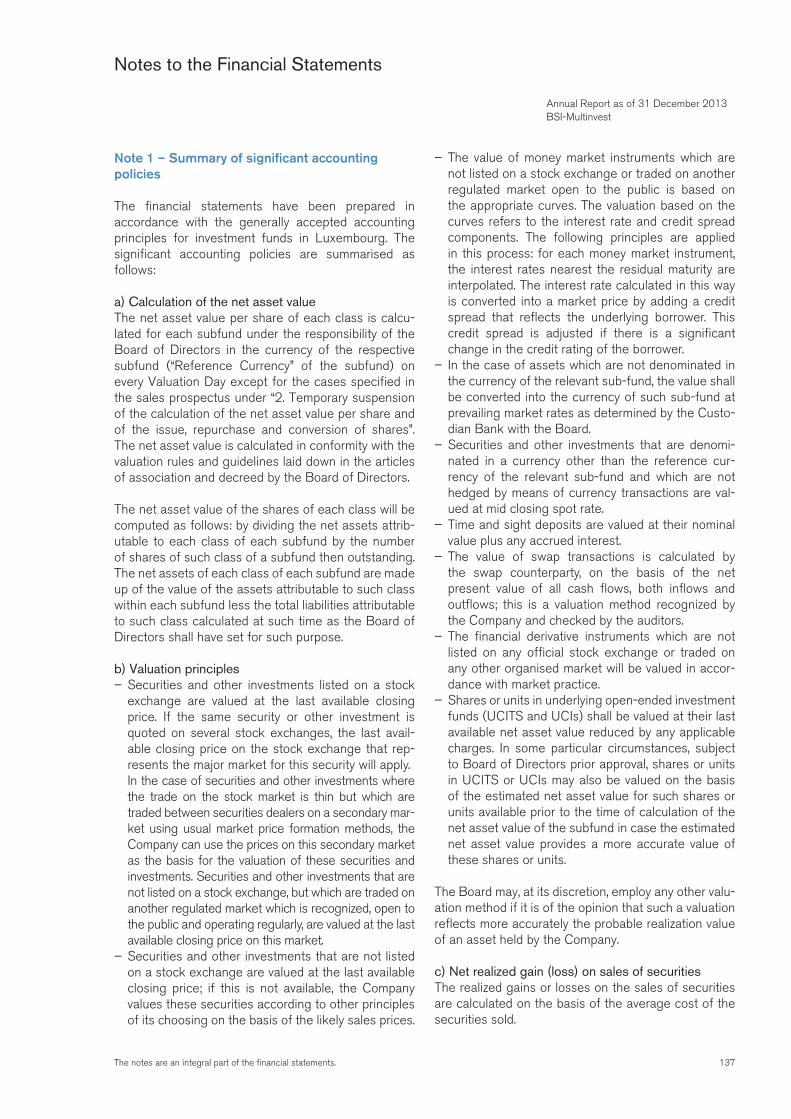
137The notes are an integral part of the financial statements.
Notes to the Financial Statements
Note 1 – Summary of significant accounting policies
The financial statements have been prepared in accordance with the generally accepted accounting principles for investment funds in Luxembourg. The significant accounting policies are summarised as follows:
a) Calculation of the net asset valueThe net asset value per share of each class is calcu-lated for each subfund under the responsibility of the Board of Directors in the currency of the respective subfund (“Reference Currency” of the subfund) on every Valuation Day except for the cases specified in the sales prospectus under “2. Temporary suspension of the calculation of the net asset value per share and of the issue, repurchase and conversion of shares”. The net asset value is calculated in conformity with the valuation rules and guidelines laid down in the articles of association and decreed by the Board of Directors.
The net asset value of the shares of each class will be computed as follows: by dividing the net assets attrib-utable to each class of each subfund by the number of shares of such class of a subfund then outstanding. The net assets of each class of each subfund are made up of the value of the assets attributable to such class within each subfund less the total liabilities attributable to such class calculated at such time as the Board of Directors shall have set for such purpose.
b) Valuation principles – Securities and other investments listed on a stock exchange are valued at the last available closing price. If the same security or other investment is quoted on several stock exchanges, the last avail-able closing price on the stock exchange that rep-resents the major market for this security will apply.
In the case of securities and other investments where the trade on the stock market is thin but which are traded between securities dealers on a secondary mar-ket using usual market price formation methods, the Company can use the prices on this secondary market as the basis for the valuation of these securities and investments. Securities and other investments that are not listed on a stock exchange, but which are traded on another regulated market which is recognized, open to the public and operating regularly, are valued at the last available closing price on this market.
– Securities and other investments that are not listed on a stock exchange are valued at the last available closing price; if this is not available, the Company values these securities according to other principles of its choosing on the basis of the likely sales prices.
– The value of money market instruments which are not listed on a stock exchange or traded on another regulated market open to the public is based on the appropriate curves. The valuation based on the curves refers to the interest rate and credit spread components. The following principles are applied in this process: for each money market instrument, the interest rates nearest the residual maturity are interpolated. The interest rate calculated in this way is converted into a market price by adding a credit spread that reflects the underlying borrower. This credit spread is adjusted if there is a significant change in the credit rating of the borrower.
– In the case of assets which are not denominated in the currency of the relevant sub-fund, the value shall be converted into the currency of such sub-fund at prevailing market rates as determined by the Custo-dian Bank with the Board.
– Securities and other investments that are denomi-nated in a currency other than the reference cur-rency of the relevant sub-fund and which are not hedged by means of currency transactions are val-ued at mid closing spot rate.
– Time and sight deposits are valued at their nominal value plus any accrued interest.
– The value of swap transactions is calculated by the swap counterparty, on the basis of the net present value of all cash flows, both inflows and outflows; this is a valuation method recognized by the Company and checked by the auditors.
– The financial derivative instruments which are not listed on any official stock exchange or traded on any other organised market will be valued in accor-dance with market practice.
– Shares or units in underlying open-ended investment funds (UCITS and UCIs) shall be valued at their last available net asset value reduced by any applicable charges. In some particular circumstances, subject to Board of Directors prior approval, shares or units in UCITS or UCIs may also be valued on the basis of the estimated net asset value for such shares or units available prior to the time of calculation of the net asset value of the subfund in case the estimated net asset value provides a more accurate value of these shares or units.
The Board may, at its discretion, employ any other valu-ation method if it is of the opinion that such a valuation reflects more accurately the probable realization value of an asset held by the Company.
c) Net realized gain (loss) on sales of securitiesThe realized gains or losses on the sales of securities are calculated on the basis of the average cost of the securities sold.
Annual Report as of 31 December 2013 BSI-Multinvest
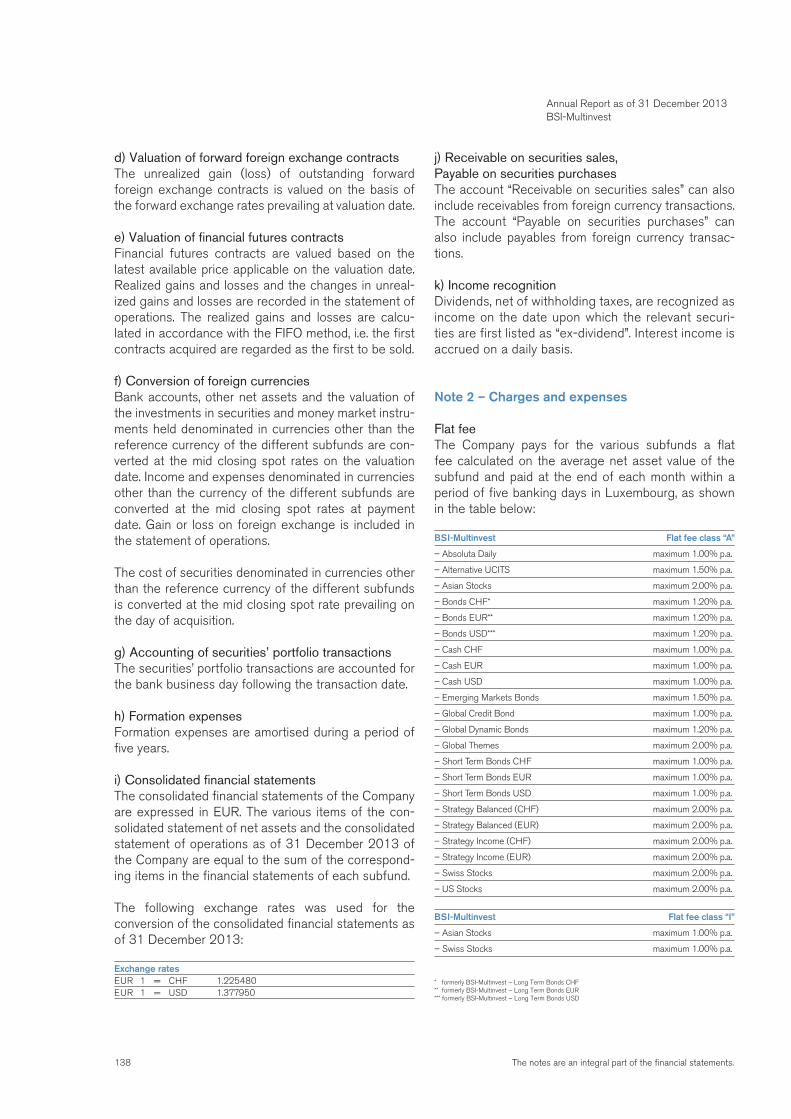
138 The notes are an integral part of the financial statements.
d) Valuation of forward foreign exchange contractsThe unrealized gain (loss) of outstanding forward foreign exchange contracts is valued on the basis of the forward exchange rates prevailing at valuation date.
e) Valuation of financial futures contractsFinancial futures contracts are valued based on the latest available price applicable on the valuation date. Realized gains and losses and the changes in unreal-ized gains and losses are recorded in the statement of operations. The realized gains and losses are calcu-lated in accordance with the FIFO method, i.e. the first contracts acquired are regarded as the first to be sold.
f) Conversion of foreign currenciesBank accounts, other net assets and the valuation of the investments in securities and money market instru-ments held denominated in currencies other than the reference currency of the different subfunds are con-verted at the mid closing spot rates on the valuation date. Income and expenses denominated in currencies other than the currency of the different subfunds are converted at the mid closing spot rates at payment date. Gain or loss on foreign exchange is included in the statement of operations.
The cost of securities denominated in currencies other than the reference currency of the different subfunds is converted at the mid closing spot rate prevailing on the day of acquisition.
g) Accounting of securities’ portfolio transactionsThe securities’ portfolio transactions are accounted for the bank business day following the transaction date.
h) Formation expensesFormation expenses are amortised during a period of five years.
i) Consolidated financial statementsThe consolidated financial statements of the Company are expressed in EUR. The various items of the con-solidated statement of net assets and the consolidated statement of operations as of 31 December 2013 of the Company are equal to the sum of the correspond-ing items in the financial statements of each subfund.
The following exchange rates was used for the conversion of the consolidated financial statements as of 31 December 2013:
Exchange ratesEUR 1 = CHF 1.225480EUR 1 = USD 1.377950
j) Receivable on securities sales,Payable on securities purchasesThe account “Receivable on securities sales” can also include receivables from foreign currency transactions. The account “Payable on securities purchases” can also include payables from foreign currency transac-tions.
k) Income recognitionDividends, net of withholding taxes, are recognized as income on the date upon which the relevant securi-ties are first listed as “ex-dividend”. Interest income is accrued on a daily basis.
Note 2 – Charges and expenses
Flat feeThe Company pays for the various subfunds a flat fee calculated on the average net asset value of the subfund and paid at the end of each month within a period of five banking days in Luxembourg, as shown in the table below:
BSI-Multinvest Flat fee class “A”
– Absoluta Daily maximum 1.00% p.a.
– Alternative UCITS maximum 1.50% p.a.
– Asian Stocks maximum 2.00% p.a.
– Bonds CHF* maximum 1.20% p.a.
– Bonds EUR** maximum 1.20% p.a.
– Bonds USD*** maximum 1.20% p.a.
– Cash CHF maximum 1.00% p.a.
– Cash EUR maximum 1.00% p.a.
– Cash USD maximum 1.00% p.a.
– Emerging Markets Bonds maximum 1.50% p.a.
– Global Credit Bond maximum 1.00% p.a.
– Global Dynamic Bonds maximum 1.20% p.a.
– Global Themes maximum 2.00% p.a.
– Short Term Bonds CHF maximum 1.00% p.a.
– Short Term Bonds EUR maximum 1.00% p.a.
– Short Term Bonds USD maximum 1.00% p.a.
– Strategy Balanced (CHF) maximum 2.00% p.a.
– Strategy Balanced (EUR) maximum 2.00% p.a.
– Strategy Income (CHF) maximum 2.00% p.a.
– Strategy Income (EUR) maximum 2.00% p.a.
– Swiss Stocks maximum 2.00% p.a.
– US Stocks maximum 2.00% p.a.
BSI-Multinvest Flat fee class “I”
– Asian Stocks maximum 1.00% p.a.
– Swiss Stocks maximum 1.00% p.a.
* formerly BSI-Multinvest – Long Term Bonds CHF** formerly BSI-Multinvest – Long Term Bonds EUR*** formerly BSI-Multinvest – Long Term Bonds USD
Annual Report as of 31 December 2013 BSI-Multinvest
139The notes are an integral part of the financial statements.
BSI-Multinvest Flat Fee class “L” USD Hedged
– Absoluta Daily maximum 0.40% p.a.
This flat fee is used to pay the Administrative Agent, the Custodian Bank, the Portfolio Manager, and the distribu-tor. It also covers all the costs incurred by the Company and the subfunds or classes of shares relating to:
– the establishment expenses including notary fees; – costs of registration and annual charges by super-visory authorities and by stock exchanges in Luxembourg and abroad;
– audit fees; – cost of printing of Articles of Associations, Prospectuses, the annual and semi annual reports and related translations;
– price publication fees and fees related to the publi-cation of notices to investors;
with the exception of the following: – all taxes which are levied on the assets and the income of the Company, particularly the “taxe d’abonnement”;
– customary brokerage fees and commissions which are charged by other banks and brokers for securi-ties transactions and similar transactions;
– costs for extraordinary measures carried out in the interests of shareholders, particularly arranging expert opinions and dealing with legal proceedings, etc.
In the subfunds that may invest in other UCIs or UCITS under the terms of their investment policies, charges may be incurred both at the level of the relevant investment fund as well as at the level of the subfund. In the case of investments in units of funds managed directly or indirectly by the Company itself or another company related to it by common management or control, or by a direct or indirect holding of more than 10% of the capital or the voting shares, the subfund may only be charged with a reduced flat fee of no more than 0.25% p.a. The Company may, moreover, not charge the subfund making the investment with any of the related target fund’s issuing or redemption commissions.
If, in accordance with the above paragraph, the Company invests in a related fund that charges a lower flat fee than the flat fee charged by the subfund making the investment the Company may, instead of the afore-mentioned lower flat fee, charge the volume invested in this target fund with the difference between the flat fee charged by the subfund making the investment on the one hand and the flat fee of the target fund on the other hand.
Performance feeIn addition to the aforementioned costs, the Company will pay a performance fee which is applicable to the subfund listed below: The performance fee will be cal-culated on basis of the subfund’s NAV of which all fees have been deducted (hereafter cleared NAV).
BSI-Multinvest – Alternative UCITS The performance fee of 10% is calculated on each “NAV calculation date of the BSI-Multinvest – Alternative UCITS” on the basis of the “cleared NAV” and accrued, chargeable to the net asset value of the subfund, according to the rates and conditions as set out below. After termination of each month, any per-formance fee will be paid out. The performance fee is subject to a “High Water Mark”. In order to trigger enti-tlement to the performance fee, the bi-monthly cleared NAV per Share must be above the High Water Mark (as defined hereinafter).
High Water Mark: the performance fee is only pay-able if the net asset value per share of the subfund (before the deduction of the performance fee) on the date when the performance fee is calculated exceeds the net asset values per share from all previous NAV calculation dates. It is understood that after price set-backs, the performance fee is charged again once the setbacks have been offset, i.e. the original highest level of the net asset value per share class has again been exceeded.
BSI-Multinvest – Absoluta DailyThe performance fee of 20% is calculated on each Valuation Day and accrued, chargeable to the net asset value of the subfund, according to the rates and conditions as set out below. After termination of each month, any performance fee is paid out.
The performance fee is subject to a “High Water Mark” and to a “Hurdle Rate”. In order to trigger entitlement to the performance fee, the daily net asset value per Share must be above both, the High Water Mark as well as the Hurdle Rate (as defined hereinafter).
High Water Mark: the performance fee is only payable if the net asset value per share of the subfund share (before the deduction of the performance fee) on the date when the performance fee is calculated exceeds the net asset values per share from all previous days. It is understood that after price setbacks, the perfor-mance fee is charged again once the setbacks have been offset, i.e. the original highest level of the net asset value per share class has again been exceeded.
Annual Report as of 31 December 2013 BSI-Multinvest
140 The notes are an integral part of the financial statements.
Hurdle rate: the performance fee will only be payable if the net asset value of the subfund share (before the deduction of the performance fee) on the date when the performance fee is calculated exceeds the mini-mum return which is defined as follows:
USD 3-months LIBOR for the Class A (USD)EUR 3-months LIBOR for the Class A (EUR)CHF 3-months LIBOR for the Class A (CHF)
The rate is adjusted on a daily basis to the current market conditions.
BSI-Multinvest – Global Credit BondThe performance fee of 10% will be calculated on each Valuation Day and accrued, chargeable to the net asset value of the subfund, according to the rates and conditions as mentioned in the prospectus. After termi-nation of each month, any performance fee will be paid out. The performance fee is subject neither to a “High Water Mark” nor to a “Hurdle Rate”.
Note 3 – Taxe d’abonnement
In accordance with the law and the regulations currently in force, the Company is subject to a subscription tax at the following annual rates, payable quarterly and calculated on the basis of the net assets of each subfund at the end of each quarter:
BSI-Multinvest Class “A”
– Absoluta Daily 0.05% p.a.
– Alternative UCITS 0.05% p.a.
– Asian Stocks 0.05% p.a.
– Bonds CHF* 0.05% p.a.
– Bonds EUR** 0.05% p.a.
– Bonds USD*** 0.05% p.a.
– Cash CHF 0.01% p.a.
– Cash EUR 0.01% p.a.
– Cash USD 0.01% p.a.
– Emerging Markets Bonds 0.05% p.a.
– Global Credit Bond 0.05% p.a.
– Global Dynamic Bonds 0.05% p.a.
– Global Themes 0.05% p.a.
– Short Term Bonds CHF 0.05% p.a.
– Short Term Bonds EUR 0.05% p.a.
– Short Term Bonds USD 0.05% p.a.
– Strategy Balanced (CHF) 0.05% p.a.
– Strategy Balanced (EUR) 0.05% p.a.
– Strategy Income (CHF) 0.05% p.a.
– Strategy Income (EUR) 0.05% p.a.
– Swiss Stocks 0.05% p.a.
– US Stocks 0.05% p.a.
* formerly BSI-Multinvest – Long Term Bonds CHF** formerly BSI-Multinvest – Long Term Bonds EUR*** formerly BSI-Multinvest – Long Term Bonds USD
BSI-Multinvest Class “I”
– Asian Stocks 0.01% p.a.
– Swiss Stocks 0.01% p.a.
BSI-Multinvest Class “L” USD Hedged
– Absoluta Daily 0.05% p.a.
The Taxe d’abonnement is waived for that part of the Company assets invested in units or shares of other undertakings for collective investment that have already paid the Taxe d’abonnement in accordance with the statutory provisions of Luxembourg law.
Under current law and practice, no capital gains tax is payable in Luxembourg on the realized or unrealized capital appreciation of the assets of the Company.
Capital gains, dividends and interest on securities issued in other countries may be subject to withholding or capital gains taxes imposed by such countries.
Note 4 – Income distribution
The distribution of dividends to the shareholders is not the principle objective of the Company’s earnings dis-tribution policy.
The income and capital gains generated by each subfund or class(es) of shares are capitalized in the subfund or class(es) of shares concerned. However, should the pay-ment of a dividend be deemed appropriate in connection with any subfund or class(es) of shares, the Directors may propose to the general meeting of shareholders the pay-ment of a dividend from the distributable net investment income and/or from the realized and/or unrealized capi-tal gains after deduction of the realized and/or unrealized capital losses within the limits of the law.
Any dividend announcements will be published in the “d’Wort” and, if so decided by the Board of Directors, in other newspapers.
Any dividends remaining unclaimed after five years shall be forfeited and revert to the subfund or class(es) of shares out of which they should have been paid.
Note 5 – Soft commission arrangements (unaudited)
During the period from 1 January 2013 until 31 December 2013, no “soft commission arrangements” were entered into on behalf of BSI-Multinvest and “soft commissions” amount to nil.
Annual Report as of 31 December 2013 BSI-Multinvest
141The notes are an integral part of the financial statements.
Note 6 – Commitments on Financial Futures
Commitments on Financial Futures per subfund and respective currency as of 31 December 2013 can be summarised as follows:
Financial Futures
BSI-Multinvest Financial Futures Financial Futures on bonds (bought) on bonds (sold)
– Emerging Markets Bonds - USD 615 234.38 USD
– Global Credit Bond - EUR 13 655 779.02 EUR
– Global Dynamic Bonds 20 951 640.12 EUR - EUR
– Short Term Bonds CHF - CHF 2 558 250.42 CHF
– Short Term Bonds USD - USD 27 296 250.00 USD
BSI-Multinvest Financial Futures Financial Futures on Indices (bought) on Indices (sold)
– Asian Stocks 13 970 853.75 USD - USD
– Global Themes 1 239 902.96 USD - USD
– Strategy Balanced (CHF) 1 135 680.00 CHF - CHF
– Strategy Balanced (EUR) 2 486 400.00 EUR - EUR
– Strategy Income (CHF) - CHF 7 998 461.77 CHF
– Strategy Income (EUR) - EUR 10 256 400.00 EUR
– Swiss Stocks 405 600.00 CHF - CHF
– US Stocks - USD 552 300.00 USD
BSI-Multinvest Financial Futures Financial Futures on interest rates on interest rates (bought) (sold)
– Cash USD 4 469 625.00 USD - USD
The broker for Financial Futures is BSI AG, Via Magatti 2, CH-6901 Lugano.
Note 7 – Total Expense Ratio (TER)
This ratio was calculated in accordance with the Swiss Funds & Asset Management Association (SFAMA) “Guidelines on the calculation and disclosure of the TER and PTR” in the current version and expresses the sum of all costs and commissions charged on an ongo-ing basis to the net assets (operating expenses) taken retrospectively as a percentage of the net assets.
TER for the last 12 months:
BSI-Multinvest Total Expense thereof proportional Ratio (TER) performance fee
– Absoluta Daily A 1.90% 0.06%
– Absoluta Daily A (CHF hedged) 1.85% 0.03%
– Absoluta Daily A (USD hedged) 1.92% 0.07%
– Absoluta Daily L (USD hedged) 1.22% 0.00%
– Alternative UCITS A 3.17% 0.15%
– Asian Stocks A 1.75% 0.00%
– Asian Stocks A (CHF hedged) 1.75% 0.00%
– Asian Stocks A (EUR hedged) 1.75% 0.00%
– Asian Stocks I 0.73% 0.00%
– Bonds CHF A* 0.95% 0.00%
– Bonds EUR A** 0.95% 0.00%
– Bonds USD A*** 0.95% 0.00%
– Cash CHF A 0.27% 0.00%
– Cash EUR A 0.44% 0.00%
– Cash USD A 0.36% 0.00%
– Emerging Markets Bonds A 1.45% 0.00%
– Emerging Markets Bonds A (EUR hedged) 1.45% 0.00%
– Global Credit Bond A 2.26% 1.20%
– Global Credit Bond A (CHF hedged) 2.25% 1.19%
– Global Credit Bond A (USD hedged) 2.29% 1.23%
– Global Dynamic Bonds A 1.14% 0.00%
– Global Dynamic Bonds A (CHF hedged) 1.14% 0.00%
– Global Dynamic Bonds A (USD hedged) 1.14% 0.00%
– Global Themes A 3.03% 0.00%
– Global Themes A (CHF hedged) 3.01% 0.00%
– Global Themes A (EUR hedged) 3.03% 0.00%
– Short Term Bonds CHF A 0.90% 0.00%
– Short Term Bonds EUR A 0.95% 0.00%
– Short Term Bonds USD A 0.95% 0.00%
– Strategy Balanced (CHF) A 2.21% 0.00%
– Strategy Balanced (EUR) A 2.30% 0.00%
– Strategy Balanced (EUR) A (USD hedged) 2.29% 0.00%
– Strategy Income (CHF) A 2.05% 0.00%
– Strategy Income (EUR) A 2.14% 0.00%
– Swiss Stocks A 1.65% 0.00%
– Swiss Stocks I 0.36% 0.00%
– US Stocks A 2.59% 0.00%
* formerly BSI-Multinvest – Long Term Bonds CHF** formerly BSI-Multinvest – Long Term Bonds EUR*** formerly BSI-Multinvest – Long Term Bonds USD
TER for classes of shares which were active less than a 12 month period are annualised.
Transaction costs and any other costs incurred in connection with currency hedging are not included in the TER.
Annual Report as of 31 December 2013 BSI-Multinvest
142 The notes are an integral part of the financial statements.
Note 8 – Portfolio Turnover Rate (PTR)
This ratio was calculated in accordance with the Swiss Funds & Asset Management Association (SFAMA) “Guidelines on the calculation and disclosure of the TER and PTR” in the current version. The PTR is considered as an indicator of the relevance of the additional costs incurred when buying and selling investments. It shows how many security transactions occurred as a result of voluntary investment shifts in relation to the average net assets. Transactions that resulted from uncontrollable subscriptions and redemptions are not included in this rate.
BSI-Multinvest Portfolio Turnover Rate (PTR)
– Absoluta Daily 90.54%
– Alternative UCITS 31.62%
– Asian Stocks 246.89%
– Bonds CHF* -51.18%
– Bonds EUR** 71.07%
– Bonds USD*** 24.12%
– Cash CHF 87.07%
– Cash EUR 108.03%
– Cash USD 43.22%
– Emerging Markets Bonds 3.97%
– Global Credit Bond 59.79%
– Global Dynamic Bond 91.63%
– Global Themes 149.18%
– Short Term Bonds CHF -39.33%
– Short Term Bonds EUR 12.31%
– Short Term Bonds USD -15.18%
– Strategy Balanced (CHF) 186.98%
– Strategy Balanced (EUR) 139.23%
– Strategy Income (CHF) 172.71%
– Strategy Income (EUR) 155.66%
– Swiss Stocks 69.75%
– US Stocks 125.27%
* formerly BSI-Multinvest – Long Term Bonds CHF** formerly BSI-Multinvest – Long Term Bonds EUR*** formerly BSI-Multinvest – Long Term Bonds USD
Note 9 – Transaction costs
Transaction costs include brokerage fees, stamp duty, local taxes and other foreign charges if incurred during the fiscal year. Transaction fees are included in the cost of securities purchased and the realized gain (loss).
For the year ended on 31 December 2013, the Company incurred transaction costs relating to purchase or sale of investments in securities and similar transactions as follows:
BSI-Multinvest Transaction costs
– Absoluta Daily 13 767.34 EUR
– Alternative UCITS 30.00 EUR
– Asian Stocks 2 806 842.24 USD
– Bonds CHF* 167.40 CHF
– Bonds EUR** 255.00 EUR
– Bonds USD*** 1 117.88 USD
– Cash CHF 805.13 CHF
– Cash EUR 1 740.00 EUR
– Cash USD 783.12 USD
– Emerging Markets Bonds 449.95 USD
– Global Credit Bond 3 238.78 EUR
– Global Dynamic Bond 17 244.81 EUR
– Global Themes 9 659.40 USD
– Short Term Bonds CHF 520.81 CHF
– Short Term Bonds EUR 207.50 EUR
– Short Term Bonds USD 13 883.32 USD
– Strategy Balanced (CHF) 9 780.09 CHF
– Strategy Balanced (EUR) 11 972.56 EUR
– Strategy Income (CHF) 32 883.52 CHF
– Strategy Income (EUR) 45 509.30 EUR
– Swiss Stocks 60 117.52 CHF
– US Stocks 5 500.10 USD
* formerly BSI-Multinvest – Long Term Bonds CHF** formerly BSI-Multinvest – Long Term Bonds EUR*** formerly BSI-Multinvest – Long Term Bonds USD
Not all transaction costs are separately identifiable. For fixed income investments, forward currency contracts and other derivative contracts, transaction costs will be included in the purchase and sale price of the invest-ment. Whilst not separately identifiable these transac-tion costs will be captured within the performance of each subfund.
Note 10 – Name change
With effect as per 28 October 2013 the below menti-oned subfunds were renamed as follows:
BSI-Multinvest – Long Term Bonds CHFBSI-Multinvest – Long Term Bonds EURBSI-Multinvest – Long Term Bonds USD
into
BSI-Multinvest – Bonds CHFBSI-Multinvest – Bonds EURBSI-Multinvest – Bonds USD
Annual Report as of 31 December 2013 BSI-Multinvest
143The notes are an integral part of the financial statements.
Note 11 – Equalisation
Positions marked with an asterisk in the Statement of Investments in Securities and other Net Assets are equalisation positions. In the context of alterna-tive investment funds, any open ended fund that pays incentive or performance fees, the term “Equalisation” refers to an accounting methodology, designed to ensure that not only the investment manager is paid the correct incentive, performance or profit sharing fee, but also that the incentive fees are fairly allocated bet-ween each investor in the Company.
Note 12 – Applicable law, place of performance and authoritative language
The Luxembourg District Court is the place of perfor-mance for all legal disputes between the shareholders, the Company and the Custodian Bank. Luxembourg law applies. However, in matters concerning the claims of investors from other countries, the Company and/or the Custodian Bank can elect to make themselves and the Company subject to the jurisdiction of the countries in which the Company shares were bought and sold.
The English version of these financial statements is the authoritative version and only this version was audited by the auditors. However, in the case of shares sold to investors from the other countries in which Company shares can be bought and sold, the Company and the Custodian Bank may recognize approved translations (i.e. approved by the Company and the Custodian Bank) into the languages concerned as binding upon them-selves and the Company.
Annual Report as of 31 December 2013 BSI-Multinvest
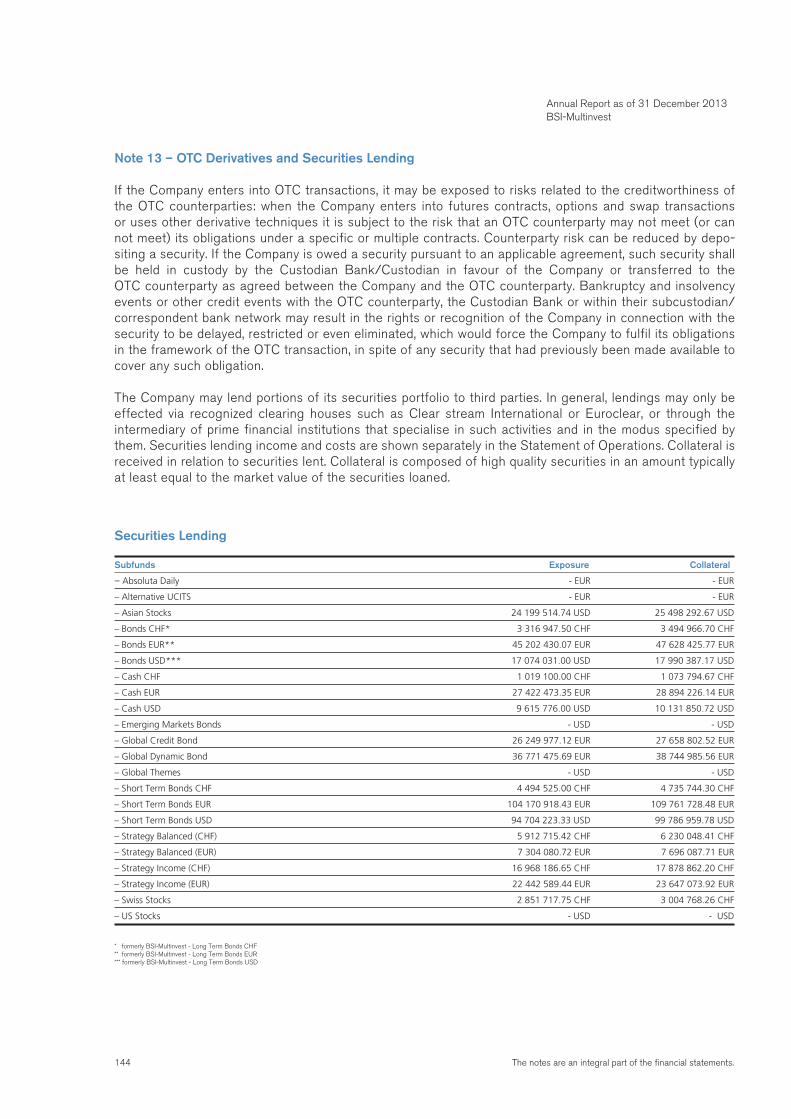
144 The notes are an integral part of the financial statements.
Annual Report as of 31 December 2013 BSI-Multinvest
Note 13 – OTC Derivatives and Securities Lending
If the Company enters into OTC transactions, it may be exposed to risks related to the creditworthiness of the OTC counterparties: when the Company enters into futures contracts, options and swap transactions or uses other derivative techniques it is subject to the risk that an OTC counterparty may not meet (or can not meet) its obligations under a specific or multiple contracts. Counterparty risk can be reduced by depo-siting a security. If the Company is owed a security pursuant to an applicable agreement, such security shall be held in custody by the Custodian Bank/Custodian in favour of the Company or transferred to the OTC counterparty as agreed between the Company and the OTC counterparty. Bankruptcy and insolvency events or other credit events with the OTC counterparty, the Custodian Bank or within their subcustodian/correspondent bank network may result in the rights or recognition of the Company in connection with the security to be delayed, restricted or even eliminated, which would force the Company to fulfil its obligations in the framework of the OTC transaction, in spite of any security that had previously been made available to cover any such obligation.
The Company may lend portions of its securities portfolio to third parties. In general, lendings may only be effected via recognized clearing houses such as Clear stream International or Euroclear, or through the intermediary of prime financial institutions that specialise in such activities and in the modus specified by them. Securities lending income and costs are shown separately in the Statement of Operations. Collateral is received in relation to securities lent. Collateral is composed of high quality securities in an amount typically at least equal to the market value of the securities loaned.
Securities Lending
Subfunds Exposure Collateral
– Absoluta Daily - EUR - EUR
– Alternative UCITS - EUR - EUR
– Asian Stocks 24 199 514.74 USD 25 498 292.67 USD
– Bonds CHF* 3 316 947.50 CHF 3 494 966.70 CHF
– Bonds EUR** 45 202 430.07 EUR 47 628 425.77 EUR
– Bonds USD*** 17 074 031.00 USD 17 990 387.17 USD
– Cash CHF 1 019 100.00 CHF 1 073 794.67 CHF
– Cash EUR 27 422 473.35 EUR 28 894 226.14 EUR
– Cash USD 9 615 776.00 USD 10 131 850.72 USD
– Emerging Markets Bonds - USD - USD
– Global Credit Bond 26 249 977.12 EUR 27 658 802.52 EUR
– Global Dynamic Bond 36 771 475.69 EUR 38 744 985.56 EUR
– Global Themes - USD - USD
– Short Term Bonds CHF 4 494 525.00 CHF 4 735 744.30 CHF
– Short Term Bonds EUR 104 170 918.43 EUR 109 761 728.48 EUR
– Short Term Bonds USD 94 704 223.33 USD 99 786 959.78 USD
– Strategy Balanced (CHF) 5 912 715.42 CHF 6 230 048.41 CHF
– Strategy Balanced (EUR) 7 304 080.72 EUR 7 696 087.71 EUR
– Strategy Income (CHF) 16 968 186.65 CHF 17 878 862.20 CHF
– Strategy Income (EUR) 22 442 589.44 EUR 23 647 073.92 EUR
– Swiss Stocks 2 851 717.75 CHF 3 004 768.26 CHF
– US Stocks - USD - USD
* formerly BSI-Multinvest - Long Term Bonds CHF** formerly BSI-Multinvest - Long Term Bonds EUR*** formerly BSI-Multinvest - Long Term Bonds USD
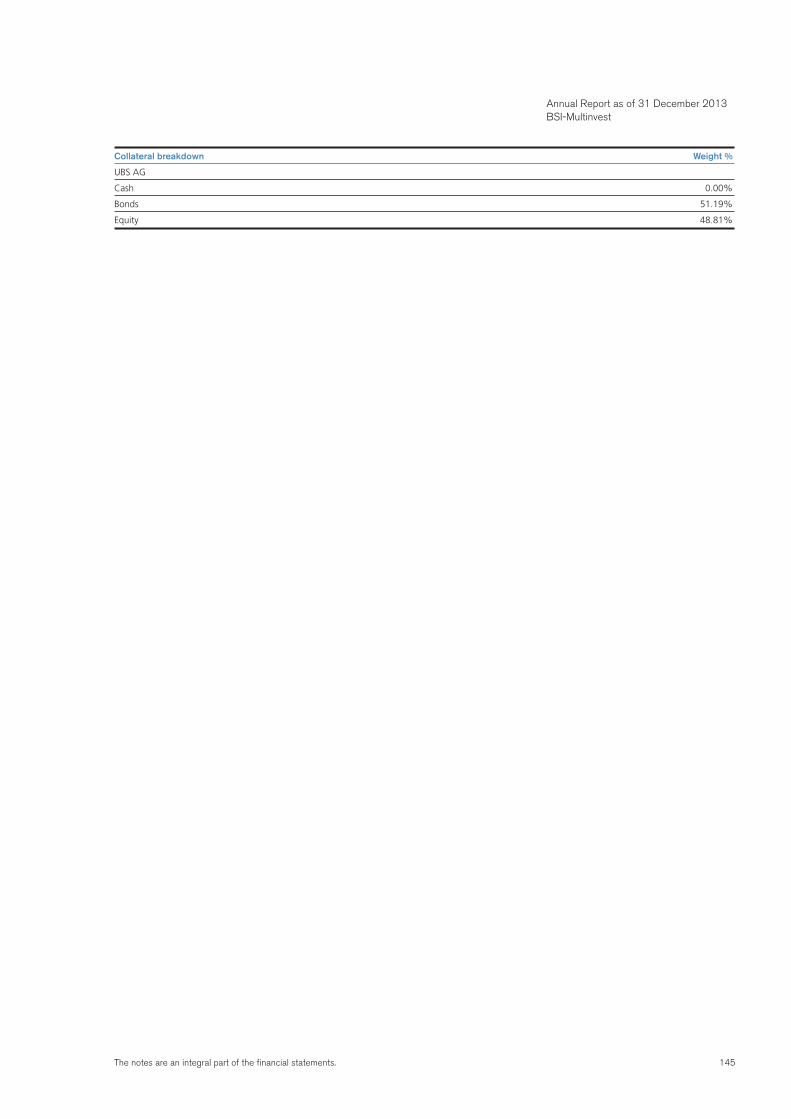
145The notes are an integral part of the financial statements.
Collateral breakdown Weight %
UBS AG
Cash 0.00%
Bonds 51.19%
Equity 48.81%
Annual Report as of 31 December 2013 BSI-Multinvest
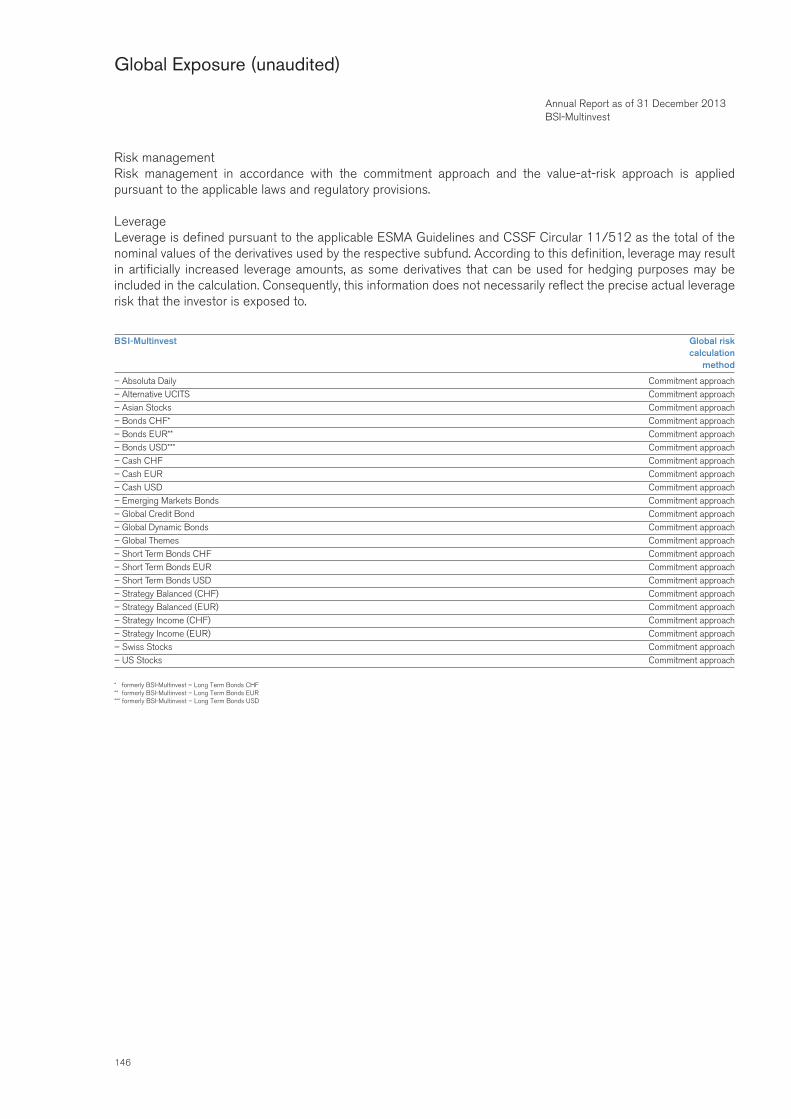
146
Global Exposure (unaudited)
Risk managementRisk management in accordance with the commitment approach and the value-at-risk approach is applied pursuant to the applicable laws and regulatory provisions.
LeverageLeverage is defined pursuant to the applicable ESMA Guidelines and CSSF Circular 11/512 as the total of the nominal values of the derivatives used by the respective subfund. According to this definition, leverage may result in artificially increased leverage amounts, as some derivatives that can be used for hedging purposes may be included in the calculation. Consequently, this information does not necessarily reflect the precise actual leverage risk that the investor is exposed to.
BSI-Multinvest Global risk calculation method
– Absoluta Daily Commitment approach– Alternative UCITS Commitment approach– Asian Stocks Commitment approach– Bonds CHF* Commitment approach– Bonds EUR** Commitment approach– Bonds USD*** Commitment approach– Cash CHF Commitment approach– Cash EUR Commitment approach– Cash USD Commitment approach– Emerging Markets Bonds Commitment approach– Global Credit Bond Commitment approach– Global Dynamic Bonds Commitment approach– Global Themes Commitment approach– Short Term Bonds CHF Commitment approach– Short Term Bonds EUR Commitment approach– Short Term Bonds USD Commitment approach– Strategy Balanced (CHF) Commitment approach– Strategy Balanced (EUR) Commitment approach– Strategy Income (CHF) Commitment approach– Strategy Income (EUR) Commitment approach– Swiss Stocks Commitment approach– US Stocks Commitment approach
* formerly BSI-Multinvest – Long Term Bonds CHF** formerly BSI-Multinvest – Long Term Bonds EUR*** formerly BSI-Multinvest – Long Term Bonds USD
Annual Report as of 31 December 2013 BSI-Multinvest