Embed Size (px)
Citation preview

40Ar/39Ar geochronology of igneous rocks in the Taylor Mountains and Dillingham quadrangles in SW Alaska
by Alexander Iriondo1,2, Michael J. Kunk1, and Frederic H. Wilson3
1 U.S. Geological Survey, Denver, Colorado 2 University of Colorado at Boulder, Boulder, Colorado 3 U.S. Geological Survey, Anchorage, Alaska
Open-File Report 03-421
2003
This report is preliminary and has not been reviewed for comformity with U.S. Geological Survey editorial standards or with the North American Stratigraphic Code.
Any use of trade, firm, or product names is for descriptive purposes only and does not imply endorsement by the U.S. Government.
U.S. Department of the Interior U.S. Geological Survey

INTRODUCTION
This publication contains 40Ar/39Ar geochronology data for 53 mineral and rock analyses
from 48 igneous rocks collected in the Taylor Mountains and Dillingham 1:250,000-scale
quadrangles in southwestern Alaska (Figures 1 & 2). Wilson and others (2003) present detailed
geologic descriptions of these igneous samples. This open file report includes a summary table
containing information on the rock type, geographic location, mineral dated, type of age, age and
analytical error (Table 1). The analyses were conducted at the U.S. Geological Survey (USGS)
Argon Thermochronology Laboratory in Denver, Colorado. The results presented here are
intended only as a preliminary publication of these geochronologic studies; the data are not
interpreted in a geologic context. Therefore, users unfamiliar with argon isotopic data should use
these results carefully. This report is primarily a detailed source document for subsequent
scientific publications and maps that will integrate this data into a geologic context.
METHODS
Sample Preparation
All of the igneous rocks were crushed, ground, and sized using 250, 180, and 150 µm
sieves (60, 80, and 100 mesh respectively). Mineral separates of hornblende, muscovite, biotite,
K-feldspar, and plagioclase were produced using magnetic separation, heavy liquids and hand
picking to achieve a purity of >99%. We used the largest size fraction possible of the target
mineral that is free of inclusions from other mineral phases. Basalt, andesite, and rhyolite samples
were processed through heavy liquids and or magnetic separation to remove phenocrysts from the
volcanic matrix. The resulting volcanic matrix samples were leached at room temperature with
10% HCl to remove any traces of secondary calcite. All samples were washed in acetone, alcohol,
Page 2 of 32

Figure 1. Location of dated rocks in the Taylor Mountains and Dillingham quadrangles, Alaska. Gray areas correspond to outcrops of Late Cretaceous Early Tertiary igneous rocks.
01AWS-41biotite
60.41 ± 0.06 Ma00AWS-22
biotite66.55 ± 0.07 Ma
01AH-83muscovite
67.18 ± 0.28 Ma
01AH-85Ahornblende
75.22 ± 0.32 Ma
Area of Figure 2
00AWS-39biotite
61.86 ± 0.44 Ma
AL00plagioclase
41.62 ± 0.18 Ma
00AWS-13Abiotite
65.81 ± 0.06 Ma00AWS-15Abiotite
67.94 ± 0.04 Ma
00AWS-12biotite
84.49 ± 0.05 Ma
00AWS-31Abiotite
64.45 ± 0.11 Ma
99AWS-17biotite
67.69 ± 0.04 Ma
99AM-309Cbiotite
68.80 ± 0.07 Ma
0 5 10 15
0 5 10 15
Miles
Kilometers
N
KEMUKbiotite
86.05 ± 0.08 Ma
Alaska
61°
159°
61°
156°
59°156°
59°159°
Area of Figure 1
Page 3 of 32
156.75° 156° 60° 60°
01AM-109A biotite
59.25 ± 0.05 Ma
00AWS-16 biotite
59.69 ± 0.05 Ma
01AWS-61 biotite
59.34 ± 0.03 Ma
01AWS-78 biotite
60.90 ± 0.04 Ma
01AWS-59 biotite
61.65 ± 0.05 Ma
01AWS-39 hornblende
biotite 60.07 ± 0.25 Ma 60.93 ± 0.65 Ma
01AH-70 K-spar
58.40 ± 0.20 Ma
01AH-80 K-spar
58.30 ± 0.20 Ma 01AWS-55
volcanic matrix 53.71 ± 0.61 Ma
01AWS-49 volcanic matrix
47.95 ± 1.39 Ma
01AH-67 hornblende
61.30 ± 0.20 Ma
00AWS-37 biotite
63.09 ± 0.05 Ma
01AH-63 biotite
65.26 ± 0.06 Ma
01AWS-48 biotite
65.72 ± 0.04 Ma
01AH-64 biotite
66.49 ± 0.07 Ma
01AH-69 biotite
64.42 ± 0.04 Ma 01AH-65 hornblende
60.60 ± 0.30 Ma
00AWS-35A biotite
61.67 ± 0.05 Ma
01AWS-50 biotite
61.11 ± 0.07 Ma
01AWS-2 hornblende
63.77 ± 0.27 Ma
01AH-59 biotite
65.50 ± 0.05 Ma01AH-62 biotite
65.75 ± 0.03 Ma 01AWS-46
biotite 66.24 ± 0.08 Ma
01AWS-67B plagioclase
45.10 ± 0.19 Ma 01AWS-24
biotite 61.70 ± 0.06 Ma
01AWS-60 volcanic matrix
44.38 ± 0.38 Ma
01AWS-57 biotite
61.57 ± 0.06 Ma
00AWS-38 biotite
61.15 ± 0.04 Ma
01APC-18 biotite
61.28 ± 0.05 Ma
01APC-20 biotite
61.30 ± 0.05 Ma
01APC-23 biotite
61.64 ± 0.05 Ma
01APC-25 biotite
61.26 ± 0.05 Ma
01AWS-80 biotite
61.63 ± 0.05 Ma
01AWS-64 hornblende
64.20 ± 0.27 Ma
N
0 1 2 3 4 Miles
Kilometers 0 1 2 3 4 5
01AWS-67 volcanic matrix
44.47 ± 0.41 Ma
59.5° 59.5° 156.75° 156°
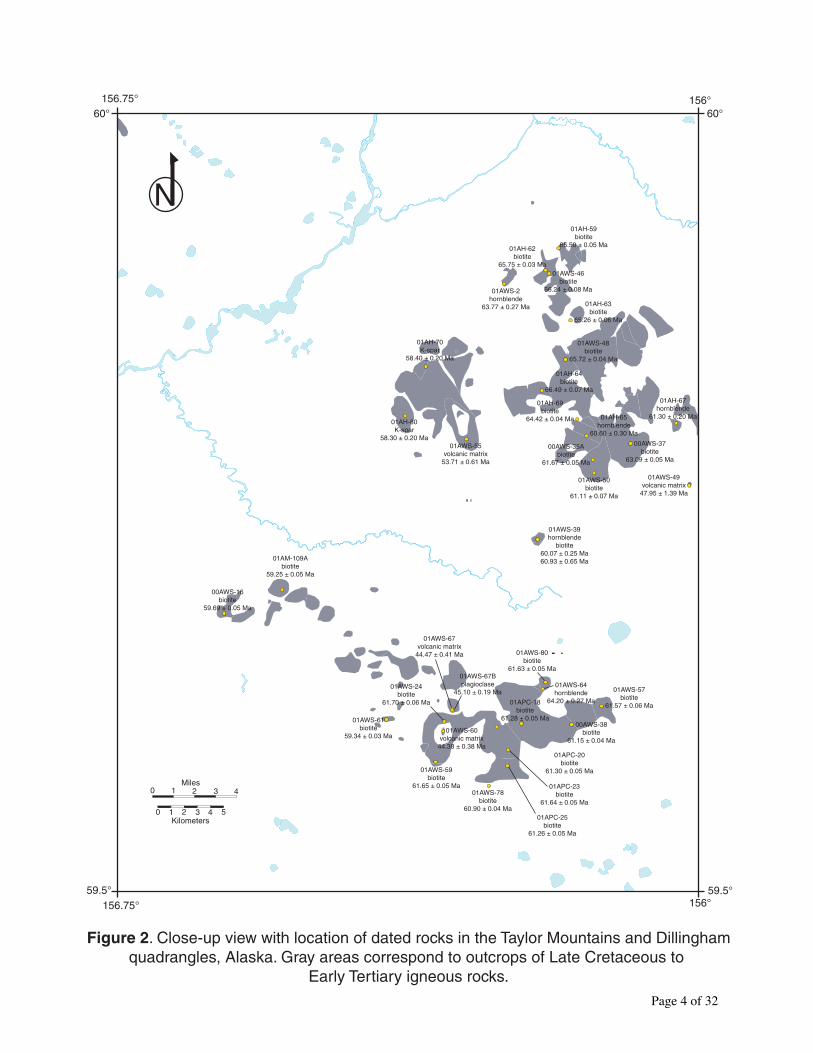
Figure 2. Close-up view with location of dated rocks in the Taylor Mountains and Dillingham quadrangles, Alaska. Gray areas correspond to outcrops of Late Cretaceous to
Early Tertiary igneous rocks.
Page 4 of 32

and triply deionized water in a Branson B-220 ultrasonic cleaner to remove dust-sized particles
and then re-sieved by hand.
Aliquots of sample were packaged in copper capsules and sealed under vacuum in quartz
tubes. The samples were then irradiated for 16 hours (irradiation package KD25) in an aluminum
container in the central thimble facility at the TRIGA reactor (GSTR) at the USGS in Denver,
Colorado. The monitor mineral used was Fish Canyon Tuff (FCT-3) sanidine with an age of 27.79
Ma (Kunk and others, 1985; Cebula and others, 1986) relative to MMhb-1 with an age of 519.4 ±
2.5 Ma (Alexander and others, 1978; Dalrymple and others, 1981). The type of container and the
geometry of samples and standards is similar to that described by Snee and others (1988).
Sample Analysis
The samples were analyzed using the 40Ar/39Ar step-heating method of dating using a VG
Isotopes Ltd., Model 1200B Mass Spectrometer fitted with an electron multiplier. The samples
were heated for 10 minutes per step on a schedule of four to seventeen steps per sample. The
number and temperature of heating steps was selected to limit the percentage of gas released to
less than 20 percent per step for most samples. Additional biotite aliquots were also melted in a
single heating step to produce total fusion ages.
Heating of samples was done in a small volume, molybdenum-lined, low blank tantalum
furnace similar to that described by Staudacher and others (1978). The temperature was monitored
by a W5Re-W26Re thermocouple and controlled by a proportional programmable controller. The
furnace and the rear manifold of the extraction system were pumped between steps with a turbo
molecular pump. Two isolated ion pumps evacuated the front manifold and the mass spectrometer
tube between each incremental step. The gas to be analyzed was purified in the first manifold by a
SAES ST707 Zr-V-Fe getter operated at room temperature and by a hot tungsten filament to break
Page 5 of 32

up hydrocarbons. Gas was equilibrated with the second manifold with an empty cold finger in the
first manifold at LN2 temperature to trap water and other condensibles, then isolated and cleaned
in the front manifold with a SAES ST101 Al-Zr getter operated at 4000 C and with a Ti getter
operated at 3500 C.
An activated charcoal finger submerged in an equilibrated mixture of dry ice and acetone
was used to remove gasses with a molecular weight greater than 60 or 80 (primarily other noble
gasses) prior to expansion of the argon dominated gas into the mass spectrometer. A second SAES
ST101 active gas getter operated at room temperature further purified the argon-rich gas in the
mass spectrometer. Its successful operation could be monitored by the consistent drop in counts of
mass 44 (dominated by CO2) after the first gas analysis cycle. Argon isotopes with masses 40
through 36 and CO2 (mass 44) were analyzed as a function of time in five analysis cycles. 40Ar,
39Ar, 38Ar, 37Ar, and 36Ar peaks and their baselines, were measured for five-second integrations in
each of the five cycles. All phases of the sample heating, cleanup, equilibration and sample
analysis were performed under computer control.
Isotopic Data Reduction
All argon isotopic data were reduced using an updated version of the computer program
ArAr* (Haugerud and Kunk, 1988), using the decay constants recommended by Steiger and Jäger
(1977). The net peak measurements made in the five-cycle analysis were regressed using standard
linear regression techniques to time zero. Sample blanks measured before the analyses were
subtracted from the regressed results for 40Ar, 39Ar, 37Ar and 36Ar. Error estimates of the blanks
were quadratically combined with the regression errors and propagated through the error
equations.
Page 6 of 32
Corrections for interfering reactor-produced argon isotopes from Ca, K, and Cl in the
sample were made using the production ratios given in Dalrymple and others (1981) and Roddick
(1983). Errors in calculating ages or ratios include the measurement errors in the analysis, decay
factor uncertainties, measured atmospheric or calculated initial 40Ar/36Ar ratios, the irradiation
parameter J, the production ratios of the various reactor induced argon producing reactions, the
initial 38Ar/36Ar ratio, and the age of the monitor (Haugerud and Kunk, 1988).
The data table (Table 2) and 40Ar/39Ar diagrams presented in this report (Figures 3 to 12)
include the identification of individual step ages, total gas ages, plateau ages, average ages, total
fusion ages and inverse isochron ages.
An individual step age represents the apparent age obtained for a single temperature step
analysis. Total gas ages represent the age calculated from the addition of all of the measured argon
peaks for all steps in a single sample and are roughly equivalent to conventional K-Ar ages. No
analytical precision is calculated for total gas ages. Plateau ages were determined using the
definition of Fleck and others (1977) as modified by Haugerud and Kunk (1988). Average ages are
calculated in the same manner as a plateau age but fail the definition of Fleck and others (1977). A
total fusion age represents the age calculated from totally melting the sample in a single step.
Inverse isotope correlation analysis of the analytical data to assess if non-atmospheric argon
components were trapped in any samples and to calculate an inverse isochron age was done using
the method of York (1969). For additional information on the sample data reduction procedure see
Haugerud and Kunk (1988).
Page 7 of 32

RESULTS
40Ar/39Ar Geochronology Data
The 40Ar/39Ar geochronology results are presented in age-spectra diagrams that plot the
cumulative percent 39ArK of the steps against apparent age in millions of years (Figures 3 to 12).
The precision estimate used to construct the error boxes of each step is displayed at the 95%
confidence level (2 sigma). The upper, smaller graph plots the apparent K/Ca ratio of each step
against cumulative 39ArK released.
In addition, data are presented in tabular form (Table 2). The table starts with a line that
gives the sample number, the material analyzed, and the J-value with its analytical uncertainty, the
sample weight in milligrams, and the packet and package number from the irradiation. The table
includes the temperature of the step, the percent of potassium derived 39ArK for each step, the
radiogenic yield (percentage of 40ArR that is derived from the decay of potassium), moles of 39ArK,
a corrected 40ArR/39ArK ratio from which the age can be directly calculated, apparent K/Ca, and
K/Cl ratios for each step, a calculated apparent age for the step (in millions of years), and an
estimate of the precision of each age at the 98% confidence level (1 sigma). The sample precision
includes estimates of the errors that are unique to a single sample and can be used only for
comparisons with other steps of the same sample. This error estimate does not include the error in
"J". The last line in the table represents the total gas results for the sample. Note that no analytical
error is calculated for the age in this line. If the sample has a plateau age, the percentage of 39Ar on
the plateau, the steps on the plateau, and the plateau age and its precision are indicated.
We have calculated isochron ages using inverse-isotope correlation diagrams that plot
39Ar/40Ar against 36Ar/40Ar (Figures 3 to 12). When reporting isochron ages we include the
apparent age of the sample (calculated from the inverse of the x-axis intercept), the calculated
Page 8 of 32

initial 40Ar/36Ar ratio of the sample (the inverse of the y-axis intercept), the MSWD a goodness of
fit indicator of the data (Mean Standard of Weighted Deviates), the number of steps used in the
age regression, and the percentage of 39Ar they represent.
ACKNOWLEDGEMENTS
We would like to thank Roy George for his assistance preparing mineral separates and
Jeffrey Winick for his help running samples and reducing data.
REFERENCES
Alexander, E. C., Jr., Mickelson, G. M., and Lanphere, M. A., 1978, Mmhb-1: a new 40Ar/39Ar
dating standard, in Zartman, R. E., ed., Short papers of the fourth international conference,
geochronology, cosmochronology, and isotope geology: U.S. Geological Survey Open-File
Report 78-701, p. 6-8.
Cebula, G. T., Kunk, M. J., Mehnert, H. H., Naeser, C. W., Obradovich, J. D., and Sutter, J. F.,
1986, The Fish Canyon Tuff: A potential standard for the 40Ar/39Ar and fission track dating
methods: Terra Cognita, v. 6, n. 2, p. 140.
Dalrymple, G. B., Alexander, E. C., Lanphere, M. A., and Kraker, G. P., 1981, Irradiation of
samples for 40Ar/39Ar dating using the Geological Survey TRIGA reactor: U.S. Geological
Survey Professional Paper 1176, 55 p.
Fleck, R. J., Sutter, J. F., and Elliot, D. H., 1977, Interpretation of discordant 40Ar/39Ar age spectra
of Mesozoic tholeiites from Antarctica: Geochimica et Cosmochimica Acta, v. 41, p. 15-
32.
Page 9 of 32
Haugerud, R. A., and Kunk, M. J., 1988, ArAr*, a computer program for reduction of 40Ar-39Ar
data: U.S. Geological Survey, Open-File Report 88-261, 68 p.
Kunk, M. J., Sutter, J. F., and Naeser, C. W., 1985, High-precision 40Ar/39Ar Ages of sanidine,
biotite, hornblende, and plagioclase from the Fish Canyon Tuff, San Juan Volcanic Field,
South-central Colorado [abs.]: Geological Society of America Abstracts with Programs, v.
17, p. 636.
Roddick, J. C., 1983, High precision calibration of 40Ar-39Ar standards: Earth and Planetary
Science Letters, v. 47, p. 887-898.
Snee, L. W., Sutter, J. F., and Kelly, W. C., 1988, Thermochronology of economic mineral
deposits: Dating the stages of mineralization at Panasqueira, Portugal, by high precision
40Ar/39Ar age spectrum techniques on muscovite: Economic Geology, v. 83, p. 335-354.
Staudacher, Thomas, Jessberger, E. K., Dorflinger, D., and Kiko, J., 1978, A refined ultrahigh-
vacuum furnace for rare gas analysis: J. Phys. E: Sci. Instrum. v. 11, p. 781-784.
Steiger, R. H., and Jäeger, Emil, 1977, Subcommission on geochronology: Convention on the use
of decay constants in geo- and cosmo-chronology: Earth and Planetary Science Letters, v.
36, p. 359-363.
Wilson, F. H., Hudson, T. L., Grybeck, Donald, Stoeser, D. B., Preller, C. C., Bickerstaff, Damon,
Labay, Keith, and Miller, M. L., 2003, Preliminary geologic map of the northeast
Dillingham quadrangle (D-1, D-2, C-1, and C-2), Alaska: U.S. Geological Survey, Open-
File Report 03-105, 13 p.
York, Derick, 1969, Least squares fitting of a straight line with correlated errors: Earth and
Planetary Science Letters, v. 5, p. 320-324.
Page 10 of 32

Table 1. Summary table for dated igneous rocks from the Taylor Mountains and Dillingham quadrangles in SW Alaska.
Sample Rock type Latitude Longitude Mineral Type of age Age Error Description
number deg. N deg. W (Ma) (Ma)
00AWS-12 Syenite 59.461 158.199 biotite total fusion 84.49 ± 0.05� Okstukuk Hills at VABM Kokwok. Biotite granite or syenite having very coarse feldspar laths, medium-grained very fresh biotite and fine-grained clinopyroxene.
00AWS-13A Granodiorite 59.304 158.121 biotite total fusion 65.81 ± 0.06 East side Muklung Hills. Biotite-hornblende granodiorite containing abundant hornblende and biotite. Biotite slightly chloritized, hornblende in fair shape.
00AWS-15A Biotite granite 59.329 158.301 biotite total fusion 67.94 ± 0.04 Main part, Muklung Hills. Nearly hypabyssal appearing biotite granite having very fresh biotite and abundant K-feldspar. Fair to poor hornblende
00AWS-16 Dacite tuff 59.675 156.605 biotite total fusion 59.69 ± 0.05 Stuyahok Hills. Hornblende-biotite dacite porphyry. Contains excellent fresh biotite, hornblende fresh but loaded with biotite inclusions.
00AWS-22 Granodiorite 60.041 156.820 biotite total fusion 66.55 ± 0.07 Northeast end of Sleitat Mountain ridge. Biotite-hornblende granodiorite(?) intruding Kuskokwim Fm. Excellent biotite, poor hornblende.
00AWS-31A Biotite granite 59.703 157.987 biotite total fusion 64.45 ± 0.11 Small cirque of northeast side of Kemuk Mountain. Medium-grained biotite granite, deep weathering rinds, slightly vuggy. Good biotite.
00AWS-35A Quartz monzodiorite 59.778 156.134 biotite total fusion 61.67 ± 0.05� Large tor of biotite granite. Coarse, almost pegmatitic phase containing excellent biotite. Clinopyroxene is common and hornblende after clinopyroxene.
00AWS-37 Quartz monzonite 59.789 156.088 biotite total fusion 63.09 ± 0.05 Similar rock to above (35a) however biotite not as fresh and secondary hornblende more common. Plagioclase is sericitized.
00AWS-38 Granite 59.606 156.159 biotite total fusion 61.15 ± 0.04 Granite, biotite is fine-grained and in good shape, also contains clinopyroxene and common K-feldspar. No hornblende.
Page 11 of 32
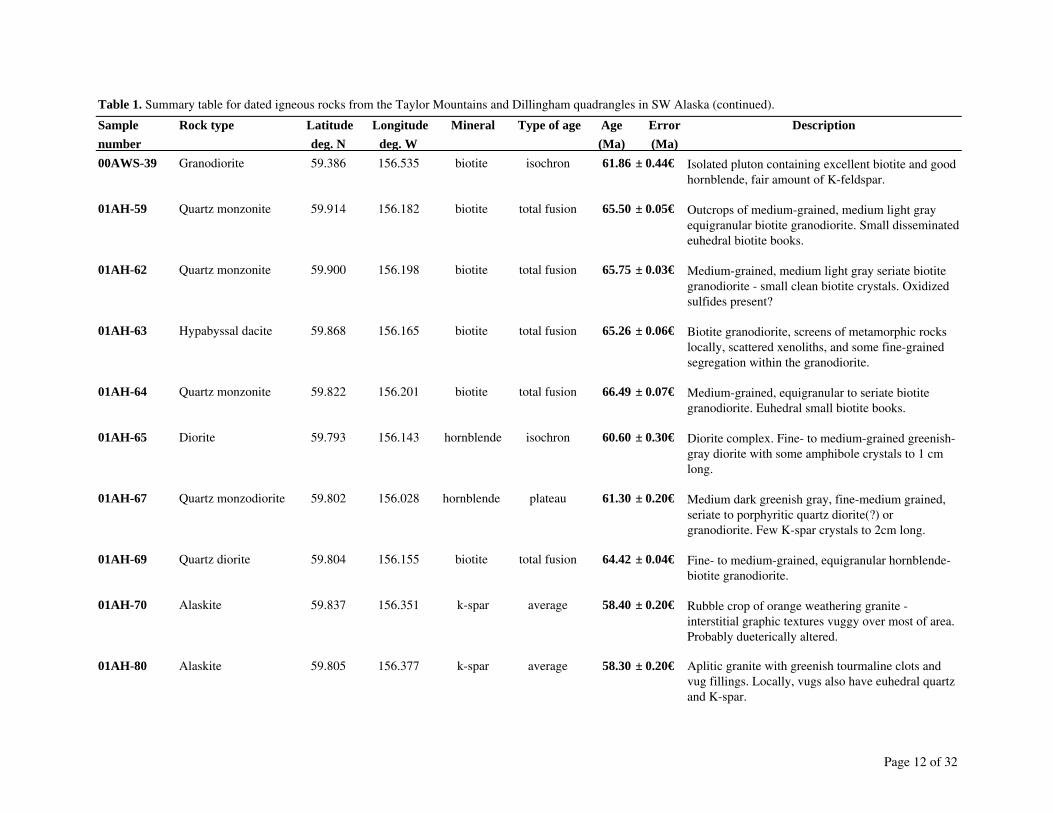
Table 1. Summary table for dated igneous rocks from the Taylor Mountains and Dillingham quadrangles in SW Alaska (continued).
Sample Rock type Latitude Longitude Mineral Type of age Age Error Description
number deg. N deg. W (Ma) (Ma)
00AWS-39 Granodiorite 59.386 156.535 biotite isochron 61.86 ± 0.44� Isolated pluton containing excellent biotite and good hornblende, fair amount of K-feldspar.
01AH-59 Quartz monzonite 59.914 156.182 biotite total fusion 65.50 ± 0.05� Outcrops of medium-grained, medium light gray equigranular biotite granodiorite. Small disseminated euhedral biotite books.
01AH-62 Quartz monzonite 59.900 156.198 biotite total fusion 65.75 ± 0.03� Medium-grained, medium light gray seriate biotite granodiorite - small clean biotite crystals. Oxidized sulfides present?
01AH-63 Hypabyssal dacite 59.868 156.165 biotite total fusion 65.26 ± 0.06� Biotite granodiorite, screens of metamorphic rocks locally, scattered xenoliths, and some fine-grained segregation within the granodiorite.
01AH-64 Quartz monzonite 59.822 156.201 biotite total fusion 66.49 ± 0.07� Medium-grained, equigranular to seriate biotite granodiorite. Euhedral small biotite books.
01AH-65 Diorite 59.793 156.143 hornblende isochron 60.60 ± 0.30� Diorite complex. Fine- to medium-grained greenish-gray diorite with some amphibole crystals to 1 cm long.
01AH-67 Quartz monzodiorite 59.802 156.028 hornblende plateau 61.30 ± 0.20� Medium dark greenish gray, fine-medium grained, seriate to porphyritic quartz diorite(?) or granodiorite. Few K-spar crystals to 2cm long.
01AH-69 Quartz diorite 59.804 156.155 biotite total fusion 64.42 ± 0.04� Fine- to medium-grained, equigranular hornblende-biotite granodiorite.
01AH-70 Alaskite 59.837 156.351 k-spar average 58.40 ± 0.20� Rubble crop of orange weathering granite -interstitial graphic textures vuggy over most of area. Probably dueterically altered.
01AH-80 Alaskite 59.805 156.377 k-spar average 58.30 ± 0.20� Aplitic granite with greenish tourmaline clots and vug fillings. Locally, vugs also have euhedral quartz and K-spar.
Page 12 of 32

Table 1. Summary table for dated igneous rocks from the Taylor Mountains and Dillingham quadrangles in SW Alaska (continued).
Sample Rock type Latitude Longitude Mineral Type of age Age Error Description
number deg. N deg. W (Ma) (Ma)
01AH-83 Muscovite granite 60.410 156.069 muscovite plateau 67.18 ± 0.28 Probably 10+ foot wide medium-grained equigranular muscovite granite dike - euhedral
01AH-85A Granodiorite 60.279 156.080 hornblende average 75.22 ± 0.32 Rubble crop of medium-grained, equigranular, medium-light gray biotite hornblende granodiorite. Both biotite and hornblende are euhedral.
01AM-109A Dacite tuff 59.691 156.531 biotite total fusion 59.25 ± 0.05 Rubble crop of fine- to medium-grained, biotite granodiorite. Biotie looks great, grainsize about 1-3 mm.
01APC-18 Granite 59.606 156.223 biotite total fusion 61.28 ± 0.05 Pegmatitic biotite granite.
01APC-20 Granite 59.604 156.254 biotite total fusion 61.30 ± 0.05 Biotite granite.
01APC-23 Granite 59.589 156.240 biotite total fusion 61.64 ± 0.05 Granite.
01APC-25 Granite 59.579 156.240 biotite total fusion 61.26 ± 0.05 Hornblende biotite granite.
01AWS-2 Quartz diorite 59.891 156.251 hornblende plateau 63.77 ± 0.27 Pike Creek. Massive, dark-gray, medium-coarse-grained hornblende-bearing intermediate intrusive rock.
01AWS-24 Granite 59.607 156.321 biotite total fusion 61.70 ± 0.06 Biotie-hornblende granodiorite with 2 cm K-spar phenocrysts. Good fresh mafic minerals. Local xenoliths.
01AWS-39 Granodiorite 59.726 156.204 biotite isochron 60.93 ± 0.65 Isolated knoll in Stuyahok River valley. Medium- to coarse-grained hornblende granodiorite.
hornblende plateau 60.07 ± 0.25 01AWS-41 Granite 60.045 157.085 biotite total fusion 60.41 ± 0.06 Sleitat pluton, tin-bearing biotite granite. 01AWS-46 Quartz monzonite 59.898 156.193 biotite total fusion 66.24 ± 0.08 Granodiorite having quite a bit of chlorite and some
epidote, little biotite. 01AWS-48 Quartz monzonite 59.842 156.171 biotite total fusion 65.72 ± 0.04 Coarse-grained biotite-hornblende granodiorite. 01AWS-49 Andesite 59.762 156.011 volc. matrix isochron 47.95 ± 1.39 Basalt plug.
Page 13 of 32

Table 1. Summary table for dated igneous rocks from the Taylor Mountains and Dillingham quadrangles in SW Alaska (continued).
Sample Rock type Latitude Longitude Mineral Type of age Age Error Description
number deg. N deg. W (Ma) (Ma)
01AWS-50 Quartz diorite? 59.769 156.133 biotite total fusion 61.11 ± 0.07 Biotite granite, south edge (?) of pluton.01AWS-55 Basalt 59.791 156.298 volc. matrix isochron 53.71 ± 0.61 Columnar jointed basalt.01AWS-57 Granite 59.618 156.122 biotite total fusion 61.57 ± 0.06 Dark colored, medium to coarse-grained hornblende-
biotite quartz monzonite or granodiorite, with large 2 cm K-spar phenocrysts.
01AWS-59 Granite 59.581 156.332 biotite total fusion 61.65 ± 0.05 Yellowish biotite granite or quartz monzonite. Another mafic could be OPX.
01AWS-60 Basalt 59.601 156.323 volc. matrix isochron 44.38 ± 0.38 Incredibly fresh columnar jointed basalt flow. 01AWS-61 Dacite tuff 59.608 156.395 biotite total fusion 59.34 ± 0.03 Fine-grained porphyritic intrusive rock. Contains
phenocrysts of very fresh biotite and feldspar in an aphanitic tuffaceous(?) matrix. Hypabyssal?
01AWS-64 Granite 59.629 156.196 hornblende plateau 64.20 ± 0.27 Coarse- to medium-grained porphyry granite. Large K-spar phenocrysts to 2 cm.
01AWS-67 Basalt 59.614 156.311 volc. matrix isochron 44.47 ± 0.41 Basalt flow - fresh, sparse olivine phenocrysts. 01AWS-67B Rhyolite 59.614 156.311 plagioclase plateau 45.10 ± 0.19 Dacite tuff. 01AWS-78 Granite 59.566 156.263 biotite total fusion 60.90 ± 0.04 Stuyahok Hills pluton. Hornblende-biotite
granodiorite with large 2-3 cm feldspar phenocrysts and common mafic xenoliths.
01AWS-80 Granite 59.633 156.193 biotite total fusion 61.63 ± 0.05 Stuyahok Hills pluton. Hornblende-biotite granodiorite with large 2-3 cm feldspar phenocrysts and common mafic xenoliths.
99AM-309C Granite? 61.014 156.031 biotite total fusion 68.80 ± 0.07 Hook pluton. Biotite granite(?) having good, but intergrown biotite and hornblende. Abundant K-feldspar.
99AWS-17 Monzodiorite 60.926 156.732 biotite total fusion 67.69 ± 0.04 Hoholitna pluton. Biotite granite or quartz monzonite intruding Kuskokwim Group. Fair biotite, hornblende secondary after clinopyroxene.
AL00 Rhyolite 59.005 156.044 plagioclase average 41.62 ± 0.18 Maroon and white banded rhyodacite porphyry, fine-grained wholy crystalline. Phenos plucked in thin-section, remnants appear fresh plagioclase.
KEMUK Pegmatitic ultramafic 59.720 157.700 biotite total fusion 86.05 ± 0.08 Kemuk iron-PGE prospect. Biotite book from core sample, hole number 6, depth 621'. Approx. location Sec. 24(?) T. 5 S., R. 50 W.
Page 14 of 32

1000A
ppar
ent A
ge (
Ma)
A
ppar
ent A
ge (
Ma)
100
Inverse-isotope correlation diagram 10
140 0.00024
120
100
0.00016
80
60
0.00008 40
20
0
00AWS-12
biotite Syenite
K/Ca
#32KD25
A B C D E F G
Average Age = 85.05 ± 0.36 Ma
H
Average Age
I J
0 0 20 40 60 80 100 0 0.01 0.02 0.03 0.04 0.05 0.06 0.07 0.08
A
B
C
DEFGHIJ
Isochron Age = 82.01 ± 6.03 Ma [40Ar/36Ar]i = 5133.15 ± 6232.71 MSWD = 0.004 Steps E through J with 75.5% of 39ArK
#32KD25
00AWS-12
biotite Syenite
Cumulative % 39ArK Released 39Ar/40Ar
1000
100
10
1
A
B
CDEFGH
I J K
Isochron Age = 61.86 ± 0.44 Ma [40Ar/36Ar]i = 463.68 ± 32.37 MSWD = 0.552 Steps C through K with 90.0% of 39ArK
#18KD25
00AWS-39
biotite Granodiorite
Inverse-isotope correlation diagram100
90 0.003
80
70
60 0.002
50
40
30
00AWS-39
biotite Granodiorite
K/Ca
#18KD25
A
B C D E F G
Average Age = 62.25 ± 0.26 Ma
H I J K
Average Age
0.001
20
10
0 0 0 20 40 60 80 100 0 0.02 0.04 0.06 0.08 0.10
Cumulative % 39ArK Released 39Ar/40Ar
36A
r/40
Ar
36A
r/40
Ar
Figure 3. 40Ar/39Ar age spectra and inverse-isotope correlation diagrams for samples 00AWS-12 and 01AWS-39
Page 15 of 32

App
aren
t Age
(M
a)
App
aren
t Age
(M
a)3
2
1
Inverse-isotope correlation diagram 100
01AH-65
hornblende Diorite
K/Ca
#88KD25
A
Average Age = 60.70 ± 0.20 Ma
B C
D J E F G H I
Average Age
0
90 0.0010
80
70 0.0008
60
50
0.0006 40
30
20 0.0004
10
0 0.0002 0 20 40 60 80 100
0.07 0.08 0.09 0.10 0.11
B C
D
E
F
G
H
I
J
A
01AH-65
hornblende Diorite
Isochron Age = 60.60 ± 0.30 Ma [40Ar/36Ar]i = 310 ± 6 MSWD = 3.9 Steps F through J with 61.4% of 39ArK
#88KD25
Cumulative % 39ArK Released 39Ar/40Ar
0.8
0.4
Inverse-isotope correlation diagram100
01AH-67
hornblende Quartz Monzodiorite
K/Ca
#89KD25
A-H
Plateau Age = 61.30 ± 0.20 Ma
I J K L M N O
Plateau Age
0
0.0016 90
80 0.0014
70 0.0012
60
0.0010 50
40 0.0008
30 0.0006
20
0.0004 10
0 0.0002 0 20 40 60 80 100 0.06 0.07 0.08 0.09 0.10
B
C D
E F G H
I
J
K
LM N
O
A #89KD25
01AH-67
hornblende Quartz Monzodiorite
Isochron Age = 61.20 ± 0.20 Ma [40Ar/36Ar]i = 302 ± 2 MSWD = 1.9 Steps F through O with 95.9% of 39ArK
Cumulative % 39ArK Released 39Ar/40Ar
36A
r/40
Ar
36A
r/40
Ar
Figure 4. 40Ar/39Ar age spectra and inverse-isotope correlation diagrams for samples 01AH-65 and 01AH-67
Page 16 of 32

App
aren
t Age
(M
a)
App
aren
t Age
(M
a)120
80
40
Inverse-isotope correlation diagram 100
01AH-70
k-feldspar Alaskite
K/Ca
#83KD25
A
Average Age = 58.40 ± 0.20 Ma
B D C J E F G H I K L M N O
Average Age
0
0.0005 90
80 0.0004
70
60 0.0003
50
40 0.0002
30
20 0.0001
10
00
Isochron Age = 57.80 ± 0.20 Ma [40Ar/36Ar]i = 380 ± 11 MSWD = 2.0 Steps E through N with 77.6% of 39ArK
01AH-70
k-feldspar Alaskite
#83KD25
B
C D
EF
G H
I J K
L M
N
O
A
0 20 40 60 80 100 0.100 0.104 0.108 0.112 0.116 0.120
Cumulative % 39ArK Released 39Ar/40Ar
50
40
30
Inverse-isotope correlation diagram 100
01AH-80
k-feldspar Alaskite
#81KD25
C G D
Average Age = 58.30 ± 0.20 Ma
E J O
Average Age
N M L K I H F
K/Ca
B
A
20 0.00042
90
80 0.00034
70
60 0.00026
50
40 0.00018
30
20 0.00010
10
0 0.00002 0 20 40 60 80 100 0.102 0.106 0.110 0.114 0.118 0.122
A
B
C D
E FG
H I
J
KL
M N
O Isochron Age = 58.10 ± 0.20 Ma [40Ar/36Ar]i = 305 ± 19 MSWD = 1.5 Steps D through M with 72.7% of 39ArK
#81KD25
01AH-80
k-feldspar Alaskite
Cumulative % 39ArK Released 39Ar/40Ar
36A
r/40
Ar
36A
r/40
Ar
Figure 5. 40Ar/39Ar age spectra and inverse-isotope correlation diagrams for samples 01AH-70 and 01AH-80
Page 17 of 32

10000A
ppar
ent A
ge (
Ma)
A
ppar
ent A
ge (
Ma)
1000
Inverse-isotope correlation diagram 100
01AH-83
muscovite Muscovite Granite
K/Ca
#84KD25
Plateau Age = 67.17 ± 0.28 Ma
ABC D E F G H I J K L
Plateau Age
100
90
80 0.0006
70
60
0.0004 50
40
30 0.0002
20
10
0 0 0 20 40 60 80 100 0 0.02 0.04 0.06 0.08 0.10
A B
C
D E FGH IJ
K
L
Isochron Age = 67.16 ± 0.31 Ma [40Ar/36Ar]i = 311.63 ± 11.14 MSWD = 0.377 Steps A through L with 100% of 39ArK
#84KD25
01AH-83
muscovite Muscovite Granite
Cumulative % 39ArK Released 39Ar/40Ar
10
1
0.1
A
B CDEFGHIJKL
01AH-85a
hornblende Granodiorite
Isochron Age = 74.33 ± 1.57 Ma [40Ar/36Ar]i = 423.62 ± 215.83 MSWD = 0.116 Steps F through L with 82.0% of 39ArK
#92KD25
Inverse-isotope correlation diagram100
90 0.003
80
70
60 0.002
50
40
30 0.001
20
10
0
01AH-85a
hornblende Granodiorite
K/Ca
#92KD25
Average Age = 75.22 ± 0.32 Ma
Average Age
AB CD E F G H I J K L
0 0 20 40 60 80 100 0 0.02 0.04 0.06 0.08
Cumulative % 39ArK Released 39Ar/40Ar
36A
r/40
Ar
36A
r/40
Ar
Figure 6. 40Ar/39Ar age spectra and inverse-isotope correlation diagrams for samples 01AH-83 and 01AH-85A
Page 18 of 32

10
01AWS-2
hornblende Quartz Diorite
K/Ca
#93KD25
A
B C
D E F G
Plateau Age = 63.77 ± 0.27 Ma
H I J K
Plateau Age
1
0.1
Inverse-isotope correlation diagram 0.01
A
B C
D
E
F
G
H
I JK
Isochron Age = 63.97 ± 1.75 Ma [40Ar/36Ar]i = 281.9 ± 108.07 MSWD = 0.057 Steps F through K with 70.7% of 39ArK
#93KD25
01AWS-2
hornblende Quartz Diorite
100
90
80
0.0003
App
aren
t Age
(M
a)
70
60
50
40
30
36A
r/40
Ar
0.0002
0.0001
20
10
0 0 0 0.02 0.04 0.06 0.080 20 40 60 80 100
39Ar/40ArCumulative % 39ArK Released
Figure 7. 40Ar/39Ar age spectrum and inverse-isotope correlation diagram for sample 01AWS-2
Page 19 of 32
0.10
10A
ppar
ent A
ge (
Ma)
A
ppar
ent A
ge (
Ma)
1
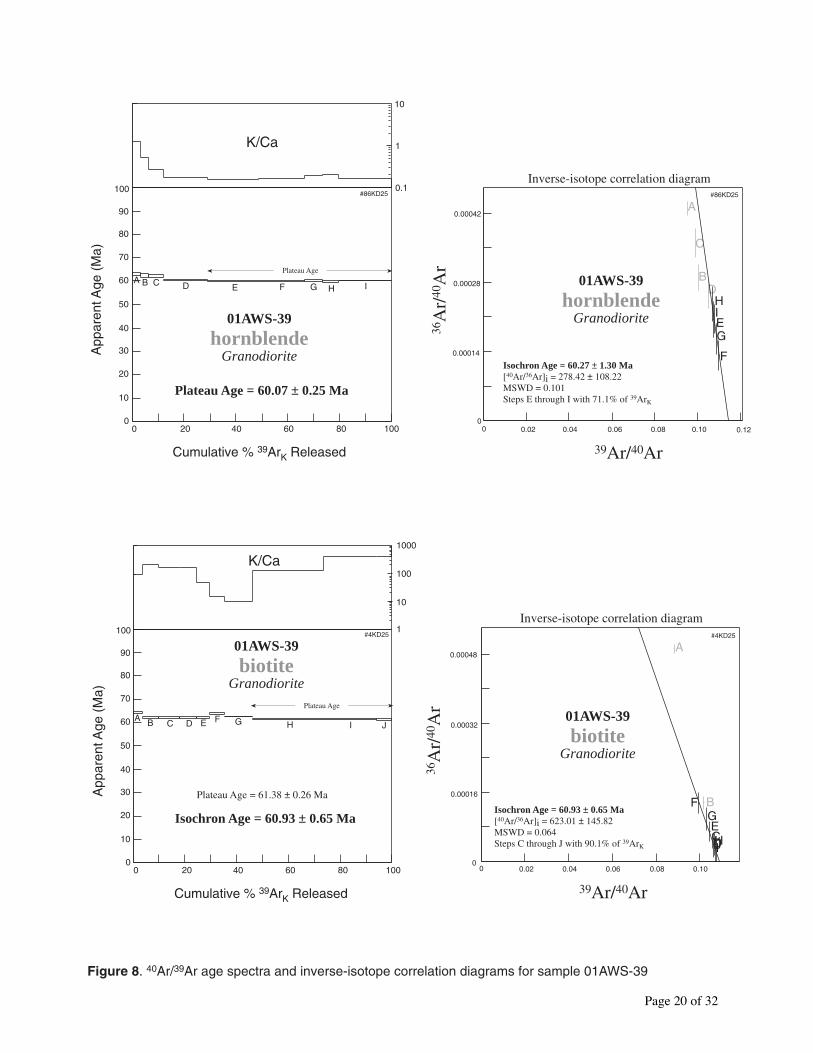
Inverse-isotope correlation diagram 100
01AWS-39
hornblende Granodiorite
K/Ca
#86KD25
A B C D E F G
Plateau Age = 60.07 ± 0.25 Ma
H I
Plateau Age
0.1
90 0.00042
80
70
60 0.00028
50
40
30 0.00014
20
10
0 0 0 20 40 60 80 100 0 0.02 0.04 0.06 0.08 0.10
A
B
C
D
E
F
G
H I
Isochron Age = 60.27 ± 1.30 Ma [40Ar/36Ar]i = 278.42 ± 108.22 MSWD = 0.101 Steps E through I with 71.1% of 39ArK
#86KD25
01AWS-39
hornblende Granodiorite
Cumulative % 39ArK Released 39Ar/40Ar
1000
100
10
Inverse-isotope correlation diagram 100
01AWS-39
biotite Granodiorite
K/Ca
#4KD25
A B C D E F G
Isochron Age = 60.93 ± 0.65 Ma
H I J
Plateau Age
Plateau Age = 61.38 ± 0.26 Ma
1
90 0.00048
80
70
60 0.00032
50
40
A
B
C D E
F G
HI J
Isochron Age = 60.93 ± 0.65 Ma [40Ar/36Ar]i = 623.01 ± 145.82 MSWD = 0.064 Steps C through J with 90.1% of 39ArK
#4KD25
01AWS-39
biotite Granodiorite
30 0.00016
20
10
0 0 0 20 40 60 80 100 0 0.02 0.04 0.06 0.08 0.10
Cumulative % 39ArK Released 39Ar/40Ar
36A
r/40
Ar
36A
r/40
Ar
Figure 8. 40Ar/39Ar age spectra and inverse-isotope correlation diagrams for sample 01AWS-39
Page 20 of 32
0.12

1A
ppar
ent A
ge (
Ma)
A
ppar
ent A
ge (
Ma)
Inverse-isotope correlation diagram 100
01AWS-49
volcanic matrix Andesite
K/Ca
#71KD25
A
B C D E F G
Isochron Age = 47.95 ± 1.39 Ma
H
Average Age
I
Average Age = 50.88 ± 0.22 Ma
0.1
90 0.0006
80
70
60 0.0004
50
40
30 0.0002
20
10
0 0
0 20 40 60 80 100 0 0.02 0.04 0.06 0.08 0.10 0.12 0.14
A
B
CDE FG
H
I
Isochron Age = 47.95 ± 1.39 Ma [40Ar/36Ar]i = 958.75 ± 218.93 MSWD = 1.172 Steps B through G with 75.6% of 39ArK
#71KD25
01AWS-49
volcanic matrix Andesite
Cumulative % 39ArK Released 39Ar/40Ar
10
1
Inverse-isotope correlation diagram100
01AWS-55
volcanic matrix Basalt
K/Ca
#67KD25
A B C D E F G
Isochron Age = 53.71 ± 0.61 Ma
H
Average Age
Average Age = 54.76 ± 0.23 Ma
0.1
90 0.003
80
70
60 0.002
50
40
30 0.001
20
10
0 0 0 20 40 60 80 100 0 0.02 0.04 0.06 0.08 0.10 0.12
A
B CDEFG
H
01AWS-55
volcanic matrix Basalt
Isochron Age = 53.71 ± 0.61 Ma [40Ar/36Ar]i = 731.13 ± 140.91 MSWD = 1.223 Steps B through G with 62.0% of 39ArK
#67KD25
Cumulative % 39ArK Released 39Ar/40Ar
36A
r/40
Ar
36A
r/40
Ar
Figure 9. 40Ar/39Ar age spectra and inverse-isotope correlation diagrams for samples 01AWS-49 and 01AWS-55
Page 21 of 32

1
0.1
Inverse-isotope correlation diagram 100
01AWS-60
volcanic matrix Basalt
K/Ca
#69KD25
A B C D E F G
Isochron Age = 44.38 ± 0.38 Ma
Average Age
Average Age = 45.11 ± 0.19 Ma
0.01 0.0003
90
80
70
0.0002 60
50
40
0.000130
20
10
0 0 0 20 40 60 80 100 0 0.03 0.06 0.09 0.12 0.15
A
B C
D EF
G
Isochron Age = 44.38 ± 0.38 Ma [40Ar/36Ar]i = 525.65 ± 37.23 MSWD = 0.564 Steps A through F with 69.7% of 39ArK
#69KD25
01AWS-60
volcanic matrix Basalt
Cumulative % 39ArK Released 39Ar/40Ar
1
0.1
Inverse-isotope correlation diagram 100
01AWS-64
hornblende Granite
K/Ca
#87KD25
ABC D E F G
Plateau Age = 64.20 ± 0.27 Ma
H I J
Plateau Age
0.01
90 0.00048
80
70
60 0.00032
50
40
30 0.00016
20
10
0 0 0 20 40 60 80 100 0 0.02 0.04 0.06 0.08 0.10
A
B C
D
E
F
G
H I
J
Isochron Age = 64.00 ± 2.01 Ma [40Ar/36Ar]i = 306.19 ± 106.08 MSWD = 0.123 Steps E through J with 85.1% of 39ArK
#87KD25
01AWS-64
hornblende Granite
Cumulative % 39ArK Released 39Ar/40Ar
App
aren
t Age
(M
a)
App
aren
t Age
(M
a)
36A
r/40
Ar
36A
r/40
Ar
Figure 10. 40Ar/39Ar age spectra and inverse-isotope correlation diagrams for samples 01AWS-60 and 01AWS-64
Page 22 of 32

1A
ppar
ent A
ge (
Ma)
A
ppar
ent A
ge (
Ma)
0.1
Inverse-isotope correlation diagram 100
01AWS-67
volcanic matrix Basalt
K/Ca
#73KD25
A B C D E F G
Isochron Age = 44.47 ± 0.41 Ma
H I
Average Age
Average Age = 45.47 ± 0.19 Ma
0.01
90 0.003
80
70
60 0.002
50
40
30 0.001
20
10
0 0 0 20 40 60 80 100 0 0.03 0.06 0.09 0.12 0.15
A
B
C DEFGH
I
Isochron Age = 44.47 ± 0.41 Ma [40Ar/36Ar]i = 465.12 ± 43.87 MSWD = 0.556 Steps C through H with 73.7% of 39ArK
#73KD25
01AWS-67
volcanic matrix Basalt
Cumulative % 39ArK Released 39Ar/40Ar
10
1
100
01AWS-67b
plagioclase Rhyolite
K/Ca
#77KD25
A B C D E F G
Plateau Age = 45.10 ± 0.19 Ma
H I J K L M
N Plateau Age
0.1
A
B
C
D
E F
G H I
J
K
L
M
N
Isochron Age = 44.80 ± 0.76 Ma [40Ar/36Ar]i = 391.36 ± 268.45 MSWD = 0.166 Steps C through L with 86.5% of 39ArK
#77KD25
01AWS-67b
plagioclase Rhyolite
Inverse-isotope correlation diagram
90
80
70 0.00008
60
50
40
0.00004 30
20
10
0 0 20 40 60 80 100 0
0 0.03 0.06 0.09 0.12 0.15
Cumulative % 39ArK Released 39Ar/40Ar
36A
r/40
Ar
36A
r/40
Ar
Figure 11. 40Ar/39Ar age spectra and inverse-isotope correlation diagrams for samples 01AWS-67 and 01AWS-67B
Page 23 of 32

1
Inverse-isotope correlation diagram 100
AL00
plagioclase Rhyolite
K/Ca
#79KD25
A B C D E F G
Average Age = 41.62 ± 0.18 Ma
H
Average Age
I J K L MN
0.1
90 0.0006
80
70
60 0.0004
50
40
30 0.0002
20
10
0 0 0 20 40 60 80 100 0 0.03 0.06 0.09 0.12 0.15
A
BC
D
E
F G
H
I
J
K L
M N
Isochron Age = 41.62 ± 0.32 Ma [40Ar/36Ar]i = 298.51 ± 27.8 MSWD = 0.255 Steps C through N with 85.2% of 39ArK
#79KD25
AL00
plagioclase Rhyolite
Cumulative % 39ArK Released 39Ar/40Ar
10000
1000
100
A
B
C D
EF GH
Isochron Age = 85.24 ± 1.26 Ma [40Ar/36Ar]i = 585.17 ± 122.48 MSWD = 0.454 Steps A through H with 100% of 39ArK
#21KD25
KEMUK
biotite Mafic Pegmatite
Inverse-isotope correlation diagram
140
120 0.00018
100
80 0.00012
60
40 0.00006
20
0
KEMUK
biotite Mafic Pegmatite
K/Ca
#21KD25
A B C D E F G
Average Age = 86.32 ± 0.36 Ma
H
Average Age
0 0 20 40 60 80 100 0 0.01 0.02 0.03 0.04 0.05 0.06 0.07 0.08
Cumulative % 39ArK Released 39Ar/40Ar
App
aren
t Age
(M
a)
App
aren
t Age
(M
a)
36A
r/40
Ar
36A
r/40
Ar
Figure 12. 40Ar/39Ar age spectra and inverse-isotope correlation diagrams for samples AL00 and KEMUK
Page 24 of 32
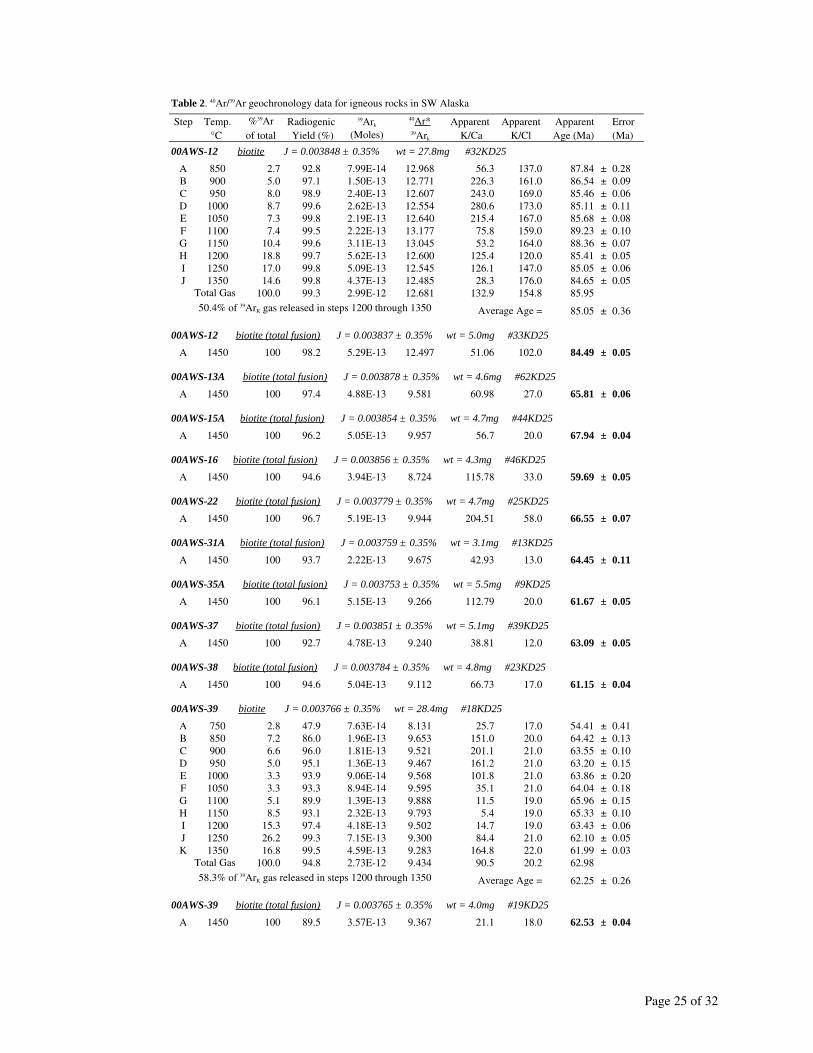
Table 2. 40Ar/39Ar geochronology data for igneous rocks in SW Alaska
Step Temp. %39Ar Radiogenic 39Ark 40Ar* Apparent Apparent Apparent Error
°C of total Yield (%) (Moles) 39Ark K/Ca K/Cl Age (Ma) (Ma)
00AWS-12 biotite J = 0.003848 ± 0.35% wt = 27.8mg #32KD25
A 850 2.7 92.8 7.99E-14 12.968 56.3 137.0 87.84 ± 0.28 B 900 5.0 97.1 1.50E-13 12.771 226.3 161.0 86.54 ± 0.09 C 950 8.0 98.9 2.40E-13 12.607 243.0 169.0 85.46 ± 0.06 D 1000 8.7 99.6 2.62E-13 12.554 280.6 173.0 85.11 ± 0.11 E 1050 7.3 99.8 2.19E-13 12.640 215.4 167.0 85.68 ± 0.08 F 1100 7.4 99.5 2.22E-13 13.177 75.8 159.0 89.23 ± 0.10 G 1150 10.4 99.6 3.11E-13 13.045 53.2 164.0 88.36 ± 0.07 H 1200 18.8 99.7 5.62E-13 12.600 125.4 120.0 85.41 ± 0.05 I 1250 17.0 99.8 5.09E-13 12.545 126.1 147.0 85.05 ± 0.06 J 1350 14.6 99.8 4.37E-13 12.485 28.3 176.0 84.65 ± 0.05
Total Gas 100.0 99.3 2.99E-12 12.681 132.9 154.8 85.95 50.4% of 39ArK gas released in steps 1200 through 1350 Average Age = 85.05 ± 0.36
00AWS-12 biotite (total fusion) J = 0.003837 ± 0.35% wt = 5.0mg #33KD25
A 1450 100 98.2 5.29E-13 12.497 51.06 102.0 84.49 ± 0.05
00AWS-13A biotite (total fusion) J = 0.003878 ± 0.35% wt = 4.6mg #62KD25
A 1450 100 97.4 4.88E-13 9.581 60.98 27.0 65.81 ± 0.06
00AWS-15A biotite (total fusion) J = 0.003854 ± 0.35% wt = 4.7mg #44KD25
A 1450 100 96.2 5.05E-13 9.957 56.7 20.0 67.94 ± 0.04
00AWS-16 biotite (total fusion) J = 0.003856 ± 0.35% wt = 4.3mg #46KD25
A 1450 100 94.6 3.94E-13 8.724 115.78 33.0 59.69 ± 0.05
00AWS-22 biotite (total fusion) J = 0.003779 ± 0.35% wt = 4.7mg #25KD25
A 1450 100 96.7 5.19E-13 9.944 204.51 58.0 66.55 ± 0.07
00AWS-31A biotite (total fusion) J = 0.003759 ± 0.35% wt = 3.1mg #13KD25
A 1450 100 93.7 2.22E-13 9.675 42.93 13.0 64.45 ± 0.11
00AWS-35A biotite (total fusion) J = 0.003753 ± 0.35% wt = 5.5mg #9KD25
A 1450 100 96.1 5.15E-13 9.266 112.79 20.0 61.67 ± 0.05
00AWS-37 biotite (total fusion) J = 0.003851 ± 0.35% wt = 5.1mg #39KD25
A 1450 100 92.7 4.78E-13 9.240 38.81 12.0 63.09 ± 0.05
00AWS-38 biotite (total fusion) J = 0.003784 ± 0.35% wt = 4.8mg #23KD25
A 1450 100 94.6 5.04E-13 9.112 66.73 17.0 61.15 ± 0.04
00AWS-39 biotite J = 0.003766 ± 0.35% wt = 28.4mg #18KD25
A 750 2.8 47.9 7.63E-14 8.131 25.7 17.0 54.41 ± 0.41 B 850 7.2 86.0 1.96E-13 9.653 151.0 20.0 64.42 ± 0.13 C 900 6.6 96.0 1.81E-13 9.521 201.1 21.0 63.55 ± 0.10 D 950 5.0 95.1 1.36E-13 9.467 161.2 21.0 63.20 ± 0.15 E 1000 3.3 93.9 9.06E-14 9.568 101.8 21.0 63.86 ± 0.20 F 1050 3.3 93.3 8.94E-14 9.595 35.1 21.0 64.04 ± 0.18 G 1100 5.1 89.9 1.39E-13 9.888 11.5 19.0 65.96 ± 0.15 H 1150 8.5 93.1 2.32E-13 9.793 5.4 19.0 65.33 ± 0.10 I 1200 15.3 97.4 4.18E-13 9.502 14.7 19.0 63.43 ± 0.06 J 1250 26.2 99.3 7.15E-13 9.300 84.4 21.0 62.10 ± 0.05 K 1350 16.8 99.5 4.59E-13 9.283 164.8 22.0 61.99 ± 0.03
Total Gas 100.0 94.8 2.73E-12 9.434 90.5 20.2 62.98 58.3% of 39ArK gas released in steps 1200 through 1350 Average Age = 62.25 ± 0.26
00AWS-39 biotite (total fusion) J = 0.003765 ± 0.35% wt = 4.0mg #19KD25
A 1450 100 89.5 3.57E-13 9.367 21.1 18.0 62.53 ± 0.04
Page 25 of 32

Table 2. 40Ar/39Ar geochronology data for igneous rocks in SW Alaska (continued).
Step Temp. %39Ar Radiogenic 39Ark 40Ar* Apparent Apparent Apparent Error
°C of total Yield (%) (Moles) 39Ark K/Ca K/Cl Age (Ma) (Ma)
01AH-59 biotite (total fusion) J = 0.003864 ± 0.35% wt = 3.7mg #50KD25
A 1450 100 97.4 3.98E-13 9.569 159.37 10.0 65.50 ± 0.05
01AH-62 biotite (total fusion) J = 0.003839 ± 0.35% wt = 5.5mg #27KD25
A 1450 100 97.3 4.97E-13 9.670 103.28 9.0 65.75 ± 0.03
01AH-63 biotite (total fusion) J = 0.003765 ± 0.35% wt = 4.0mg #15KD25
A 1450 100 96.0 3.93E-13 9.785 30.77 12.0 65.26 ± 0.06
01AH-64 biotite (total fusion) J = 0.003868 ± 0.35% wt = 4.3mg #58KD25
A 1450 100 93.6 4.15E-13 9.708 47.78 11.0 66.49 ± 0.07
01AH-65 hornblende J = 0.003918 ± 0.35% wt = 9.0mg #88KD25
A 800 6.6 69.1 1.39E-14 9.095 2.22 1.7 63.31 ± 0.27 B 900 14.5 92.4 3.06E-14 10.036 2.71 4.4 69.74 ± 0.13 C 1000 10.6 92.7 2.24E-14 9.744 1.93 5.1 67.75 ± 0.13 D 1100 6.9 84.7 1.47E-14 8.601 0.27 4.4 59.93 ± 0.17 E 1150 9.8 77.8 2.08E-14 8.563 0.09 2.7 59.67 ± 0.18 F 1175 10.1 86.5 2.15E-14 8.785 0.14 3.3 61.2 ± 0.15 G 1200 10.5 89.4 2.22E-14 8.78 0.33 4.8 61.16 ± 0.14 H 1250 15.2 93.7 3.21E-14 8.725 0.64 5.9 60.79 ± 0.11 I 1300 9 87 1.91E-14 8.693 0.45 0.8 60.56 ± 0.16 J 1350 6.8 80.9 1.44E-14 8.803 0.14 3.3 61.32 ± 0.19
62.92Total Gas
68.3% of 39ArK gas released in steps 1100 through 1350 Average Age =
01AH-67 hornblende J = 0.003918 ± 0.35% wt = 59.1mg #89KD25
60.7 ± 0.2
A 900 1.3 53.4 9.43E-15 9.023 0.46 2.2 62.82 ± 0.4 B 1000 0.8 67.7 6.08E-15 8.664 0.64 1.6 60.37 ± 0.38 C 1050 0.8 73.1 6.11E-15 8.723 0.57 1.8 60.77 ± 0.38 D 1075 0.6 74.3 4.20E-15 8.796 0.37 2.7 61.27 ± 0.45 E 1100 0.5 70 3.92E-15 8.446 0.2 5.1 58.88 ± 0.53 F 1125 0.6 68.6 4.70E-15 8.683 0.12 8.3 60.5 ± 0.41 G 1150 0.8 70.9 6.28E-15 8.877 0.11 8.9 61.83 ± 0.37 H 1175 1.2 70.2 9.38E-15 8.897 0.12 8.1 61.96 ± 0.32 I 1200 2.2 73.3 1.65E-14 8.894 0.13 7.9 61.95 ± 0.26 J 1225 4.9 81.3 3.69E-14 8.832 0.12 8.2 61.52 ± 0.16 K 1250 14.1 87.8 1.06E-13 8.8 0.12 8.2 61.3 ± 0.12 L 1275 22.5 92.5 1.69E-13 8.793 0.12 8.1 61.25 ± 0.1 M 1300 10.3 92.4 7.75E-14 8.801 0.13 7.9 61.31 ± 0.1 N 1350 37.7 93.1 2.84E-13 8.801 0.12 8.6 61.31 ± 0.09 O 1400 1.6 85.2 1.18E-14 8.751 0.11 9 60.97 ± 0.22
61.31Total Gas
89.5% of 39ArK gas released in steps 1225 through 1350 Plateau Age = 61.3 ± 0.2
01AH-69 biotite (total fusion) J = 0.003749 ± 0.35% wt = 4.4mg #2KD25
A 1450 100 97.1 3.98E-13 9.697 105.03 30.0 64.42 ± 0.04
Page 26 of 32

Table 2. 40Ar/39Ar geochronology data for igneous rocks in SW Alaska (continued).
Step Temp. %39Ar Radiogenic 39Ark 40Ar* Apparent Apparent Apparent Error
°C of total Yield (%) (Moles) 39Ark K/Ca K/Cl Age (Ma) (Ma)
01AH-70 K-feldspar J = 0.003895 ± 0.35% wt = 4.1mg #83KD25
A 800 1.5 84.9 5.00E-15 8.233 3.6 15.9 57.08 ± 0.27 B 900 4.9 95.7 1.65E-14 8.593 48.6 31.7 59.53 ± 0.13 C 950 5.1 98.2 1.71E-14 8.477 79.6 58.4 58.74 ± 0.12 D 1000 6.4 99 2.14E-14 8.465 98.4 77.6 58.66 ± 0.1 E 1050 7.7 98.7 2.59E-14 8.376 90.2 78.9 58.05 ± 0.1 F 1100 7.9 99 2.66E-14 8.374 87.7 79.6 58.04 ± 0.09 G 1150 7.6 98.6 2.57E-14 8.378 83.5 59.1 58.06 ± 0.1 H 1200 7.1 97.9 2.39E-14 8.38 93.4 34.9 58.08 ± 0.1 I 1215 4.3 97.6 1.44E-14 8.398 90.3 26.1 58.2 ± 0.13 J 1250 4.8 97.2 1.61E-14 8.464 70.2 19.7 58.65 ± 0.11 K 1275 4.9 96.8 1.66E-14 8.389 45.1 17.7 58.14 ± 0.12 L 1300 3.9 95.2 1.32E-14 8.427 50.5 5.7 58.4 ± 0.13 M 1350 9.6 95.5 3.23E-14 8.473 72.5 3.5 58.71 ± 0.1 N 1450 19.8 95 6.67E-14 8.476 80.7 17.7 58.73 ± 0.09 O 1550 4.4 91.2 1.48E-14 8.893 70.2 5.9 61.57 ± 0.14
Total Gas 58.59 89.1% of 39ArK gas released in steps 950 through 1450 Average Age = 58.40 ± 0.20
01AH-80 K-feldspar J = 0.003891 ± 0.35% wt = 4.7mg #81KD25
A 750 0.7 88.5 2.66E-15 8.253 25 11.8 57.16 ± 0.28 B 800 1.2 94.2 4.50E-15 8.517 40.7 19.9 58.96 ± 0.2 C 850 2 95.9 7.59E-15 8.469 39.8 30.7 58.64 ± 0.15 D 900 2.5 96.7 9.44E-15 8.396 41 44.2 58.14 ± 0.13 E 950 2.8 97.1 1.07E-14 8.388 40.2 53.4 58.08 ± 0.14 F 1000 3.4 97.5 1.28E-14 8.396 45.6 69.7 58.13 ± 0.11 G 1050 3.7 97.7 1.39E-14 8.419 40.4 68 58.29 ± 0.1 H 1100 4.2 98 1.58E-14 8.423 39 49.4 58.32 ± 0.1 I 1150 3.4 97.5 1.27E-14 8.427 36.6 24.5 58.35 ± 0.11 J 1200 3.1 96.4 1.17E-14 8.404 25.7 12.2 58.19 ± 0.12 K 1250 10.1 98.8 3.81E-14 8.392 22.2 24.3 58.11 ± 0.08 L 1300 17.4 98.4 6.59E-14 8.38 28 4.4 58.03 ± 0.07 M 1350 22.1 99 8.35E-14 8.412 32.9 19.3 58.25 ± 0.07 N 1450 14.1 99 5.36E-14 8.448 32.8 25.9 58.49 ± 0.07 O 1650 9.4 97.3 3.55E-14 8.457 30.2 19.1 58.55 ± 0.09
Total Gas 58.26 96.2% of 39ArK gas released in steps 900 through 1650 Average Age = 58.3 ± 0.2
01AH-83 muscovite J = 0.003891 ± 0.35% wt = 254.0mg #84KD25
A 850 1.2 89.8 3.93E-14 9.86 239.2 633 67.92 ± 0.32 B 900 2.1 90.5 6.64E-14 9.844 426.4 1032 67.81 ± 0.4 C 950 4.8 92.8 1.53E-13 9.825 1014.3 1812 67.68 ± 0.12 D 1000 22.2 98.2 7.17E-13 9.744 2448.8 62266 67.13 ± 0.05 E 1050 19.4 99.2 6.26E-13 9.748 2480.5 0 67.16 ± 0.04 F 1100 10.4 98.6 3.34E-13 9.758 1876.4 0 67.23 ± 0.04 G 1150 6.8 98.1 2.20E-13 9.746 1359.5 5789 67.14 ± 0.1 H 1200 6.9 98 2.24E-13 9.707 1319.7 3552 66.88 ± 0.11 I 1250 7.5 98.5 2.41E-13 9.741 1110.3 275 67.11 ± 0.07 J 1350 11.3 98.6 3.64E-13 9.769 1664.9 449 67.3 ± 0.05 K 1450 4.5 89 1.47E-13 9.757 1140.9 1079 67.22 ± 0.11 L 1650 2.9 79.6 9.23E-14 9.753 578.5 617 67.2 ± 0.36
Total Gas 100 97 3.22E-12 9.755 1804.5 14741.9 67.2 91.97% of 39ArK gas released in steps 1000 through 1650 Plateau Age = 67.18 ± 0.28
Page 27 of 32

Table 2. 40Ar/39Ar geochronology data for igneous rocks in SW Alaska (continued).
Step Temp. %39Ar Radiogenic 39Ark 40Ar* Apparent Apparent Apparent Error
°C of total Yield (%) (Moles) 39Ark K/Ca K/Cl Age (Ma) (Ma)
01AH-85A hornblende J = 0.003922 ± 0.35% wt = 180.0mg #92KD25
A 900 1.3 72.5 4.82E-14 10.194 B 1000 1.9 88.4 6.82E-14 10.565 C 1050 1.8 95.9 6.57E-14 11.141 D 1100 3.5 94.9 1.27E-13 11.208 E 1150 9.5 95.4 3.44E-13 11.063 F 1175 23.6 96 8.52E-13 10.916 G 1200 18.3 97.6 6.61E-13 10.867 H 1225 9.2 97.9 3.32E-13 10.831 I 1250 4.7 97.1 1.71E-13 10.783 J 1275 8.8 97.5 3.17E-13 10.837 K 1300 13.1 97.8 4.72E-13 10.886 L 1400 4.4 97.1 1.60E-13 10.872
Total Gas 100 96.4 3.62E-12 10.892 82.0% of 39ArK gas released in steps 1175 through 1400
1.12 86 70.72 ± 0.46 1.16 138 73.25 ± 0.32 0.68 96 77.16 ± 0.35 0.3 36 77.61 ± 0.12 0.2 22 76.62 ± 0.13
0.16 18 75.63 ± 0.11 0.19 20 75.29 ± 0.08 0.2 23 75.05 ± 0.16
0.19 22 74.72 ± 0.17 0.19 23 75.09 ± 0.06 0.19 22 75.43 ± 0.1 0.18 20 75.33 ± 0.2 0.23 25.6 75.47
Average Age = 75.22 ± 0.32
wt = 4.5mg #29KD25
145.53 33.0 59.25 ± 0.05
wt = 4.6mg #41KD25
76.13 18.0 61.28 ± 0.05
wt = 3.7mg #54KD25
35.8 13.0 61.30 ± 0.05
wt = 4.8mg #42KD25
14.07 13.0 61.64 ± 0.05
wt = 4.5mg #31KD25
94.84 15.0 61.26 ± 0.05
01AM-109A
A 1450
01APC-18
A 1450
01APC-20
A 1450
01APC-23
A 1450
01APC-25
A 1450
01AWS-2
A 900 B 1000 C 1050 D 1100 E 1150 F 1175 G 1200 H 1225 I 1250 J 1275 K 1300
biotite (total fusion)
100 95.6
biotite (total fusion)
100 97.6
biotite (total fusion)
100 95.7
biotite (total fusion)
100 96.7
biotite (total fusion)
100 95.1
J = 0.003832 ± 0.35%
4.17E-13 8.714
J = 0.003854 ± 0.35%
5.20E-13 8.965
J = 0.003869 ± 0.35%
3.67E-13 8.933
J = 0.003853 ± 0.35%
4.95E-13 9.022
J = 0.003848 ± 0.35%
4.39E-13 8.977
hornblende J = 0.003917 ± 0.35% wt = 150.4mg #93KD25
4.0 92.8 6.43E-14 10.7350 1.22 68.0 74.30 ± 0.39 4.8 91.7 7.66E-14 9.5510 0.52 59.0 66.26 ± 0.23 4.1 91.6 6.50E-14 9.1970 0.20 36.0 63.85 ± 0.48 7.5 92.4 1.20E-13 9.8060 0.27 35.0 67.99 ± 0.27 8.9 94.1 1.42E-13 9.4710 0.36 40.0 65.72 ± 0.16 5.3 91.0 8.48E-14 9.1440 0.16 29.0 63.49 ± 0.28 9.3 92.3 1.48E-13 9.2210 0.12 30.0 64.01 ± 0.24
12.4 93.5 1.98E-13 9.1800 0.11 25.0 63.73 ± 0.19 10.5 94.4 1.67E-13 9.1870 0.11 34.0 63.78 ± 0.21 12.5 93.9 1.99E-13 9.1880 0.10 33.0 63.78 ± 0.23 20.7 93.8 3.29E-13 9.1850 0.10 33.0 63.76 ± 0.10
Total Gas 100.0 93.3 1.59E-12 9.3390 0.21 35.2 64.81
70.67% of 39ArK gas released in steps 1175 through 1300 Plateau Age = 63.77 ± 0.27
01AWS-24 biotite (total fusion) J = 0.003874 ± 0.35% wt = 4.2mg #66KD25
A 1450 100 96.7 4.29E-13 8.981 44.98 13.0 61.70 ± 0.06
Page 28 of 32

Table 2. 40Ar/39Ar geochronology data for igneous rocks in SW Alaska (continued).
Step Temp. %39Ar Radiogenic 39Ark 40Ar* Apparent Apparent Apparent Error
°C of total Yield (%) (Moles) 39Ark K/Ca K/Cl Age (Ma) (Ma)
01AWS-39 hornblende J = 0.003883 ± 0.35% wt = 150.3mg #86KD25
A 1000 3.3 87.3 6.78E-14 9.165 1.26 9.0 63.08 ± 0.30 B 1050 3.1 91.4 6.36E-14 9.088 0.53 3.0 62.56 ± 0.44 C 1100 5.6 89.4 1.14E-13 9.035 0.27 2.0 62.21 ± 0.26 D 1150 16.9 92.4 3.46E-13 8.805 0.17 2.0 60.65 ± 0.08 E 1175 19.9 93.9 4.07E-13 8.704 0.16 2.0 59.97 ± 0.08 F 1200 17.6 96.1 3.60E-13 8.720 0.16 3.0 60.07 ± 0.08 G 1225 7.0 95.1 1.42E-13 8.741 0.19 3.0 60.21 ± 0.19 H 1250 6.1 93.0 1.25E-13 8.683 0.20 3.0 59.82 ± 0.30 I 1300 20.5 93.9 4.19E-13 8.750 0.16 2.0 60.28 ± 0.12
Total Gas 100.0 93.5 2.04E-12 8.780 0.22 2.7 60.48
71.08% of 39ArK gas released in steps 1175 through 1300 60.07 ± 0.25Plateau Age =
01AWS-39 biotite J = 0.003750 ± 0.35% wt = 17.9mg #4KD25
A 850 3.6 85.4 6.39E-14 9.669 93.1 11.0 64.25 ± 0.23 B 900 6.4 96.0 1.15E-13 9.387 207.5 12.0 62.41 ± 0.21 C 950 7.9 98.6 1.42E-13 9.322 161.4 12.0 61.99 ± 0.20 D 1000 6.5 99.0 1.16E-13 9.308 162.5 12.0 61.90 ± 0.23 E 1050 5.2 97.9 9.42E-14 9.363 47.6 12.0 62.25 ± 0.16 F 1100 5.9 96.0 1.06E-13 9.625 14.3 10.0 63.97 ± 0.18 G 1150 10.9 97.1 1.96E-13 9.421 9.7 11.0 62.64 ± 0.10 H 1200 27.4 98.9 4.93E-13 9.234 122.2 12.0 61.41 ± 0.04 I 1250 20.3 99.4 3.66E-13 9.219 394.9 12.0 61.31 ± 0.06 J 1350 6.0 99.2 1.07E-13 9.239 415.0 13.0 61.44 ± 0.20
100.0 97.9 1.80E-12 9.318 182.7 11.7 61.96Total Gas
53.7% of 39ArK gas released in steps 1200 through 1350 61.38 ± 0.26Plateau Age =
01AWS-39 biotite (total fusion) J = 0.003745 ± 0.35% wt = 3.4mg #5KD25
A 1450 100 95.8 3.57E-13 9.199 59.9 11.0 61.10 ± 0.09
01AWS-41 biotite (total fusion) J = 0.003873 ± 0.35% wt = 4.9mg #64KD25
A 1450 100 97.1 4.82E-13 8.792 182.22 23.0 60.41 ± 0.06
01AWS-46 biotite (total fusion) J = 0.003746 ± 0.35% wt = 4.0mg #3KD25
A 1450 100 92.9 1.98E-13 9.985 8.79 7.0 66.24 ± 0.08
01AWS-48 biotite (total fusion) J = 0.003764 ± 0.35% wt = 3.1mg #17KD25
A 1450 100 95.8 3.12E-13 9.856 89.06 11.0 65.72 ± 0.04
01AWS-49 volcanic matrix J = 0.003809 ± 0.35% wt = 259.7mg #71KD25
A 750 3.0 82.0 1.18E-13 6.658 0.90 190 45.18 ± 0.29 B 850 9.5 94.6 3.73E-13 7.899 0.84 402 53.48 ± 0.10 C 900 9.6 96.9 3.76E-13 7.875 0.58 567 53.32 ± 0.11 D 950 11.9 97.2 4.64E-13 7.654 0.33 544 51.85 ± 0.10 E 1000 11.9 97.5 4.64E-13 7.508 0.29 423 50.87 ± 0.17 F 1050 10.1 97.5 3.97E-13 7.452 0.36 266 50.49 ± 0.12 G 1150 22.6 97.7 8.85E-13 7.337 0.65 130 49.72 ± 0.05 H 1450 19.4 94.6 7.59E-13 7.103 0.21 95 48.16 ± 0.05 I 1650 1.9 92.6 7.57E-14 7.157 0.16 155 48.52 ± 0.52
100.0 96.1 3.91E-12 7.442 0.47 291 50.43Total Gas
75.6% of 39ArK gas released in steps 850 through 1150 Average Age = 50.88 ± 0.22
01AWS-50 biotite (total fusion) J = 0.003761 ± 0.35% wt = 4.5mg #7KD25
A 1450 100 91.0 4.18E-13 9.160 37.64 11.0 61.11 ± 0.07
Page 29 of 32

Table 2. 40Ar/39Ar geochronology data for igneous rocks in SW Alaska (continued).
Step Temp. %39Ar Radiogenic 39Ark 40Ar* Apparent Apparent Apparent Error
°C of total Yield (%) (Moles) 39Ark K/Ca K/Cl Age (Ma) (Ma)
01AWS-55 volcanic matrix J = 0.003811 ± 0.35% wt = 247.2mg #67KD25
A 750 1.4 61.9 7.74E-14 8.342 0.38 32.0 56.46 ± 0.49 B 850 5.7 95.5 3.17E-13 8.415 0.73 693.0 56.95 ± 0.12 C 900 6.4 98.7 3.59E-13 8.278 0.99 13823.0 56.04 ± 0.09 D 950 10.3 99.3 5.75E-13 8.124 1.09 0.0 55.00 ± 0.08 E 1000 11.0 99.1 6.15E-13 8.016 0.96 18636.0 54.29 ± 0.07 F 1050 10.5 98.9 5.88E-13 7.980 0.65 3132.0 54.05 ± 0.06 G 1150 18.2 98.7 1.02E-12 7.970 0.67 962.0 53.98 ± 0.15 H 1450 36.6 88.5 2.05E-12 7.696 0.26 229.0 52.15 ± 0.10
Total Gas 100.0 94.4 5.60E-12 7.942 0.61 3558.3 53.79 62.0% of 39ArK gas released in steps 850 through 1150 Average Age = 54.76 ± 0.23
01AWS-57 biotite (total fusion) J = 0.003868 ± 0.35% wt = 4.6mg #52KD25
A 1450 100 94.4 4.66E-13 8.976 23.16 23.0 61.57 ± 0.06
01AWS-59 biotite (total fusion) J = 0.003771 ± 0.35% wt = 4.6mg #56KD25
A 1450 100 96.2 4.76E-13 9.221 64.54 19.0 61.65 ± 0.05
01AWS-60 volcanic matrix J = 0.003814 ± 0.35% wt = 264.0mg #69KD25
A 850 5.4 91.4 1.92E-13 7.024 0.28 779 47.69 ± 0.18 B 900 7.1 95.6 2.51E-13 6.857 0.44 2246 46.57 ± 0.19
950 10.7 96.2 3.80E-13 6.711 0.59 4017 45.60 ± 0.12 D 1000 12.8 97.5 4.55E-13 6.679 0.47 5601 45.38 ± 0.09 E 1050 13.7 97.8 4.88E-13 6.646 0.36 2921 45.16 ± 0.08 F 1150 20.1 98.0 7.13E-13 6.586 0.37 1460 44.75 ± 0.07 G 1450 30.3 94.2 1.08E-12 6.247 0.08 214 42.48 ± 0.10
100.0 96.0 3.56E-12 6.560 0.32 2105 44.58Total Gas
57.3% of 39ArK gas released in steps 950 through 1150 Average Age = 45.11 ± 0.19
01AWS-61 biotite (total fusion) J = 0.003849 ± 0.35% wt = 5.1mg #35KD25
A 1450 100 96.0 4.96E-13 8.689 95.69 35.0 59.34 ± 0.03
01AWS-64 hornblende J = 0.003882 ± 0.35% wt = 162.2mg #87KD25
A 1000 2.5 85.2 3.83E-14 10.219 0.64 28.0 70.18 ± 0.59 B 1050 2.5 92.1 3.86E-14 9.883 0.86 30.0 67.92 ± 0.52 C 1100 3.3 93.0 5.11E-14 9.948 0.65 24.0 68.36 ± 0.41 D 1150 6.6 93.7 1.01E-13 9.641 0.40 16.0 66.29 ± 0.24 E 1175 5.5 92.0 8.47E-14 9.404 0.23 16.0 64.68 ± 0.35 F 1200 6.6 89.5 1.02E-13 9.321 0.12 20.0 64.12 ± 0.33 G 1225 11.2 91.2 1.73E-13 9.319 0.10 24.0 64.11 ± 0.21 H 1250 17.9 94.1 2.76E-13 9.344 0.10 26.0 64.28 ± 0.10 I 1300 40.1 93.9 6.19E-13 9.315 0.10 30.0 64.08 ± 0.12 J 1400 3.9 91.7 5.98E-14 9.263 0.08 29.0 63.73 ± 0.48
100.0 92.8 1.54E-12 9.403 0.18 26.1 64.68Total Gas
85.14% of 39ArK gas released in steps 1175 through 1400 64.20 ± 0.27Plateau Age =
01AWS-67 volcanic matrix J = 0.003911 ± 0.35% wt = 263.4mg #73KD25
A 650 2.9 36.5 1.10E-13 6.454 0.24 30.0 44.97 ± 0.37 B 750 4.0 72.3 1.52E-13 6.885 0.32 204.0 47.94 ± 0.32 C 850 8.9 90.3 3.38E-13 6.789 0.42 1204.0 47.28 ± 0.15 D 900 19.2 94.4 7.29E-13 6.613 0.55 3512.0 46.06 ± 0.07 E 950 16.5 96.4 6.26E-13 6.509 0.46 4873.0 45.35 ± 0.07 F 1000 5.6 97.8 2.13E-13 6.463 0.45 3515.0 45.03 ± 0.18 G 1050 8.4 98.3 3.19E-13 6.542 0.39 3238.0 45.58 ± 0.11 H 1150 15.2 97.7 5.79E-13 6.390 0.37 1516.0 44.53 ± 0.07 I 1450 19.4 91.1 7.40E-13 5.873 0.06 191.0 40.97 ± 0.17
100.0 92.2 3.81E-12 6.426 0.36 2326.2 44.78Total Gas
73.7% of 39ArK gas released in steps 850 through 1150 Average Age = 45.47 ± 0.19
Page 30 of 32
C

Table 2. 40Ar/39Ar geochronology data for igneous rocks in SW Alaska (continued).
Step Temp. %39Ar Radiogenic 39Ark 40Ar* Apparent Apparent Apparent Error
°C of total Yield (%) (Moles) 39Ark K/Ca K/Cl Age (Ma) (Ma)
01AWS-67B plagioclase J = 0.003909 ± 0.35% wt = 262.0mg #77KD25
A 850 2.7 97.0 8.94E-14 6.634 B 950 7.3 97.8 2.40E-13 6.653 C 1000 5.8 97.4 1.91E-13 6.474 D 1050 7.5 98.2 2.47E-13 6.486 E 1100 9.6 98.7 3.16E-13 6.501 F 1150 11.5 98.6 3.75E-13 6.464 G 1200 12.7 98.7 4.17E-13 6.467 H 1250 12.2 98.9 3.98E-13 6.467 I 1300 10.6 98.8 3.47E-13 6.462 J 1350 7.4 98.1 2.43E-13 6.423 K 1400 5.1 97.3 1.67E-13 6.420 L 1450 4.0 98.1 1.31E-13 6.507 M 1500 2.2 97.2 7.22E-14 6.462 N 1550 1.2 97.8 4.03E-14 6.630
Total Gas 100.0 98.3 3.27E-12 6.487 70.0% of 39ArK gas released in steps 1000 through 1300
01AWS-78 biotite (total fusion) J = 0.003850 ± 0.35%
A 1450 100 96.4 3.76E-13 8.918
01AWS-80 biotite (total fusion) J = 0.003860 ± 0.35%
A 1450 100 96.9 4.42E-13 9.003
99AM-309C biotite (total fusion) J = 0.003871 ± 0.35%
A 1450 100 93.9 4.07E-13 10.043
99AWS-17 biotite (total fusion) J = 0.003752 ± 0.35%
A 1450 100 90.4 4.21E-13 10.191
2.20 813.0 46.19 ± 0.32 0.87 2302.0 46.32 ± 0.10 0.57 1636.0 45.09 ± 0.16 0.49 2811.0 45.17 ± 0.17 0.46 4158.0 45.27 ± 0.08 0.44 3964.0 45.02 ± 0.10 0.44 3678.0 45.04 ± 0.08 0.45 132.0 45.04 ± 0.10 0.45 2027.0 45.01 ± 0.09 0.41 1428.0 44.73 ± 0.16 0.38 929.0 44.71 ± 0.15 0.43 1828.0 45.31 ± 0.22 0.44 1671.0 45.01 ± 0.44 0.45 1063.0 46.16 ± 0.67 0.53 2329.4 45.18
Plateau Age = 45.1 ± 0.19
wt = 3.8mg #38KD25
142.7 13.0 60.90 ± 0.04
wt = 4.5mg #48KD25
52.25 17.0 61.63 ± 0.05
wt = 4.3mg #60KD25
48.74 23.0 68.80 ± 0.07
wt = 4.9mg #11KD25
37.19 17.0 67.69 ± 0.04
AL00 plagioclase J = 0.003911 ± 0.35% wt = 204.7mg #79KD25
A 950 5.6 94.2 8.28E-14 6.149 0.27 798.0 42.87 ± 0.32 B 1000 9.2 97.0 1.35E-13 6.055 0.24 2864.0 42.22 ± 0.23 C 1050 10.9 96.3 1.59E-13 5.943 0.21 2445.0 41.45 ± 0.11 D 1100 12.4 96.8 1.82E-13 5.920 0.19 2714.0 41.30 ± 0.10 E 1150 13.7 93.8 2.01E-13 6.000 0.17 1106.0 41.85 ± 0.10 F 1200 13.9 97.6 2.03E-13 6.022 0.17 1587.0 42.00 ± 0.14 G 1250 9.7 96.4 1.42E-13 6.004 0.18 64.0 41.87 ± 0.15 H 1300 4.4 91.7 6.45E-14 5.973 0.20 201.0 41.66 ± 0.41 I 1350 1.8 86.0 2.61E-14 5.891 0.17 126.0 41.10 ± 0.77 J 1400 4.1 89.0 5.95E-14 5.982 0.15 565.0 41.72 ± 0.49 K 1450 5.2 86.6 7.61E-14 5.933 0.14 877.0 41.38 ± 0.17 L 1500 4.1 85.4 6.03E-14 5.944 0.14 694.0 41.46 ± 0.51 M 1550 2.9 81.7 4.19E-14 5.999 0.14 475.0 41.84 ± 0.58 N 1600 2.3 81.7 3.40E-14 6.033 0.14 503.0 42.07 ± 0.67
Total Gas 100.0 93.8 1.47E-12 5.992 0.19 1420.6 41.79 85.2% of 39ArK gas released in steps 1050 through 1600 Average Age = 41.62 ± 0.18
KEMUK biotite J = 0.003783 ± 0.35%
A 950 1.9 93.7 2.13E-14 B 1000 7.4 95.6 8.23E-14 C 1050 13.8 98.4 1.54E-13 D 1100 14.6 98.7 1.64E-13 E 1150 14.8 98.2 1.66E-13 F 1200 15.6 97.8 1.75E-13 G 1250 19.9 97.7 2.22E-13 H 1350 12.1 97.5 1.35E-13
Total Gas 100.0 97.8 1.12E-12
wt = 10.5mg #21KD25
13.581 180.9 143.0 90.38 ± 0.87 13.481 608.1 169.0 89.73 ± 0.30 13.240 932.2 184.0 88.17 ± 0.13 13.162 934.6 183.0 87.66 ± 0.11 13.035 648.5 181.0 86.83 ± 0.15 12.942 1024.9 181.0 86.23 ± 0.16 12.903 972.4 73.0 85.98 ± 0.13 12.970 722.8 172.0 86.41 ± 0.18 13.077 849.7 157.4 87.10
62.3% of 39ArK gas released in steps 1150 through 1350 Average Age = 86.32 ± 0.36
Page 31 of 32

Table 2. 40Ar/39Ar geochronology data for igneous rocks in SW Alaska (continued).
Step Temp. %39Ar Radiogenic 39Ark 40Ar* Apparent Apparent Apparent Error
°C of total Yield (%) (Moles) 39Ark K/Ca K/Cl Age (Ma) (Ma)
KEMUK biotite (total fusion) J = 0.003784 ± 0.35% wt = 5.1mg #20KD25
A 1450 100 96.0 5.27E-13 12.913 554.3 93.0 86.05 ± 0.08
Ages calculated assuming an initial 40Ar/36Ar = 295.5± 0.All precision estimates are at the one sigma level of precision.Ages of individual steps do not include error in the irradiation parameter J.No error is calculated for the total gas age.
Page 32 of 32